

Abstract
When ambiguous visual stimuli have multiple interpretations, human perception can alternate between them, producing perceptual multistability. There is a large variation between individuals in how long stable percepts endure, on average, between switches, but the underlying neural basis of this individual difference in perceptual dynamics remains obscure. Here, we show that in one widely studied multistable paradigm–binocular rivalry–perceptual stability in individuals is predicted by the frequency of their neural oscillations within the alpha range (7–13 Hz). Our results suggest revising models of rivalry to incorporate effects of neural oscillations on perceptual alternations, and raise the possibility that a common factor may influence dynamics in many neural processes.
Keywords: bistable perception, cognitive dynamics, electroencephalography, peak alpha frequency, visual perception
1. INTRODUCTION
When multiple perceptual interpretations of ambiguous sensory information are valid, the visual system sometimes alternates between them. Familiar examples of such alternations include Rubin's face‐vase, and the Necker cube.
The average amount of time the perceptual system spends on one interpretation before switching to another is known to be relatively consistent within individuals, and highly variable across them, with differences ranging an order of magnitude (Aafjes, Hueting, & Visser, 1966). We will refer to this quantity as perceptual stability duration, and its inverse as perceptual alternation rate.
Relatively little is known about the neural bases for these individual differences (Kleinschmidt, Sterzer, & Rees, 2012). A few studies using structural and functional magnetic resonance imaging have examined brain regions underlying individual differences in perceptual stability (Kanai, Bahrami, & Rees, 2010; Watanabe, Masuda, Megumi, Kanai, & Rees, 2014; Yamashiro et al., 2014). However, despite perceptual durations being a time‐domain measure, little is known about how they relate to dynamic neural processes.
Here, we tested whether stability durations can be predicted from general properties of brain dynamics (as opposed to task‐specific activity), indexed by ongoing signals measured with electroencephalography (EEG). We studied binocular rivalry, which occurs when the two eyes receive conflicting images, and perception alternates between them. Compared to other bistable stimuli, binocular rivalry alternations are relatively automatic and weakly affected by top‐down control (Meng & Tong, 2004), making them a good paradigm for studying intrinsic factors governing perceptual stability durations.
Ongoing EEG activity has several features that serve as markers of neural dynamics, most easily viewed in the frequency domain. The first major feature is a relationship between energy in the EEG signal and temporal frequency. Energy falls off rapidly as a function of frequency and can be characterized by the power‐law equation E(f) = 1/f χ (Freeman & Zhai, 2009; He, 2014; He, Zempel, Snyder, & Raichle, 2010; Pereda, Gamundi, Rial, & González, 1998), where E is energy as a function of frequency f. The exponent χ represents the rate of energy fall‐off, and can be obtained as the slope of the log‐transformed frequency spectrum.
The steepness of this frequency‐spectrum slope has been related to states of arousal (Freeman & Zhai, 2009; Pereda et al., 1998), visuomotor behavior (Podvalny et al., 2015) and improved cognitive performance in younger adults compared to older (Voytek et al., 2015). Neurophysiologically, a flatter slope may indicate a larger amount of desynchronized activity, which will produce energy at a broad range of frequencies. Such desynchronization has been hypothesized to arise from uncorrelated noise in individual neurons (Podvalny et al., 2015; Voytek & Knight, 2015) though it may also be functionally relevant as “scale‐free” activity (He et al., 2010). Models of rivalry predict that higher levels of noise should produce more rapid alternations between perceptual states (Brascamp, van Ee, Noest, Jacobs, & van den Berg, 2006; Kim, Grabowecky, & Suzuki, 2006). We predicted that individuals with flatter slopes would have shorter perceptual stability durations.
The second major feature in resting state EEG is alpha oscillations. A large body of literature has shown that the amplitude of alpha is highest during an eyes‐closed or relaxed awake state and reduces as one engages in attention‐demanding tasks (for reviews, see, Klimesch, Sauseng, & Hanslmayr, 2007; Pfurtscheller, Stancak, & Neuper, 1996). Moreover, higher alpha amplitude has been related to the greater inhibitory processing (Händel, Haarmeier, & Jensen, 2010; Klimesch et al., 2007; Mathewson et al., 2011). In the context of binocular rivalry, greater inhibition of the suppressed image would prolong perceptual stability of the currently dominant one (e.g., van Loon et al., 2013). We accordingly hypothesized that individuals with higher alpha amplitudes would experience longer perceptual stability durations.
A third feature that varies between individuals is the frequency of alpha oscillations. This frequency sometimes predicts the frequency of other neural oscillations (Klimesch, 1999), and could potentially serve as a common oscillator/clock controlling alternation rate of bistable perception (Carter & Pettigrew, 2003). Recent studies have shown that perceptual awareness is modulated by alpha phase (Busch, Dubois, & VanRullen, 2009; Landau & Fries, 2012), suggesting that alpha may represent “sampling” or temporal modulation of perceptual interpretations (Jensen, Gips, Bergmann, & Bonnefond, 2014; VanRullen & Koch, 2003). Accordingly, we hypothesized that individuals with higher alpha frequencies would have shorter stable percept durations during rivalry.
2. MATERIALS AND METHODS
2.1. Participants
One hundred and twenty participants who reported having normal or corrected‐to‐normal visual acuity and were naïve to binocular rivalry paradigms were initially enrolled, out of which 35 were excluded after preliminary testing. Participants were included based on three criteria. First, participants were required to have normal stereo vision, as measured by the ability to fuse random dot stereograms. Second, we included only participants who showed normal binocular rivalry, as measured by the ability to perceive alternations in four 1‐min practice runs of the binocular rivalry task.
Finally, there can be a large individual variation in how much each of the two eyes contributes to dominance. Some individuals possess a highly dominant eye for which perceptual durations are much longer duration than those for the weaker eye (Dieter, Sy, & Blake, 2017). Such unequal dominance likely arises due to various factors at early stages of visual processing, and may make it difficult to characterize cortical contributions to dominance duration. Accordingly, we excluded individuals whose dominance duration ratio (dominant eye duration over other eye duration) was greater than 1.5 in practice rivalry runs.
Eighty‐five individuals (63 females) completed the full experiment. On one participant, we were not able to collect EEG data due to technical difficulties. Four additional participants had imbalanced dominance ratios above 1.5 during the experimental runs; we also discarded these participants from analysis bringing our effective sample‐size to 80 individuals.
In order to aid statistical reliability, we tested subjects in two groups:
An initial set of twenty‐one participants formed a preliminary “exploratory” sample. This sample was used to develop hypotheses to test in our larger sample. They also underwent the identical protocol in a second session (on a different day), which was used to assess the reliability of our measures.
Fifty‐nine participants formed a “validation” sample, and went through the protocol only once.
Upon arrival, all participants provided written informed consent, according to an experimental protocol approved by the University of Minnesota Institutional Review Board. All experimental procedures were performed according to the approved protocol.
2.2. Display and stimuli
Stimuli were generated using the Psychophysics toolbox (PTB‐3) (Brainard, 1997; Kleiner et al., 2007; Pelli, 1997) in MATLAB (The MathWorks Inc., Natick, MA), and were presented on an ASUS VG248 monitor (refresh rate 144 Hz). The monitors' luminance gamma curves were measured using a Photo Research PR‐655 and linearized in software to ensure correct display of stimulus intensity. Subjects viewed all stimuli through a custom‐built mirror stereoscope.
Subjects viewed orthogonal gray scale gratings (±45°; contrast = 0.5; circular aperture with radius = 1.1°) dichoptically through the mirror stereoscope. The gratings alternated with a mean gray field at 14.4 Hz in one eye and 18 Hz in the other (frequencies counterbalanced between the eyes across runs) to induce steady‐state visually evoked potentials (Brown & Norcia, 1997; Katyal, Engel, He, & He, 2016; Zhang, Jamison, Engel, He, & He, 2011), which will be reported in a future manuscript.
2.3. Procedures
Each experimental session started with a 10‐min block where we measured each participant's resting‐state EEG, known from hereon as rest. Participants were instructed to keep their eyes closed while staying awake.
Next, in two 2‐min runs (plus two more following the rivalry task), participants performed a simple fixation task while we obtained a measure of their eyes‐open EEG, known from hereon as fixation. For the fixation task, the participants were asked to keep their gaze stable using a dot at the center of the screen, and perform a luminance detection task where the color of the fixation dot occasionally changed from light to dark blue (67% increment in the intensity of the blue gun) for 0.5 s randomly with a mean and minimum gap between fixation‐color‐change trials of 10 and 4 s, respectively. The task was performed at near ceiling accuracy (mean and SD across participants = 94 ± 2%).
Each participant then underwent twelve 2‐min runs of the binocular rivalry task. Participants pressed one of three buttons to report if they perceived +45° (right eye), −45° (left eye), or mixed gratings (Figure 1a). Because different individuals can have different criteria for deciding between dominant and mixed percepts, we asked them to report dominance if one or the other gratings filled >90% of the stimulus field and mixed otherwise. Participants were instructed to press a key when their perception switched to a new state (either dominant or mixed). They were also instructed that if they were not sure the button for the current percept got depressed adequately, it was acceptable to press the same button more than once.
Figure 1.

(a) Stimuli used in the experiment: gratings oriented at +45 and −45° from the vertical presented to the left and right eyes respectively. (b) Histogram of the mean stable percept durations across the participants included in the study (N = 80; mean = 2.49 s, SE of the mean = 0.10 s)
2.4. EEG data acquisition
EEG data were acquired using an ANT (Advanced Neuro Technology, The Netherlands) system at a sampling frequency of 1,024 Hz with 34 channels in 10/20 configuration (Fp1, Fpz, Fp2, F7, F3, Fz, F4, F8, FC5, FC2, FC6, T7, C3, Cz, C4, T8, CP5, CP1, CP2, CP6, P7, P3, Pz, P4, P8, POz, O1, Oz, O2, PO3, PO4, PO7, PO8). Each channel was adjusted to have impedance below 15 kΩ before beginning the experiment.
2.5. Binocular rivalry behavioral analysis
For each participant, we calculated the durations between reported perceptual transitions and averaged them according to the three percepts: +45°, −45°, or mixed gratings. To calculate mean perceptual stability durations, we averaged all durations over which participants reported complete eye dominance, that is, +45° and −45°.
For analyses to control for response variability, we also calculated percept stability durations starting from beginning of one dominant percept to the beginning of the next dominant percept, thus including the mixed state with the previous dominant one (Brascamp, Becker, & Hambrick, 2018). When calculating this measure, some participants who occasionally reported exceedingly long periods of mixed perception ended up having a large number of outliers in their durations. We therefore calculated the stable percept duration by averaging durations within 3 SD from the mean for each subject.
2.6. EEG analysis
Analysis was conducted using EEGLAB (Delorme & Makeig, 2004) and customized MATLAB code. Raw EEG data were first downsampled to 360 Hz then band‐pass filtered between 0.1 and 179 Hz as well as notch filtered with a 1 Hz bandwidth to exclude electrical line noise and its first harmonic at 60 and 120 Hz, respectively. Independent component analysis implemented in EEGLAB was used to remove ocular and muscle artifact (Delorme, Sejnowski, & Makeig, 2007). EEG data were then current‐source‐density‐transformed using the Current Source Density (CSD) toolbox (Kayser & Tenke, 2006a; Kayser & Tenke, 2006b; Perrin, Pernier, Bertrand, & Echallier, 1989), which has been shown to improve the specificity (and thus spatial resolution) of the EEG signal (Kayser & Tenke, 2015; Nunez & Srinivasan, 2006). All subsequent analyses were done on this CSD‐transformed data.
Three dependent measures of EEG, defined in the following paragraphs were calculated over 2‐min epochs. The four fixation runs were already 2 min in length, and the 10 min eyes‐closed run was divided into five 2‐min epochs. We also calculated our dependent measures during the rivalry task runs. As our stimuli were flickering at 14.4 and 18 Hz to induce steady‐state visually evoked potentials, they also evoked intermodulation frequency peaks near the alpha range and the range over which we computed the 1/f slope (e.g., Katyal, Vergeer, He, He, & Engel, 2018; Regan & Regan, 1988; Zhang et al., 2011). We removed the influence of these intermodulation peaks by interpolating the power spectra within ±0.02 Hz around 7.2, 8, 10.8, and 12 Hz for estimating alpha frequency and amplitude and around 3.6 and 6 Hz for estimating the low‐frequency slope (see below).
2.6.1. Peak alpha frequency and amplitude calculation
We first computed the frequency spectrum of the time‐series data using MATLAB's FFT function at each channel for each run. We then averaged these spectra across runs in different conditions (rest or fixation). To calculate the individual peak alpha frequency, we first discounted the 1/f trend from the spectrum by subtracting a linear fit to the log–log curve of the amplitude spectrum in the frequency range of 0.5–5.5 Hz. We then smoothed the spectrum with a 0.8 Hz moving‐average window, and picked the frequency with the maximum amplitude between 7 and 13 Hz (Figure 2) using a peak‐finding algorithm. For individuals who had two peaks in the alpha range, we picked the higher of the two. Individual alpha amplitude was then calculated as the average amplitude within ±2 Hz around this individual peak alpha frequency (Klimesch, 1999).
Figure 2.
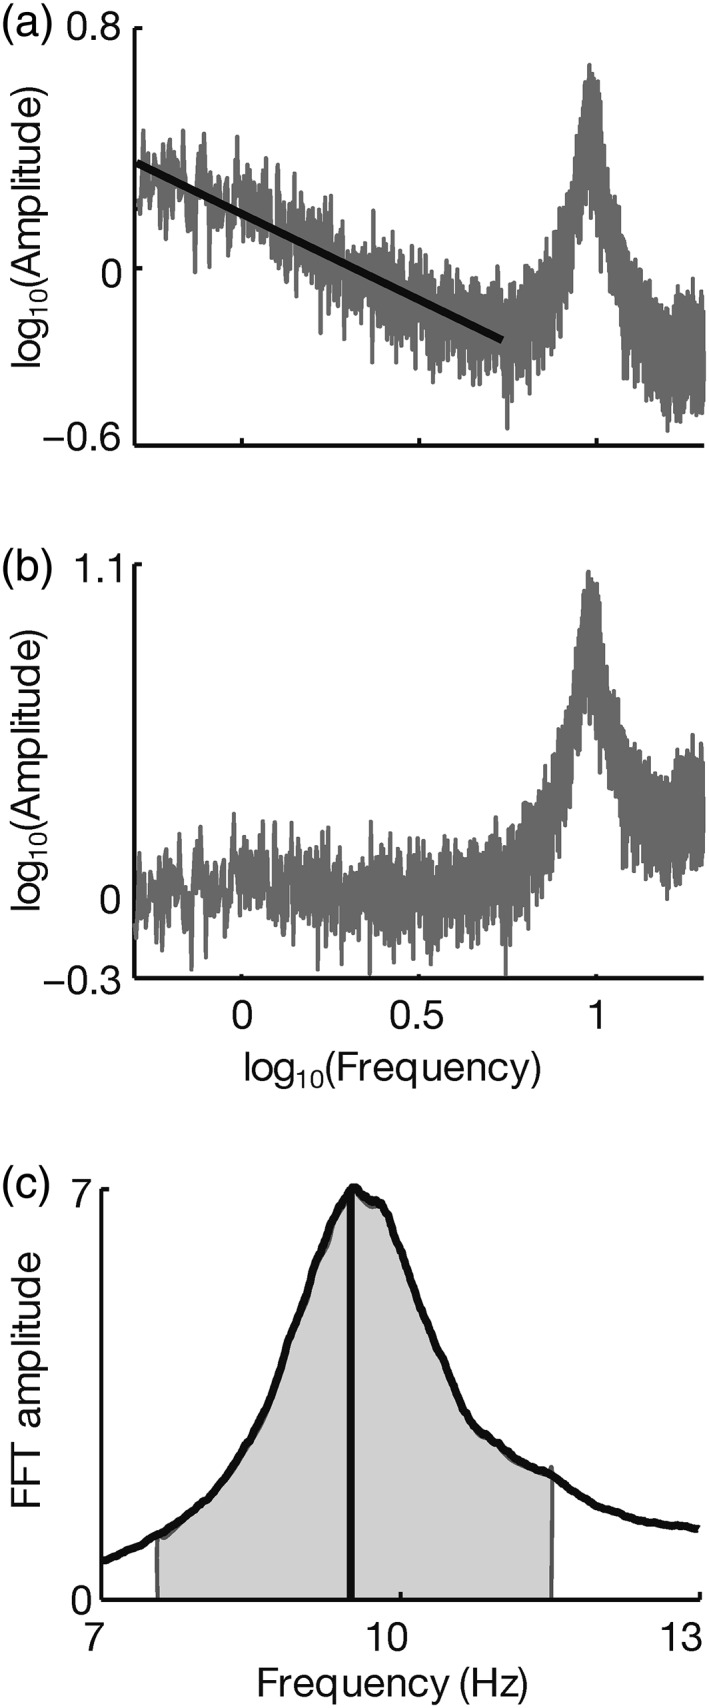
(a) Plot of log10(amplitude) versus log10(frequency) for a sample participant during fixation, averaged in the frequency domain across occipital and parieto‐occipital channels. Black line shows the least squares fit to the log–log spectrum between 0.5 and 5.5 Hz, which we used to estimate the 1/f slope of the data. (b) 1/f trend subtracted from the log–log spectrum shown in (a). (c) Linear–linear plot of the frequency spectrum in (b) smoothed with a 0.8 Hz moving‐average window showing alpha oscillations (7–13 Hz). Peak alpha frequency indicated (black solid line) along with ±2 Hz around it (shaded gray) as the range over which we calculated the alpha amplitude
Our exploratory sample showed highest alpha amplitude at bilateral parieto‐occipital channels, PO3, POz, and PO4 (Figure S1, Supporting Information). Accordingly, we selected these channels for examining correlations between alpha amplitude and percept stability duration, and peak alpha frequency and percept stability duration in the exploratory sample. In case the exploratory sample showed a significant correlation (p < 0.05) for either of the two effects (alpha amplitude or frequency with perceptual stability duration), for the validation sample we selected those channels from the exploratory sample where the correlation had p < 0.05 (separately for fixation, rest and the rivalry task). Data across the channels were averaged in the frequency domain.
Not all individuals showed a clear oscillatory peak above the 1/f noise floor within the alpha frequency range. For peak alpha frequency analysis, we removed such participants from analyses separately for the fixation, rest, and rivalry runs. After removing these individuals, the final sample sizes for our peak alpha frequency comparisons are shown in Table 1.
Table 1.
Sample sizes. Number of participants in the two groups for the three measurement periods that met all the inclusion criteria for peak alpha frequency
| Exploratory group | Validation group | |
|---|---|---|
| Fixation | 19 | 53 |
| Rest | 20 | 59 |
| Rivalry | 17 | 52 |
2.6.2. Low‐frequency slope calculation
We estimated the exponent χ for the 1/f χ component of the EEG signal by fitting a line to the log–log transformed power spectrum of the data between 0.5 and 5.5 Hz and taking its slope for each 2‐min epoch (Figure 2). The fitted line to calculate the low‐frequency slope was the same as the trend line subtracted for calculating alpha frequency and amplitude above. Calculation of this metric sometimes uses higher frequencies (Voytek et al., 2015), but to maintain independence of our measures we avoided higher frequencies where alpha oscillations could influence the results. Including higher frequencies did not alter the overall pattern of our data. For the exploratory sample, this analysis was performed at all occipital and parieto‐occipital channels, Oz, O1, O2, POz, PO3, and PO4 following the previous literature (Voytek et al., 2015). If the exploratory sample showed a significant relationship (p < 0.05), we again used those channels were the correlation had a p < 0.05 for the validation sample. Data were again averaged across channels in the frequency domain.
As the frequency spectrum at low frequencies is susceptible to artifacts due to subject motion, we (a) calculated the representative slope as the median instead of the mean across the 2‐min epochs, and (b) excluded participants whose SD was more than 3 SD away from the mean of the combined sample as detected by MATLAB's isoutlier function (one participant from the exploratory sample [second session] and two from the validation sample for both the eyes‐open and closed periods met this criterion).
2.7. Experimental design and statistical analyses
We planned six comparisons of correlation with percept stability duration for the exploratory sample: three neural metrics (alpha frequency, alpha amplitude, low‐frequency slope) × two measurement periods (fixation, rest). Among these, we selected those comparisons that showed a statistically significant correlation at p < 0.05 and tested them in our validation sample. For the two independent samples, an uncorrected alpha of 0.05 implied an overall uncorrected alpha of 0.0025 (0.052); and for six comparisons, an alpha of 0.015.
2.7.1. Test–retest reliability
For our exploratory sample, participants took part in two identical sessions on separate days. On these participants, we characterized the test–retest reliability of several behavioral and neural metrics using intraclass correlation coefficient (Fisher, 1925). We used the intraclass coefficient (ICC) of type two‐way mixed‐effects, absolute agreement, single measurement, as appropriate for our design (see Koo & Li, 2016; McGraw & Wong, 1996).
2.7.2. Correlation
We performed Pearson correlation between stable percept duration and each of our neural predictors. To ensure that correlations were not driven by outliers we also used the robust correlation toolbox (Pernet, Wilcox, & Rousselet, 2013) to detect bivariate outliers with its boxplot method. We report our correlations both before and after removing outliers.
3. RESULTS
In 84 participants, we measured perceptual alternations in binocular rivalry, along with the three major features in EEG recordings of cortical dynamics: alpha frequency, alpha amplitude, and the slope of the low‐frequency fall‐off in the frequency spectrum. EEG was recorded during rest with eyes closed, during performance of a simple visual fixation task (Klimesch et al., 2007), and during binocular rivalry. Participants were recruited in two phases: (a) an exploratory sample of 21, and (b) a validation pool of 63 (see Section 2). Four participants from the validation sample, who had highly unequal eye dominance, which may involve atypical mechanisms of suppression, were excluded, leaving us with 59 in the validation sample. In addition, a few participants who did not show alpha oscillations above the noise floor or did not have a clearly predominant alpha in particular conditions were also removed from analysis of that condition (see Section 2).
3.1. Behavior
During binocular rivalry, participants viewed orthogonal gray scale sinusoidal gratings presented dichoptically with a mirror stereoscope (Figure 1a). Participants reported when their perception switched to either one grating or a mixture of the two gratings. Figure 1b shows the histogram of the mean stable percept durations (mean and SEM = 2.49 ± 0.10 s) for the combined sample of 80 participants showing the spread of durations across participants.
3.2. Alpha topography
Figure S1 (Supporting Information) shows the topography of alpha amplitudes averaged for all participants in the exploratory sample during the fixation task. The highest alpha was evoked over bilateral parieto‐occipital electrodes. The validation samples showed an almost identical topography, as did alpha during eyes‐closed rest in both samples. For our analyses, we averaged data over the electrodes where amplitudes peaked, shown with stars in Figure S1a, Supporting Information.
3.3. Session‐to‐session reliability
We estimated test–retest reliability of our measures in the validation sample, whose members participated in two sessions on separate days, using ICC (see Section 2 and Figure S2, Supporting Information). Mean stable percept duration had good reliability across sessions (ICC: R = 0.80). Peak alpha frequency had excellent reliability (fixation: ICC: R = 0.94; rest: ICC: R = 0.94), the highest among all our measures. Alpha amplitude (fixation: ICC: R = 0.79; rest: ICC: R = 0.89) also had good reliability. The low‐frequency slope had good reliability during rest (ICC: R = 0.81), but was only moderately reliable for fixation (ICC: R = 0.61). Overall, these reliability values indicate that our measures had the potential to show reasonably strong statistical relationships.
3.4. Individual differences
3.4.1. Peak alpha frequency predicts perceptual stability duration
In the exploratory sample, we observed a strong negative correlation between mean stable percept duration and peak alpha frequency during fixation (Figure 3a; R = −0.51, p < 0.05) and rest (Figure 3b; R = −0.51, p < 0.05) in the predicted direction. Slower alpha frequencies were associated with longer stable percept durations during rivalry. For the validation sample, we pooled signal over all channels that showed reliable correlations in the exploratory sample (see Section 2). For fixation, the exploratory sample correlation was widespread over the poster half of the brain, with 12 channels above the p < 0.05 threshold. (Oz, O1, O2, POz, PO3, PO4, PO7, Pz, P4, P8, CP1, C3). For rest, there were only two channels that survived the same threshold (O1, PO3).
Figure 3.
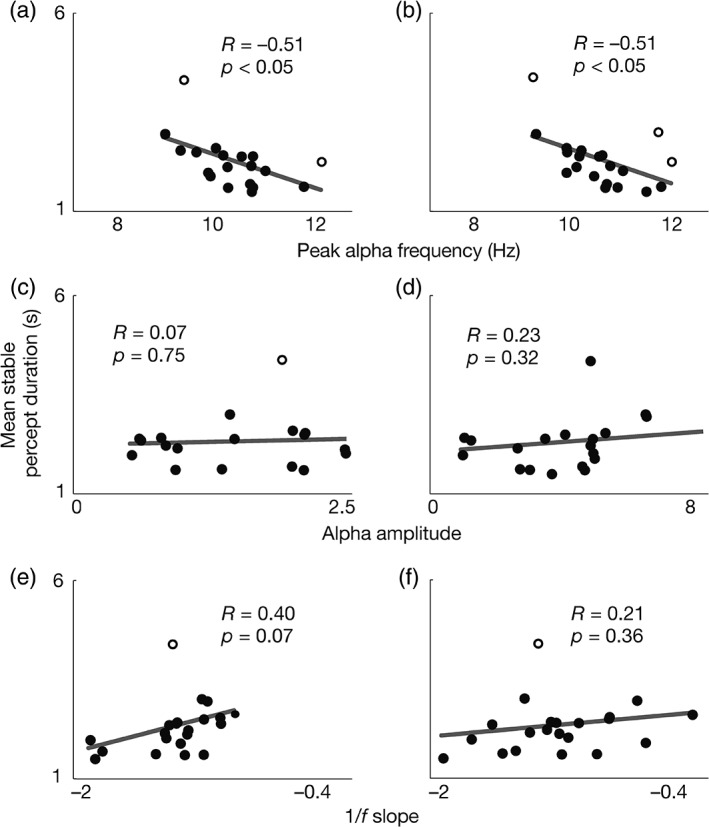
Scatterplots for the exploratory sample of mean stable percept durations with (a,b) peak alpha frequency, (c,d) alpha amplitude, and (e,f) 1/f slope. (a,c,e) measured during fixation, and (b,d,f) measured during rest. Each dot represents one participant and unfilled circles indicate bivariate outliers. Lines show linear regression fits to all participants (including outliers)
In the validation sample, we again found a statistically significant negative correlation between mean percept duration and peak alpha frequency for fixation (Figure 4a; R = −0.40, p < 0.005). However, no such relationship was observed during rest (Figure 4b; R = −0.05, p = 0.69).
Figure 4.

Scatterplots for the validation samples of mean percept duration with (a) peak alpha frequency during fixation, (b) peak alpha frequency during rest, and (c) 1/f slope during fixation. Each dot represents one participant and unfilled circles indicate bivariate outliers. Lines show linear regression fits to all participants (including outliers)
These results were not due to outliers, as repeating the analyses using robust correlation yielded a similar pattern of results: For fixation, correlations were significant for both the exploratory (Figure 3a; two outliers in open circles; R = −0.66, p < 0.005) and validation samples (Figure 4a; three outliers; R = −0.40, p < 0.005) and for rest results were again significant for the exploratory (Figure 3b; three outliers; R = −0.78, p < 0.001), but not the validation sample (Figure 4b; three outliers; R = −0.13, p = 0.31).
To examine the topography of the relationship between peak alpha frequency and percept stability duration during fixation, we combined the exploratory and validation samples and plotted the correlation for each channel (Figure 5a). The correlation was highest at bilateral occipital channels.
Figure 5.

Scalp topographies of the correlation coefficient between peak alpha frequency and stable percept duration during (a) fixation, and (b) rest combined across the exploratory and validation samples. Black stars show channels where correlation was significant at p < 0.05 (Bonferroni corrected for 34 channels) [Color figure can be viewed at http://wileyonlinelibrary.com]
3.4.2. Alpha amplitude and perceptual stability duration
The exploratory sample did not show a relationship between alpha amplitude and stable percept duration for either fixation (Figure 3c; R = 0.07, p = 0.75; robust: one outlier, R = −0.20, p = 0.40) or rest (Figure 3d; R = 0.23, p = 0.32; robust: one outlier, R = 0.33, p = 0.16). Accordingly, we did not investigate this metric in the validation sample.
3.4.3. Low‐frequency slope and perceptual stability duration
The exploratory sample showed a trend for the relationship between stable percept duration and the low‐frequency slope of the frequency spectrum during fixation (Figure 3e; R = 0.40, p = 0.07) but not during rest (Figure 3f; R = 0.21, p = 0.36). The robust correlation analysis found a reliable correlation for fixation (one outlier; R = 0.60, p < 0.01) but not for rest (one outlier; R = 0.41, p = 0.07). The correlation between stable percept duration and low‐frequency slope was in the direction opposite to what we predicted with flatter slope, (which has indicated greater internal noise in past work) predicting more perceptual stability. However, examining the slope of the low‐frequency EEG signal during fixation in the validation sample, we did not observe any relationship between it and stable percept duration (Figure 4c; R = 0.11, p = 0.42; robust: four outliers; R = 0.13, p = 0.36).
3.4.4. Control analyses
We conducted control analyses based on previous studies that have shown a relationship between perceptual stability duration and age (Ukai, Ando, & Kuze, 2003) as well as age and peak alpha frequency (Richard Clark et al., 2004). Within our small age range (SD = 3.5 years), we did not find either to be correlated (age vs. perceptual stability duration: R = −0.01, p = 0.92; age vs. peak alpha frequency: R = −0.03, p = 0.81).
A previous study showed that a different measure of percept stability duration, which records the time between one dominant percept and the next (thereby ignoring mixed percepts), reduces the impact of response variability on individual differences in percept stability (Brascamp et al., 2018). When we used this behavioral measure with our main correlate in the neural domain, peak alpha frequency during fixation, we again observed significant negative correlation both for the exploratory sample (R = −0.62, p < 0.005; after removing two outliers: R = −0.78, p < 0.001) and the validation sample (R = −0.36, p < 0.01; after removing four outliers: R = −0.36, p < 0.05).
Response variability accounted for some variability in percept duration in past work, but these amounts were smaller than what we report here for alpha. Response variability is measured as differences between button press times and ground truth in a “replay” condition, where subjects monitor physically changing stimuli. We computed a meta‐analytic correlation coefficient for response variability and percept duration using the five independent experiments in the past work (R = 0.09, n = 54; R = 0.04, n = 23; R = 0.369; n = 32, R = 0.16, n = 131; R = 0.33, n = 118) (Brascamp et al., 2018; Gallagher & Arnold, 2014). We used the DerSimonian‐Laird approach (Schulze, 2004) implemented in the R (Team RC, 2018) package metacor (Laliberté, 2011). The meta‐analytic correlation coefficient for response variability predicting percept stability duration was R = 0.22 (z‐score = 0.22, SE = 0.06). A similar meta‐analytic correlation calculated from our two experiments on peak alpha frequency during fixation predicting percept stability duration was larger, R = −0.55 (z‐score = 0.61, SE = 0.16).
3.5. Exploratory analyses
3.5.1. Alpha frequency during rest
While we observed a strong correlation between stable percept duration and peak alpha frequency during fixation for both the exploratory and validation samples, their relationship was nonexistent during rest for the validation sample. Observing a strong effect of alpha frequency during fixation and not during rest implies that alpha frequency during the two states differs. We looked at the consistency of alpha frequency during fixation and rest by plotting the scalp topography of ICC between the peak alpha frequencies in the two conditions (Figure S3, Supporting Information). In both subject samples, we observed moderately high consistency at left central–parietal, right posterior parietal channels, and poor consistency at the right central–parietal channels and occipital pole.
As peak alpha frequency was more consistent between rest and fixation at parietal channels and less at the occipital ones, we suspected that we might be missing the relationship between percept stability and peak alpha frequency during rest because of our channel selection procedure (see Section 2). To avoid the channel selection problem, we looked at the topography of peak alpha frequency correlation with stable percept duration during rest (Figure 5b). For added power in this exploratory analysis, we used the combined sample of subjects. The topography showed regions of high correlation over bilateral parietal and right lateral‐frontal channels. Correlation was significant at two lateral parietal channels after Bonferroni correction for multiple comparison (p < 0.00147 or p < 0.05 corrected for 34 channels). This analysis suggests that fixation alpha and eyes‐closed alpha may not differ by as much as our initial analyses suggested.
3.5.2. Alpha frequency, amplitude, and 1/f slope during the rivalry task
Our primary hypotheses concerned the relationship of general features of ongoing neural activity with rivalry stability duration. Hence, we measured them during different stimuli and tasks than binocular rivalry. For completeness, however, we also looked at our three dependent measures during the rivalry runs. The session‐to‐session reliability of peak alpha frequency during rivalry was moderate (ICC: R = 0.63). Alpha amplitude was highly reliable (ICC: R = 0.81) while reliability of 1/f slope was poor (ICC: R = 0.38).
Peak alpha frequency in the rivalry runs was significantly negatively correlated with perceptual stability duration for the exploratory sample (R = −0.55, p < 0.05; robust: one outlier, R = −0.58, p < 0.05), in the predicted direction similar to fixation and rest. At the significantly correlated channels selected from the exploratory sample (O2, POz, Pz, CP5, CP2), this relationship was also marginally significant for the validation sample (R = −0.30, p < 0.05; robust: three outliers, R = −0.28, p < 0.05). Alpha amplitude was not correlated with perceptual stability duration in the exploratory sample (R = 0.16, p = 0.48; robust: one outlier, R = 0.10, p = 0.67). The low‐frequency slope showed a correlational trend with stability in the exploratory sample (R = 0.29, p = 0.20; robust: one outlier, R = 0.54, p < 0.05) but this correlation was not observed in the validation sample (R = −0.04, p = 0.76; robust: three outliers, R = −0.04, p = 0.76).
4. DISCUSSION
Individual differences in peak alpha frequency correlated with stable percept durations in binocular rivalry, such that faster alpha oscillations predicted shorter percept durations. We observed this relationship most strongly for alpha measured during fixation. We found no reliable evidence for a relationship between stable percept durations and alpha amplitude, or frequency‐spectrum slope.
4.1. Link between alpha frequency and rivalry durations
The relationship we find between alpha frequency and stable percept duration suggests that there may be a role for intrinsic oscillatory activity in the neural computations that give rise to perceptual alternations (Pettigrew, 2001). This finding is consistent with the growing literature on how perception more generally may be affected by neural oscillations (Busch et al., 2009; Fiebelkorn, Saalmann, & Kastner, 2013; Ronconi & Melcher, 2017).
We first note the limits of our correlational methods; it is possible that “hidden” factors correlated with both alpha frequency and percept duration could account for our results. Bistable perception remains an important test of theories linking neural activity to behavior, however, so we speculate about how oscillations could account for our results.
Recently, two different computational mechanisms have been suggested for how low‐frequency oscillations such as alpha could influence temporal dynamics of behavior. The first proposal is that visual cortex accesses its input from the world in discrete samples, analogous to ones drawn from probability distributions in statistical computations (VanRullen & Koch, 2003). Consistent with this hypothesis, an individual's peak alpha frequency can explain their visual temporal resolution measured in behavioral paradigms that use durations comparable to one cycle of alpha (Cecere, Rees, & Romei, 2015; Gulbinaite, van Viegen, Wieling, Cohen, & VanRullen, 2017; Samaha & Postle, 2015). A number of recent models of bistable perceptual dynamics have included a periodic sampling term of this type within an inference process (Gershman, Vul, & Tenenbaum, 2011; Hohwy, Roepstorff, & Friston, 2008; Sundareswara & Schrater, 2008).
The second proposed role for oscillatory activity is to modulate functional connectivity between neurons in different cortical areas. Synchronized oscillations may enhance or suppress the effective strength of signals between neurons of different visual areas. For example, relatively low‐frequency oscillations like alpha have been hypothesized to phasically modulate higher frequency oscillations as well as behavior (Bauer, Stenner, Friston, & Dolan, 2014; Bonnefond, Kastner, & Jensen, 2017; Jensen et al., 2014).
How, then might oscillations affect percept durations? Traditional models of bistable perception account for perceptual alternations using a mixture of neural adaptation and noise (Dayan, 1998; Kang & Blake, 2008; Shpiro, Moreno‐Bote, Rubin, & Rinzel, 2009). In models of binocular rivalry, for example, competition between neurons that represent the two presented patterns results in one population's activity being suppressed. Over time, activity in the dominant population declines due to adaptation and eventually the previously suppressed population's activity surpasses it, inducing a perceptual switch. Neural noise produces variability in the time at which activity in one population surpasses the other, and hence in the stable percept duration (Brascamp et al., 2006; Moreno‐Bote, Rinzel, & Rubin, 2007).
We speculate that neural noise or adaptation may be dependent on alpha frequency. Suppose, for example, that noise is summed up over time (accumulated) by neurons involved in rivalry. If noise is divided up into discrete, equally weighted samples by a process operating at the alpha frequency, then higher frequency will result in more rapid accumulation of noise, simply due to more accumulating samples arriving per unit time. Total accumulated noise, then, will cross some level required to produce a perceptual switch more rapidly when samples arrive more quickly in subjects with higher alpha frequencies. The accumulation processes' dependence on alpha could similarly be due to computations characterized as transmission of information, rather than sampling. Neural adaptation could depend upon alpha in a similar way.
Alternatively, alpha could influence rivalry through some factor other than those included in traditional models of bistable perception. For example, rivalry may make use of its own, neural oscillator (Carter & Pettigrew, 2003), and speed of oscillations may be a general property of an individual (Klimesch, 1999). Indeed, oscillatory frequency in the gamma range (30–100 Hz) has also been shown to predict rivalry percept duration using MEG (Fesi & Mendola, 2015).
Our preplanned analyses found a significant correlation with rivalry for peak alpha frequency measured during a fixation task but not during eyes‐closed rest. Exploratory analyses indicated that resting alpha may predict rivalry, but only at a subset of channels. These results suggest that resting alpha contains additional components beyond what alpha measured during fixation (Tan, Kong, Yang, Jin, & Li, 2013). These components likely dominated alpha measured at occipital and central–parietal alpha.
4.2. Speed of neurocognitive processes
Our findings show that individuals having fast or slow alpha oscillations exhibit correspondingly fast or slow dynamics of binocular rivalry. Because alpha is ubiquitous, it seems unlikely to have a special relationship to rivalry, and we speculate that it may also be involved in other dynamic processes, including different bistable perceptual phenomena. This in turn would suggest that alternation rates for different bistable phenomena would correlate across observers. While previous studies have found such correlations (Carter & Pettigrew, 2003; Patel, Stuit, & Blake, 2014; Shannon, Patrick, Jiang, Bernat, & He, 2011), recent studies have found them to be weak or nonexistent across a large range of bistable phenomena (Brascamp et al., 2018; Cao, Wang, Sun, Engel, & He, 2018; Gallagher & Arnold, 2014). Results from Cao et al. (2018), who looked at 11 different types of bistable stimuli, suggest that local mechanisms might be important in determining perceptual stability durations; although their overall findings indicate that a combination of local and global factors might be involved.
Brascamp et al. (2018) showed that correlation between different bistable stimuli is highly variable across studies, and may not be large on average. While some studies have reported shared variability between binocular rivalry and some other bistable stimuli of >40% (e.g., Carter & Pettigrew, 2003; Shannon et al., 2011), a meta‐analytic estimate of the shared variability is closer to 10–15% (Brascamp et al., 2018; Cao, Wang, & He, 2015; Gallagher & Arnold, 2014). Among visual bistable phenomena, binocular rivalry is unique in that it is relatively unaffected by top‐down processing (Meng & Tong, 2004). We reasoned therefore that, it may be the one most sensitive to intrinsic global temporal factors determining perceptual stability that are invariant to top‐down modulation, of the kind we tested here. Considering that we found 30.3% (R = 0.55) of variability in binocular rivalry stable percept duration explained by peak alpha frequency across two experiments, the probability of finding a relationship between peak alpha frequency and other bistable stimuli appears low. Doing so may require a larger sample size and more data per stimulus condition to get a robust measure of percept duration within individuals for such study. A potential way to test if peak alpha frequency predicts percept stability durations for bistable stimuli that are more amenable to top‐down modulation to independently measure the degree such modulation and use it as a covariate (Meng & Tong, 2004). Alternatively, it is also possible that the (relatively weak) correlations between different bistable stimuli are due to a shared role of alpha frequency.
4.3. Response variability
Different individuals may exhibit reliable differences in reported alternation durations even for “replay” stimuli that physically alternate, and this response variability can explain some variability in bistable percept durations (Brascamp et al., 2018; Gallagher & Arnold, 2014). This can arise, for example, if different individuals have different criteria in discriminating when a percept is mixed from dominant (Brascamp et al., 2018). As a result, variability across individuals in percept stability durations during binocular rivalry might partly be an outcome of response variability (and not perception). However, we believe our finding of peak alpha frequency predicting percept stability durations were based on perceptual variability and not merely a response variability. Two reasons support our claim. First, Brascamp et al. (2018) determined that the response variability affecting percept stability durations was substantially reduced when evaluating the latter by averaging switches of one dominance to the next where mixed percepts in between are included in the duration. In our data, the correlation between peak alpha frequency during fixation and percept stability duration is relatively unaffected by using this method of calculation of percept duration. Second, we evaluated the meta‐analytic correlation coefficients from previous studies that tested the relationship between response variability and percept stability durations. We found that peak alpha frequency explained more than six times the amount of variability (30.3 vs. 4.8%) in percept stability compared to response variability. Therefore, even if a small part of the variability depended on responses, the remaining would depend on perceptual factors.
4.4. Alpha amplitude and 1/f exponent
In general, we observed that all three of our EEG measures, alpha frequency, amplitude, and 1/f slope, have reasonable reliability. Our data did not, however, show a relationship between percept duration and individual alpha amplitude. This is in contrast to a recent report that alpha amplitude can influence perceptual stability of the Necker cube within individuals (Piantoni, Romeijn, Gomez‐Herrero, Van Der Werf, & Van Someren, 2017). There are two possibilities for this discrepancy. First, Necker cube stability is more influenced by top‐down factors such as attention compared to binocular rivalry, which is relatively automatic (Meng & Tong, 2004). Such top‐down modulation might be reflected more in alpha amplitude (Jensen & Mazaheri, 2010), and less in alpha frequency. Second, as the previous study did not study interindividual differences; alpha amplitude might influence perceptual dynamics only within and not between individuals.
Our data also did not show a relationship between percept duration and frequency‐spectrum slope. This suggests that low‐frequency, broadband noise, as measured by the slope, does not impact rivalry dynamics. To the best of our knowledge, ours is the first report of test–retest reliability measurement of the frequency‐spectrum slope. Its reasonable reliability suggests that it could be a valuable measure of individual differences in future work.
4.5. Other factors predicting perceptual stability
Past work has identified neural factors unrelated to oscillatory activity that predicts percept duration. These include the strength of response to the suppressed stimulus (Yamashiro et al., 2014), cortical thickness of the superior parietal lobule (Kanai et al., 2010), and the number of energy minima in visual cortex (Watanabe et al., 2014). Transcranial magnetic stimulation disruption of parietal cortex has also been shown to alter of percept durations, though past studies have found both increased and decreased durations (Carmel, Walsh, Lavie, & Rees, 2010; Zaretskaya, Thielscher, Logothetis, & Bartels, 2010). While our 34‐channel EEG data does not permit precise source localization, we did find that during rest our results point to a similar right parietal location.
4.6. Binocular rivalry, alpha frequency, mental disorders, and personality
There is growing interest in stability durations during binocular rivalry as a marker of clinical and personality traits. Individuals diagnosed with bipolar disorder have repeatedly been shown to have slower durations compared to controls (Miller et al., 2003; Nagamine, Yoshino, Miyazaki, Takahashi, & Nomura, 2009; Ngo, Mitchell, Martin, & Miller, 2011; Pettigrew & Miller, 1998; Vierck et al., 2013), as have those diagnosed with autism (Robertson, Kravitz, Freyberg, Baron‐Cohen, & Baker, 2013); however see, (Said, Egan, Minshew, Behrmann, & Heeger, 2013) and children with attention deficit hyperactivity disorder (Amador‐Campos, Aznar‐Casanova, Ortiz‐Guerra, Moreno‐Sánchez, & Medina‐Peña, 2015; Aznar Casanova, Amador Campos, Moreno Sánchez, & Supér, 2013). Anxiety patients have been shown to have faster durations (Nagamine et al., 2007). Individuals with higher schizotypal traits show a higher proportion of mixed percepts during rivalry (Thakkar, Antinori, Carter, & Brascamp, 2018). A study looking at the Big Five personality scale found that industrious or self‐disciplined people had longer perceptual durations during rivalry (Antinori, Smillie, & Carter, 2017). Both aging and the practice of meditation have also been linked to slower rivalry (Carter et al., 2005; Hudak et al., 2011; Ukai et al., 2003) as well as slower peak alpha frequencies (Cahn & Polich, 2006; Richard Clark et al., 2004).
Individual alpha frequency has been repeatedly linked to general cognitive abilities within and across individuals (Angelakis, Lubar, Stathopoulou, & Kounios, 2004; Grandy et al., 2013; Haegens, Cousijn, Wallis, Harrison, & Nobre, 2014); however see, (Anokhin & Vogel, 1996; Posthuma, Neale, Boomsma, & de Geus, 2001). Patients diagnosed with schizophrenia (Colombo et al., 1989; Giannitrapani & Kayton, 1974) as well as bipolar disorder (Clementz, Sponheim, Iacono, & Beiser, 1994) have been shown to have slower alpha frequency compared to healthy individuals. Our results may prompt examination of alpha frequency as a mediator of psychopathological behavior and personality traits.
4.7. Summary
We find that individual differences in perceptual stability during binocular rivalry are predicted by individual peak alpha frequency, with faster alpha oscillations associated with more rapid perceptual alternations. These findings suggest that oscillatory activity may play a role in producing stable percepts and the transitions between them.
Supporting information
Figure S1 Scalp topographies of alpha amplitude during fixation for the A) exploratory sample, B) validation sample, and during rest for the C) exploratory sample, D) validation sample. Stars in A) indicate the parietooccipital electrodes (PO3, POz, PO4) over which we averaged the alpha frequency and amplitude data for the exploratory sample
Figure S2. Session‐to‐session reliability for: A) Stable percept duration. B, C) Peak alpha frequency. D, E) Alpha amplitude. F, G) 1/f slope. B,D,F) During fixation. C,E,G) During rest
Figure S3. Scalp Topographies of the intraclass coefficient (ICC) between peak alpha frequency during fixation and rest for the A) exploratory, and B) validation samples
ACKNOWLEDGMENTS
This work was supported by National Institutes of Health (grant number: R01 EY02301). The authors would like to thank Mohan Ji, Graham Peterson, Samuel Elliott, Shasteana Rancher, and Collin Teich for their assistance with data collection.
Katyal S, He S, He B, Engel SA. Frequency of alpha oscillation predicts individual differences in perceptual stability during binocular rivalry. Hum Brain Mapp. 2019;40:2422–2433. 10.1002/hbm.24533
Funding information National Eye Institute, Grant/Award Number: R01 EY02301; National Institutes of Health, Grant/Award Number: R01 EY02301
REFERENCES
- Aafjes, M. , Hueting, J. E. , & Visser, P. (1966). Individual and interindividual differences in binocular retinal rivalry in man. Psychophysiology, 3, 18–22. [DOI] [PubMed] [Google Scholar]
- Amador‐Campos, J. A. , Aznar‐Casanova, J. A. , Ortiz‐Guerra, J. J. , Moreno‐Sánchez, M. , & Medina‐Peña, A. (2015). Assessing attention deficit by binocular rivalry. Journal of Attention Disorders, 19, 1064–1073. [DOI] [PubMed] [Google Scholar]
- Angelakis, E. , Lubar, J. F. , Stathopoulou, S. , & Kounios, J. (2004). Peak alpha frequency: An electroencephalographic measure of cognitive preparedness. Clinical Neurophysiology, 115, 887–897. [DOI] [PubMed] [Google Scholar]
- Anokhin, A. , & Vogel, F. (1996). EEG alpha rhythm frequency and intelligence in normal adults. Intelligence, 23, 1–14. [Google Scholar]
- Antinori, A. , Smillie, L. D. , & Carter, O. L. (2017). Personality measures link slower binocular rivalry switch rates to higher levels of self‐discipline. Frontiers in Psychology, 7 https://www.ncbi.nlm.nih.gov/pmc/articles/PMC5214163/ [DOI] [PMC free article] [PubMed] [Google Scholar]
- Aznar Casanova, J. A. , Amador Campos, J. A. , Moreno Sánchez, M. , & Supér, H. (2013). Onset time of binocular rivalry and duration of inter‐dominance periods as psychophysical markers of ADHD. Perception, 42, 16–27. [DOI] [PubMed] [Google Scholar]
- Bauer, M. , Stenner, M.‐P. , Friston, K. J. , & Dolan, R. J. (2014). Attentional modulation of alpha/beta and gamma oscillations reflect functionally distinct processes. The Journal of Neuroscience, 34, 16117–16125. [DOI] [PMC free article] [PubMed] [Google Scholar]
- Bonnefond, M. , Kastner, S. , & Jensen, O. (2017). Communication between brain areas based on nested oscillations. eNeuro, 4 ENEURO‐0153. [DOI] [PMC free article] [PubMed] [Google Scholar]
- Brainard, D. H. (1997). The psychophysics toolbox. Spatial Vision, 10, 433–436. [PubMed] [Google Scholar]
- Brascamp, J. W. , Becker, M. W. , & Hambrick, D. Z. (2018). Revisiting individual differences in the time course of binocular rivalry. Journal of Vision, 18, 3–3. [DOI] [PubMed] [Google Scholar]
- Brascamp, J. W. , van Ee, R. , Noest, A. J. , Jacobs, R. H. A. H. , & van den Berg, A. V. (2006). The time course of binocular rivalry reveals a fundamental role of noise. Journal of Vision, 6, 8–8. [DOI] [PubMed] [Google Scholar]
- Brown, R. J. , & Norcia, A. M. (1997). A method for investigating binocular rivalry in real‐time with the steady‐state VEP. Vision Research, 37, 2401–2408. [DOI] [PubMed] [Google Scholar]
- Busch, N. A. , Dubois, J. , & VanRullen, R. (2009). The phase of ongoing EEG oscillations predicts visual perception. The Journal of Neuroscience, 29, 7869–7876. [DOI] [PMC free article] [PubMed] [Google Scholar]
- Cahn, B. R. , & Polich, J. (2006). Meditation states and traits: EEG, ERP, and neuroimaging studies. Psychological Bulletin, 132, 180–211. [DOI] [PubMed] [Google Scholar]
- Cao, T. , Wang, L. , & He, S. (2015). Common and shared mechanisms underlying the temporal dynamics of bi‐stable perception. Journal of Vision, 15, 273. [Google Scholar]
- Cao, T. , Wang, L. , Sun, Z. , Engel, S. A. , & He, S. (2018). The independent and shared mechanisms of intrinsic brain dynamics: Insights from bistable perception. Frontiers in Psychology, 9 https://www.frontiersin.org/articles/10.3389/fpsyg.2018.00589/full [DOI] [PMC free article] [PubMed] [Google Scholar]
- Carmel, D. , Walsh, V. , Lavie, N. , & Rees, G. (2010). Right parietal TMS shortens dominance durations in binocular rivalry. Current Biology, 20, R799–R800. [DOI] [PubMed] [Google Scholar]
- Carter, O. L. , & Pettigrew, J. D. (2003). A common oscillator for perceptual rivalries? Perception, 32, 295–305. [DOI] [PubMed] [Google Scholar]
- Carter, O. L. , Presti, D. E. , Callistemon, C. , Ungerer, Y. , Liu, G. B. , & Pettigrew, J. D. (2005). Meditation alters perceptual rivalry in Tibetan Buddhist monks. Current Biology, 15, R412–R413. [DOI] [PubMed] [Google Scholar]
- Cecere, R. , Rees, G. , & Romei, V. (2015). Individual differences in alpha frequency drive crossmodal illusory perception. Current Biology, 25, 231–235. [DOI] [PMC free article] [PubMed] [Google Scholar]
- Clementz, B. A. , Sponheim, S. R. , Iacono, W. G. , & Beiser, M. (1994). Resting EEG in first‐episode schizophrenia patients, bipolar psychosis patients, and their first‐degree relatives. Psychophysiology, 31, 486–494. [DOI] [PubMed] [Google Scholar]
- Colombo, C. , Gambini, O. , Macciardi, F. , Bellodi, L. , Sacchetti, E. , Vita, A. , … Scarone, S. (1989). Alpha reactivity in schizophrenia and in schizophrenic spectrum disorders: Demographic, clinical and hemispheric assessment. International Journal of Psychophysiology, 7, 47–54. [DOI] [PubMed] [Google Scholar]
- Dayan, P. (1998). A hierarchical model of binocular rivalry. Neural Computation, 10, 1119–1135. [DOI] [PubMed] [Google Scholar]
- Delorme, A. , & Makeig, S. (2004). EEGLAB: An open source toolbox for analysis of single‐trial EEG dynamics including independent component analysis. Journal of Neuroscience Methods, 134, 9–21. [DOI] [PubMed] [Google Scholar]
- Delorme, A. , Sejnowski, T. , & Makeig, S. (2007). Enhanced detection of artifacts in EEG data using higher‐order statistics and independent component analysis. NeuroImage, 34, 1443–1449. [DOI] [PMC free article] [PubMed] [Google Scholar]
- Dieter, K. C. , Sy, J. L. , & Blake, R. (2017). Individual differences in sensory eye dominance reflected in the dynamics of binocular rivalry. Vision Research, 141, 40–50. [DOI] [PMC free article] [PubMed] [Google Scholar]
- Fesi, J. D. , & Mendola, J. D. (2015). Individual peak gamma frequency predicts switch rate in perceptual rivalry. Human Brain Mapping, 36, 566–576. [DOI] [PMC free article] [PubMed] [Google Scholar]
- Fiebelkorn, I. C. , Saalmann, Y. B. , & Kastner, S. (2013). Rhythmic sampling within and between objects despite sustained attention at a cued location. Current Biology, 23, 2553–2558. [DOI] [PMC free article] [PubMed] [Google Scholar]
- Fisher, R. A. (1925). Statistical methods for research workers. Edinburgh: Oliver & Boyd. [Google Scholar]
- Freeman, W. J. , & Zhai, J. (2009). Simulated power spectral density (PSD) of background electrocorticogram (ECoG). Cognitive Neurodynamics, 3, 97–103. [DOI] [PMC free article] [PubMed] [Google Scholar]
- Gallagher, R. M. , & Arnold, D. H. (2014). Interpreting the temporal dynamics of perceptual rivalries. Perception, 43, 1239–1248. [DOI] [PubMed] [Google Scholar]
- Gershman, S. J. , Vul, E. , & Tenenbaum, J. B. (2011). Multistability and perceptual inference. Neural Computation, 24, 1–24. [DOI] [PubMed] [Google Scholar]
- Giannitrapani, D. , & Kayton, L. (1974). Schizophrenia and EEG spectral analysis. Electroencephalography and Clinical Neurophysiology, 36, 377–386. [DOI] [PubMed] [Google Scholar]
- Grandy, T. H. , Werkle‐Bergner, M. , Chicherio, C. , Lövdén, M. , Schmiedek, F. , & Lindenberger, U. (2013). Individual alpha peak frequency is related to latent factors of general cognitive abilities. NeuroImage, 79, 10–18. [DOI] [PubMed] [Google Scholar]
- Gulbinaite, R. , van Viegen, T. , Wieling, M. , Cohen, M. X. , & VanRullen, R. (2017). Individual alpha peak frequency predicts 10 Hz flicker effects on selective attention. The Journal of Neuroscience, 37, 10173–10184. [DOI] [PMC free article] [PubMed] [Google Scholar]
- Haegens, S. , Cousijn, H. , Wallis, G. , Harrison, P. J. , & Nobre, A. C. (2014). Inter‐ and intra‐individual variability in alpha peak frequency. NeuroImage, 92, 46–55. [DOI] [PMC free article] [PubMed] [Google Scholar]
- Händel, B. F. , Haarmeier, T. , & Jensen, O. (2010). Alpha oscillations correlate with the successful inhibition of unattended stimuli. Journal of Cognitive Neuroscience, 23, 2494–2502. [DOI] [PubMed] [Google Scholar]
- He, B. J. (2014). Scale‐free brain activity: Past, present, and future. Trends in Cognitive Sciences, 18, 480–487. [DOI] [PMC free article] [PubMed] [Google Scholar]
- He, B. J. , Zempel, J. M. , Snyder, A. Z. , & Raichle, M. E. (2010). The temporal structures and functional significance of scale‐free brain activity. Neuron, 66, 353–369. [DOI] [PMC free article] [PubMed] [Google Scholar]
- Hohwy, J. , Roepstorff, A. , & Friston, K. (2008). Predictive coding explains binocular rivalry: An epistemological review. Cognition, 108, 687–701. [DOI] [PubMed] [Google Scholar]
- Hudak, M. F. , Gervan, P. , Friedrich, B. , Pastukhov, A. , Braun, J. , & Kovacs, I. (2011). Increased readiness for adaptation and faster alternation rates under binocular rivalry in children. Frontiers in Human Neuroscience, 5 https://www.frontiersin.org/articles/10.3389/fnhum.2011.00128/full [DOI] [PMC free article] [PubMed] [Google Scholar]
- Jensen, O. , Gips, B. , Bergmann, T. O. , & Bonnefond, M. (2014). Temporal coding organized by coupled alpha and gamma oscillations prioritize visual processing. Trends in Neurosciences, 37, 357–369. [DOI] [PubMed] [Google Scholar]
- Jensen, O. , & Mazaheri, A. (2010). Shaping functional architecture by oscillatory alpha activity: Gating by inhibition. Frontiers in Human Neuroscience, 4 https://www.frontiersin.org/articles/10.3389/fnhum.2010.00186/full [DOI] [PMC free article] [PubMed] [Google Scholar]
- Kanai, R. , Bahrami, B. , & Rees, G. (2010). Human parietal cortex structure predicts individual differences in perceptual rivalry. Current Biology, 20, 1626–1630. [DOI] [PMC free article] [PubMed] [Google Scholar]
- Kang, M.‐S. , & Blake, R. (2008). Enhancement of bistable perception associated with visual stimulus rivalry. Psychonomic Bulletin and Review, 15, 586–591. [DOI] [PMC free article] [PubMed] [Google Scholar]
- Katyal, S. , Engel, S. A. , He, B. , & He, S. (2016). Neurons that detect interocular conflict during binocular rivalry revealed with EEG. Journal of Vision, 16, 18–18. [DOI] [PubMed] [Google Scholar]
- Katyal, S. , Vergeer, M. , He, S. , He, B. , & Engel, S. A. (2018). Conflict‐sensitive neurons gate interocular suppression in human visual cortex. Scientific Reports, 8, 1239. [DOI] [PMC free article] [PubMed] [Google Scholar]
- Kayser, J. , & Tenke, C. E. (2006a). Principal components analysis of Laplacian waveforms as a generic method for identifying ERP generator patterns: I. Evaluation with auditory oddball tasks. Clinical Neurophysiology, 117, 348–368. [DOI] [PubMed] [Google Scholar]
- Kayser, J. , & Tenke, C. E. (2006b). Principal components analysis of Laplacian waveforms as a generic method for identifying ERP generator patterns: II. Adequacy of low‐density estimates. Clinical Neurophysiology, 117, 369–380. [DOI] [PubMed] [Google Scholar]
- Kayser, J. , & Tenke, C. E. (2015). On the benefits of using surface Laplacian (current source density) methodology in electrophysiology. International Journal of Psychophysiology, 97, 171–173. [DOI] [PMC free article] [PubMed] [Google Scholar]
- Kim, Y.‐J. , Grabowecky, M. , & Suzuki, S. (2006). Stochastic resonance in binocular rivalry. Vision Research, 46, 392–406. [DOI] [PubMed] [Google Scholar]
- Kleiner, M. , Brainard, D. , Pelli, D. , Ingling, A. , Murray, R. , & Broussard, C. (2007). What's new in Psychtoolbox‐3. Perception, 36, 1. [Google Scholar]
- Kleinschmidt, A. , Sterzer, P. , & Rees, G. (2012). Variability of perceptual multistability: From brain state to individual trait. Philosophical Transactions of the Royal Society of London. Series B, Biological Sciences, 367, 988–1000. [DOI] [PMC free article] [PubMed] [Google Scholar]
- Klimesch, W. (1999). EEG alpha and theta oscillations reflect cognitive and memory performance: A review and analysis. Brain Research Reviews, 29, 169–195. [DOI] [PubMed] [Google Scholar]
- Klimesch, W. , Sauseng, P. , & Hanslmayr, S. (2007). EEG alpha oscillations: The inhibition–timing hypothesis. Brain Research Reviews, 53, 63–88. [DOI] [PubMed] [Google Scholar]
- Koo, T. K. , & Li, M. Y. (2016). A guideline of selecting and reporting intraclass correlation coefficients for reliability research. Journal of Chiropractic Medicine, 15, 155–163. [DOI] [PMC free article] [PubMed] [Google Scholar]
- Laliberté E. (2011) metacor: Meta‐analysis of correlation coefficients. https://cran.r-project.org/package=metacor.
- Landau, A. N. , & Fries, P. (2012). Attention samples stimuli rhythmically. Current Biology, 22, 1000–1004. [DOI] [PubMed] [Google Scholar]
- Mathewson, K. E. , Lleras, A. , Beck, D. M. , Fabiani, M. , Ro, T. , & Gratton, G. (2011). Pulsed out of awareness: EEG alpha oscillations represent a pulsed‐inhibition of ongoing cortical processing. Frontiers in Psychology, 2 https://www.ncbi.nlm.nih.gov/pmc/articles/PMC3132674/ [DOI] [PMC free article] [PubMed] [Google Scholar]
- McGraw, K. O. , & Wong, S. P. (1996). Forming inferences about some intraclass correlation coefficients. Psychological Methods, 1, 30–46. [Google Scholar]
- Meng, M. , & Tong, F. (2004). Can attention selectively bias bistable perception? Differences between binocular rivalry and ambiguous figures. Journal of Vision, 4, 2–2, 551. [DOI] [PMC free article] [PubMed] [Google Scholar]
- Miller, S. M. , Gynther, B. D. , Heslop, K. R. , Liu, G. B. , Mitchell, P. B. , Ngo, T. T. , … Geffen, L. B. (2003). Slow binocular rivalry in bipolar disorder. Psychological Medicine, 33, 683–692. [DOI] [PubMed] [Google Scholar]
- Moreno‐Bote, R. , Rinzel, J. , & Rubin, N. (2007). Noise‐induced alternations in an attractor network model of perceptual bistability. Journal of Neurophysiology, 98, 1125–1139. [DOI] [PMC free article] [PubMed] [Google Scholar]
- Nagamine, M. , Yoshino, A. , Miyazaki, M. , Takahashi, Y. , & Nomura, S. (2009). Difference in binocular rivalry rate between patients with bipolar I and bipolar II disorders. Bipolar Disorders, 11, 539–546. [DOI] [PubMed] [Google Scholar]
- Nagamine, M. , Yoshino, A. , Yamazaki, M. , Obara, M. , Sato, S. , Takahashi, Y. , & Nomura, S. (2007). Accelerated binocular rivalry with anxious personality. Physiology & Behavior, 91, 161–165. [DOI] [PubMed] [Google Scholar]
- Ngo, T. T. , Mitchell, P. B. , Martin, N. G. , & Miller, S. M. (2011). Psychiatric and genetic studies of binocular rivalry: An endophenotype for bipolar disorder? Acta Neuropsychiatrica, 23, 37–42. [Google Scholar]
- Nunez, P. L. , & Srinivasan, R. (2006). Electric fields of the brain: The neurophysics of EEG. New York, NY: Oxford University Press. [Google Scholar]
- Patel, V. , Stuit, S. , & Blake, R. (2014). Individual differences in the temporal dynamics of binocular rivalry and stimulus rivalry. Psychonomic Bulletin & Review, 22, 476–482. [DOI] [PMC free article] [PubMed] [Google Scholar]
- Pelli, D. G. (1997). The VideoToolbox software for visual psychophysics: Transforming numbers into movies. Spatial Vision, 10, 437–442. [PubMed] [Google Scholar]
- Pereda, E. , Gamundi, A. , Rial, R. , & González, J. (1998). Non‐linear behaviour of human EEG: Fractal exponent versus correlation dimension in awake and sleep stages. Neuroscience Letters, 250, 91–94. [DOI] [PubMed] [Google Scholar]
- Pernet, C. R. , Wilcox, R. R. , & Rousselet, G. A. (2013). Robust correlation analyses: False positive and power validation using a new open source MATLAB toolbox. Frontiers in Psychology, 3 https://www.frontiersin.org/articles/10.3389/fpsyg.2012.00606/full [DOI] [PMC free article] [PubMed] [Google Scholar]
- Perrin, F. , Pernier, J. , Bertrand, O. , & Echallier, J. F. (1989). Spherical splines for scalp potential and current density mapping. Electroencephalography and Clinical Neurophysiology, 72, 184–187. [DOI] [PubMed] [Google Scholar]
- Pettigrew, J. D. (2001). Searching for the switch: Neural bases for perceptual rivalry alternations. Brain and Mind, 2, 85–118. [Google Scholar]
- Pettigrew, J. D. , & Miller, S. M. (1998). A ‘sticky’ interhemispheric switch in bipolar disorder? Proceedings of the Royal Society of London. Series B, Biological Sciences, 265, 2141–2148. [DOI] [PMC free article] [PubMed] [Google Scholar]
- Pfurtscheller, G. , Stancak, A., Jr. , & Neuper, C. (1996). Event‐related synchronization (ERS) in the alpha band—An electrophysiological correlate of cortical idling: A review. International Journal of Psychophysiology, 24, 39–46. [DOI] [PubMed] [Google Scholar]
- Piantoni, G. , Romeijn, N. , Gomez‐Herrero, G. , Van Der Werf, Y. D. , & Van Someren, E. J. W. (2017). Alpha power predicts persistence of bistable perception. Scientific Reports, 7 https://www.ncbi.nlm.nih.gov/pmc/articles/PMC5507912/, 5208. [DOI] [PMC free article] [PubMed] [Google Scholar]
- Podvalny, E. , Noy, N. , Harel, M. , Bickel, S. , Chechik, G. , Schroeder, C. E. , … Malach, R. (2015). A unifying principle underlying the extracellular field potential spectral responses in the human cortex. Journal of Neurophysiology, 114, 505–519. [DOI] [PMC free article] [PubMed] [Google Scholar]
- Posthuma, D. , Neale, M. C. , Boomsma, D. I. , & de Geus, E. J. C. (2001). Are smarter brains running faster? Heritability of alpha peak frequency, IQ, and their interrelation. Behavior Genetics, 31, 567–579. [DOI] [PubMed] [Google Scholar]
- Regan, M. P. , & Regan, D. (1988). A frequency domain technique for characterizing nonlinearities in biological systems. Journal of Theoretical Biology, 133, 293–317. [Google Scholar]
- Richard Clark, C. , Veltmeyer, M. D. , Hamilton, R. J. , Simms, E. , Paul, R. , Hermens, D. , & Gordon, E. (2004). Spontaneous alpha peak frequency predicts working memory performance across the age span. International Journal of Psychophysiology, 53, 1–9. [DOI] [PubMed] [Google Scholar]
- Robertson, C. E. , Kravitz, D. J. , Freyberg, J. , Baron‐Cohen, S. , & Baker, C. I. (2013). Slower rate of binocular rivalry in autism. Journal of Neuroscience, 33, 16983–16991. [DOI] [PMC free article] [PubMed] [Google Scholar]
- Ronconi, L. , & Melcher, D. (2017). The role of oscillatory phase in determining the temporal organization of perception: Evidence from sensory entrainment. The Journal of Neuroscience, 37, 10636–10644. [DOI] [PMC free article] [PubMed] [Google Scholar]
- Said, C. P. , Egan, R. D. , Minshew, N. J. , Behrmann, M. , & Heeger, D. J. (2013). Normal binocular rivalry in autism: Implications for the excitation/inhibition imbalance hypothesis. Vision Research, 77, 59–66. [DOI] [PMC free article] [PubMed] [Google Scholar]
- Samaha, J. , & Postle, B. R. (2015). The speed of alpha‐band oscillations predicts the temporal resolution of visual perception. Current Biology, 25, 2985–2990. [DOI] [PMC free article] [PubMed] [Google Scholar]
- Schulze, R. (2004). Meta‐analysis—A comparison of approaches. Cambridge, MA: Hogrefe & Huber. [Google Scholar]
- Shannon, R. W. , Patrick, C. J. , Jiang, Y. , Bernat, E. , & He, S. (2011). Genes contribute to the switching dynamics of bistable perception. Journal of Vision, 11, 8–8. [DOI] [PMC free article] [PubMed] [Google Scholar]
- Shpiro, A. , Moreno‐Bote, R. , Rubin, N. , & Rinzel, J. (2009). Balance between noise and adaptation in competition models of perceptual bistability. Journal of Computational Neuroscience, 27, 37–54. [DOI] [PMC free article] [PubMed] [Google Scholar]
- Sundareswara, R. , & Schrater, P. R. (2008). Perceptual multistability predicted by search model for Bayesian decisions. Journal of Vision, 8, 12–19. [DOI] [PubMed] [Google Scholar]
- Tan, B. , Kong, X. , Yang, P. , Jin, Z. , & Li, L. (2013). The difference of brain functional connectivity between eyes‐closed and eyes‐open using graph theoretical analysis. Computational and Mathematical Methods in Medicine, 2013, 976365 https://www.hindawi.com/journals/cmmm/2013/976365/ [DOI] [PMC free article] [PubMed] [Google Scholar]
- R Core Team (2018): R: A language and environment for statistical computing. R Foundation for Statistical Computing, Vienna, Austria: URL https://www.R-project.org/. [Google Scholar]
- Thakkar, K. N. , Antinori, A. , Carter, O. L. , & Brascamp, J. W. (2018). Altered short‐term neural plasticity related to schizotypal traits: Evidence from visual adaptation. Schizophrenia Research http://www.sciencedirect.com/science/article/pii/S0920996418302251 [DOI] [PMC free article] [PubMed] [Google Scholar]
- Ukai, K. , Ando, H. , & Kuze, J. (2003). Binocular rivalry alternation rate declines with age. Perceptual and Motor Skills, 97, 393–397. [DOI] [PubMed] [Google Scholar]
- van Loon, A. M. , Knapen, T. , Scholte, H. S. , John‐Saaltink, E. S. , Donner, T. H. , & Lamme, V. A. (2013). GABA shapes the dynamics of bistable perception. Current Biology, 23, 823–827. [DOI] [PubMed] [Google Scholar]
- VanRullen, R. , & Koch, C. (2003). Is perception discrete or continuous? Trends in Cognitive Sciences, 7, 207–213. [DOI] [PubMed] [Google Scholar]
- Vierck, E. , Porter, R. J. , Luty, S. E. , Moor, S. , Crowe, M. T. , Carter, J. D. , … Joyce, P. R. (2013). Further evidence for slow binocular rivalry rate as a trait marker for bipolar disorder. The Australian and New Zealand Journal of Psychiatry, 47, 371–379. [DOI] [PubMed] [Google Scholar]
- Voytek, B. , & Knight, R. T. (2015). Dynamic network communication as a unifying neural basis for cognition, development, aging, and disease. Biological Psychiatry, 77, 1089–1097. [DOI] [PMC free article] [PubMed] [Google Scholar]
- Voytek, B. , Kramer, M. A. , Case, J. , Lepage, K. Q. , Tempesta, Z. R. , Knight, R. T. , & Gazzaley, A. (2015). Age‐related changes in 1/f neural electrophysiological noise. The Journal of Neuroscience, 35, 13257–13265. [DOI] [PMC free article] [PubMed] [Google Scholar]
- Watanabe, T. , Masuda, N. , Megumi, F. , Kanai, R. , & Rees, G. (2014). Energy landscape and dynamics of brain activity during human bistable perception. Nature Communications, 5, 4765. [DOI] [PMC free article] [PubMed] [Google Scholar]
- Yamashiro, H. , Yamamoto, H. , Mano, H. , Umeda, M. , Higuchi, T. , & Saiki, J. (2014). Activity in early visual areas predicts interindividual differences in binocular rivalry dynamics. Journal of Neurophysiology, 111, 1190–1202. [DOI] [PMC free article] [PubMed] [Google Scholar]
- Zaretskaya, N. , Thielscher, A. , Logothetis, N. K. , & Bartels, A. (2010). Disrupting parietal function prolongs dominance durations in binocular rivalry. Current Biology, 20, 2106–2111. [DOI] [PubMed] [Google Scholar]
- Zhang, P. , Jamison, K. , Engel, S. , He, B. , & He, S. (2011). Binocular rivalry requires visual attention. Neuron, 71, 362–369. [DOI] [PMC free article] [PubMed] [Google Scholar]
Associated Data
This section collects any data citations, data availability statements, or supplementary materials included in this article.
Supplementary Materials
Figure S1 Scalp topographies of alpha amplitude during fixation for the A) exploratory sample, B) validation sample, and during rest for the C) exploratory sample, D) validation sample. Stars in A) indicate the parietooccipital electrodes (PO3, POz, PO4) over which we averaged the alpha frequency and amplitude data for the exploratory sample
Figure S2. Session‐to‐session reliability for: A) Stable percept duration. B, C) Peak alpha frequency. D, E) Alpha amplitude. F, G) 1/f slope. B,D,F) During fixation. C,E,G) During rest
Figure S3. Scalp Topographies of the intraclass coefficient (ICC) between peak alpha frequency during fixation and rest for the A) exploratory, and B) validation samples