

Abstract
Non‐manifesting carriers (NMC) of the G2019S mutation in the LRRK2 gene represent an “at risk” group for future development of Parkinson's disease (PD) and have demonstrated task related fMRI changes. However, resting‐state networks have received less research focus, thus this study aimed to assess the integrity of the motor, default mode (DMN), salience (SAL), and dorsal attention (DAN) networks among this unique population by using two different connectivity measures: interregional functional connectivity analysis and Dependency network analysis (DEPNA). Machine learning classification methods were used to distinguish connectivity between the two groups of participants. Forty‐four NMC and 41 non‐manifesting non‐carriers (NMNC) participated in this study; while no behavioral differences on standard questionnaires could be detected, NMC demonstrated lower connectivity measures in the DMN, SAL, and DAN compared to NMNC but not in the motor network. Significant correlations between NMC connectivity measures in the SAL and attention were identified. Machine learning classification separated NMC from NMNC with an accuracy rate above 0.8. Reduced integrity of non‐motor networks was detected among NMC of the G2019S mutation in the LRRK2 gene prior to identifiable changes in connectivity of the motor network, indicating significant non‐motor cerebral changes among populations “at risk” for future development of PD.
Keywords: graph theory network analysis, LRRK2, machine learning classification, Parkinson's disease, resting state fMRI
1. INTRODUCTION
Resting state functional magnetic resonance imaging (rsfMRI) has strong research and clinical appeal as it is easy to implement, requires minimum cooperation, and enables the detection of multiple brain networks. Neuroimaging studies have demonstrated the importance of several dynamically inter‐related intrinsic networks which play a role in cognitive processing and behavior. These include the default mode network (DMN), dorsal attention network (DAN), and the salience network (SAL). The DAN plays a role in executive functions including attention (Corbetta & Shulman, 2002), while the DMN is associated with self‐oriented mental activity (Raichle et al., 2001) but also plays a role in memory encoding and retrieval (Madhyastha et al., 2015). During externally directed cognitive tasks the DAN is recruited and the DMN is subdued, a pattern which is reversed during rest when internally driven processes occur (Fox et al., 2005). It has been suggested that the SAL; a limbic‐paralimbic system that facilitates goal‐directed behavior, integrates sensory data in order to afford the organism with the choice of action, thus enabling switching between these two networks which together facilitate memory (Menon & Uddin, 2010).
While Parkinson's disease (PD) is diagnosed based on cardinal motor symptoms, a long premotor stage precedes these symptoms (Siderowf & Stern, 2008). Studies of cortical and subcortical brain networks using resting state functional connectivity assessments indicate disruptions of network integrity in PD. The motor network was found to be impaired among PD patients in the “OFF” state with decreased functional connectivity between the putamen, supplementary motor area (SMA) and the dorsal lateral prefrontal cortex (DLPFC) with a compensatory increase in connectivity between the putamen and the cerebellum (Wu et al., 2009). The earliest stages of cognitive decline in PD were associated with disruption of large‐scale networks and decreased efficiency of processing (Pereira et al., 2015). Both reduced connectivity within the DMN and reduced connectivity from the substantia nigra to nodes of the DMN were detected among patients with PD and were partially restored after dopaminergic replacement treatment (Helmich et al., 2010; Tessitore et al., 2012).
Mutations in the LRRK2 are responsible for a significant burden of PD among Ashkenazi Jews (Thaler, Ash, Gan‐Or, Orr‐Urtreger, & Giladi, 2009). Decreased functional connectivity between the putamen and bilateral superior frontal gyri, precuneus, and calcarine gyrus among LRRK2‐PD compared with idiopathic PD patients has been reported (Hou et al., 2018).
Non‐manifesting carriers (NMC) of PD related mutations represent a population at an increased risk for future development of PD. Previous studies have shown the presence of subtle motor (Mirelman et al., 2011) and cognitive changes (Thaler et al., 2012) among LRRK2‐NMC compared to non‐manifesting non‐carriers (NMNC). Several task related fMRI studies have been published to date reporting findings of this cohort with both increased and decreased activations among NMC. On a Stroop task, LRRK2‐NMC recruited right sided structures while performing the task as well as NMNC (Thaler et al., 2013) while on a gambling task lower activations among LRRK2‐NMC were noted in the nucleus accumbens while anticipating punishment and higher activations in the same group while anticipating reward were detected in the right insula (Thaler et al., 2018). Reduced activation in the caudate with increased activation in the dorsal premotor cortex was noted among LRRK2‐NMC while performing a motor imagery task (van Nuenen et al., 2012) with increased functional connectivity between the dorsal premotor and the extrastirate body. Previously, assessing functional connectivity from bilateral putamen among LRRK2‐NMC using rsfMRI, we detected reduced connectivity among NMC between the right inferior parietal cortex and the dorsoposterior putamen together with increased connectivity to the ventroanterior putamen, as compared to NMNC (Helmich et al., 2015) and interpreted these finding as compensatory for presymptomatic dopamine depletion. However, no network‐wide assessment of either the motor network or cognitive related rsfMRI networks among LRRK2‐NMC has been performed to date.
The mathematical field of graph theory recently emerged as a tool for characterizing fMRI brain network features that can distinguish healthy and pathological states (Bullmore & Sporns, 2009). An essential aspect of network organization is related to its hierarchy as indicated by metrics of influence and dependency (Hutchison et al., 2013). It has been suggested that an examination of hierarchy of nodes in a network could help characterize its functional specificity (Sporns, 2011) and accurately identify the nodes (i.e., brain regions) or edges (i.e., connections between the nodes) that are most critical among specific pathologies. Dependency network analysis (DEPNA), a newly developed graph based analysis method, was used to distinguish different patterns of network hierarchy and information flow within brain networks (Jacob et al., 2016; Jacob, Gilam, Lin, Raz, & Hendler, 2018; Jacob, Shany, Goldin, Gross, & Hendler, 2018). DEPNA evaluates a brain regions' importance within a given network according to its influence over the correlations between all other pairs of brain regions (i.e., “Influencing Degree”), or how much was it influenced by the rest of the network (i.e., “Influenced Degree”).
In this study we aimed to explore the integrity of motor and cognitive resting state networks among a population at risk for future development of PD and to evaluate whether network changes could account for between‐group behavioral variations. Based on previous imaging studies, we expected to detect increased functional connectivity among these networks as a mean of compensation for latent disease related pathology in this “at risk” group of participants.
2. MATERIALS AND METHODS
2.1. Participants
Non‐manifesting first degree relatives of LRRK2‐PD patients were evaluated at the Movement Disorder Unit at Tel‐Aviv Medical Center (TLVMC). All participants provided an informed written consent, approved by the TLVMC IRB prior to DNA collection. Participants were screened for the G2019S mutation in the LRRK2 gene and underwent a comprehensive assessment comprising of clinical history, motor rating based on the Unified Parkinson's Disease Rating Scale (UPDRS‐III), Beck Depression Inventory (BDI) (cutoff of 13), University of Pennsylvania Smell Identification Test (UPSIT) and the non‐motor symptoms questionnaire (NMS). Additionally, evaluation of cognitive functions was conducted using the Montreal Cognitive Assessment test (MoCA) (cutoff of 26) and a computerized cognitive test battery (Mindstreams, NeuroTrax Corp., NY) designed to evaluate multiple cognitive domains including attention, memory, executive function and motor skills. Indices were normalized for age and years of education and are presented similarly to an IQ‐like scale (mean ± SD: 100 ± 15) (Thaler et al., 2012). Participants and assessors were unaware of genetic status at the time of the assessment. Exclusion criteria included: clinical diagnosis of PD, other neurological diseases (such as severe head trauma, stroke or history of psychiatric disease treated with neuroleptics), general exclusion criteria for MRI scanning (such as claustrophobia, pace‐maker, and implanted metal parts) and mutations in the GBA gene.
Means and SDs were calculated for all dependent variables. Histograms and frequency distributions were constructed to evaluate the normality and homogeneity of the dependent variables. p‐values reported are based on two‐tailed comparisons, with significance levels set at 0.05. Statistical analysis was performed with SPSS version 20 (SPSS Inc., Chicago, IL).
2.2. Image acquisition
During scanning, all subjects were asked to keep their eyes closed and to avoid repetitive thoughts. All scans were visually inspected by a neurologist (AT) to exclude structural findings that could interfere with the analysis. Imaging was performed on a GE 3 T Signa HDxt scanner (GE Signa EXCITE, Milwaukee, WI) with a resonant gradient echoplanar imaging system, using a standard 8‐channel head coil. Each subject received an anatomical scan (spoiled gradient echo sequence: field of view 250 × 250 mm; matrix size 256 × 256 mm; voxel size 0.98 × 0.98 mm; repetition time = 59 ms; echo time = 3.6 ms) and 266 functional scans (single‐shot gradient echoplanar imaging sequence: echo time/repetition time = 35/1, 680 milliseconds; 30 axial slices; voxel size = 3.1 × 3.1 × 3.5 mm; no gap; scanning time approximately 7.5 min; 266 images).
2.3. Preprocessing of imaging data
Data was preprocessed and analyzed with SPM12 (Statistical Parametric Mapping, http://www.fil.ion.ucl.ac.uk/spm). Images were spatially realigned, slice‐time corrected, normalized to Montreal Neurological Institute (MNI) space using unified segmentation, and smoothed with an isotropic 8‐mm full width at half maximum gaussian kernel. Scans with head motion >3 mm/3° in any direction were removed from the analysis. The six translation and rotation motion parameters, white matter, and cerebral spinal fluid nuisance regressors were removed (Chao‐Gan & Yu‐Feng, 2010; Fox et al., 2005). We then low‐pass filtered the images using a fifth‐order Butterworth filter to retain frequencies below 0.08 Hz, because correlations between intrinsic fluctuations are specifically found in this frequency range (Chao‐Gan & Yu‐Feng, 2010).
2.4. Networks of interest
The coordinates of the networks of interest were extracted from previous studies assessing networks among non‐demented patients with PD (Wu, Wang, et al., 2009) (Campbell et al., 2015) (Supporting Information Table S1). The motor network included bilateral primary motor cortex (M1), cerebellum, premotor, putamen, thalamus, globus pallidum, parietal, and dorsolateral prefrontal regions. The DMN included bilateral inferior temporal and lateral parietal regions, posterior cingulate cortex and medial prefrontal regions. The SAL was made up of bilateral insula, prefrontal cortex, and lateral parietal regions, while the DAN included bilateral middle temporal, frontal eye fields, and both anterior and posterior intraparietal sulci.
Each region of interest (ROI) Talairach space coordinates (Campbell et al., 2015; Wu et al., 2009) was transferred to MNI coordinates using the Brett transform (Brett, Johnsrude, & Owen, 2002). For each ROI we created an 8 mm radius spherical mask centered on the peak x, y, z MNI coordinates. Then the averaged BOLD signal (time series) across all voxels within the sphere was extracted for each ROI and each subject.
2.5. Interregional functional connectivity analysis
To analyze the functional connectivity within the networks of interest, a set of pairwise Pearson correlation values were calculated for each subject and network. After a Fisher Z transformation, two‐tailed t statistics were computed to compare the two groups of participants. Pairwise ROIs were assessed with connections determined as significant at the p < 0.05 level and corrected for multiple comparisons using false discovery rate (FDR) (Shapira‐Lichter, Oren, Jacob, Gruberger, & Hendler, 2013).
2.6. Dependency network analysis
We implemented the DEPNA approach to differentiate changes in hierarchy of effective connectivity within the networks of interest between the two groups. DEPNA and its implementation are described in detail (Jacob et al., 2016). This method evaluates a brain region's centrality within a given network according to its correlation influence, namely the impact of a given region on the correlations between all other pairs of nodes. The DEPNA features characteristics and interpretations are described in the Supporting Information Table S2.
Briefly, the DEPNA “Influencing Degree” measure indicates the hierarchy of out‐degree influence of the region on the entire network. The higher this measure is, the greater its impact on all other connections in the network and the more likely it is to be generating the information flow in the network.
The pairwise ROIs Pearson correlations were calculated and normalized by using a Fisher Z transformation. Next, we used the resulting normalized ROI correlations to compute partial correlations. The partial correlation coefficient is a statistical measure indicating how a third variable influences the correlation between two other variables. Therefore, the relative effect of region j on the correlation is given by:
| (1) |
WhereC(i, j),C(i, k) and C(k, j) are the ROI‐ROI correlations and PC(i, k| j) is the partial correlation between regions i and k with respect to a third region j. To avoid cases where we sum over positive and negative influences, we reset all negative values to zero. We then define the total influence of region j on region i to be:
| (2) |
N is the number of nodes in the network. The regions dependencies define a dependency matrix D whose (i, j) element is the influence of region j on region i.
Next, we sorted the regions according to the system level influence of each region on the correlations between all other region pairs. The system level “Influencing Degree” of region j is simply defined as the sum of the influence of region j on all other regions i, that is:
| (3) |
In the same manner, regions exhibiting a high “Influenced Degree” are more likely to be simultaneously influenced by many other regions. An increased “Influenced Degree” pattern of the entire network indicates the extent of the integration (i.e., all regions are more influenced by all other regions).
The influence of the network on region j is defined as the sum of the influences (or dependencies) of all other regions i in the network on region j, that is:
| (4) |
Next, we conducted a between‐group two‐tailed independent t‐test for each region's influence degree, adjusting for age. All results in each network were corrected for multiple comparisons using FDR correction.
To create network graph visualization, we used the pair‐wise dependency connectivity matrix. A two‐tailed t statistic was computed to compare the two groups. We then connect only pair‐wise ROIs with dependencies that were significantly different between the two groups (p < 0.05 level) creating a simple graph visualization of the differences between the groups. The brain visualization of the graph was conducted with the BrainNet Viewer (2013, http://www.nitrc.org/projects/bnv/).
We then conducted Pearson‐product correlations to assess the association between the regions that were found to be significantly different between the groups and network‐specific behavioral measures. A partial correlation was used to control for age as a covariate. We then corrected for multiple comparisons using FDR corrected at a p = 0.05 per network.
2.7. Classification using machine learning
Support vector machine (SVM) classifiers, a widely used machine learning classification algorithm (LaConte, Strother, Cherkassky, Anderson, & Hu, 2005), were used for between group classification using Matlab Classification Learner application (The MathWorks Inc., Natick, MA). All networks' statistically significant results (i.e., interregional correlation, “Influencing Degree” and “Influenced Degree” values) were all used as predictors for the machine learning classification, constructing a total of 38 features. No dimension reduction was conducted. We then assessed the generalization ability through fivefold cross‐validation. For statistical significance we run the analysis multiple times; in this study 1,000 repetitions were performed. The overall accuracy, sensitivity, specificity, and positive predictive value (PPV) were computed for each classifier; the overall accuracy is the number of true classifications to total cohort; sensitivity is the number of true positives (i.e., NMC correctly classified) to the total number of carriers; specificity is the number of true negatives (i.e., NMC correctly classified) to the total number of NMC; the positive predictive value (PPV) is the ratio of the true positives to all positive classifications (i.e., true and false positives), additional information is supplied in the Supporting Information.
3. RESULTS
A total of 85 non‐manifesting first degree relatives of G2019S LRRK2‐PD patients participated in this study, 44 of which were NMC. Groups were well matched for all parameters assessed herein (Table 1). While the average MoCA scores were above 26 in both groups, SD varied between 2 and 3 point suggesting that several participants might have mild cognitive impairment (MCI), however none of the participants demonstrated reduced cognitive performance on the computerized cognitive assessment, hence, we are confident that all participants had intact cognitive capabilities.
Table 1.
Group characteristics
| LRRK2_NMC | NMNC | p | |
|---|---|---|---|
| N | 44 | 41 | |
| Male/female | 22/22 | 18/23 | 0.66 |
| Handedness (right/left) | 39/5 | 38/3 | 0.71 |
| Age (years) | 49.57 (11.11) | 48.05 (12.71) | 0.55 |
| Years of education | 16.14 (2.69) | 16.39 (2.06) | 0.63 |
| UPDRS III | 2.09 (1.97) | 1.83 (1.59) | 0.51 |
| MoCA | 26.36 (2.93) | 26.54 (2.23) | 0.76 |
| UPSIT | 31.61 (4.29) | 33.13 (3.02) | 0.89 |
| GCS | 102.41 (7.05) | 103.03 (6.65) | 0.68 |
| Memory | 99.81 (9.61) | 102.58 (6.89) | 0.14 |
| EF | 102.46 (10.61) | 102.18 (10.06) | 0.91 |
| Attention | 102.28 (13.66) | 106.48 (12.42) | 0.14 |
| VS | 101.49 (13.36) | 99.55 (10.84) | 0.42 |
| Motor | 106.35 (6.87) | 105.56 (6.92) | 0.61 |
| BDI | 1.85 (2.08) | 1.71 (3.33) | 0.81 |
| NMS | 2.69 (2.22) | 3.63 (3.01) | 0.26 |
Note. Results are presented as mean (SD). p values reported are based on two‐tailed comparisons, with significance levels set at 0.05. Statistical analysis was performed with SPSS version 20 (SPSS Inc., Chicago, IL). NMC: non‐manifesting carriers, NMNC: non‐manifesting non‐carriers, UPDRS III: unified Parkinson disease rating scale, MoCA: montreal cognitive assessment, UPSIT: University of Pennsylvania Smell Identification Test, GCS: general cognitive score, EF: executive function, VS: visuospatial, BDI: beck depression inventory, NMS: non‐motor symptoms.
3.1. Interregional functional connectivity analysis
Assessing the motor network between the two groups of subjects did not yield significant differences in interregional functional connectivity. DMN network analysis indicated lower correlations between the right inferior temporal (IT) and posterior cingulate cortex (PCC) in the NMC compared with NMNC (Figure 1a and Supporting Information Table S3) (t[83] = 3.74, p < 0.05 FDR corrected). SAL analysis revealed comprehensive overall lower correlations among the NMC compared with NMNC (Figure 1b and Supporting Information Table S3). Finally, the DAN network analysis exhibited lower correlation of the left anterior intraparietal sulcus (AIS) with the left frontal eye field (FEF) (t[83] = 3. 75, p < 0.05 FDR corrected), and both left and right posterior intraparietal sulcus (PIS) (t[83] = 3.11 and t[83] = 3.01 respectively, p < 0.05 FDR corrected) among NNC compared with NMNC (Figure 1c and Supporting Information Table S3).
Figure 1.
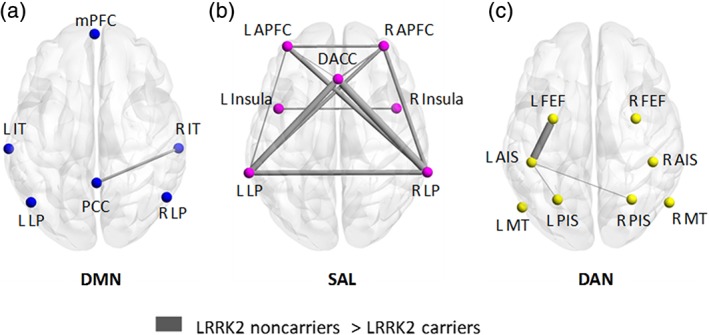
Interregional functional connectivity. Significant differences between the degree of correlations of each pair of network nodes within the default mode network (DMN) (a), salience network (SAL) (b) and dorsal attention network (DAN) (c) (p < 0.05, FDR corrected). The width of the edge represents the t statistic value. Non‐manifesting non‐carriers exhibited stronger connectivity between central nodes within all three networks and most prominently in the SAL network [Color figure can be viewed at https://wileyonlinelibrary.com]
3.2. Dependency network analysis
Applying the DEPNA to the motor network did not detect significant between group differences. The same analysis which was performed on the DMN network revealed that the difference in each node's “Influencing Degree” (Figure 2 and Supporting Information Table S4) indicated the PCC (t[83] = 2.52, p < 0.05 FDR corrected) and right IT (t[83] = 3.15, p < 0.05 FDR corrected) had lower influence on the network among NMC compared to NMNC. However, the “Influenced Degree” measures were not significantly different between the groups (Supporting Information Table S4).
Figure 2.
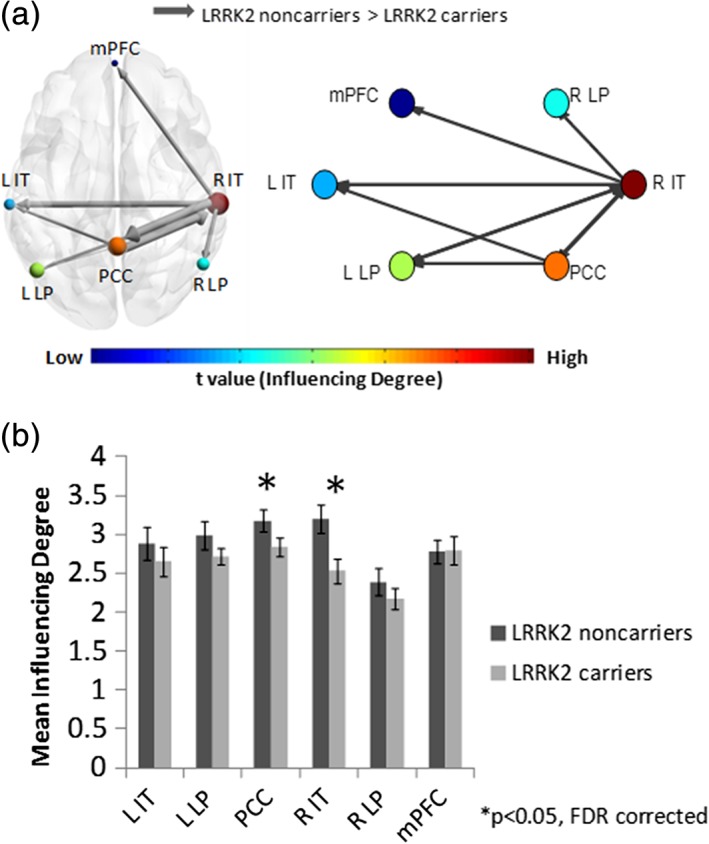
Default mode network (DMN) DEPNA results. (a) The DMN illustration and graph visualization. Each region is color coded according to the t statistic value based on the t‐test between the two groups' “influencing degree”. All pair‐wise regions of interest with connections, significant at p < 0.05 level (FDR corrected), are plotted as edges with the width of the edge representing the t statistic value. (b) The regions' “influencing degree” averaged over all 44 non‐manifesting carriers (NMC) and 41 non‐manifesting non‐carriers (NMNC). The DEPNA DMN analysis detected significant lower right inferior temporal and posterior cingulate cortex influence among NMC [Color figure can be viewed at https://wileyonlinelibrary.com]
Analysis of the SAL revealed that NMC exhibited reduced influence (i.e., “Influencing Degree”) of left and right anterior prefrontal cortex (APFC) (t[83] = 2.99 t[83] = 3.27), left and right lateral parietal (LP) (t[83] = 4.47 and t[83] = 5.80) and dorsal anterior cingulate cortex (DACC) (t[83] = 3.07), all FDR corrected p < 0.05) (Figure 3a and Supporting Information Table S4). A comparison of the “Influenced Degree” measure revealed that, compared to NMNC, NMC showed lesser “Influenced Degree” values for the entire SAL: bilateral APFC, bilateral LP, bilateral insula, and DACC, all FDR corrected (p < 0.05) (Figure 3b and Supporting Information Table S4).
Figure 3.
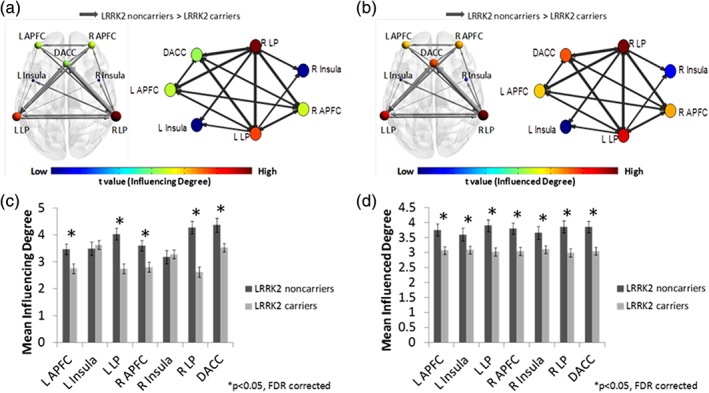
Salience network (SAL) DEPNA results. The SAL illustration and graph visualization. Each region is color coded according to the t statistic value based on the t‐test between the two groups' “influencing degree” (a) and “influenced degree” (b). All pair‐wise regions of interest with connections, significant at p < 0.05 level (FDR corrected), are plotted as edges with the width of the edge representing the t statistic value. The regions' “influencing degree” (c) and “influenced degree” (d) averaged over all 44 non‐manifesting carriers (NMC) and 41 non‐manifesting non‐carriers (NMNC). Most of the SAL network was less influenced among NMC [Color figure can be viewed at https://wileyonlinelibrary.com]
A comparison of the DAN network “Influencing Degree” measures between the two groups showed that NMC exhibited lesser influencing relative to NMNC in the left AIS (t[83] = 3.39, p < 0.05 FDR corrected) (Figure 4a and Supporting Information Table S4). Comparison of the “Influenced Degree” measures revealed that, compared to NMNC, NMC showed lesser “Influenced Degree” values for the entire DAN network: bilateral medial temporal (MT), bilateral AIS, bilateral PIS, and bilateral FEF, all FDR corrected (p < 0.05) (Figure 4b and Supporting Information Table S4).
Figure 4.
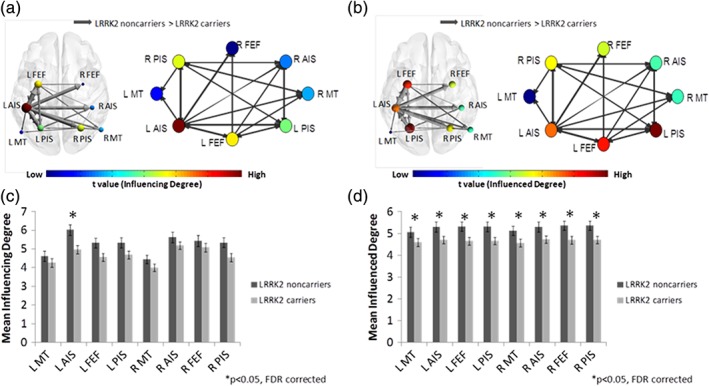
Dorsal attention network (DAN) DEPNA results. The DAN illustration and graph visualization. Each region is color coded according to the t statistic value based on the t‐test between the two groups' “influencing degree” (a) and “influenced degree” (b). All pair‐wise regions of interest with connections, significant at p < 0.05 level (FDR corrected), are plotted as edges with the width of the edge representing the t statistic value. The regions' “influencing degree” (c) and “influenced degree” (d) averaged over all 44 non‐manifesting carriers (NMC) and 41 non‐manifesting non‐carriers (NMNC). NMC had lower left anterior intraparietal sulcus influence within the DAN. In addition, the entire DAN network was less influenced among NMC [Color figure can be viewed at https://wileyonlinelibrary.com]
3.3. Behavioral correlations
Behavior correlations between the attention sub‐score of the neurotrax program and connectivity measures of the SAL were found to be significant among NMC (controlled for age and FDR corrected at a p = 0.05 per network), with higher connectivity measures correlating with better attention. For the DEPNA analysis “Influencing Degree” of the following regions left APFC (r = 0.399, p = 0.01), left LP (r = 0.422, p = 0.01), right APFC (r = 0.461, p = 0.01) and the “Influenced Degree” of the left APFC (r = 0.479, p = 0.001), left insula (r = 0.468, p = 0.002), left LP (r = 0.512, p = 0.001), right APFC (r = 0.492, p = 0.001), right insula (r = 0.551, p = 0.001), right LP (r = 0.525, p = 0.001) and DACC (r = 0.512, p = 0.001). The attention sub‐score was also correlated with the following connectivity measures of the SAL: connectivity between the right and left insula (r = 0.473, p = 0.005), connectivity between the right APFC and the left LP (r = 0.443, p = 0.01) and connectivity between the right LP and right APFC (r = 0.546, p = 0.001). No correlations between the attention sub‐score and connectivity measures of the other two networks (DAN, DMN) were detected and no correlations between these measures among NMNC participants were detected.
3.4. Machine learning classification using interregional functional connectivity and DEPNA
The machine learning linear SVM algorithm using the DEPNA influence values and all the significant interregional functional connectivity values per network (DMN, SAL and DAN) (a total of 38 features) revealed significant classification power (Figure 5). The overall accuracy was 84% (0.84 ± 0.023, p < 0.001), with sensitivity of 87% (0.87 ± 0.034, p < 0.001) and specificity of 80% (0.80 ± 0.029, p < 0.001). The positive predictive values for the NMNC were 86% (0.86 ± 0.034, p < 0.001) and for the NMC 83% (0.83 ± 0.022, p < 0.001).
Figure 5.
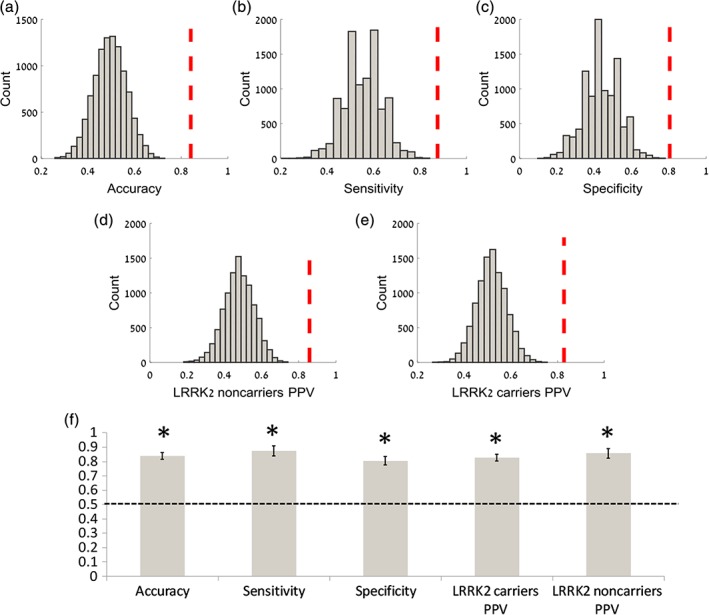
Classification between non‐manifesting carriers and non‐manifesting non‐carriers using a support vector machine algorithm. In order to discriminate between non‐manifesting carriers (NMC) and non‐manifesting non‐carriers (NMNC) a support vector machine (SVM) learning classification algorithm was performed on the inter‐regional functional connectivity and DEPNA results (fivefold cross‐validation and 1,000 repetitions). For statistical inference a bootstrapping procedure of permutation tests was conducted 1,000 times on random permutations of the dataset for the classification overall accuracy (a), sensitivity (b), specificity (c) and positive predictive value (PPV) of NMNC (d) and NMC (e). The dashed red vertical lines represent the classification accuracy of the original dataset. The bar graph demonstrates the averaged classification accuracy features for the SVM classifier calculated on 1,000 repetitions (f). The horizontal dashed line denotes the chance level accuracy of 50% and the error bars represent the standard deviation. This analysis revealed significant classification power with an overall accuracy of 84%, (p < 0.0001), sensitivity of 87% (p < 0.0001) and specificity of 80% (p < 0.0001). The PPV was found to be significant for both groups NMC (83% p < 0.0001) and NMNC (86% p < 0.0001) [Color figure can be viewed at https://wileyonlinelibrary.com]
The top 10 most informative features for disambiguating the groups according to their weights were: (a) DAN networks' correlation between right posterior parietal sulcus (PPS) and left anterior parietal sulcus (APS), (b) DAN networks' left AIS “Influencing Degree,” (c) SAL networks' correlation between the right LP and right APFC, (d) SAL networks' correlation between DACC and left APFC, (e) SAL networks' left LP “Influenced Degree,” (f) SAL networks' correlation between DACC and right LP, (g) DAN networks' correlation between left FEF and left APS, (h) SAL networks' DACC “Influencing Degree,” (i) SAL networks' DACC “Influenced Degree,” and (j) DAN networks' left FEF “Influenced Degree.”
4. DISCUSSION
This resting state fMRI study detected significant differences between NMC of the G2019S mutation in the LRRK2 gene and NMNC in three neural networks (dorsal attention, salience, and default) using two separate analytic methods. The detected differences were characterized with higher network organization and nodal influence among NMNC compared with NMC. In contrast, no significant differences were found between the two groups in the organization of the motor network.
The DMN has been extensively studied in PD and aberrant intrinsic connectivity has been associated with cognitive impairments, with the most frequently described connectivity changes involving the posterior nodes of the network (Hou et al., 2017; van Eimeren, Monchi, Ballanger, & Strafella, 2009), similar to the reduced influence and connectivity of the right inferior temporal node and the PCC among LRRK2‐NMC that was detected in this study. Connectivity changes in the DMN were found to precede both cognitive decline and structural atrophy in PD (Tessitore et al., 2012), but in the current study connectivity measures of the DMN did not correlate with measures of attention among NMC or NMNC. To this end, we recently published a cortical thickness analysis on the same cohort of participants that did not detect significant differences between NMNC and NMC (Thaler et al., 2018), indicating that as in PD, the connectivity differences encountered in this study were not associated with structural changes in our cohort.
The SAL was found to have the most widespread between‐group differences using both connectivity analyses, with all nodes of this network involved. These results were correlated with attention allocation among NMC, indicating that higher organization and nodal influence among this “at risk” group of participants was associated with better behavioral outcomes. Decreased connectivity within the SAL network was detected in patients with PD and was correlated with motor dysfunction (Tuovinen et al., 2018) possibly through impairment of regulatory efficiency between activation and deactivation of other large scale networks.
Analysis of the differences in “Influenced Degree” showed that the NMC had overall lower values for the entire SAL and DAN networks (Figures 3 and 4). This pattern of decreased “Influenced Degree” within all network regions indicates segregation of the network (i.e., these regions were found to be less influenced by one another and overall), suggesting that these regions act in a more independent manner, which might imply poor regulation.
No significant between‐group differences in the motor network were detected in this study. Using resting state fMRI scans on a subgroup of the participants from this study, we previously reported opposing functional connectivity patterns from both the anterior and posterior putamen to the inferior parietal lobe among NMC (Helmich et al., 2015), similar to the pattern that was detected among patients with PD (Helmich et al., 2010) indicating that dopaminergic depletion in the striatum influences cortico‐striatal remapping in the motor network in a compensatory manner. In addition, previous task‐related fMRI findings on subgroups of participants from this study, also detected increased activations and functional connectivity as a mean of compensation among NMC (Thaler et al., 2013; van Nuenen et al., 2012). Reduced connectivity from the motor striatum to the precuneus and superior parietal lobe and from the executive striatum to the superior frontal gyrus together with increased connectivity from the substantia nigra to the occipital pole were detected among NMC of different LRRK2 mutation compared with NMNC in an atlas based analysis (Vilas, Segura et al., 2016). Among Parkin and PARK1‐NMC, performing a simple internally cued motor task, stronger functional connectivity was detected between task positive regions in the right rostral cingulate and left dorsal premotor area with contralateral cortical motor regions compared with NMNC (Buhmann et al., 2005).
However, in this study, NMC demonstrated reduced connectivity and nodal influence in all three assessed networks compared with NMNC, with no increased connectivity findings. Notwithstanding, the robust finding of decreased connectivity among NMC in the three networks assessed in this study compared with NMNC deserve attention especially when compared to the task related increase in connectivity among NMC that was previously detected (Thaler et al., 2013; Thaler, Gonen, et al., 2018; van Nuenen et al., 2012). These differences are not necessarily conflicting as they are a result of different analytic procedures; a seed‐based approach for assessing the motor network compared with an inter‐regional approach that was conducted in this study and the use of a resting state scan in this study compared with a task‐based assessment in the previous studies.
We propose that the connectivity changes detected herein could cause deficits in the ability to redirect attention. These attention deficits were not sufficiently severe as to impair behavior, with total attention scores not differing between the two groups. However positive correlations between the attention sub‐score and connectivity indexes in the SAL among NMC indicate a functional role of these findings.
Our results indicate that cognitive networks (SAL, DAN, and DMN) might be affected before the motor network among “at risk” populations for future development of PD. Indeed, a lengthy premotor period is recognized to precede the appearance of motor symptoms of PD (Siderowf & Stern, 2008). The prevalence of cognitive impairment in early PD has been reported to be up to 30% (Weintraub et al., 2015) and subjects “at risk” for future development of PD based on the presence of hyposmia and abnormal DAT scans, demonstrated reduced global cognitive function and executive abilities (Chahine et al., 2016). The mechanism behind this finding is not yet clear, but abnormalities in both noradrenergic and cholinergic pathways have been found to be related to cognitive decline in PD (Hilker et al., 2005; Trillo et al., 2013). Our findings may indicate that cognition should be studied as a premotor symptom of PD and that the use of fMRI technology could assist in this endeavor. To this aim, we suggest that future studies focused on PD biomarkers should include both resting‐state fMRI and extensive cognitive evaluations to better characterize the prodromal cognitive profile.
Most rsfMRI studies to date have been based on the pair‐wise correlation matrix resulting in undirected graphs of brain networks (Bullmore & Sporns, 2009). Other studies have applied Granger causality on resting state fMRI data in order to construct directed graphs (Liao et al., 2011) with the constraint of the temporal resolution required by the Granger methodology. DEPNA offers a new way of constructing a directed graph that is based on correlations. This is of great importance in the field of neuroimaging such as fMRI in which the only information regarding communication between regions is based on correlations.
Finally, to demonstrate the applicability of rsfMRi for early distinction of PD risk, we conducted a machine learning classification algorithm (i.e., SVM) applying the DEPNA and interregional functional connectivity features as the predictors. This analysis with all significant between‐group network indices, revealed a high classification power, with overall accuracy of 84% (Figure 5). Other network features (e.g., global efficiency, clustering coefficients) or imaging features (e.g., activation) could complement the predictive model for even more robust clinical translation.
Several limitations need to be addressed. This was a cross‐sectional study which compared NMC with NMNC, a population at risk for future development of PD, however the penetrance of the G2019S is estimated at 25% at age 80 (Lee et al., 2017) introducing interpretational issues to our findings. The lack of longitudinal follow‐up prevents us from fully assessing the findings in the context of disease development and should be amended by following up this unique cohort of subjects. In addition, we did not include a LRRK2‐PD group and NMNC might not be an ideal control group (Mestre et al., 2018). We did not assess structural differences in this study as we have previously reported no between group differences in cortical thickness, voxel based morphometry and diffusion tract imaging (Thaler et al., 2014; Thaler, Kliper, et al., 2018). In addition, we did not assess language abilities as part of the cognitive battery and thus might have overlooked between group differences.
Our study indicates that fMRI and resting state analysis can be used to identify alterations in cerebral functions in individuals at an increased risk for future development of PD while their cognitive processes are unaffected on a behavioral level. In addition, we detected impaired cognitive networks among NMC while the motor network functioned comparably to NMNC. Future longitudinal studies should incorporate resting state fMRI to further assess the utility and validity of these results.
AUTHOR CONTRIBUTIONS
YJ—conception, statistical analysis, design, manuscript preparation. KRK, AM,TH—conception, execution, review of manuscript. TG—review of manuscript. RCH—review of manuscript. BRB—review of manuscript. AOU—review of manuscript. NG—review of manuscript. AT—conception, organization, execution, manuscript preparation.
Supporting information
Supplementary Table S1 – Region of Interest MNI Coordinates
Table S2 Summary of DEPNA measures‐ details and characteristics
Table S3 – Interregional functional connectivity results
Table S4 ‐ DEPNA results
ACKNOWLEDGMENTS
TG—Reports receiving funding for travel and speaker honoraria from the National Parkinson Foundation, Solvay pharmaceuticals, TEVA, RAFA, Medtronic, Novartis, Medison, Allergan, GlaxoSmithKline, Perrigo and Intecpharma. RCH—Reports research support from the Dutch Brain Foundation. BRB—Reports serving on the advisory board of UCB, Zambon. Serving on the editorial board of the Journal of Parkinson's Disease. Receiving grants from the NPF, MJFF, Stichting International Parkinson Fonds, Hersenstichting, ZonMw. AOU—Reports receiving research support from the Israeli Science Foundation Legacy Heritage Fund, the Chief Scientist Department of Health, Israel, the ALS Association USA and the Kahn Foundation Israel. NG—Reports serving on the advisory boards of Teva‐Lundbeck, NeuroDerm, Intec Pharma and Chairing the Data monitoring safety committee of Teva LTD. Receiving funding for travel and honoraria from Teva‐Lundbeck, UCB and NeuroDerm. Serving on the editorial board of the Journal of Parkinson's Disease. Being a consultant for LTI, NeuroDerm and Intec Pharma. Receiving grants from the NPF, Israeli Science Foundation, NIH, MJFF, EU FP7. AM—Reports receiving funding from the National Parkinson Foundation. TH—Reports funding from the I‐CORE program and The Israel Science Foundation. AT—Reports receiving honoraria from Abbvie.
Jacob Y, Rosenberg‐Katz K, Gurevich T, et al. Network abnormalities among non‐manifesting Parkinson disease related LRRK2 mutation carriers. Hum Brain Mapp. 2019;40:2546–2555. 10.1002/hbm.24543
Funding information Michael J. Fox Foundation for Parkinson's Research
REFERENCES
- Brett, M. , Johnsrude, I. S. , & Owen, A. M. (2002). The problem of functional localization in the human brain. Nature Reviews. Neuroscience, 3(3), 243–249. [DOI] [PubMed] [Google Scholar]
- Buhmann, C. , Binkofski, F. , Klein, C. , Buchel, C. , van Eimeren, T. , Erdmann, C. , … Siebner, H. R. (2005). Motor reorganization in asymptomatic carriers of a single mutant Parkin allele: A human model for presymptomatic parkinsonism. Brain, 128(10), 2281–2290. [DOI] [PubMed] [Google Scholar]
- Bullmore, E. , & Sporns, O. (2009). Complex brain networks: Graph theoretical analysis of structural and functional systems. Nature Reviews. Neuroscience, 10(3), 186–198. [DOI] [PubMed] [Google Scholar]
- Campbell, M. C. , Koller, J. M. , Snyder, A. Z. , Buddhala, C. , Kotzbauer, P. T. , & Perlmutter, J. S. (2015). CSF proteins and resting‐state functional connectivity in Parkinson disease. Neurology, 84(24), 2413–2421. [DOI] [PMC free article] [PubMed] [Google Scholar]
- Chahine, L. M. , Weintraub, D. , Hawkins, K. A. , Siderowf, A. , Eberly, S. , Oakes, D. , … Investigators, P. (2016). Cognition in individuals at risk for Parkinson's: Parkinson associated risk syndrome (PARS) study findings. Movement Disorders, 31(1), 86–94. [DOI] [PMC free article] [PubMed] [Google Scholar]
- Chao‐Gan, Y. , & Yu‐Feng, Z. (2010). DPARSF: A MATLAB toolbox for "pipeline" data analysis of resting‐state fMRI. Frontiers in Systems Neuroscience, 4, 13. [DOI] [PMC free article] [PubMed] [Google Scholar]
- Corbetta, M. , & Shulman, G. L. (2002). Control of goal‐directed and stimulus‐driven attention in the brain. Nature Reviews. Neuroscience, 3(3), 201–215. [DOI] [PubMed] [Google Scholar]
- Fox, M. D. , Snyder, A. Z. , Vincent, J. L. , Corbetta, M. , Van Essen, D. C. , & Raichle, M. E. (2005). The human brain is intrinsically organized into dynamic, anticorrelated functional networks. Proc Natl Acad Sci U S A, 102(27), 9673–9678. [DOI] [PMC free article] [PubMed] [Google Scholar]
- Helmich, R. C. , Derikx, L. C. , Bakker, M. , Scheeringa, R. , Bloem, B. R. , & Toni, I. (2010). Spatial remapping of Cortico‐striatal connectivity in Parkinson's disease. Cereb Cortex, 20, 1175–1186. [DOI] [PubMed] [Google Scholar]
- Helmich, R. C. , Thaler, A. , van Nuenen, B. F. , Gurevich, T. , Mirelman, A. , Marder, K. S. , … Toni, I. (2015). Reorganization of corticostriatal circuits in healthy G2019S LRRK2 carriers. Neurology, 84(4), 399–406. [DOI] [PMC free article] [PubMed] [Google Scholar]
- Hilker, R. , Thomas, A. V. , Klein, J. C. , Weisenbach, S. , Kalbe, E. , Burghaus, L. , … Heiss, W. D. (2005). Dementia in Parkinson disease: Functional imaging of cholinergic and dopaminergic pathways. Neurology, 65(11), 1716–1722. [DOI] [PubMed] [Google Scholar]
- Hou, Y. , Luo, C. , Yang, J. , Ou, R. , Liu, W. , Song, W. , … Shang, H. (2017). Default‐mode network connectivity in cognitively unimpaired drug‐naive patients with rigidity‐dominant Parkinson's disease. Journal of Neurology, 264(1), 152–160. [DOI] [PubMed] [Google Scholar]
- Hou, Y. , Luo, C. , Yang, J. , Ou, R. , Song, W. , Chen, Y. , … Shang, H. (2018). Altered intrinsic brain functional connectivity in drug‐naive Parkinson's disease patients with LRRK2 mutations. Neurosci Lett, 675, 145–151. [DOI] [PubMed] [Google Scholar]
- Hutchison, R. M. , Womelsdorf, T. , Allen, E. A. , Bandettini, P. A. , Calhoun, V. D. , Corbetta, M. , … Chang, C. (2013). Dynamic functional connectivity: Promise, issues, and interpretations. NeuroImage, 80, 360–378. [DOI] [PMC free article] [PubMed] [Google Scholar]
- Jacob, Y. , Gilam, G. , Lin, T. , Raz, G. , & Hendler, T. (2018). Anger modulates influence hierarchies within and between emotional reactivity and regulation networks. Frontiers in Behavioral Neuroscience, 12, 60. [DOI] [PMC free article] [PubMed] [Google Scholar]
- Jacob, Y. , Shany, O. , Goldin, P. R. , Gross, J. J. , & Hendler, T. (2018). Reappraisal of interpersonal criticism in social anxiety disorder: A brain network hierarchy perspective. Cereb Cortex. 10.1093/cercor/bhy181. [Epub ahead of print] [DOI] [PMC free article] [PubMed] [Google Scholar]
- Jacob, Y. , Winetraub, Y. , Raz, G. , Ben‐Simon, E. , Okon‐Singer, H. , Rosenberg‐Katz, K. , … Ben‐Jacob, E. (2016). Dependency network analysis (DEPNA) reveals context related influence of brain network nodes. Scientific Reports, 6, 27444. [DOI] [PMC free article] [PubMed] [Google Scholar]
- LaConte, S. , Strother, S. , Cherkassky, V. , Anderson, J. , & Hu, X. (2005). Support vector machines for temporal classification of block design fMRI data. NeuroImage, 26(2), 317–329. [DOI] [PubMed] [Google Scholar]
- Lee, A. J. , Wang, Y. , Alcalay, R. N. , Mejia‐Santana, H. , Saunders‐Pullman, R. , Bressman, S. , … Michael, J. F. L. C. C. (2017). Penetrance estimate of LRRK2 p.G2019S mutation in individuals of non‐Ashkenazi Jewish ancestry. Mov Disord, 32, 1432–1438. [DOI] [PMC free article] [PubMed] [Google Scholar]
- Liao, W. , Ding, J. , Marinazzo, D. , Xu, Q. , Wang, Z. , Yuan, C. , … Chen, H. (2011). Small‐world directed networks in the human brain: Multivariate granger causality analysis of resting‐state fMRI. NeuroImage, 54(4), 2683–2694. [DOI] [PubMed] [Google Scholar]
- Madhyastha, T. M. , Askren, M. K. , Zhang, J. , Leverenz, J. B. , Montine, T. J. , & Grabowski, T. J. (2015). Group comparison of spatiotemporal dynamics of intrinsic networks in Parkinson's disease. Brain, 138(9), 2672–2686. [DOI] [PMC free article] [PubMed] [Google Scholar]
- Menon, V. , & Uddin, L. Q. (2010). Saliency, switching, attention and control: A network model of insula function. Brain Structure & Function, 214(5–6), 655–667. [DOI] [PMC free article] [PubMed] [Google Scholar]
- Mestre, T. A. , Pont‐Sunyer, C. , Kausar, F. , Visanji, N. P. , Ghate, T. , Connolly, B. S. , … Marras, C. (2018). Clustering of motor and nonmotor traits in leucine‐rich repeat kinase 2 G2019S Parkinson's disease nonparkinsonian relatives: A multicenter family study. Movement Disorders, 33(6), 960–965. [DOI] [PubMed] [Google Scholar]
- Mirelman, A. , Gurevich, T. , Giladi, N. , Bar‐Shira, A. , Orr‐Urtreger, A. , & Hausdorff, J. M. (2011). Gait alterations in healthy carriers of the LRRK2 G2019S mutation. Annals of Neurology, 69(1), 193–197. [DOI] [PubMed] [Google Scholar]
- Pereira, J. B. , Aarsland, D. , Ginestet, C. E. , Lebedev, A. V. , Wahlund, L. O. , Simmons, A. , … Westman, E. (2015). Aberrant cerebral network topology and mild cognitive impairment in early Parkinson's disease. Human Brain Mapping, 36(8), 2980–2995. [DOI] [PMC free article] [PubMed] [Google Scholar]
- Raichle, M. E. , MacLeod, A. M. , Snyder, A. Z. , Powers, W. J. , Gusnard, D. A. , & Shulman, G. L. (2001). A default mode of brain function. Proceedings of the National Academy of Sciences of the United States of America, 98(2), 676–682. [DOI] [PMC free article] [PubMed] [Google Scholar]
- Shapira‐Lichter, I. , Oren, N. , Jacob, Y. , Gruberger, M. , & Hendler, T. (2013). Portraying the unique contribution of the default mode network to internally driven mnemonic processes. Proceedings of the National Academy of Sciences of the United States of America, 110(13), 4950–4955. [DOI] [PMC free article] [PubMed] [Google Scholar]
- Siderowf, A. , & Stern, M. B. (2008). Premotor Parkinson's disease: Clinical features, detection, and prospects for treatment. Annals of Neurology, 64(Suppl 2), S139–S147. [DOI] [PubMed] [Google Scholar]
- Sporns, O. (2011). The human connectome: A complex network. Annals of the New York Academy of Sciences, 1224, 109–125. [DOI] [PubMed] [Google Scholar]
- Tessitore, A. , Esposito, F. , Vitale, C. , Santangelo, G. , Amboni, M. , Russo, A. , … Tedeschi, G. (2012). Default‐mode network connectivity in cognitively unimpaired patients with Parkinson disease. Neurology, 79(23), 2226–2232. [DOI] [PubMed] [Google Scholar]
- Thaler, A. , Artzi, M. , Mirelman, A. , Jacob, Y. , Helmich, R. C. , van Nuenen, B. F. , … Ben Bashat, D. (2014). A voxel‐based morphometry and diffusion tensor imaging analysis of asymptomatic Parkinson's disease‐related G2019S LRRK2 mutation carriers. Movement Disorders, 29(6), 823–827. [DOI] [PubMed] [Google Scholar]
- Thaler, A. , Ash, E. , Gan‐Or, Z. , Orr‐Urtreger, A. , & Giladi, N. (2009). The LRRK2 G2019S mutation as the cause of Parkinson's disease in Ashkenazi Jews. Journal of Neural Transmission, 116(11), 1473–1482. [DOI] [PubMed] [Google Scholar]
- Thaler, A. , Gonen, T. , Mirelman, A. , Helmich, R. C. , Gurevich, T. , Orr‐Urtreger, A. , … consortium, L. A. J. (2018). Altered reward‐related neural responses in non‐manifesting carriers of the Parkinson disease related LRRK2 mutation. Brain Imaging Behav. 10.1007/s11682-018-9920-2. [Epub ahead of print] [DOI] [PubMed] [Google Scholar]
- Thaler, A. , Kliper, E. , Maidan, I. , Herman, T. , Rosenberg‐Katz, K. , Bregman, N. , … Mirelman, A. (2018). Cerebral imaging markers of GBA and LRRK2 related Parkinson's disease and their first‐degree unaffected relatives. Brain Topography, 31, 1029–1036. [DOI] [PubMed] [Google Scholar]
- Thaler, A. , Mirelman, A. , Gurevich, T. , Simon, E. , Orr‐Urtreger, A. , Marder, K. , … Consortium, L. A. J. (2012). Lower cognitive performance in healthy G2019S LRRK2 mutation carriers. Neurology, 79(10), 1027–1032. [DOI] [PMC free article] [PubMed] [Google Scholar]
- Thaler, A. , Mirelman, A. , Helmich, R. C. , van Nuenen, B. F. , Rosenberg‐Katz, K. , Gurevich, T. , … Hendler, T. (2013). Neural correlates of executive functions in healthy G2019S LRRK2 mutation carriers. Cortex, 49(9), 2501–2511. [DOI] [PubMed] [Google Scholar]
- Trillo, L. , Das, D. , Hsieh, W. , Medina, B. , Moghadam, S. , Lin, B. , … Salehi, A. (2013). Ascending monoaminergic systems alterations in Alzheimer's disease. Translating basic science into clinical care. Neuroscience and Biobehavioral Reviews, 37(8), 1363–1379. [DOI] [PubMed] [Google Scholar]
- Tuovinen, N. , Seppi, K. , de Pasquale, F. , Muller, C. , Nocker, M. , Schocke, M. , … Seki, M. (2018). The reorganization of functional architecture in the early‐stages of Parkinson's disease. Parkinsonism & Related Disorders, 50, 61–68. [DOI] [PubMed] [Google Scholar]
- van Eimeren, T. , Monchi, O. , Ballanger, B. , & Strafella, A. P. (2009). Dysfunction of the default mode network in Parkinson disease: A functional magnetic resonance imaging study. Archives of Neurology, 66(7), 877–883. [DOI] [PMC free article] [PubMed] [Google Scholar]
- van Nuenen, B. F. , Helmich, R. C. , Ferraye, M. , Thaler, A. , Hendler, T. , Orr‐Urtreger, A. , … Toni, I. (2012). Cerebral pathological and compensatory mechanisms in the premotor phase of leucine‐rich repeat kinase 2 parkinsonism. Brain, 135(12), 3687–3698. [DOI] [PubMed] [Google Scholar]
- Vilas, D. , Segura, B. , Baggio, H. C. , Pont‐Sunyer, C. , Compta, Y. , Valldeoriola, F. , … the Barcelona LRRK2 Study Group . (2016). Nigral and striatal connectivity alterations in asymptomatic LRRK2 mutation carriers: A magnetic resonance imaging study. Movement Disorders, 31(12), 1820–1828. [DOI] [PubMed] [Google Scholar]
- Weintraub, D. , Simuni, T. , Caspell‐Garcia, C. , Coffey, C. , Lasch, S. , Siderowf, A. , … Hawkins, K. A. (2015). Cognitive performance and neuropsychiatric symptoms in early, untreated Parkinson's disease. Mov Disord, 30, 919–927. [DOI] [PMC free article] [PubMed] [Google Scholar]
- Wu, T. , Long, X. , Zang, Y. , Wang, L. , Hallett, M. , Li, K. , & Chan, P. (2009). Regional homogeneity changes in patients with Parkinson's disease. Human Brain Mapping, 30(5), 1502–1510. [DOI] [PMC free article] [PubMed] [Google Scholar]
- Wu, T. , Wang, L. , Chen, Y. , Zhao, C. , Li, K. , & Chan, P. (2009). Changes of functional connectivity of the motor network in the resting state in Parkinson's disease. Neuroscience Letters, 460(1), 6–10. [DOI] [PubMed] [Google Scholar]
Associated Data
This section collects any data citations, data availability statements, or supplementary materials included in this article.
Supplementary Materials
Supplementary Table S1 – Region of Interest MNI Coordinates
Table S2 Summary of DEPNA measures‐ details and characteristics
Table S3 – Interregional functional connectivity results
Table S4 ‐ DEPNA results