

Abstract
Stroke is associated with topological disruptions of large‐scale functional brain networks. However, whether these disruptions occur in transient ischemic attack (TIA), an important risk factor for stroke, remains largely unknown. Combining multimodal MRI techniques, we systematically examined TIA‐related topological alterations of functional brain networks, and tested their reproducibility, structural, and metabolic substrates, associations with clinical risk factors and abilities as diagnostic and prognostic biomarkers. We found that functional networks in patients with TIA exhibited decreased whole‐brain network efficiency, reduced nodal centralities in the bilateral insula and basal ganglia, and impaired connectivity of inter‐hemispheric communication. These alterations remained largely unchanged when using different brain parcellation schemes or correcting for micro head motion or for regional gray matter volume, cerebral blood flow or hemodynamic lag of BOLD signals in the patients. Moreover, some alterations correlated with the levels of high‐density lipoprotein cholesterol (an index related to ischemic attacks via modulation of atherosclerosis) in the patients, distinguished the patients from healthy individuals, and predicted future ischemic attacks in the patients. Collectively, these findings highlight the emergence of characteristic network dysfunctions in TIA, which may aid in elucidating pathological mechanisms and establishing diagnostic and prognostic biomarkers for the disease.
Keywords: brain networks, grapy theory, inter‐hemispheric connectivity, multimodal MRI, transient ischemic attack
1. INTRODUCTION
Transient ischemic attack (TIA) is a transient episode of neurologic deficits caused by brain ischemia. It induces various transient symptoms but leads to persistent cognitive deficits in multiple domains (Bakker et al., 2003b; Sachdev et al., 2004). Further, TIA is an important risk factor for eventual stroke or silent stroke (Giles & Rothwell, 2007), and thus represents a key time window for early diagnosis and intervention. However, the identification of TIA is currently challenging, as it is mainly based on symptoms, due to the lack of objective and reliable biomarkers.
Advanced noninvasive MRI technique provide promising avenues to identify and establish such biomarkers by detecting structural and functional brain alterations in TIA, including gray matter (GM) atrophy (Li et al., 2015), cerebral blood flow (CBF) reduction (Kleinman et al., 2012), and disturbances in the amplitude and connectivity of spontaneous brain activity (Guo et al., 2014; Li et al., 2013). However, these studies mainly focused on local features of specific regions and connections. There is a growing body of evidence supporting that the human brain operates essentially as a network to integrate various information inputs across multiple distributed systems (Barch, 2013; Bullmore & Sporns, 2009; Cole, Bassett, Power, Braver, & Petersen, 2014; Sporns, 2014). This feature makes the human brain particularly amenable to study with network approaches, such as seed‐based functional connectivity and independent component analysis. However, these two methods can only provide information about how regions are related to each other within neural circuits; they cannot reveal connectivity patterns between different circuits. In contrast, complex network analysis is a powerful tool to map and characterize both within‐ and between‐circuit connectivity patterns of the entire assembly of brain regions. Thus, complex network analysis of TIA can provide a more complete holistic view of how the disease affects patients' brain.
Human brain networks can be constructed from multimodal neuroimaging data and further topologically characterized with graph‐based approaches (Bullmore & Sporns, 2009; He & Evans, 2010). To date, several nontrivial organizational principles have been convergently observed in the human brain networks, including small‐worldness (Liao, Vasilakos, & He, 2017), modularity (Sporns & Betzel, 2016) and hubs (van den Heuvel & Sporns, 2013). Moreover, these properties have been frequently reported to be altered in ischemic stroke (Adhikari et al., 2017; Wang et al., 2010; Yin et al., 2014; Zhu et al., 2017). To the best of our knowledge, however, there are no studies examining whether these topological alterations emerge in TIA.
In this study, we employed resting‐state blood oxygen level‐dependent functional MRI (R‐BOLD‐fMRI) to investigate the topological alterations of functional brain network in patients with TIA. R‐BOLD‐fMRI measures spontaneous neuronal activity of the brain (Biswal, Yetkin, Haughton, & Hyde, 1995; Fox & Raichle, 2007) and has been widely used to investigate intrinsic functional brain networks (Wang, Zuo, & He, 2010). Specifically, we sought to determine whether and how TIA disrupts the topological organization of the whole‐brain functional network and whether these topological abnormalities (if observed) are associated with risk factors for TIA. Further, we examined whether these abnormalities could differentiate patients with TIA from healthy elderly individuals and predict ischemic attacks of the patients during the one‐year follow‐up. Finally, given structural and metabolic substrates of functional brain networks (Alexander‐Bloch, Giedd, & Bullmore, 2013; Liang, Zou, He, & Yang, 2013), we also utilized structural MRI and resting‐state arterial spin labeling functional MRI (R‐ASL‐fMRI) to explore the extent to which these functional network abnormalities are attributable to regional alterations in GM volume and CBF.
2. MATERIALS AND METHODS
2.1. Participants
According to the WHO guidelines, transient ischemic attack is defined as a sudden onset of neurological symptoms that are of vascular etiology and resolve within 24 hr. Following the guidelines, we recruited 51 patients with TIA who had transient (i.e., less than 24 hr) neurologic symptoms due to a possible vascular etiology as evaluated by experienced clinical neurologists. The patients were from the Department of Neurology, Anshan Changda Hospital from April 2015 to June 2016. Patients with hemorrhage, leukoaraiosis, epilepsy, migraine, or a history of psychiatric disease were excluded from this study. For each patient, we recorded the following information: (a) history of TIA and stroke; (b) risk factors including hypertension, diabetes mellitus, coronary artery disease, current smoking, and drinking; (c) medications used before the MR scanning; (d) in‐hospital evaluation of arterial stenosis (carotid duplex ultrasound and MR angiography), atrial fibrillation (electrocardiogram) and brain infarcts (diffusion‐weighted imaging and T2‐FLAIR); (e) 1‐year telephone follow‐up of stroke and/or TIA. Based on the methods described by Johnston et al. (2007) an ABCD2 score, which considers age, blood pressure, clinical features, duration of symptoms, and history of diabetes, was obtained for each patient to evaluate the risk for subsequent stroke. In addition, 41 age‐ and sex‐matched healthy controls (HCs) were recruited from the local community via advertisements. The HCs had no physical diseases or history of psychiatric or neurologic diseases. Four participants (three patients and one control) were excluded due to inadequate image quality of multimodal MRI data, leaving 48 TIA patients (age = 30–79 years; 37 males) and 40 HCs (age = 40–77 years; 29 males) in the final analysis. Of the 48 patients, 4 (8.3%) experienced a history of stroke and 25 (52.1%) had a history of TIA before they were recruited in the current study, 6 (12.5%) had white matter hyperintensity in diffusion‐weighted images, and 9 (18.8%) had intracranial large‐vessel stenosis or carotid artery stenosis. This study was approved by the Ethics Committee of the Center for Cognition and Brain Disorders, Hangzhou Normal University. Written informed consent was obtained from each participant.
2.2. Physiological and biochemical tests
All participants completed a series of physiological and biochemical tests within 24 hr before the MR scanning, including blood systolic pressure, blood diastolic pressure, blood sugar level, cholesterol, triglycerides, high‐density lipoprotein cholesterol (HDL‐C), and low‐density lipoprotein cholesterol (LDL‐C). Additionally, all participants underwent the mini‐mental state examination (MMSE) to evaluate global cognition (Schultz‐Larsen, Lomholt, & Kreiner, 2007).
2.3. Multimodal MRI data acquisition
All MRI data were acquired using a GE MR‐750 3.0 T scanner (GE Medical Systems, Waukesha, WI) at Anshan Changda Hospital. The time intervals between the last TIA and MR scanning were from 6 hr to 16 days (2.673 ± 2.978 days) for all patients. During the data acquisition, the participants were instructed to keep awake, relax with their eyes closed, and remain motionless as much as possible.
2.3.1. R‐BOLD‐fMRI data
The R‐BOLD‐fMRI data were acquired using an echo‐planar imaging sequence: 43 axial slices, repetition time (TR) = 2000 ms, echo time (TE) = 30 ms, matrix = 64 × 64, field of view (FOV) = 220 × 220 mm2, thickness/gap = 3.2/0 mm and flip angle = 60°. This session consisted of 240 contiguous volumes and lasted for 8 min.
2.3.2. R‐ASL fMRI data
The R‐ASL‐fMRI data were acquired using a pseudo continuous ASL 3D fast‐spin echo encoded spiral readout imaging sequence: 45 axial slices, TR = 4,781 ms, TE = 11.12 ms, matrix size = 128 × 128, FOV = 220 × 220 mm2, thickness/gap = 3/0 mm, points = 512, arms = 12, labeling duration = 1,500 ms and postlabel delay = 1,525 ms. The session lasted for about 7 min.
2.3.3. Structural MRI data
The structural MRI data were acquired using a 3D‐MPRAGE sequence: 176 sagittal slices, TR = 8,100 ms, TE = 3.1 ms, matrix = 256 × 256, FOV = 256 × 256 mm2, and thickness/gap = 1.0/0 mm. This session lasted for about 5 min.
After careful visual inspection, three patients were excluded from further analysis due to incomplete coverage of the whole brain in the R‐BOLD‐fMRI scan (two) or loss of the structural image (one).
2.4. Multimodal MRI data preprocessing
The multimodal MRI data underwent modality‐specific preprocessing as follows.
2.4.1. R‐BOLD‐fMRI data
The R‐BOLD‐fMRI data were preprocessed using the GRETNA package (Wang et al., 2015) based on SPM12 (http://www.fil.ion.ucl.ac.uk/spm) and included (a) removal of the first five volumes; (b) correction for intra‐volume time delays between slices (Sinc interpolation); (c) correction for inter‐volume head motion (rigid‐body transformation); (d) spatial normalization to the Montreal Neurological Institute (MNI) space via deformation fields derived from tissue segmentation of structural images; (e) removal of linear trends; (f) band‐pass filtering (0.01–0.08 Hz); and (g) regressing out nuisance signals including 24‐parameter head motion profiles (Friston, Williams, Howard, Frackowiak, & Turner, 1996), WM signals and cerebrospinal fluid signals. We did not regress out the global signals as this step is controversial for R‐BOLD‐fMRI data (Murphy & Fox, 2017). Notably, all nuisance signals were also band‐pass filtered (0.01–0.08 Hz) (Hallquist, Hwang, & Luna, 2013). One HC was excluded based on the head movement criterion of maximal displacement >2 mm, rotation >2° or mean framewise displacement >0.5.
2.4.2. R‐ASL‐fMRI data
For the R‐ASL‐fMRI data, individual CBF maps were created using an automated script on the scanner workstation and were subsequently normalized to the MNI space via the deformation fields derived from tissue segmentation of structural images using SPM12 (http://www.fil.ion.ucl.ac.uk/spm). The normalized CBF maps were further spatially smoothed with a Gaussian kernel with a 6‐mm full width at half maximum.
2.4.3. Structural MRI data
For the structural MRI data, individual images were first segmented into GM, WM, and cerebrospinal fluid on the basis of an adaptive maximum A posterior technique. The resultant GM maps were then normalized to the MNI space and nonlinearly modulated to compensate for spatial normalization effects. The modulated GM maps were further spatially smoothed using a Gaussian kernel with a 6‐mm full width at half maximum.
2.5. Network construction
In the jargon of graph theory, a network is composed of a set of nodes linked by edges. In this study, we constructed functional brain networks at the macroscale with nodes representing brain regions and edges representing interregional functional connectivity.
2.5.1. Node definition
To define network nodes, we divided the brain into 90 regions of interest (ROIs) based on the anatomical automatic labeling atlas (Tzourio‐Mazoyer et al., 2002), with each ROI representing a node (Table S1).
2.5.2. Edge definition
To measure interregional functional connectivity, we calculated Pearson correlation coefficients of regional representative time series between any pair of ROIs. For each ROI, the representative time series was calculated as the weighted average of BOLD signals over all voxels within the ROI, with the weights denoting GM probabilities in terms of the probability map in the SPM toolbox. This resulted in a 90 × 90 correlation matrix for each participant.
2.5.3. Threshold selection
To de‐noise spurious interregional connectivity, only significant correlations (p < .05, Bonferroni‐corrected across connections) were retained and set to one, whereas others were set to zero. Such a significance level‐based thresholding procedure effectively avoids erroneous evaluations of network topology (Toppi et al., 2012) and has been frequently used in previous brain network studies (Bassett et al., 2011; Wang et al., 2013; Wang et al., 2015). Of note, the significance level‐based thresholding procedure is identical to setting an absolute correlation threshold when the degree of freedom is fixed across edges. Finally, negative correlations were excluded in this study because of their ambiguous interpretation (Fox, Zhang, Snyder, & Raichle, 2009; Murphy, Birn, Handwerker, Jones, & Bandettini, 2009; Weissenbacher et al., 2009) and detrimental effects on test–retest reliability (Wang et al., 2011).
2.6. Network analysis
For the brain networks constructed above, we calculated four global metrics (clustering coefficient, characteristic path length, local efficiency and global efficiency) and three nodal centrality metrics (degree, efficiency and betweenness) to characterize their topological organization. These metrics are briefly explained below in the context of a network G with N nodes and K edges.
2.6.1. Global network metrics
The clustering coefficient of the network G is the average of all nodal clustering coefficients, where the nodal clustering coefficient for a given node i is defined as the number of existing connections between the node's neighbors divided by all their possible connections (Watts & Strogatz, 1998). The clustering coefficient quantifies the extent of local interconnectivity or cliquishness of a network. The characteristic path length of the network G is defined as the shortest path length (i.e., the smallest number of connections) required to travel from one node to another, averaged over all possible pairs of nodes (Watts & Strogatz, 1998). The characteristic path length reflects the mean distance or overall routing efficiency between any pair of nodes in a network. Of note, the harmonic mean is used for the calculation of characteristic path length to deal with the possible dilemma of isolated nodes.
Compared with the clustering coefficient and characteristic path length, efficiency is a more biologically relevant metric to describe brain networks from the perspective of parallel information propagation and exchange (Achard & Bullmore, 2007; Latora & Marchiori, 2001). Mathematically, the global efficiency of the network G is computed as the reciprocal of the shortest path length required to travel from one node to another, averaged over all possible pairs of nodes. Global efficiency reflects the ability of parallel information transmission over the network. The local efficiency of the network G is the average of all nodal local efficiencies, where the nodal local efficiency for a given node i is defined as the global efficiency of the subgraph G i that is composed of nodes directly linking to the node i. Local efficiency measures the fault tolerance of the network, indicating the capacity for information exchange for each subgraph when the index node is eliminated.
To determine whether brain networks were topologically organized into small‐world organizations, we calculated normalized versions of the aforementioned global network metrics by dividing them by the corresponding mean derived from 100 random networks that preserved the same number of nodes and edges and the same degree distributions as the real brain networks (Maslov & Sneppen, 2002; Milo et al., 2002). Typically, a network is said to be small world if it has a normalized clustering coefficient and local efficiency larger than one and a normalized characteristic path length and global efficiency approximately equal to one (Watts & Strogatz, 1998).
2.6.2. Nodal network metrics
The nodal degree for a given node i is defined as the number of edges linked to the node. The nodal degree reflects the overall connectivity of a node with other nodes in a network. The nodal efficiency for a given node i is computed as an average of the reciprocal of the shortest path length between the node and other nodes in the network G (Achard & Bullmore, 2007). Nodal efficiency measures the ability of an index node to propagate and exchange information with other nodes in a network. The nodal betweenness for a given node i is computed as the number of shortest paths between pairs of other nodes that pass through the node (Freeman, 1977). Nodal betweenness captures the influence of an index node over information flow between other nodes in a network. Of note, although the three nodal metrics are typically interrelated and resemble each other with respect to their spatial distributions in the brain, they capture roles of individual nodes within a network from different viewpoints (Wang, Wang, He, et al., 2015), and thus reveal TIA‐related alterations in complementary ways.
2.7. Statistical analysis
We tested between‐group differences in global organization, nodal centrality and interregional functional connectivity of whole‐brain functional networks, and further examined their associations with clinical, physiological and biochemical variables of the patients. Additionally, between‐group differences in regional GM volume and CBF were determined.
2.7.1. Between‐group differences in global and nodal network metrics
Between‐group differences in global and nodal network measures were inferred using nonparametric permutation tests. Briefly, for each metric, we initially calculated the between‐group difference of the mean values. An empirical distribution of the difference was then obtained by randomly reallocating all the values into two groups and recomputing the mean differences between the two randomized groups (10,000 permutations). The 95th percentile point of the empirical distribution was used as a critical value in a one‐tailed test of whether the observed group difference could occur by chance. For nodal results, a false discovery rate (FDR) procedure was employed to correct for multiple comparisons. The nonparametric permutation approach was also used to infer between‐group differences in regional GM volume and CBF followed by an FDR procedure.
2.7.2. Between‐group differences in interregional functional connectivity
To locate region pairs showing altered functional connectivity in the patients, we used a network‐based‐statistic (NBS) approach (Zalesky, Fornito, & Bullmore, 2010). First, we performed two‐sample one‐tailed t‐tests on the significantly positive connections that were present in at the least 80% of all participants. A primary threshold (i.e., p < .01) was then applied to define suprathreshold links within which any connected component and its size (defined as the number of edges included in the component) were determined. To estimate the significance of each component, a null distribution of connected component size was derived empirically using a nonparametric permutation approach (10,000 permutations). For each permutation, connectivity matrices of all subjects were reallocated randomly into two groups, and two‐sample one‐tailed t‐tests were conducted for the same set of connections mentioned above. The same primary threshold (i.e., p < .01) was then used to generate suprathreshold links within which the maximal connected component size was recorded. Finally, for a connected component of size M found in the right grouping of controls and patients, the corrected p‐value was determined by calculating the proportion of the 10,000 permutations for which the maximal connected component was larger than M.
2.7.3. Relationship between network metrics and clinical variables in TIA
For any network metric showing TIA‐related alterations, a Pearson correlation analysis was used to assess its associations with clinical, physiological, and biochemical characteristics of the patients, including the ABCD2 scores, blood systolic pressure, blood diastolic pressure, blood sugar level, cholesterol, triglycerides, HDL‐C, and LDL‐C. Again, the FDR procedure was used to correct for multiple comparisons.
2.7.4. Receiver operating characteristic analysis for classification and prediction
To examine whether the network alterations could serve as potential biomarkers for TIA, we performed a preliminary discriminatory analysis by plotting the receiver operating characteristic (ROC) curve for each network metric showing significant between‐group differences. For network metrics showing significant between‐group differences, ROC analyses were also performed to examine their potential for predicting follow‐up ischemic attacks in the patients.
2.8. Validation of reproducibility
We performed a series of analyses to validate the reproducibility of our main findings.
2.8.1. Effects of regional brain parcellation
Previous studies have demonstrated that different brain parcellation schemes significantly affect topological organization of functional brain networks (Wang et al., 2009) and confound between‐group comparisons (Lord et al., 2016). Thus, we repeated our analyses by constructing individual functional brain networks based on two other commonly used atlases (246 and 264 ROIs, respectively) (Fan et al., 2016; Power et al., 2011). Due to the lack of direct correspondence of brain regions among different atlases, these analyses were used to test the reproducibility of global rather than nodal alterations.
2.8.2. Effects of regional GM atrophy
Previous studies have shown that TIA is associated with GM atrophy in specific regions (Li et al., 2015). To determine whether and to what extent GM atrophy contributes to nodal alterations in this study, we re‐analyzed between‐group differences in nodal metrics (degree, efficiency, and betweenness) with regional mean GM volume as a covariate of no interest.
2.8.3. Effects of regional perfusion deficits
Previous studies have found that functional brain networks have a physiological basis, as evidenced by the fact that highly connected regions are related to high rates of metabolism and CBF (Liang et al., 2013; Tomasi, Wang, & Volkow, 2013). Given that patients experiencing TIA are frequently reported to show hypoperfusion (Kleinman et al., 2012; MacIntosh et al., 2010; Qiao et al., 2013; Zaharchuk et al., 2012) and that the patients included in this study also showed decreased CBF (Lv et al., 2018), we further examined whether and to what extent TIA‐related nodal alterations in this study resulted from regional CBF decreases. This was achieved by recomputing between‐group differences in nodal metrics (degree, efficiency, and betweenness) with regional mean CBF as a covariate of no interest.
2.8.4. Effects of head motion
In this study, we regressed out 24‐parameter head motion profiles at the individual level, which was an efficient strategy to control for residual head motion (Yan et al., 2013). To further consolidate our findings, we also reanalyzed between‐group differences and correlation results by treating micro head motion (i.e., mean framewise displacement) as a covariate of no interest (Fair et al., 2012).
2.8.5. Effects of gender
Although the between‐group difference was not significant, the gender distribution was not exactly the same in the controls as that in the patients. To test the possible effects of this factor, we reanalyzed between‐group differences and correlation results with gender as a covariate of no interest.
2.8.6. Effects of hemodynamic lags
Previous studies have found that hemodynamic lags could affect estimation of functional connectivity in patients with perfusion deficits (Chi et al., 2018; Christen et al., 2015; Jahanian, Christen, Moseley, & Zaharchuk, 2018; Siegel, Snyder, Ramsey, Shulman, & Corbetta, 2016). Given that the hemodynamic lags were present in some patients in this study (Lv et al., 2018), we evaluated their effects on our findings by recomputing regional representative time series after correcting for the hemodynamic lags. Specifically, we shifted the time series of each voxel of each patient according to their hemodynamic lags as determined in our previous study (Lv et al., 2018). The shifted time series were then used to compute regional representative time course as the weighted average over all voxels within each region. Finally, the previously used procedures were repeated with respect to network construction, property calculation and statistical analysis.
2.8.7. Effects of thresholding procedure
In this study, we utilized a significance level‐based thresholding method, which enabled the examination of absolute network organization (He et al., 2009). However, this method resulted in different network densities across participants, which may confound subsequent between‐group comparisons (van Wijk, Stam, & Daffertshofer, 2010). Thus, we also employed a sparsity‐based thresholding procedure to examine relative network organization by ensuring the same network density across participants (sparsity was defined as the ratio of the number of actual edges divided by the maximum possible number of edges in a network). Specifically, due to the lack of a conclusive method to select a single sparsity threshold, we repeatedly thresholded all correlation matrices (with negative correlations excluded) over a consecutive sparsity range of [0.05 0.4] with an interval = 0.02. This range ensures that the resultant networks have sparse properties (Achard, Salvador, Whitcher, Suckling, & Bullmore, 2006; Wang et al., 2009) and are estimable for the small‐world attributes (Watts & Strogatz, 1998). Finally, we calculated the area under curve (i.e., integral over the sparsity range) for each global and nodal network metric of each participant, on which statistical analyses were performed (Zhang et al., 2011).
2.9. Brain visualization
The brain results were visualized in surface space using the BrainNet viewer (Xia, Wang, & He, 2013).
3. RESULTS
3.1. Demographics, clinical characteristics and head motion
Demographic, clinical, physiological and biochemical information for the final 48 patients with TIA and 40 HCs is summarized in Table 1. There were no significant differences in age (p = .188), sex (p = .621) or MMSE scores (p = .222) between the TIA patients and HCs. Compared with the HCs, the TIA patients exhibited significantly higher blood systolic pressure (p < .001), diastolic pressure (p = .008), blood sugar level (p < .001), total cholesterol (p = .037) and LDL‐C (p = .004). In addition, there were no significant differences in the maximum (mean ± standard deviation: HCs = 0.959 ± 0.445, TIA = 0.903 ± 0.395; p = .270), root‐mean‐square (mean ± standard deviation: HCs = 0.263 ± 0.140, TIA = 0.256 ± 0.108; p = .380) or mean framewise displacement (mean ± standard deviation: HCs = 0.110 ± 0.075, TIA = 0.120 ± 0.062; p = .226) of head motion profiles between the two groups. No significant correlations were observed for the mean framewise displacement with any clinical, physiological or biochemical variable in the patients (p > .05).
Table 1.
Demographics and clinical characteristics of all participants
| TIA | HCs | p‐value | |
|---|---|---|---|
| (n = 48) | (n = 40) | ||
| Age (years) | 57.604 ± 9.778 | 55.025 ± 8.135 | .188a |
| Sex, no. (M/F) | 37/11 | 29/11 | .621b |
| MMSE | 29.208 ± 2.609 | 28.615 ± 1.664 | .222a |
| Blood systolic pressure (mmHg) | 145.542 ± 20.753 | 127.469 ± 19.835c | <.001a |
| Blood diastolic pressure (mmHg) | 86.667 ± 10.383 | 80.031 ± 11.070c | .008a |
| Blood sugar level (mmol/L) | 6.299 ± 2.113 | 5.200 ± 0.740c | <.001a |
| Total cholesterol (mmol/L) | 5.275 ± 1.173 | 4.753 ± 1.011c | .037a |
| Triglycerides (mmol/L) | 1.603 ± 0.940 | 1.917 ± 1.345c | .234a |
| HDL‐C (mmol/L) | 1.111 ± 0.238 | 1.051 ± 0.290c | .311a |
| LDL‐C (mmol/L) | 3.314 ± 0.974 | 2.691 ± 0.904c | .004a |
| ABCD2 scores, median (min–max) | 4 (2–6) | ||
| Smoking, no | 31 (64.6%) | 19 (47.5%) | .107b |
| Drinking, no | 20 (41.7%) | 21 (52.5%) | .310b |
| Hypertension, no | 22 (45.8%) | 6 (15%) | .002b |
| Diabetes, no | 8 (16.7%) | 0 (0%) | <.001b |
| Coronary artery disease, no | 2 (4.2%) | 0 (0%) | <.001b |
| Atrial fibrillation, no | 1 (2.1%) | ||
| Medication | |||
| Antiplatelets, no | 48 (100%) | ||
| Statins, no | 2 (4.2%) | ||
| White matter hyperintensity, no | 6 (12.5%) | ||
| Vessel stenosis, no. (%) | 9 (18.8%) | ||
| TIA/stroke attack in one‐year follow‐up, no. (%) | 12 (27.3%)d |
Note: Data are presented as mean ± standard deviation unless stated otherwise. TIA, transient ischemic attack; HCs, healthy controls; M, male; F, female; MMSE, mini‐mental state examination; HDL‐C, high‐density lipoprotein cholesterol; LDL‐C, low‐density lipoprotein cholesterol.
Data were obtained using two‐sample two‐side t‐tests.
Data were obtained using Pearson Chi‐square tests.
Data were missing for five controls.
Four patients dropped out in the one‐year follow‐up.
3.2. Disrupted global organization in TIA
After applying a significance‐based threshold to individual functional connectivity matrices, the TIA patients had fewer surviving connections than the HCs (p = .017). Further graph‐based network analysis revealed that relative to matched random networks, the functional brain networks showed efficient small‐world organization as characterized by larger‐than‐1 normalized clustering coefficient (mean ± standard deviation: HCs = 1.462 ± 0.265, TIA = 1.544 ± 0.313) and local efficiency (mean ± standard deviation: HCs = 1.143 ± 0.070, TIA = 1.173 ± 0.097) and approximately‐equal‐to‐1 normalized characteristic path length (mean ± standard deviation: HCs = 1.021 ± 0.018, TIA = 1.031 ± 0.022) and global efficiency (mean ± standard deviation: HCs = 0.980 ± 0.017, TIA = 0.970 ± 0.020). Nevertheless, significant between‐group differences were observed in the quantitative network parameters, as characterized by significantly increased characteristic path length (p = .007, cohen's d = 0.531) and normalized characteristic path length (p = .010, cohen's d = 0.507) and decreased clustering coefficient (p = .041, cohen's d = 0.385), local efficiency (p = .028, cohen's d = 0.422), global efficiency (p = .008, cohen's d = 0.508) and normalized global efficiency (p = .011, cohen's d = 0.510) in the patients (Figure 1).
Figure 1.

Altered global network metrics in TIA. Compared with the HCs, patients with TIA exhibited significantly increased characteristic path length Lp and normalized characteristic path length , and decreased clustering coefficient Cp, local efficiency Eloc, global efficiency Eglob and normalized global efficiency . TIA, transient ischemic attack; HCs, healthy controls [Color figure can be viewed at http://wileyonlinelibrary.com]
3.3. Decreased nodal centrality in TIA
Compared with the HCs, the TIA patients showed significantly decreased nodal degree in the bilateral insula, left caudate and pallidum and right putamen and decreased nodal efficiency in the bilateral insula and putamen, left amygdala, caudate, pallidum and middle occipital gyrus and right rolandic operculum and middle temporal gyrus of the temporal pole (p < .05, FDR corrected, cohen's d = 0.554–0.765) (Table 2). No regions exhibited increased nodal degree or efficiency in the patients (p > .05, FDR corrected). No regions showed significant between‐group differences in nodal betweenness (p > .05, FDR corrected).
Table 2.
Decreased nodal centrality in TIA
| Brain regions | Nodal efficiency | Nodal degree | Nodal betweenness | ||||||
|---|---|---|---|---|---|---|---|---|---|
| TIA | HCs | p‐value | TIA | HCs | p‐value | TIA | HCs | p‐value | |
| INS.L | 0.655 ± 0.094 | 0.714 ± 0.081 | .002 a, b, c, d | 31.896 ± 12.181 | 39.700 ± 14.419 | .002 b | 43.7 28 ± 36.130 | 43.033 ± 30.841 | .452 |
| INS.R | 0.637 ± 0.090 | 0.698 ± 0.088 | .001 a, b, c, d, e | 28.396 ± 12.649 | 37.225 ± 13.968 | .001 b, c, d | 36.039 ± 29.312 | 33.017 ± 19.812 | .249 |
| CAU.L | 0.562 ± 0.108 | 0.643 ± 0.110 | <.001 a, b, c, d, e | 19.396 ± 10.843 | 29.125 ± 16.012 | <.001 b, c, d | 28.371 ± 34.358 | 27.465 ± 23.829 | .355 |
| PAL.L | 0.581 ± 0.084 | 0.662 ± 0.104 | <.001 a, b, c, d, e | 20.563 ± 14.985 | 31.875 ± 16.106 | <.001 b, c, d | 20.815 ± 23.401 | 20.713 ± 17.604 | .484 |
| PUT.L | 0.621 ± 0.101 | 0.678 ± 0.096 | .004 a, b, c, d, e | 26.229 ± 14.103 | 34.125 ± 14.905 | .007 | 41.343 ± 34.298 | 34.232 ± 22.772 | .121 |
| PUT.R | 0.616 ± 0.094 | 0.675 ± 0.102 | .002 a, b, c, d, e | 25.083 ± 13.568 | 33.900 ± 15.203 | .002 b | 38.853 ± 34.708 | 32.256 ± 25.615 | .152 |
| AMYG.L | 0.619 ± 0.105 | 0.683 ± 0.097 | .002 a, b, c, d, e | 25.833 ± 15.568 | 34.825 ± 15.568 | .005 | 23.808 ± 20.030 | 36.296 ± 23.127 | .101 |
| MOG.L | 0.663 ± 0.101 | 0.722 ± 0.095 | .003 a, b, c, d | 32.250 ± 15.812 | 40.825 ± 15.674 | .006 | 44.816 ± 43.478 | 61.720 ± 66.051 | .008 |
| ROL.R | 0.651 ± 0.084 | 0.700 ± 0.092 | .004 a, b, d | 31.000 ± 12.181 | 38.000 ± 14.419 | .010 | 37.385 ± 28.360 | 30.460 ± 19.836 | .097 |
| TPOmid.R | 0.631 ± 0.099 | 0.687 ± 0.082 | .002 b, c, d | 27.292 ± 14.320 | 35.475 ± 13.082 | .003 | 36.361 ± 32.239 | 34.501 ± 25.375 | .273 |
Note: Regions were considered abnormal in patients with TIA if they significantly (p < .05, FDR corrected) differed from the healthy controls in at least one of the three nodal centralities (bold font). Data of nodal centrality are presented as mean ± standard deviation. TIA, transient ischemic attack; HCs, healthy controls; INS, insula; CAU, caudate; PAL, pallidum; PUT, putamen; AMYG, amygdala; MOG, middle occipital gyrus; ROL, rolandic operculum; TPOmid, temporal pole: middle temporal gyrus; L, left; R, right.
Regions that remained significant decreases after correcting for regional GM volume (p < .05, FDR corrected).
Regions that remained significant decreases after correcting for mean framewise displacement of head motion (p < .05, FDR corrected).
Regions that remained centrality decreases after correcting for gender (p < .05, FDR corrected).
Regions that remained significant decreases after correcting for hemodynamic lags of BOLD signals (p < .05, FDR corrected).
Regions that remained significant decreases after correcting for regional CBF (p < .05, FDR corrected).
3.4. Impaired interregional functional connectivity in TIA
With a cluster‐defining threshold of p < .01, we identified a single connected component that exhibited decreased functional connectivity in the patients with TIA compared with the HCs (p < .001, corrected) (Figure 2). The component included 181 edges linking 74 nodes that involved frontal, occipital, temporal and subcortical regions, and the insula. Using a more rigorous threshold of p < .001, three smaller components were found to show decreased functional connectivity in the patients that included 23 nodes and 22 edges (p < .001, corrected), 8 nodes and 9 edges (p = .008, corrected) and 4 nodes and 3 edges (p = .046, corrected), respectively. Interestingly, the edges included in the connected components were mainly inter‐hemispheric connections (124/181, 68.5%, 20/22, 90.9%; 6/9, 66.7%; and 3/3, 100%). No components were found to show significantly increased functional connectivity in the patients.
Figure 2.
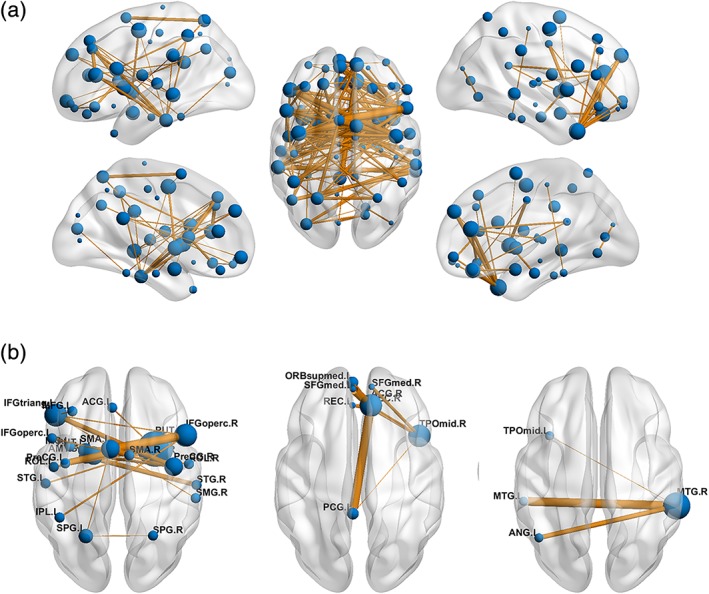
Impaired interregional functional connectivity in TIA. (a) A single connected component was identified to exhibit decreased functional connectivity in the patients with TIA when using a cluster defining threshold of p < .01. (b) Using a more rigorous cluster‐defining threshold of p < .001, three smaller components were detected to show decreased functional connectivity in the patients with TIA. Notably, the components were mainly composed of inter‐hemispheric connections. Nodal size denotes nodal degree (i.e., the number of connections) in the connected component (bigger for more) and edge width denotes the significance level of between‐group differences (thicker for more significant). See Table S1 for regional abbreviations. TIA, transient ischemic attack [Color figure can be viewed at http://wileyonlinelibrary.com]
3.5. Brain‐clinical relationships in TIA
No significant correlations were observed in the patients after multiple comparison correction (p > .05, FDR). Using an uncorrected lenient threshold of p < .05, characteristic path length negatively (r = −0.309, p = .033), global efficiency positively (r = 0.308, p = .033), and nodal degree (r = 0.420, p = .003) and efficiency (r = 0.429, p = .002) of the left insula positively correlated with the HDL‐C in the patients (Figure 3).
Figure 3.

Relationship between network measures and clinical/physiological/biochemical variables in TIA. In the TIA patients, significant correlations were observed for the high‐density lipoprotein cholesterol (HDL‐C) with characteristic path length Lp, global efficiency Eglob, and nodal degree ki and nodal efficiency ei of the left insula. HDL‐C, high‐density lipoprotein cholesterol; TIA, transient ischemic attack [Color figure can be viewed at http://wileyonlinelibrary.com]
3.6. Sensitivity and specificity of network metrics in classification and prediction of TIA
Among the network metrics showing significant between‐group differences, the mean functional connectivity strength of the identified NBS‐based component exhibited the highest accuracy (area under curve = 0.891, p < .001) for distinguishing the TIA patients from HCs. Specifically, using the cut‐off value of 0.381, 45 of the 48 patients with TIA and 32 of the 40 HCs were classified correctly, yielding a sensitivity of 93.8% and a specificity of 80.0% (Figure 4). All other network metrics exhibited poor discriminant performance (area under curve <0.7).
Figure 4.

TIA‐control classification and prediction of follow‐up ischemic attacks. (a) The mean functional connectivity strength of the identified NBS component (cluster defining threshold of p < .01) distinguished TIA patients from HCs with a high sensitivity and specificity. (b) Nodal degree of the right insula predicted follow‐up ischemic attacks with a high sensitivity and specificity. ROC, receiver operating characteristic; AUC, area under curve; TIA, transient ischemic attack; HCs, healthy controls [Color figure can be viewed at http://wileyonlinelibrary.com]
Compared with the patients without follow‐up ischemic attacks, those suffering from ischemic attacks in 1 year after the MR scanning showed significantly lower nodal degree and efficiency in the right insula (permutation test; p < .05, FDR corrected). Moreover, the nodal degree of the right insula showed high performance (area under curve = 0.809, p < .001, sensitivity = 0.844 and specificity = 0.833) for distinguishing the patients with from patients without follow‐up ischemic attacks.
3.7. Reproducibility of the main results
Our validation analyses indicated that the reported TIA‐related alterations in global network metrics remained largely unchanged when using two other atlases or after correcting for micro head motion, gender, or hemodynamic lag of BOLD signals (Table 3). However, no significant between‐group differences were found in any global metric when the sparsity‐based thresholding procedure was used to examine relative network organization (p > .05). For nodal metrics, the reported TIA‐related alterations were also largely reproducible after correcting for micro head motion, gender or regional GM volume, CBF or hemodynamic lag of BOLD signals (Table 2). Interestingly, we noted that the TIA‐related alterations in nodal degree were primarily accounted for by regional GM volume and CBF (Table 2). Regarding the sparsity‐based thresholding procedure, no regions exhibited significant TIA‐related alterations (p > .05, FDR corrected). Nevertheless, similar regions survived when a liberal threshold of p < .05 (uncorrected) was used. Finally, the observed correlation results were largely preserved after correcting for micro head motion and gender. These validation analyses indicate that our main findings are generally reproducible after taking multiple potential confounding factors into account.
Table 3.
Reproducibility of our main findings
| Cp | Lp | Eloc | Eglob |
|
|
|
|
||||||
|---|---|---|---|---|---|---|---|---|---|---|---|---|---|
| Main results | p‐value | .041 (↓) | .007 (↑) | .028 (↓) | .008 (↓) | .095 | .010 (↑) | .061 | .011 (↓) | ||||
| cohen's d | 0.385 | 0.531 | 0.422 | 0.508 | 0.284 | 0.507 | 0.348 | 0.510 | |||||
| Brain parcellation | |||||||||||||
| Fan | p‐value | .072 | .018 (↑) | .062 | .017 (↓) | .069 | .008 (↑) | .060 | .007 (↓) | ||||
| cohen's d | 0.318 | 0.472 | 0.336 | 0.463 | 0.321 | 0.521 | 0.343 | 0.528 | |||||
| Power | p‐value | .157 | .028 (↑) | .076 | .031 (↓) | .110 | .014 (↑) | .028 ↑ | .014 (↓) | ||||
| cohen's d | 0.216 | 0.415 | 0.306 | 0.403 | 0.268 | 0.481 | 0.396 | 0.481 | |||||
| Head motion | p‐value | .031 (↓) | .006 (↑) | .023 (↓) | .007 (↓) | .090 | .011 (↑) | .049 ↑ | .009 (↓) | ||||
| cohen's d | 0.407 | 0.554 | 0.442 | 0.532 | 0.295 | 0.509 | 0.354 | 0.513 | |||||
| Gender | p‐value | .044 (↓) | .009 (↑) | .027 (↓) | .012 (↓) | .112 | .009 (↑) | .066 | .012 (↓) | ||||
| cohen's d | 0.378 | 0.525 | 0.416 | 0.502 | 0.270 | 0.496 | 0.332 | 0.499 | |||||
| Hemodynamic lags | p‐value | .042 (↓) | .009 (↑) | .024 (↓) | .011 (↓) | .115 | .017 (↑) | .070 | .015 (↓) | ||||
| cohen's d | 0.386 | 0.514 | 0.426 | 0.492 | 0.260 | 0.465 | 0.323 | 0.468 |
Note: Significant between‐group differences and related effect sizes are highlighted in bold. Cp, clustering coefficient; Lp, characteristic path length; Eloc, local efficiency; Eglob, global efficiency; , normalized clustering coefficient; , normalized characteristic path length; , normalized local efficiency; , normalized global efficiency; ↓, TIA < HCs; ↑, TIA > HCs; Fan, brain parcellation from Fan et al. (2016); Power, brain parcellation from Power et al. (2011).
4. DISCUSSION
In this study, we investigated the topological organization of intrinsic functional brain networks in patients with TIA. We found that TIA was associated with disrupted network organization at multiple levels. Moreover, the network disruptions were largely reproducible when using different brain parcellation schemes or correcting for micro head motion and regional gray matter volume, cerebral blood flow and hemodynamic lag of BOLD signals, correlated with the patients' biochemical indicators, and distinguished the patients from HCs and predicted future ischemic attacks in the patients with clinically relevant accuracy. Overall, these findings provide evidence for the network disconnection nature of TIA, which may help to elucidate the pathophysiological underpinnings and to establish objective and reliable biomarkers for TIA.
The human brain has highly specific cellular and circuit architecture to support specialized information processing on the one hand and can effectively integrate information across distributed systems via long‐range shortcut on the other hand. This powerful functionality can be quantitatively characterized by small‐world organization, an attractive model to support efficient information transfer of both specialized or modular and integrated or distributed processing (Bassett & Bullmore, 2017; Liao et al., 2017). In this study, we found that functional brain networks of the TIA patients followed the small‐world organization, suggesting the preservation of an optimal wiring layout in TIA.
Despite the optimal wiring layout, quantitative comparisons revealed a longer characteristic path length and lower clustering coefficient of functional brain networks in the patients with TIA. Analogously, network efficiency analysis revealed decreased local and global efficiency in the patients. The clustering coefficient and local efficiency reflect functional segregation to support modular information processing and are predominantly associated with short‐range connections between nearby brain regions, whereas the characteristic path length and global efficiency reflect functional integration in favor of distributed information processing and are mainly associated with long‐range connections between and across remote brain regions. Accordingly, the observed alterations suggest a reduced ability to support modular and distributed information processing in the TIA patients. In particular, the TIA‐related increase in characteristic path length and decrease in global efficiency remained after normalization by benchmark random networks and were consistently detected when different brain parcellation schemes were used. These findings suggest that the impaired global integration might be an intrinsic alteration in TIA and could serve as a reliable indicator for the condition. The integrated deficits may be consequences of TIA‐related damage to interregional coordination, especially inter‐hemispheric communication, as revealed by our functional connectivity analysis. It is worth noting that lower global efficiency was also observed for functional brain networks in patients with stroke (Fallani et al., 2009; Yin et al., 2014). Given that a considerable proportion of TIA patients experience a complete ischemic stroke in the near future (Johnston et al., 2007; Johnston, Gress, Browner, & Sidney, 2000), it would be interesting for future studies to explore whether the TIA‐induced integrated impairments continue to worsen in TIA converters and recover in non‐converters.
At a nodal level, TIA‐related centrality decreased mainly in the bilateral insula and subcortical basal ganglia. The insula receives numerous inputs directly from cortical areas and indirectly via the thalamus for sensory, somatic and interoceptive processing; moreover, it is also related to high‐order processing by interconnecting with cognition‐ and emotion‐related regions such as the medial temporal lobe and amygdala (Craig, 2009; Mesulam & Mufson, 1982). Similarly, despite historically being considered a motor structure, the basal ganglia receives projections from all lobes of the cerebral cortex and is implicated in cognitive and emotional processing (Mink, 1996). With regard to TIA, it not only causes motor‐related symptoms such as paralysis, weakness, or numbness but also is accompanied by cognitive impairments in multiple domains, including executive function, information processing speed and abstraction (Bakker et al., 2003a; Sachdev et al., 2004). Thus, we propose that these alterations may at least partly contribute to the sensory, motor, cognitive, and emotional problems in TIA, a speculation that could be tested in the future. Interestingly, the centrality alterations appear to be independent of GM atrophy and cerebral hypoperfusion, implying that they are essentially functional rather than derivatives of structural or metabolic abnormalities. Future studies are required to uncover additional mechanisms related to the centrality alterations of the insula and basal ganglia.
In addition, three cortical regions were found to show decreased nodal centrality in TIA, including the left middle occipital gyrus, right rolandic operculum, and middle temporal gyrus of the temporal pole. The left middle occipital gyrus is considered a part of the visual dorsal stream, and is involved in object localization (Wandell, Dumoulin, & Brewer, 2007). Activation of the rolandic operculum is related to the structuring of individual words into phrases and sentences during the perception of spoken sentences (Indefrey et al., 2001). The middle temporal gyrus is involved in semantic memory and language processes (Kiehl et al., 2004). Thus, we speculate that the decreased nodal centrality in these cortical regions may be related to the difficulties in visual, acoustic and language processing in patients with TIA. However, the cortical alterations became nonsignificant after correcting for potential GM atrophy and cerebral hypoperfusion, suggesting a structural and metabolic substrate. Future studies are needed to clarify the differentiation and related origin of function–structure and function‐perfusion relationships between cortical and subcortical regions.
Our NBS analysis revealed widespread functional connectivity decreases in the patients with TIA, which included all regions showing decreased centrality in the patients. Thus, these two sets of results mutually support each other. Intriguingly, the TIA‐related functional connectivity decreases mainly involved interhemispheric connections. This is consistent with previous studies in stroke, which consistently reported reductions in interhemispheric functional connectivity of multiple brain systems, including the somatomotor network (Carter et al., 2010; Carter et al., 2012; Park et al., 2011; Wang, Yu, et al., 2010) attention network (Nomura et al., 2010) and language network (Warren, Crinion, Lambon Ralph, & Wise, 2009). Our results imply that impaired interhemispheric connectivity is already detectable in TIA, an important risk factor for stroke, and thus may be a reliable marker of ischemic attacks. However, this finding was from network analysis at a regional level, which is unable to reveal subtle focal alterations. Future studies utilizing a voxel‐mirrored homotopic connectivity method (Zuo et al., 2010), which allows for an examination of interhemispheric functional connectivity between homotopic regions of two hemispheres at a voxel level, may provide more details on disruptions of inter‐hemispheric communication in TIA.
We found that the increased characteristic path length was negatively, while the decreased global efficiency and nodal centrality of the left insula were positively correlated with HDL‐C in the TIA patients. That is, the higher the HDL‐C in the patients (i.e., the closer they approached the HC values), the closer to normal were the relevant network metrics. HDL‐C is associated with the incidence of cardiovascular events. Specifically, a lower level of HDL‐C is associated with accumulation of atherosclerosis within the walls of arteries, which elevates the risk of ischemic attacks (Parhofer, 2015). Therefore, the network alterations may serve as an index to monitor the risk of ischemic attacks. A deeper understanding of the relationships could be obtained by systematically elucidating sequential or causal relationships among upstream pathophysiological and molecular pathology, midstream brain alterations, and downstream clinical phenotypes in the disease. Notably, our correlation results did not pass multiple comparison correction and thus the relevant findings should be interpreted with caution.
Currently, the diagnosis of TIA is mainly based on subjective knowledge and experience, and thus inevitably suffers from bias. Because it is an important risk factor for ischemic stroke (Johnston et al., 2000; Johnston et al., 2007), an accurate and objective diagnosis of TIA would be of great clinical value for early intervention to prevent or delay possible progression. Using the ROC method, our preliminary analysis showed that functional network alterations could not only differentiate TIA patients from HCs but could also predict follow‐up ischemic attacks in the patients with clinically relevant sensitivity and specificity. These findings highlight the potential of functional brain analysis in establishing diagnostic and prognostic biomarkers for TIA. Notably, the insula was related to the HDL‐C and could predict follow‐up ischemic attacks in the patients simultaneously. Interestingly, previous studies found that insular ischemic stroke was associated with an increased risk of poststroke mortality (Hanne et al., 2017; Sposato et al., 2016). These findings together suggest the insula as a key structure in the vascular etiology of brain ischemia and as a promising treatment target on which influence can be exerted to improve prognosis of the disease. Future follow‐up studies are of great importance to elucidate the roles played by the insula when TIA progress to stroke.
The present study has several limitations. First, we did not collect MRI data during the follow‐up period, and thus cannot examine how functional brain networks reorganize as TIA continues to advance. Future longitudinal studies are warranted to examine whether the current approach could be used to monitor progression of TIA. Second, this study lacked cognitive data for the patients. It would be interesting to investigate the relationships between large‐scale network alterations and cognitive dysfunction associated with TIA. Third, based on one‐dimensional features, our preliminary ROC analyses indicated that functional brain network alterations are promising as diagnostic and prognostic biomarkers for TIA. The generalization ability of these results should be cross‐validated in the future by utilizing more sophisticated discriminant methods based on multivariable techniques. Fourth, all patients included in this study took medication previously. However, we did not collect a detailed medication history, and thus cannot rule out the possible effects of medication on our findings. Future studies enrolling drug‐naive patients could help clarify this issue. Fifth, although our findings from the correlation, classification, and prediction analyses strongly suggest the potential of the observed network alterations as diagnostic and prognostic biomarkers for TIA, they are not yet sufficient to become biomarkers in clinical practice because little is known regarding the specificity of these alterations to TIA. Exploring such specificity is an important direction for future research. Finally, recent evidence highlights poor correspondence among different modalities of brain networks (Reid et al., 2016). Accordingly, it is important to examine similarities and differences in TIA‐induced topological alterations among different MRI modalities to provide a more complete view of network disorganization in the disease.
Supporting information
Supplementary Table 1 Regions of interest
ACKNOWLEDGMENTS
This work was supported by grants from the National Key R&D Program of China (No. 2017YFC1310000) and National Natural Science Foundation of China (No. 81671764, 81771911 and 81301210). We thank all the patients and volunteers for participating in this study
Lv Y, Han X, Song Y, et al. Toward neuroimaging‐based network biomarkers for transient ischemic attack. Hum Brain Mapp. 2019;40:3347–3361. 10.1002/hbm.24602
Funding information National Key R&D Program of China, Grant/Award Number: 2017YFC1310000; National Natural Science Foundation of China, Grant/Award Number: 81671764; 81771911; 81301210
REFERENCES
- Achard, S. , & Bullmore, E. T. (2007). Efficiency and cost of economical brain functional networks. PLoS Computational Biology, 3(2), 174–183. 10.1371/journal.pcbi.0030017 [DOI] [PMC free article] [PubMed] [Google Scholar]
- Achard, S. , Salvador, R. , Whitcher, B. , Suckling, J. , & Bullmore, E. (2006). A resilient, low‐frequency, small‐world human brain functional network with highly connected association cortical hubs. The Journal of Neuroscience, 26(1), 63–72. 10.1523/JNEUROSCI.3874-05.2006 [DOI] [PMC free article] [PubMed] [Google Scholar]
- Adhikari, M. H. , Hacker, C. D. , Siegel, J. S. , Griffa, A. , Hagmann, P. , Deco, G. , & Corbetta, M. (2017). Decreased integration and information capacity in stroke measured by whole brain models of resting state activity. Brain, 140, 1068–1085. 10.1093/brain/awx021 [DOI] [PMC free article] [PubMed] [Google Scholar]
- Alexander‐Bloch, A. , Giedd, J. N. , & Bullmore, E. T. (2013). Imaging structural co‐variance between human brain regions. Nature Reviews Neuroscience, 14(5), 322–336. 10.1038/nrn3465 [DOI] [PMC free article] [PubMed] [Google Scholar]
- Bakker, F. C. , Klijn, C. J. , Jennekens‐Schinkel, A. , van der Tweel, I. , Tulleken, C. A. , & Kappelle, L. J. (2003a). Cognitive impairment in patients with carotid artery occlusion and ipsilateral transient ischemic attacks. Journal of Neurology, 250(11), 1340–1347. 10.1007/s00415-003-0222-1 [DOI] [PubMed] [Google Scholar]
- Bakker, F. C. , Klijn, C. J. , Jennekens‐Schinkel, A. , van der Tweel, I. , van der Grond, J. , van Huffelen, A. C. , … Kappelle, L. J. (2003b). Cognitive impairment is related to cerebral lactate in patients with carotid artery occlusion and ipsilateral transient ischemic attacks. Stroke, 34(6), 1419–1424. 10.1161/01.STR.0000069725.09499.14 [DOI] [PubMed] [Google Scholar]
- Barch, D. M. (2013). Brain network interactions in health and disease. Trends in Cognitive Sciences, 17(12), 603–605. 10.1016/j.tics.2013.09.004 [DOI] [PMC free article] [PubMed] [Google Scholar]
- Bassett, D. S. , & Bullmore, E. T. (2017). Small‐world brain networks revisited. The Neuroscientist, 23(5), 499–516. 10.1177/1073858416667720 [DOI] [PMC free article] [PubMed] [Google Scholar]
- Bassett, D. S. , Wymbs, N. F. , Porter, M. A. , Mucha, P. J. , Carlson, J. M. , & Grafton, S. T. (2011). Dynamic reconfiguration of human brain networks during learning. Proceedings of the National Academy of Sciences of the United States of America, 108(18), 7641–7646. 10.1073/pnas.1018985108 [DOI] [PMC free article] [PubMed] [Google Scholar]
- Biswal, B. , Yetkin, F. Z. , Haughton, V. M. , & Hyde, J. S. (1995). Functional connectivity in the motor cortex of resting human brain using echo‐planar MRI. Magnetic Resonance in Medicine, 34(4), 537–541. [DOI] [PubMed] [Google Scholar]
- Bullmore, E. T. , & Sporns, O. (2009). Complex brain networks: Graph theoretical analysis of structural and functional systems. Nature Reviews Neuroscience, 10(3), 186–198. 10.1038/nrn2575 [DOI] [PubMed] [Google Scholar]
- Carter, A. R. , Astafiev, S. V. , Lang, C. E. , Connor, L. T. , Rengachary, J. , Strube, M. J. , … Corbetta, M. (2010). Resting interhemispheric functional magnetic resonance imaging connectivity predicts performance after stroke. Annals of Neurology, 67(3), 365–375. 10.1002/ana.21905 [DOI] [PMC free article] [PubMed] [Google Scholar]
- Carter, A. R. , Patel, K. R. , Astafiev, S. V. , Snyder, A. Z. , Rengachary, J. , Strube, M. J. , … Corbetta, M. (2012). Upstream dysfunction of Somatomotor functional connectivity after corticospinal damage in stroke. Neurorehabilitation and Neural Repair, 26(1), 7–19. 10.1177/1545968311411054 [DOI] [PMC free article] [PubMed] [Google Scholar]
- Chi, N. F. , Ku, H. L. , Chen, D. Y. , Tseng, Y. C. , Chen, C. J. , Lin, Y. C. , … Hu, C. J. (2018). Cerebral motor functional connectivity at the acute stage: An outcome predictor of ischemic stroke. Scientific Reports, 8(1), 16803 10.1038/s41598-018-35192-y [DOI] [PMC free article] [PubMed] [Google Scholar]
- Christen, T. , Jahanian, H. , Ni, W. W. , Qiu, D. Q. , Moseley, M. E. , & Zaharchuk, G. (2015). Noncontrast mapping of arterial delay and functional connectivity using resting‐state functional MRI: A study in Moyamoya patients. Journal of Magnetic Resonance Imaging, 41(2), 424–430. 10.1002/jmri.24558 [DOI] [PMC free article] [PubMed] [Google Scholar]
- Cole, M. W. , Bassett, D. S. , Power, J. D. , Braver, T. S. , & Petersen, S. E. (2014). Intrinsic and task‐evoked network architectures of the human brain. Neuron, 83(1), 238–251. 10.1016/j.neuron.2014.05.014 [DOI] [PMC free article] [PubMed] [Google Scholar]
- Craig, A. D. (2009). Emotional moments across time: A possible neural basis for time perception in the anterior insula. Philosophical Transactions of the Royal Society, B: Biological Sciences, 364(1525), 1933–1942. 10.1098/rstb.2009.0008 [DOI] [PMC free article] [PubMed] [Google Scholar]
- Fair, D. A. , Nigg, J. T. , Iyer, S. , Bathula, D. , Mills, K. L. , Dosenbach, N. U. , … Milham, M. P. (2012). Distinct neural signatures detected for ADHD subtypes after controlling for micro‐movements in resting state functional connectivity MRI data. Frontiers in Systems Neuroscience, 6, 80 10.3389/fnsys.2012.00080 [DOI] [PMC free article] [PubMed] [Google Scholar]
- Fallani, F. D. , Astolfi, L. , Cincotti, F. , Mattia, D. , la Rocca, D. , Maksuti, E. , … Nagy, Z. (2009). Evaluation of the brain network organization from EEG signals: A preliminary evidence in stroke patient. The Anatomical Record: Advances in Integrative Anatomy and Evolutionary Biology, 292(12), 2023–2031. 10.1002/ar.20965 [DOI] [PubMed] [Google Scholar]
- Fan, L. Z. , Li, H. , Zhuo, J. J. , Zhang, Y. , Wang, J. J. , Chen, L. F. , … Jiang, T. Z. (2016). The human Brainnetome atlas: A new brain atlas based on connectional architecture. Cerebral Cortex, 26(8), 3508–3526. 10.1093/cercor/bhw157 [DOI] [PMC free article] [PubMed] [Google Scholar]
- Fox, M. D. , & Raichle, M. E. (2007). Spontaneous fluctuations in brain activity observed with functional magnetic resonance imaging. Nature Reviews Neuroscience, 8(9), 700–711. 10.1038/nrn2201 [DOI] [PubMed] [Google Scholar]
- Fox, M. D. , Zhang, D. , Snyder, A. Z. , & Raichle, M. E. (2009). The global signal and observed anticorrelated resting state brain networks. Journal of Neurophysiology, 101(6), 3270–3283. 10.1152/jn.90777.2008 [DOI] [PMC free article] [PubMed] [Google Scholar]
- Freeman, L. C. (1977). A set of measures of centrality based on betweenness. Sociometry, 40, 35–41. [Google Scholar]
- Friston, K. J. , Williams, S. , Howard, R. , Frackowiak, R. S. , & Turner, R. (1996). Movement‐related effects in fMRI time‐series. Magnetic Resonance in Medicine, 35(3), 346–355. [DOI] [PubMed] [Google Scholar]
- Giles, M. F. , & Rothwell, P. M. (2007). Risk of stroke early after transient ischaemic attack: A systematic review and meta‐analysis. Lancet Neurology, 6(12), 1063–1072. 10.1016/S1474-4422(07)70274-0 [DOI] [PubMed] [Google Scholar]
- Guo, J. , Chen, N. , Li, R. , Wu, Q. , Chen, H. , Gong, Q. , & He, L. (2014). Regional homogeneity abnormalities in patients with transient ischaemic attack: A resting‐state fMRI study. Clinical Neurophysiology, 125(3), 520–525. 10.1016/j.clinph.2013.08.010 [DOI] [PubMed] [Google Scholar]
- Hallquist, M. N. , Hwang, K. , & Luna, B. (2013). The nuisance of nuisance regression: Spectral misspecification in a common approach to resting‐state fMRI preprocessing reintroduces noise and obscures functional connectivity. NeuroImage, 82, 208–225. 10.1016/j.neuroimage.2013.05.116 [DOI] [PMC free article] [PubMed] [Google Scholar]
- Hanne, L. , Brunecker, P. , Grittner, U. , Endres, M. , Villringer, K. , Fiebach, J. B. , & Ebinger, M. (2017). Right insular infarction and mortality after ischaemic stroke. European Journal of Neurology, 24(1), 67–72. 10.1111/ene.13131 [DOI] [PubMed] [Google Scholar]
- He, Y. , Dagher, A. , Chen, Z. , Charil, A. , Zijdenbos, A. , Worsley, K. , & Evans, A. (2009). Impaired small‐world efficiency in structural cortical networks in multiple sclerosis associated with white matter lesion load. Brain, 132(Pt 12), 3366–3379. 10.1093/brain/awp089 [DOI] [PMC free article] [PubMed] [Google Scholar]
- He, Y. , & Evans, A. (2010). Graph theoretical modeling of brain connectivity. Current Opinion in Neurology, 23(4), 341–350. 10.1097/WCO.0b013e32833aa567 [DOI] [PubMed] [Google Scholar]
- Indefrey, P. , Brown, C. M. , Hellwig, F. , Amunts, K. , Herzog, H. , Seitz, R. J. , & Hagoort, P. (2001). A neural correlate of syntactic encoding during speech production. Proceedings of the National Academy of Sciences of the United States of America, 98(10), 5933–5936. 10.1073/pnas.101118098 [DOI] [PMC free article] [PubMed] [Google Scholar]
- Jahanian, H. , Christen, T. , Moseley, M. E. , & Zaharchuk, G. (2018). Erroneous resting‐state fMRI connectivity maps due to prolonged arterial arrival time and how to fix them. Brain Connectivity, 8(6), 362–370. 10.1089/brain.2018.0610 [DOI] [PMC free article] [PubMed] [Google Scholar]
- Johnston, S. C. , Gress, D. R. , Browner, W. S. , & Sidney, S. (2000). Short‐term prognosis after emergency department diagnosis of TIA. JAMA, 284(22), 2901–2906. [DOI] [PubMed] [Google Scholar]
- Johnston, S. C. , Rothwell, P. M. , Nguyen‐Huynh, M. N. , Giles, M. F. , Elkins, J. S. , Bernstein, A. L. , & Sidney, S. (2007). Validation and refinement of scores to predict very early stroke risk after transient ischaemic attack. Lancet, 369(9558), 283–292. 10.1016/S0140-6736(07)60150-0 [DOI] [PubMed] [Google Scholar]
- Kiehl, K. A. , Smith, A. M. , Mendrek, A. , Forster, B. B. , Hare, R. D. , & Liddle, P. F. (2004). Temporal lobe abnormalities in semantic processing by criminal psychopaths as revealed by functional magnetic resonance imaging. Psychiatry Research, 130(3), 297–312. [DOI] [PubMed] [Google Scholar]
- Kleinman, J. T. , Zaharchuk, G. , Mlynash, M. , Ogdie, A. A. , Straka, M. , Lansberg, M. G. , … Olivot, J. M. (2012). Automated perfusion imaging for the evaluation of transient ischemic attack. Stroke, 43(6), 1556–1560. 10.1161/Strokeaha.111.644971 [DOI] [PMC free article] [PubMed] [Google Scholar]
- Latora, V. , & Marchiori, M. (2001). Efficient behavior of small‐world networks. Physical Review Letters, 87(19), 198701. 10.1103/PhysRevLett.87.198701 [DOI] [PubMed] [Google Scholar]
- Li, R. , Guo, J. , Ma, X. , Wang, S. , Zhang, J. , He, L. , … Chen, H. (2015). Alterations in the gray matter volume in transient ischemic attack: A voxel‐based morphometry study. Neurological Research, 37(1), 43–49. 10.1179/1743132814Y.0000000406 [DOI] [PubMed] [Google Scholar]
- Li, R. , Wang, S. , Zhu, L. , Guo, J. , Zeng, L. , Gong, Q. , … Chen, H. (2013). Aberrant functional connectivity of resting state networks in transient ischemic attack. PLoS ONE, 8(8), e71009. 10.1371/journal.pone.0071009 [DOI] [PMC free article] [PubMed] [Google Scholar]
- Liang, X. , Zou, Q. , He, Y. , & Yang, Y. (2013). Coupling of functional connectivity and regional cerebral blood flow reveals a physiological basis for network hubs of the human brain. Proceedings of the National Academy of Sciences of the United States of America, 110(5), 1929–1934. 10.1073/pnas.1214900110 [DOI] [PMC free article] [PubMed] [Google Scholar]
- Liao, X. , Vasilakos, A. V. , & He, Y. (2017). Small‐world human brain networks: Perspectives and challenges. Neuroscience and Biobehavioral Reviews, 77, 286–300. 10.1016/j.neubiorev.2017.03.018 [DOI] [PubMed] [Google Scholar]
- Lord, A. , Ehrlich, S. , Borchardt, V. , Geisler, D. , Seidel, M. , Huber, S. , … Walter, M. (2016). Brain parcellation choice affects disease‐related topology differences increasingly from global to local network levels. Psychiatry Research: Neuroimaging, 249, 12–19. 10.1016/j.pscychresns.2016.02.001 [DOI] [PubMed] [Google Scholar]
- Lv, Y. , Wei, W. , Song, Y. , Han, Y. , Zhou, C. , Zhou, D. , … Han, X. (2018). Non‐invasive evaluation of cerebral perfusion in patients with transient ischemic attack: An fMRI study. Journal of Neurology, 266, 157–164. 10.1007/s00415-018-9113-3 [DOI] [PubMed] [Google Scholar]
- MacIntosh, B. J. , Lindsay, A. C. , Kylintireas, I. , Kuker, W. , Gunther, M. , Robson, M. D. , … Jezzard, P. (2010). Multiple inflow pulsed arterial spin‐labeling reveals delays in the arterial arrival time in minor stroke and transient ischemic attack. AJNR. American Journal of Neuroradiology, 31(10), 1892–1894. 10.3174/ajnr.A2008 [DOI] [PMC free article] [PubMed] [Google Scholar]
- Maslov, S. , & Sneppen, K. (2002). Specificity and stability in topology of protein networks. Science, 296(5569), 910–913. 10.1126/science.1065103 [DOI] [PubMed] [Google Scholar]
- Mesulam, M. M. , & Mufson, E. J. (1982). Insula of the old world monkey. III: Efferent cortical output and comments on function. The Journal of Comparative Neurology, 212(1), 38–52. 10.1002/cne.902120104 [DOI] [PubMed] [Google Scholar]
- Milo, R. , Shen‐Orr, S. , Itzkovitz, S. , Kashtan, N. , Chklovskii, D. , & Alon, U. (2002). Network motifs: Simple building blocks of complex networks. Science, 298(5594), 824–827. 10.1126/science.298.5594.824 [DOI] [PubMed] [Google Scholar]
- Mink, J. W. (1996). The basal ganglia: Focused selection and inhibition of competing motor programs. Progress in Neurobiology, 50(4), 381–425. [DOI] [PubMed] [Google Scholar]
- Murphy, K. , Birn, R. M. , Handwerker, D. A. , Jones, T. B. , & Bandettini, P. A. (2009). The impact of global signal regression on resting state correlations: Are anti‐correlated networks introduced? NeuroImage, 44(3), 893–905. 10.1016/j.neuroimage.2008.09.036 [DOI] [PMC free article] [PubMed] [Google Scholar]
- Murphy, K. , & Fox, M. D. (2017). Towards a consensus regarding global signal regression for resting state functional connectivity MRI. NeuroImage, 154, 169–173. 10.1016/j.neuroimage.2016.11.052 [DOI] [PMC free article] [PubMed] [Google Scholar]
- Nomura, E. M. , Gratton, C. , Visser, R. M. , Kayser, A. , Perez, F. , & D'Esposito, M. (2010). Double dissociation of two cognitive control networks in patients with focal brain lesions. Proceedings of the National Academy of Sciences of the United States of America, 107(26), 12017–12022. 10.1073/pnas.1002431107 [DOI] [PMC free article] [PubMed] [Google Scholar]
- Parhofer, K. G. (2015). Increasing HDL‐cholesterol and prevention of atherosclerosis: A critical perspective. Atherosclerosis. Supplements, 18, 109–111. 10.1016/j.atherosclerosissup.2015.02.020 [DOI] [PubMed] [Google Scholar]
- Park, C. H. , Chang, W. H. , Ohn, S. H. , Kim, S. T. , Bang, O. Y. , Pascual‐Leone, A. , & Kim, Y. H. (2011). Longitudinal changes of resting‐state functional connectivity during motor recovery after stroke. Stroke, 42(5), 1357–1362. 10.1161/STROKEAHA.110.596155 [DOI] [PMC free article] [PubMed] [Google Scholar]
- Power, J. D. , Cohen, A. L. , Nelson, S. M. , Wig, G. S. , Barnes, K. A. , Church, J. A. , … Petersen, S. E. (2011). Functional network organization of the human brain. Neuron, 72(4), 665–678. 10.1016/j.neuron.2011.09.006 [DOI] [PMC free article] [PubMed] [Google Scholar]
- Qiao, X. J. , Salamon, N. , Wang, D. J. , He, R. , Linetsky, M. , Ellingson, B. M. , & Pope, W. B. (2013). Perfusion deficits detected by arterial spin‐labeling in patients with TIA with negative diffusion and vascular imaging. AJNR. American Journal of Neuroradiology, 34(11), 2125–2130. 10.3174/ajnr.A3551 [DOI] [PMC free article] [PubMed] [Google Scholar]
- Reid, A. T. , Lewis, J. , Bezgin, G. , Khundrakpam, B. , Eickhoff, S. B. , McIntosh, A. R. , … Evans, A. C. (2016). A cross‐modal, cross‐species comparison of connectivity measures in the primate brain. NeuroImage, 125, 311–331. 10.1016/j.neuroimage.2015.10.057 [DOI] [PubMed] [Google Scholar]
- Sachdev, P. S. , Brodaty, H. , Valenzuela, M. J. , Lorentz, L. , Looi, J. C. , Wen, W. , & Zagami, A. S. (2004). The neuropsychological profile of vascular cognitive impairment in stroke and TIA patients. Neurology, 62(6), 912–919. [DOI] [PubMed] [Google Scholar]
- Schultz‐Larsen, K. , Lomholt, R. K. , & Kreiner, S. (2007). Mini‐mental status examination: A short form of MMSE was as accurate as the original MMSE in predicting dementia. Journal of Clinical Epidemiology, 60(3), 260–267. 10.1016/j.jclinepi.2006.06.008 [DOI] [PubMed] [Google Scholar]
- Siegel, J. S. , Snyder, A. Z. , Ramsey, L. , Shulman, G. L. , & Corbetta, M. (2016). The effects of hemodynamic lag on functional connectivity and behavior after stroke. Journal of Cerebral Blood Flow and Metabolism, 36(12), 2162–2176. 10.1177/0271678X15614846 [DOI] [PMC free article] [PubMed] [Google Scholar]
- Sporns, O. (2014). Contributions and challenges for network models in cognitive neuroscience. Nature Neuroscience, 17(5), 652–660. 10.1038/nn.3690 [DOI] [PubMed] [Google Scholar]
- Sporns, O. , & Betzel, R. F. (2016). Modular brain networks. Annual Review of Psychology, 67, 613–640. 10.1146/annurev-psych-122414-033634 [DOI] [PMC free article] [PubMed] [Google Scholar]
- Sposato, L. A. , Cohen, G. , Wardlaw, J. M. , Sandercock, P. , Lindley, R. I. , Hachinski, V. , … the, I. S. T. C. G . (2016). Effect of right insular involvement on death and functional outcome after acute ischemic stroke in the IST‐3 trial (third international stroke trial). Stroke, 47(12), 2959–2965. 10.1161/STROKEAHA.116.014928 [DOI] [PubMed] [Google Scholar]
- Tomasi, D. , Wang, G. J. , & Volkow, N. D. (2013). Energetic cost of brain functional connectivity. Proceedings of the National Academy of Sciences of the United States of America, 110(33), 13642–13647. 10.1073/pnas.1303346110 [DOI] [PMC free article] [PubMed] [Google Scholar]
- Toppi, J. , Fallani, F. D. , Vecchiato, G. , Maglione, A. G. , Cincotti, F. , Mattia, D. , … Astolfi, L. (2012). How the statistical validation of functional connectivity patterns can prevent erroneous definition of small‐world properties of a brain connectivity network. Computational and Mathematical Methods in Medicine, 2012, 1–13. [DOI] [PMC free article] [PubMed] [Google Scholar]
- Tzourio‐Mazoyer, N. , Landeau, B. , Papathanassiou, D. , Crivello, F. , Etard, O. , Delcroix, N. , … Joliot, M. (2002). Automated anatomical labeling of activations in SPM using a macroscopic anatomical parcellation of the MNI MRI single‐subject brain. NeuroImage, 15(1), 273–289. 10.1006/nimg.2001.0978 [DOI] [PubMed] [Google Scholar]
- van den Heuvel, M. P. , & Sporns, O. (2013). Network hubs in the human brain. Trends in Cognitive Sciences, 17(12), 683–696. 10.1016/j.tics.2013.09.012 [DOI] [PubMed] [Google Scholar]
- van Wijk, B. C. , Stam, C. J. , & Daffertshofer, A. (2010). Comparing brain networks of different size and connectivity density using graph theory. PLoS ONE, 5(10), e13701. 10.1371/journal.pone.0013701 [DOI] [PMC free article] [PubMed] [Google Scholar]
- Wandell, B. A. , Dumoulin, S. O. , & Brewer, A. A. (2007). Visual field maps in human cortex. Neuron, 56(2), 366–383. 10.1016/j.neuron.2007.10.012 [DOI] [PubMed] [Google Scholar]
- Wang, J. , Wang, L. , Zang, Y. , Yang, H. , Tang, H. , Gong, Q. , … He, Y. (2009). Parcellation‐dependent small‐world brain functional networks: A resting‐state fMRI study. Human Brain Mapping, 30(5), 1511–1523. 10.1002/hbm.20623 [DOI] [PMC free article] [PubMed] [Google Scholar]
- Wang, J. , Wang, X. , He, Y. , Yu, X. , Wang, H. , & He, Y. (2015). Apolipoprotein E epsilon4 modulates functional brain connectome in Alzheimer's disease. Human Brain Mapping, 36(5), 1828–1846. 10.1002/hbm.22740 [DOI] [PMC free article] [PubMed] [Google Scholar]
- Wang, J. , Zuo, X. , & He, Y. (2010). Graph‐based network analysis of resting‐state functional MRI. Frontiers in Systems Neuroscience, 4, 16 10.3389/fnsys.2010.00016 [DOI] [PMC free article] [PubMed] [Google Scholar]
- Wang, J. H. , Wang, X. D. , Xia, M. R. , Liao, X. H. , Evans, A. , & He, Y. (2015). GRETNA: A graph theoretical network analysis toolbox for imaging connectomics. Frontiers in Human Neuroscience, 9, 386 10.3389/Fnhum.2015.00458 [DOI] [PMC free article] [PubMed] [Google Scholar]
- Wang, J. H. , Zuo, X. N. , Dai, Z. J. , Xia, M. R. , Zhao, Z. L. , Zhao, X. L. , … He, Y. (2013). Disrupted functional brain connectome in individuals at risk for Alzheimer's disease. Biological Psychiatry, 73(5), 472–481. 10.1016/j.biopsych.2012.03.026 [DOI] [PubMed] [Google Scholar]
- Wang, J. H. , Zuo, X. N. , Gohel, S. , Milham, M. P. , Biswal, B. B. , & He, Y. (2011). Graph theoretical analysis of functional brain networks: Test‐retest evaluation on short‐ and long‐term resting‐state functional MRI data. PLoS ONE, 6(7), e21976. 10.1371/journal.pone.0021976 [DOI] [PMC free article] [PubMed] [Google Scholar]
- Wang, L. , Yu, C. , Chen, H. , Qin, W. , He, Y. , Fan, F. , … Zhu, C. (2010). Dynamic functional reorganization of the motor execution network after stroke. Brain, 133(Pt 4), 1224–1238. 10.1093/brain/awq043 [DOI] [PubMed] [Google Scholar]
- Warren, J. E. , Crinion, J. T. , Lambon Ralph, M. A. , & Wise, R. J. (2009). Anterior temporal lobe connectivity correlates with functional outcome after aphasic stroke. Brain, 132, 3428–3442. 10.1093/brain/awp270 [DOI] [PMC free article] [PubMed] [Google Scholar]
- Watts, D. J. , & Strogatz, S. H. (1998). Collective dynamics of 'small‐world' networks. Nature, 393(6684), 440–442. 10.1038/30918 [DOI] [PubMed] [Google Scholar]
- Weissenbacher, A. , Kasess, C. , Gerstl, F. , Lanzenberger, R. , Moser, E. , & Windischberger, C. (2009). Correlations and anticorrelations in resting‐state functional connectivity MRI: A quantitative comparison of preprocessing strategies. NeuroImage, 47(4), 1408–1416. 10.1016/j.neuroimage.2009.05.005 [DOI] [PubMed] [Google Scholar]
- Xia, M. , Wang, J. , & He, Y. (2013). BrainNet viewer: A network visualization tool for human brain connectomics. PLoS ONE, 8(7), e68910. 10.1371/journal.pone.0068910 [DOI] [PMC free article] [PubMed] [Google Scholar]
- Yan, C. G. , Cheung, B. , Kelly, C. , Colcombe, S. , Craddock, R. C. , Di Martino, A. , … Milham, M. P. (2013). A comprehensive assessment of regional variation in the impact of head micromovements on functional connectomics. NeuroImage, 76, 183–201. 10.1016/j.neuroimage.2013.03.004 [DOI] [PMC free article] [PubMed] [Google Scholar]
- Yin, D. , Song, F. , Xu, D. , Sun, L. , Men, W. , Zang, L. , … Fan, M. (2014). Altered topological properties of the cortical motor‐related network in patients with subcortical stroke revealed by graph theoretical analysis. Human Brain Mapping, 35(7), 3343–3359. 10.1002/hbm.22406 [DOI] [PMC free article] [PubMed] [Google Scholar]
- Zaharchuk, G. , Olivot, J. M. , Fischbein, N. J. , Bammer, R. , Straka, M. , Kleinman, J. T. , & Albers, G. W. (2012). Arterial spin labeling imaging findings in transient ischemic attack patients: Comparison with diffusion‐ and bolus perfusion‐weighted imaging. Cerebrovascular Diseases, 34(3), 221–228. 10.1159/000339682 [DOI] [PMC free article] [PubMed] [Google Scholar]
- Zalesky, A. , Fornito, A. , & Bullmore, E. T. (2010). Network‐based statistic: Identifying differences in brain networks. NeuroImage, 53(4), 1197–1207. 10.1016/j.neuroimage.2010.06.041 [DOI] [PubMed] [Google Scholar]
- Zhang, J. , Wang, J. , Wu, Q. , Kuang, W. , Huang, X. , He, Y. , & Gong, Q. (2011). Disrupted brain connectivity networks in drug‐naive, first‐episode major depressive disorder. Biological Psychiatry, 70(4), 334–342. 10.1016/j.biopsych.2011.05.018 [DOI] [PubMed] [Google Scholar]
- Zhu, Y. , Bai, L. , Liang, P. , Kang, S. , Gao, H. , & Yang, H. (2017). Disrupted brain connectivity networks in acute ischemic stroke patients. Brain Imaging and Behavior, 11(2), 444–453. 10.1007/s11682-016-9525-6 [DOI] [PubMed] [Google Scholar]
- Zuo, X. N. , Kelly, C. , Di Martino, A. , Mennes, M. , Margulies, D. S. , Bangaru, S. , … Milham, M. P. (2010). Growing together and growing apart: Regional and sex differences in the lifespan developmental trajectories of functional homotopy. The Journal of Neuroscience, 30(45), 15034–15043. 10.1523/JNEUROSCI.2612-10.2010 [DOI] [PMC free article] [PubMed] [Google Scholar]
Associated Data
This section collects any data citations, data availability statements, or supplementary materials included in this article.
Supplementary Materials
Supplementary Table 1 Regions of interest