

Abstract
Brain age prediction using machine‐learning techniques has recently attracted growing attention, as it has the potential to serve as a biomarker for characterizing the typical brain development and neuropsychiatric disorders. Yet one long‐standing problem is that the predicted brain age is overestimated in younger subjects and underestimated in older. There is a plethora of claims as to the bias origins, both methodologically and in data itself. With a large neuroanatomical dataset (N = 2,026; 6–89 years of age) from multiple shared datasets, we show this bias is neither data‐dependent nor specific to particular method including deep neural network. We present an alternative account that offers a statistical explanation for the bias and describe a simple, yet efficient, method using general linear model to adjust the bias. We demonstrate the effectiveness of bias adjustment with a large multi‐modal neuroimaging data (N = 804; 8–21 years of age) for both healthy controls and post‐traumatic stress disorders patients obtained from the Philadelphia Neurodevelopmental Cohort.
Keywords: bias, brain age prediction, machine‐learning, PTSD, regression to the mean
1. INTRODUCTION
Age‐related changes in cognitive ability have been the focus of a growing field of cognitive neuroscience of aging (Cole & Franke, 2017; Dosenbach et al., 2010). The interest in brain age estimation is largely motivated by the importance of biological age prediction of brain, with the potential to identify individuals at risk of experiencing advanced or delayed brain aging and thus could provide a biomarker of age‐associated health problems.
Brain age can be predicted in individuals based on high‐dimensional neuroimaging data using machine‐learning techniques (Al Zoubi et al., 2018; Chung et al., 2018; Cole et al., 2017; Franke, Luders, May, Wilke, & Gaser, 2012; Liem et al., 2017). The predicted brain age can differ from the individual chronological age; the difference between the predicted age and the chronological age, termed the brain age gap (Franke, Ziegler, Klöppel, & Gaser, 2010) or predicted age difference (Cole, Leech, & Sharp, 2015), can be used to examine and capture any disease‐related deviations from natural aging. Brain age has been shown to relate to cognitive aging and to predict the risk of neurodegenerative diseases and mortality in older adults (Cole & Franke, 2017). The predicted brain age based on biological phenotypes, such as anatomical and functional measures of neuroimaging data, and its deviation from the chronological age, are being actively developed as potential biomarkers for characterizing the typical brain development and neuropsychiatric disorders (Bonifazi et al., 2018; Dosenbach et al., 2010; Erus et al., 2015).
In predicting brain age, an age‐related bias is usually observed (Aycheh et al., 2018; Cole et al., 2017; Pardoe & Kuzniecky, 2018). The key observation is that the predicted age is higher than the actual chronological age for younger subjects and lower for older subjects. Such an observation of overestimation in younger subjects and underestimation in older subjects is remarkably universal in almost every study. Yet the origins underlying such prediction bias have been largely unknown. The question of where the bias comes from has prompted a number of speculations, largely from the data point of view. One account, for example, has attributed the bias to the inconsistency of noise distribution across the lifespan (Cole et al., 2017). A different account is that the bias can be due to the sample size imbalance across age groups (Aycheh et al., 2018). Still, others explained that the bias is due to the characteristics of the sample data used to train the models, for example, heterogeneous nature of the data from multiple study sites (Pardoe & Kuzniecky, 2018). From the methodological viewpoint, it is also possible that the bias could be dependent on the particular methods used.
In this work, we set out to investigate the possible reasons underlying the bias by directly examining these different accounts using a large neuroanatomical data of 2,026 healthy subjects 6 to 89 years of age from multiple public datasets (ABIDE, CoRR, DLBS, and NKI Rockland), and we found all of these accounts untenable. To check if the bias is specific to particular methods, we further tested four widely‐used machine‐learning methods including ridge regression, support vector regression (Smola & Schölkopf, 2004), Gaussian processes regression (Rasmussen & Williams, 2005) and deep neural network (LeCun, Bengio, & Hinton, 2015); they all displayed the systematic bias in brain age prediction. Given the independence of the bias on both data and methods, we found out that the deeply entrenched concept of “regression towards (or to) the mean (RTM)” in statistics (Gardner & Heady, 1973; James, 1973; Davis, 1976; see Stigler (1997) for an historical account of RTM) offers a plausible explanation of the bias. We thereafter described a simple, yet efficient, method based on general linear model to adjust the bias. We demonstrated the effectiveness of bias adjustment with a large multi‐modal brain imaging data obtained from the Philadelphia Neurodevelopmental Cohort (PNC, Satterthwaite et al., 2014), consisting of T 1 weighted MRI, diffusion tensor imaging (DTI) and resting‐state fMRI for brain age prediction. In the PNC application, a regularized ridge regression model was built using the cross‐validation procedure in 734 health controls, then bias adjusted before it was successfully applied to independent external dataset of post‐traumatic stress disorders patient group.
2. MATERIALS AND METHODS
2.1. Dataset used
Healthy control neuroanatomical data used in this article to investigate the bias in brain age prediction were sourced from multiple shared brain imaging datasets, including the consortium for reliability and reproducibility study (CoRR, Zuo et al., 2014), the Dallas as lifespan brain study (DLBS, Rodrigue et al., 2012), the enhanced Nathan Kline Institute rockland sample (Nooner et al., 2012) and the autism brain imaging data exchanges studies (ABIDE, Di Martino et al., 2014). We selected total 2,026 healthy subjects aged 6 to 89 years pooled from ABIDE (566 subjects), baseline CoRR (778 subjects), DLBS (315 subjects), and NKI Rockland sample (367 subjects). The age distribution for each dataset is shown in Figure 1. Details of these datasets and image acquisition parameters can be found at http://fcon_1000.projects.nitrc.org.
Figure 1.
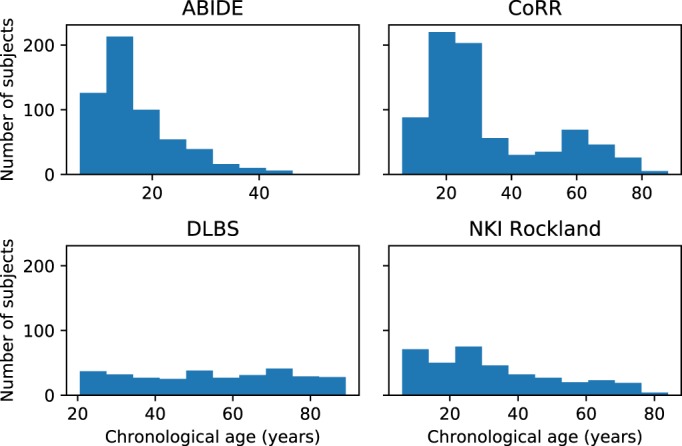
The age distribution for individual datasets of the ABIDE of 566 subjects, CoRR of 778 subjects, DLBS of 315 subjects and NKI Rockland of 367 subjects [Color figure can be viewed at http://wileyonlinelibrary.com]
For the image processing, we followed the processing steps described in Pardoe and Kuzniecky (2018). Briefly, we used the Freesurfer v5.3 default processing stream (Fischl & Dale, 2000) to analyze structural MRI scans. By following a similar approach to that presented in (Liem et al., 2017), cortical thickness surface maps were co‐registered to the “fsaverage4” template, which has 2,562 vertices per hemisphere (down‐sampled from 163,842 to 2,562 vertices to reduce the dimensionality), yielding a total of 5,124 features that were used to train the age prediction model. We used Freesurfer surfaces as input to the penalized ridge regression models, and an estimate of the age of the subject (in years) as output. The brain age gap was then calculated as the difference between predicted age and chronological age. We randomly selected 80% of data (1,621 subjects) for training, and the remaining 20% data (405 subjects) for testing to evaluate model performance.
The neuroimaging data used for demonstration of the bias adjustment were sourced from the PNC (Satterthwaite et al., 2014). We selected 804 subjects with multi‐modal brain imaging data including T 1 weighted MRI, diffusion tensor imaging (DTI) and resting‐state fMRI (rsfMRI), among which 70 were post‐traumatic stress disorders patients (PTSD group; age range, 9–21 years; 50 females), and 734 were healthy control without PTSD (age range, 8–21 years; 392 females).
T 1‐weighted images were preprocessed with CAT12.5 toolbox in SPM12. The steps include rough bias correction, coarse affine registration, global intensity correction, and segmentation. Then DARTEL registration were run with MNI 152 template. The gray matter volume (GMV) were averaged based on the neuromophormetrics atlas. DTI images were preprocessed with a pipeline tool, PANDA (Cui, Zhong, Xu, He, & Gong, 2013) (http://www.nitrc.org/projects/panda/) with the following steps: skull removal by brain extraction tool (BET), correction of eddy‐current distortion with Eddycorrect, and the diffusion tensor models built by DTIFIT. The fractional anisotropy (FA) and mean diffusivity (MD) values were then extracted based on the “JHU white‐matter tractography atlas” from FSL (http://www.fmrib.ox.ac.uk/fsl/data/atlas-descriptions.html#wm). We chose the 25%‐threshold sub‐template, which contains 20 major tracts and 50 major labels. For the resting‐state fMRI analysis, the data were processed with software Data Processing Assistant for Resting‐State fMRI (DPARSF) (Yan & Zang, 2010). After obtaining the metrics the regional homogeneity (ReHo) and the amplitude of low‐frequency fluctuation (ALFF), atlas‐based features were extracted based on the BN246 atlas (Fan et al., 2016). Together, there are total 775 features extracted: the GMV extracted from T1 image provides 143 features, the FA and MD extracted from the DTI each contribute 140 features, and the ReHo and ALFF extracted from the rsfMRI data each provide 246 features. Details of subject recruitment and study procedures are described in the previous study (Gur et al., 2010).
2.2. Brain age prediction models
To check whether the bias could be method‐dependent, we tested four popular machine‐learning methods including penalized ridge regression, support vector regression (Smola & Schölkopf, 2004), Gaussian processes regression (Rasmussen & Williams, 2005) and deep neural network (LeCun et al., 2015). For each prediction model, we used Freesurfer surfaces as input, and an estimate of the age of the subject (in years) as output. The brain age gap was then computed as the difference between predicted age and chronological age. Eighty percentage of data were randomly selected for training, and the remaining 20% data for testing to evaluate model performance.
For individual age prediction model, the model specifics are provided as follows. For penalized ridge regression, L2‐norm regularization was employed to improve the conditioning of the problem and reduce the variance of the estimates, where model parameters were determined by leave‐one‐out cross‐validation. For support vector regression, we used a linear kernel function, and the hyper‐parameters (penalty parameter and the margin of tolerance) were tuned using grid search (GridSearchCV in Scikit‐learn Python package; Pedregosa et al., 2011) for the best cross‐validation score. For Gaussian processes regression, we used a radial basis kernel and included a WhiteKernel component to account for the global noise level from the data, and the number of restarts was set to 10 for finding the kernel's parameters (the length scale and its bound) which maximized the log‐marginal likelihood. For deep neural network, the network is fully connected and has four hidden layers with 50 neurons each and hyperbolic tangent activation functions. A dropout rate of 0.5 is used to prevent neural networks from overfitting. The first layer corresponds to the inputs to the neural network, which have 5,124 features corresponding to the Freesurfer surfaces described above. To build and train the neural networks, we use the Python toolkit Keras (https://keras.io), which provides a high‐level application programming interface to access the TensorFlow (Abadi et al., 2016) (https://www.tensorflow.org) deep‐learning libraries. We train the networks using Keras, an Adam stochastic optimization method (Diederik & Ba, 2014), and a mean squared error cost function. The Python notebooks used in the article and for training and testing the age prediction models including penalized ridge regression, support vector regression, Gaussian processes regression and deep neural network described in this article are provided at https://github.com/hualouliang/BrainAgePrediction.
2.3. How to deal with the bias?
It is evident in the Results that the bias is neither data‐dependent nor specific to particular methods used. Then, the question is what causes the bias and how to deal with it. Addressing these questions is fundamental to brain age prediction. It turned out that the bias observed can be explained by “regression towards [or to] the mean (RTM),” an elementary concept that has long been known in statistics (Davis, 1976; Gardner & Heady, 1973; James, 1973). RTM is a statistical phenomenon that can make natural variation in repeated data look like real change. It happens when unusually large or small measurements tend to be followed by measurements that are closer to the average (Barnett, van der Pols, & Dobson, 2005). Despite its simplicity, it has been consistently misunderstood and it has repeatedly been the source of major errors in analysis. It occurs because values are observed with random error. The practical problem of RTM is the need to distinguish a real change from this expected change due to the random error. The effect of RTM can be reduced at the design and analysis stages of a study (Barnett et al., 2005; Yudkin & Stratton, 1996). These methods usually require multiple measurements, which is not always available to the problem of brain age prediction.
Here we described a simple, practical approach based on general linear model to adjust the bias (Twisk, 2003). In this method, we can quantify the bias as a function of chronological age for each cross‐validation iteration using a linear regression model, which is shown as follows:
The fitted parameters are then applied to adjust for the bias in the holdout sample. We note that we have added sex variable in the regression model to account for its effect on the predicted age as there is evidence that sex differences reflected in the co‐occurrence of PTSD symptoms (Cao et al., 2019). Other terms may also be added to the above equation to explain for confounders or other variables of interest. A seemingly similar approach (Le et al., 2018) has recently been proposed, but it regressed age on brain age gap estimation, whereas ours is on the predicted age. We also note that the above equation is similar to the analysis of covariance (ANCOVA) formula (Barnett et al., 2005) yet without the distinction of treatment or placebo group. In fact, ANCOVA is just a special case of a general linear model.
3. RESULTS
3.1. What is the bias in brain‐age estimation?
The bias effect is generally observed in the brain age prediction. To illustrate the bias effect of the overestimation in younger subjects and underestimation in older subjects, we directly compare chronological age with predicted age indexed from the least value of actual age to the greatest value, as shown in Figure 2 (Left), whereby the predicted age (red) is higher than the actual chronological age (black) for younger subjects and lower for older subjects. For example, at the lower end of age, the index 1 of the chronological age is 8 years, whereas the predicted age is 21 years. Similarly, at the upper end of age, the index 200 of the chronological age is 73 years, whereas the predicted age is 58 years. This age mismatch at two ends of the age range perhaps can be best seen by plotting the brain age gap (the difference between predicted age and chronological age) against the chronological age, as shown in Figure 2 (Right). The observation of overestimation in younger subjects and underestimation in older subjects is universal in brain‐age estimation.
Figure 2.
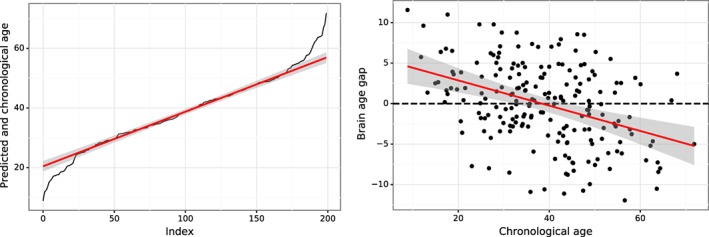
Schematic of the bias in the brain age prediction to show overestimation in younger subjects and underestimation in older subjects. Left: The chronological age (black) compared with the predicted age (red) obtained by penalized ridge regression. Right: Brain age gap (the difference between predicted age and chronological age) plotted as a function of the chronological age, with the best fit of line shown in red. The shaded area along the regression line indicates the 95% prediction interval [Color figure can be viewed at http://wileyonlinelibrary.com]
3.2. Is the bias specific to the data?
In this section, we directly examined existing accounts using a large neuroanatomical data of 2,026 healthy subjects aged 6 to 89 years from multiple public datasets (ABIDE, CoRR, DLBS, and NKI Rockland). We used penalized regression with L2 norms (ridge regression), a regularized linear approach, to avoid overfitting. The model parameters were determined by leave‐one‐out cross‐validation. The regularization improves the conditioning of the problem and reduces the variance of the estimates. In what follows, we specifically tested whether the bias is due to the data.
3.3. Is the bias due to the inconsistency of noise distribution across the lifespan?
As our first test, we checked whether the bias is due to inconsistent noise distribution across the lifespan. If the distribution of noise were not consistent across the lifespan, the bias would be specific to a certain age range. As such, we divided the whole lifespan of 6 to 89 years into three age ranges (6–30, 30–60, and 60 years—up) to see if the bias still exists. The results are shown in Figure 3, where the brain age gaps for different age ranges are plotted as a function of the chronological age. The correlation between brain‐predicted age and chronological age and the mean absolute error (MAE) for different age periods are as follows: 6–30 years (r = .85, MAE = 2.53 years), 30–60 years (r = .59, MAE = 6.82 years), and 60 years and up (r = .66, MAE = 4.26 years), whereas the correlation between the brain‐age gap and chronological age is, respectively, −.49, −.88, and − .76. It is evident that the bias in the upper and lower range is observed for all three age periods. We also tested with a various range of the age, and this bias seems to be rather universal.
Figure 3.
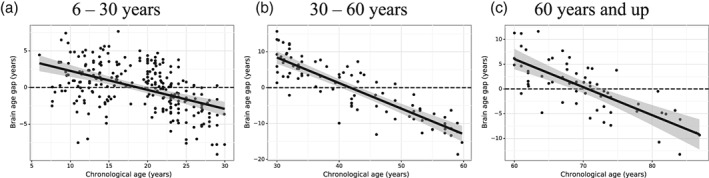
Brain age gap (the difference between predicted age and chronological age) as a function of the chronological age for different age ranges in 6–30 years (1,258 subjects, a), 30–60 years (457 subjects, b) and 60 years and up (311 subjects, c). The best fit of line of regression (black) is shown in each plot together with the 95% prediction interval (the shaded area)
Clearly, the bias is not due to the specifics of age itself; it is possible that the bias is merely the properties of any range of values with measurement related noise. To test this possibility, we checked whether the extent of the age range influences the level of bias. We tested three age ranges of different length: 6–30, 6–60, and 6 years—up. The results are shown in Figure 4, where the bias is also evident across all three age ranges: 6–30 years (r = .85, MAE = 2.53 years), 6–60 years (r = .83, MAE = 5.34 years), and 6 years and up (r = .91, MAE = 6.77 years). The correlation between the brain‐age gap and chronological age for each age range is, respectively, −0.49, −0.60, and − 0.52. Intriguingly, we did not observe any range‐specific influence on the level of bias. Taken together, we conclude that the bias is not due to particular age, nor is it specific to a certain age range, thus cannot be accounted by the inconsistency of noise distribution.
Figure 4.
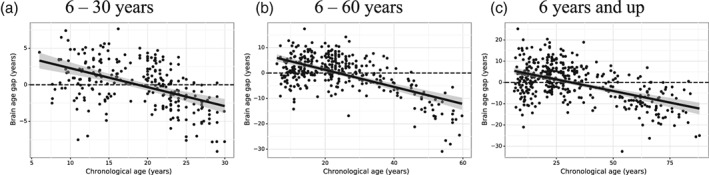
Brain age gap (the difference between predicted age and chronological age) as a function of the chronological age for the age ranges of different length in 6–30 years (1,258 subjects, a), 6–60 years (1,715 subjects, b) and 6 years and up (2,026 subjects, c). The best fit of line of regression (black) is shown in each plot together with the 95% prediction interval (the shaded area)
3.4. Is the bias due to the sample size imbalance across age groups?
In this test, we checked if the bias is due to the sample size imbalance across age groups. The original full data sample of 2,026 subjects showed a skewed distribution, with substantial more samples distributed below 40 years of age (especially 10–30 years) and relatively less samples above 40 years of age (blue curve in Figure 5, Left). Hence, the imbalance in sample size is evident across age groups. To obtain the balanced sample size, we randomly resampled the full dataset in 5‐year age intervals in groups with age ranges that were overrepresented in the complete pooled dataset (i.e., subject aged < 75 years). The resampled data of 782 subjects is of balanced sample size across age range, as shown in orange curve in Figure 5 (Left). We can see the balanced dataset shows approximately uniform distribution across the entire age range compared to the full data sample. Both the imbalanced full data sample and the balanced data sample were each used to train and test the age prediction models. Their brain age gaps are shown in Figure 5 (Right). We can see from Figure 5 that the bias still persists in both the imbalanced full data sample (r = .91, MAE = 6.77 years) and the balanced data sample (r = .91, MAE = 8.02 years), whereas the correlation between the brain‐age gap and chronological age for the imbalanced full data and the balanced data sample is both −0.52. These results indicate that the bias is not due to the sample size imbalance across age groups.
Figure 5.
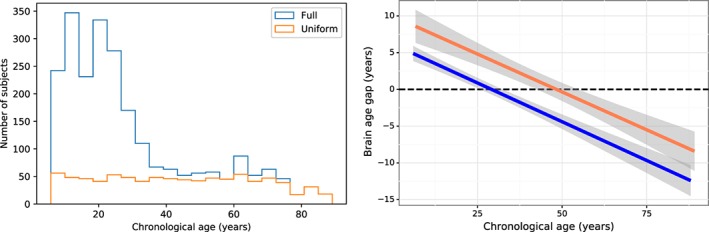
The effect of age distribution on the bias. Left: The age distribution with the full sample 2,026 subjects (in blue) and with the sample size of 782 subjects that approximately follows uniform distribution (in red). Right: The corresponding brain age gap as a function of the chronological age for different age distributions. The shaded area along the regression line indicates the 95% prediction interval [Color figure can be viewed at http://wileyonlinelibrary.com]
3.5. Is the bias due to heterogeneity of data from multiple sites?
As our final test, we checked if the bias is due to heterogeneous data from multiple study sites. In our study, the full MRI dataset consisted of 2,026 healthy controls pooled from multiple study sites of the ABIDE (566 subjects), CoRR (778 subjects), DLBS (315 subjects), and NKI Rockland (367 subjects) datasets. The heterogeneity of the multiple sources of data may have contributed to the observed bias. Hence, we are in a unique opportunity to test heterogeneous nature of data by fitting the age prediction models separately for individual data sites. The results are shown Figure 6, where we showed the changes of brain‐age gap as a function of the chronological age. The correlation between brain‐predicted age and chronological age and the MAE for different sites are ABIDE (r = .80, MAE = 3.51 years), CoRR (r = .89, MAE = 6.96 years), DLBS (r = .91, MAE = 6.81 years) and NKI Rockland (r = .89, MAE = 7.64 years). The correlation between the brain‐age gap and chronological age for ABIDE, CoRR, DLBS and NKI Rockland is, respectively, −.62, −.50, −.57, and −.59. From the results of Figure 6, we can conclude that the bias is not due to heterogeneity of the multiple sources of data.
Figure 6.

The brain age gap as a function of the chronological age for different study sites of the ABIDE of 566 subjects (a), CoRR of 778 subjects (b), DLBS of 315 subjects (c) and NKI Rockland of 367 subjects (d) datasets. The shaded area along the regression line indicates the 95% prediction interval
Taken together, this set of tests provides critical examination of various accounts about the bias in brain age prediction, we showed that the bias is not specific to the data, and the existing accounts are no longer tenable.
3.6. Is the bias specific to the methods?
Given that the bias is not specific to the data, it is natural to ask whether the bias could be dependent on the method used. As such, we tested four popular machine‐learning methods including penalized ridge regression (Ridge), support vector regression (SVR), Gaussian processes regression (GPR) and deep neural network (DNN). For each prediction model, we used Freesurfer surfaces as input, and an estimate of the age of the subject (in years) as output. The brain age gap was then computed as the difference between predicted age and chronological age. Eighty percentage of data (1,621 subjects) were randomly selected for training, and the remaining 20% data (405 subjects) for testing to evaluate model performance.
The results are shown in Figure 7, where the brain age gap for each prediction model is plotted against the chronological age. The correlation between brain‐predicted age and chronological age and the MAE for different methods are Ridge (r = .91, MAE = 6.77 years), GPR (r = .93, MAE = 5.96 years), SVR (r = .89, MAE = 7.43 years) and DNN (r = .93, MAE = 5.38 years). The correlation between the brain‐age gap and chronological age for Ridge, GPR, SVR and DNN Rockland is, respectively, −.52, −.46, −.39, and −.25. It can be seen from Figure 7 that all the models showed the systematic bias in brain age prediction, though the deep neural network performed best among all the models, which is consistent with our recent observation (Niu, Liang, & Zhang, 2018). These results further indicate that the bias is rather universal and is not specific to particular methods used.
Figure 7.
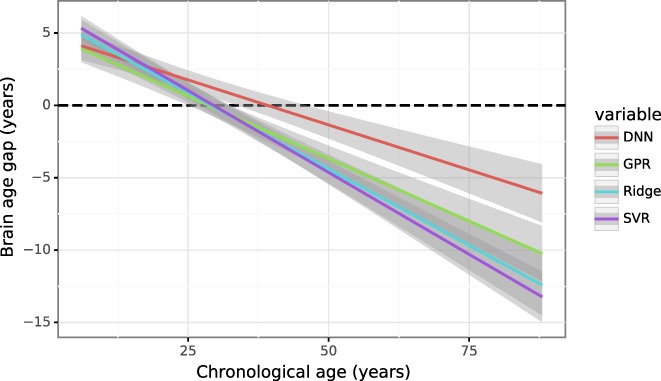
The brain age gap as a function of the chronological age using four different machine‐learning methods: Penalized ridge regression (ridge), support vector regression (SVR), Gaussian processes regression (GPR) and deep neural network (DNN). All the models showed overestimation in younger subjects and underestimation in older subjects. The shaded area along the regression line indicates the 95% prediction interval [Color figure can be viewed at http://wileyonlinelibrary.com]
3.7. Example analyses
To demonstrate the usage of our method for bias adjustment, we analyzed multi‐modal brain imaging data obtained from the PNC (Satterthwaite et al., 2014), consisting of T 1 weighted MRI, DTI, and resting state fMRI (rsFMRI) for brain age prediction. There are 804 subjects analyzed, which include 70 post‐traumatic stress disorders patients (PTSD group, age range, 9–21 years; 50 females), and 734 healthy control without PTSD (age range, 8–21 years; 392 females). We trained the age prediction models (regularized ridge regression) with healthy controls data, with model parameters determined by cross‐validation, and then tested with PTSD group.
The prediction bias of brain age for healthy controls is evident when plotting the brain age gap as a function of the individual chronological age, as shown in Figure 8 (Left), where the overestimations in younger subjects and underestimations in older subjects are clearly observed (r = .91, MAE = 1.15 years), with the brain‐age gap by chronological age correlation of −.59. To adjust the bias, we fitted the linear regression model of the predicted age in relation to the chronological age and sex. The fitted parameters and their 95% confidence intervals, as listed in Table 1, were used to adjust bias in the holdout sample. We can see that the chronological age is highly significant (p < .001) and sex variable is also significant at p = .023. With the bias adjustment of the regression, the perceived bias is greatly reduced (r = .91, MAE = 0.93 years; see the regression line in blue of Figure 8 [Left]) and the brain‐age gap by chronological age correlation is −.41. These results are based on internal validation as the models built using the cross‐validation procedure with healthy controls, indicating the effectiveness of our method for bias adjustment.
Figure 8.
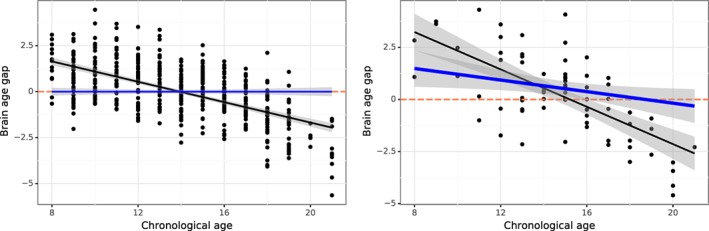
The brain age gap as a function of the chronological age before (black) and after (blue) the bias adjustment for healthy control (left) and post‐traumatic stress disorders (PTSD) (right). For healthy control, the bias after adjustment is uniform and centered around zero as shown in the brain age gap by chronological age plot (blue, left), whereas the discrepancy between chronological age and predicted brain age is still seen for the PTSD patient's data (right). The shaded area along the regression line indicates the 95% prediction interval [Color figure can be viewed at http://wileyonlinelibrary.com]
Table 1.
The estimated model coefficients, their 95% confidence intervals and the corresponding p‐values for health control subjects
| Estimated coefficients | 95% confidence interval | p‐value | |
|---|---|---|---|
| Intercept | 3.131 | [2.508 3.754] | <.001 |
| Chronological age | 0.763 | [0.718 0.808] | <.001 |
| Sex | 0.967 | [0.135 1.799] | .023 |
As an external validation, the model after bias adjustment was applied to independent external PTSD data. The results are shown in Figure 8 (Right), where the discrepancy between chronological age and predicted brain age is still observed. We found that the age prediction models trained with healthy controls can explain 56% of the chronological age variance (p < .001) with a mean absolute error (MAE) of 1.57 years and the brain‐age gap by chronological age correlation of −.68. With the bias correction, the MAE became 1.32 years and the brain‐age gap by chronological age correlation of −.28. Importantly, before the bias adjustment there were no significant differences of brain age gap between healthy controls and PTSD (t = 0.97; p = .33), whereas after the bias adjustment the brain age gap differed significantly across groups (t = 3.66; p = .0002). Therefore, our example demonstrates the impact of bias correction on brain‐age prediction.
4. DISCUSSION
Brain age prediction based on neuroimaging data can help characterize both the typical brain development and neuropsychiatric disorders. The deviation of the predicted age from the chronological age provides important information about brain health, it thus could serve as a biomarker of age‐associated health problems.
The age‐related bias is usually observed such that the predicted age is higher than the actual chronological age for younger subjects and lower for older subjects. It is largely unknown about what cause the overestimations in younger subjects and underestimations in older subjects. Existing accounts have mainly attributed the bias to inconsistency of noise distribution across the lifespan, sample size imbalance across age groups, or heterogeneity of data from multiple study sites. To understand the nature of this bias phenomenon, we have systematically examined these accounts using a large neuroanatomical data of 2,026 healthy subjects 6 to 89 years of age from multiple shared datasets (ABIDE, CoRR, DLBS, and NKI Rockland), and found none of these accounts justifiable. To further check if the bias might be specific to particular methods, we tested four popular machine‐learning techniques including ridge regression, support vector regression (Smola & Schölkopf, 2004), Gaussian processes regression (Rasmussen & Williams, 2005) and deep neural network (LeCun et al., 2015); they all showed the systematic bias in brain age prediction. Our results indicate that the bias is rather universal, regardless of the data and particular method used.
Given the independence of the bias on the data and the methods, we presented an alternative account that offers a statistical explanation for the bias using RTM, a simple yet subtle concept that has long been known in statistics (Davis, 1976; Gardner & Heady, 1973; James, 1973). We gave a simple, practical method based on general linear model to correct the bias and demonstrated the effectiveness of bias correction with a large multi‐modal brain imaging data obtained from the Philadelphia Neurodevelopmental Cohort (Satterthwaite et al., 2014).
Among the four machine‐learning methods we examined, the deep neural network (DNN) we developed is fully connected with the first layer corresponding to the 5,124 inputs to the neural network, which are the number of vertices in the Freesurfer surfaces. Our DNN has four hidden layers with 50 neurons each and hyperbolic tangent activation functions. The hyper‐parameters are optimized using cross‐validation. Though the network structure (the number of hidden layers and the number of neurons in each layer) was set heuristically, we found that the DNN was very robust to these parameter variations and performed remarkably well among the methods tested. In order to directly compare the DNN with other machine‐learning methods, we have used the same reduced set of 5,124 features as inputs. Considering the DNN is an emerging deep learning technique and is able to learn from the raw data (Cole et al., 2017) with minimal preprocessing, we expect the performance of DNN could be further boosted using raw data (i.e., 163,842 vertices before down‐sampling).
Regression toward the mean (RTM) is an elementary concept in statistics. Despite its simplicity, it has been consistently misunderstood and it has repeatedly been the source of major errors in analysis. RTM is not restricted to biological variables such as brain age; it occurs in any variable that is subject to random error. Therefore, the practical problem of RTM is to distinguish a real change from this expected change due to the random error. There are several methods available to reduce the effect of RTM at either the design or the analysis stages of a study (Barnett et al., 2005; Yudkin & Stratton, 1996). These methods include randomization and matching or stratification of the confounder that can be used to address the confounding effect. For example, consider a variable Z that represents two groups (ill vs. healthy) and select these two groups of individuals with similar chronological age, so Z is not associated with chronological age (Franke et al., 2010). As such, we have provided a simple linear regression model approach to adjust the bias induced by RTM.
We note that it is important to rule out RTM as the genuine cause of an observed brain age change before any other explanation is sought. RTM is a ubiquitous phenomenon in the regression analysis that occurs whenever two measures that are imperfectly correlated. The brain‐age estimation is, in essence, a regression problem, which is inevitably subject to the RTM effect. As such, we believe that RTM naturally provides a more parsimonious explanation than other accounts for the bias in brain‐age estimation. Indeed, we found that none of existing accounts (inconsistent noise distribution across the lifespan, imbalanced sample size across age groups, or heterogeneous data from multiple sites) provides plausible explanation for the bias. However, there are cases where the use of RTM for bias correction is limited. When the individuals being examined are in a restricted age range or different age ranges between the training and testing data, there is not likely to be correct for using the bias correction method. Therefore, when using the RTM for bias correction of cross‐sectional data, it is important to keep in mind that the age distribution of training data (or control group) used for deriving the regression model is as close as that of testing data (or patient group).
As we demonstrated in the PNC application, with the bias adjustment, the model performance statistics are significantly improved and the bias is uniform and centered around zero as shown in the brain age gap by chronological age plot (Figure 6). We confirmed that the bias adjustment model generalizes to the independent samples of PTSD group.
All in all, we have clarified that the systematic bias observed in brain age prediction is not specific to both the data and the method. We have highlighted that the RTM can be used to explain the bias seen in brain age prediction. We further provided a simple solution to adjust the bias caused by RTM and demonstrated its applicability of the brain age prediction on a large neuroimaging data.
ACKNOWLEDGMENTS
Philadelphia Neurodevelopmental Cohort: Support for the collection of the data sets was provided by grant RC2MH089983 awarded to Raquel Gur and RC2MH089924 awarded to Hakon Hakonarson. All subjects were recruited through the Center for Applied Genomics at The Children's Hospital in Philadelphia.
Liang H, Zhang F, Niu X. Investigating systematic bias in brain age estimation with application to post‐traumatic stress disorders. Hum Brain Mapp. 2019;40:3143–3152. 10.1002/hbm.24588
Funding information Philadelphia Neurodevelopmental Cohort, Grant/Award Numbers: RC2MH089924, RC2MH089983
REFERENCES
- Abadi, M. , Agarwal, A. , Barham, P. , Brevdo, E. , Chen, Z. , Citro, C. , … Zheng, X. TensorFlow: Large‐scale machine learning on heterogeneous systems. In Proceedings of 12th USENIX symposium on operating systems design and implementation 265–283 (USENIX association), 2016.
- Al Zoubi, O. , Ki Wong, C. , Kuplicki, R. T. , Yeh, H. W. , Mayeli, A. , Refai, H. , … Bodurka, J. (2018). Predicting age from brain EEG signals‐a machine learning approach. Frontiers in Aging Neuroscience, 10(184), 1–12. 10.3389/fnagi.2018.00184 [DOI] [PMC free article] [PubMed] [Google Scholar]
- Aycheh, H. M. , Seong, J. K. , Shin, J. H. , Na, D. L. , Kang, B. , Seo, S. W. , & Sohn, K. A. (2018). Biological brain age prediction using cortical thickness data: A large scale cohort study. Frontiers in Aging Neuroscience, 10(252), 1–14. 10.3389/fnagi.2018.00252 [DOI] [PMC free article] [PubMed] [Google Scholar]
- Barnett, A. G. , van der Pols, J. C. , & Dobson, A. J. (2005). Regression to the mean: What it is and how to deal with it. International Journal of Epidemiology, 34(1), 215–220. [DOI] [PubMed] [Google Scholar]
- Bonifazi, P. , Erramuzpe, A. , Diez, I. , Gabilondo, I. , Boisgontier, M. P. , Pauwels, L. , … Cortes, J. M. (2018). Structure‐function multi‐scale connectomics reveals a major role of the fronto‐striato‐thalamic circuit in brain aging. Human Brain Mapping, 39, 4663–4677. 10.1002/hbm.24312. [DOI] [PMC free article] [PubMed] [Google Scholar]
- Cao, X. , Wang, L. , Cao, C. , Fang, R. , Chen, C. , Hall, B. J. , & Elhai, J. D. (2019). Sex differences in global and local connectivity of adolescent posttraumatic stress disorder symptoms. Journal of Child Psychology and Psychiatry, 60(2), 216–224. [DOI] [PubMed] [Google Scholar]
- Chung, Y. , Addington, J. , Bearden, C. E. , Cadenhead, K. , Cornblatt, B. , Mathalon, D. H. , … Cannon, T. D. (2018). Use of machine learning to determine deviance in neuroanatomical maturity associated with future psychosis in youths at clinically high risk. JAMA Psychiatry, 75(9), 960–968. [DOI] [PMC free article] [PubMed] [Google Scholar]
- Cole, J. H. , & Franke, K. (2017). Predicting age using neuroimaging: Innovative brain ageing biomarkers. Trends in Neurosciences, 40(12), 681–690. [DOI] [PubMed] [Google Scholar]
- Cole, J. H. , Leech, R. , & Sharp, D. J. (2015). Alzheimer's disease neuroimaging initiative. Prediction of brain age suggests accelerated atrophy after traumatic brain injury. Annals of Neurology, 77, 571–581. [DOI] [PMC free article] [PubMed] [Google Scholar]
- Cole, J. H. , Poudel, R. P. K. , Tsagkrasoulis, D. , Caan, M. W. A. , Steves, C. , Spector, T. D. , & Montana, G. (2017). Predicting brain age with deep learning from raw imaging data results in a reliable and heritable biomarker. NeuroImage, 163, 115–124. [DOI] [PubMed] [Google Scholar]
- Cui, Z. , Zhong, S. , Xu, P. , He, Y. , & Gong, G. (2013). PANDA: A pipeline toolbox for analyzing brain diffusion images. Frontiers in Human Neuroscience, 7(42), 1–16. 10.3389/fnhum.2013.00042 [DOI] [PMC free article] [PubMed] [Google Scholar]
- Davis, C. E. (1976). The effect of regression to the mean in epidemiologic and clinical studies. American Journal of Epidemiology, 104, 493–498. [DOI] [PubMed] [Google Scholar]
- Di Martino, A. , Yan, C. G. , Li, Q. , Denio, E. , Castellanos, F. X. , Alaerts, K. , et al. (2014). The autism brain imaging data exchange: Towards a large‐scale evaluation of the intrinsic brain architecture in autism. Molecular Psychiatry, 19, 659–667. [DOI] [PMC free article] [PubMed] [Google Scholar]
- Diederik, K ; Ba, J . Adam: A method for stochastic optimization. arXiv:1412.6980, 2014.
- Dosenbach, N. U. , Nardos, B. , Cohen, A. L. , Fair, D. A. , Power, J. D. , Church, J. A. , … Schlaggar, B. L. (2010). Prediction of individual brain maturity using fMRI. Science, 329(5997), 1358–1361. [DOI] [PMC free article] [PubMed] [Google Scholar]
- Erus, G. , Battapady, H. , Satterthwaite, T. D. , Hakonarson, H. , Gur, R. E. , Davatzikos, C. , & Gur, R. C. (2015). Imaging patterns of brain development and their relationship to cognition. Cerebral Cortex, 25(6), 1676–1684. [DOI] [PMC free article] [PubMed] [Google Scholar]
- Fan, L. , Li, H. , Zhuo, J. , Zhang, Y. , Wang, J. , Chen, L. , … Jiang, T. (2016). The human Brainnetome atlas: A new brain atlas based on connectional architecture. Cerebral Cortex, 26(8), 3508–3526. [DOI] [PMC free article] [PubMed] [Google Scholar]
- Fischl, B. , & Dale, A. M. (2000). Measuring the thickness of the human cerebral cortex from magnetic resonance images. Proceedings of the National Academy of Sciences of the United States of America, 97, 11050–11055. [DOI] [PMC free article] [PubMed] [Google Scholar]
- Franke, K. , Luders, E. , May, A. , Wilke, M. , & Gaser, C. (2012). Brain maturation: Predicting individual BrainAGE in children and adolescents using structural MRI. NeuroImage, 63(3), 1305–1312. [DOI] [PubMed] [Google Scholar]
- Franke, K. , Ziegler, G. , Klöppel, S. , & Gaser, C. (2010). Alzheimer's disease neuroimaging initiative. Estimating the age of healthy subjects from T1‐weighted MRI scans using kernel methods: Exploring the influence of various parameters. NeuroImage, 50, 883–892. [DOI] [PubMed] [Google Scholar]
- Gardner, M. J. , & Heady, J. A. (1973). Some effects of within‐person variability in epidemiologic studies. Journal of Chronic Diseases, 26, 781–795. [Google Scholar]
- Gur, R. C. , Richard, J. , Hughett, P. , Calkins, M. E. , Macy, L. , Bilker, W. B. , … Gur, R. E. (2010). A cognitive neuroscience‐based computerized battery for efficient mea‐ surement of individual differences: Standardization and initial construct validation. Journal of Neuroscience Methods, 187, 254–262. [DOI] [PMC free article] [PubMed] [Google Scholar]
- James, K. E. (1973). Regression towards the mean in uncontrolled clinical studies. Biometrics, 29, 121–130. [PubMed] [Google Scholar]
- Le, T. T. , Kuplicki, R. T. , McKinney, B. A. , Yeh, H. W. , Thompson, W. K. , & Paulus, M. P. (2018). Tulsa 1000 investigators. A nonlinear simulation framework supports adjusting for age when analyzing BrainAGE. Frontiers in Aging Neuroscience, 10, 317 10.3389/fnagi.2018.00317 [DOI] [PMC free article] [PubMed] [Google Scholar]
- LeCun, Y. , Bengio, Y. , & Hinton, G. (2015). Deep learning. Nature, 521(7553), 436–444. [DOI] [PubMed] [Google Scholar]
- Liem, F. , Varoquaux, G. , Kynast, J. , Beyer, F. , Kharabian Masouleh, S. , Huntenburg, J. M. , … Margulies, D. S. (2017). Predicting brain‐age from multimodal imaging data captures cognitive impairment. NeuroImage, 148, 179–188. [DOI] [PubMed] [Google Scholar]
- Niu X, Liang H. & Zhang F. Brain age prediction for post‐traumatic stress disorder patients with convolutional neural networks: A multi‐modal neuroimaging study. Conference on Cognitive Computational Neuroscience, Philadelphia, PA, p.1121, 2018.
- Nooner, K. , Colcombe, S. , Tobe, R. , Mennes, M. , Benedict, M. , Moreno, A. , et al. (2012). The nki‐rockland sample: A model for accelerating the pace of discovery science in psychiatry. Frontiers in Neuroscience, 6, 152. [DOI] [PMC free article] [PubMed] [Google Scholar]
- Pardoe, H. R. , & Kuzniecky, R. (2018). NAPR: A cloud‐based framework for neuroanatomical age prediction. Neuroinformatics, 16(1), 43–49. [DOI] [PubMed] [Google Scholar]
- Pedregosa, F. , Varoquaux, G. , Gramfort, A. , Michel, V. , Thirion, B. , Grisel, O. , … Duchesnay, E. (2011). Scikit‐learn: Machine learning in python. Journal of Machine Learning Research, 12, 2825–2830. [Google Scholar]
- Rasmussen, C. E. , & Williams, C. K. I. (2005). Gaussian processes for machine learning (adaptive computation and machine learning). p. 266. London: The MIT Press. [Google Scholar]
- Rodrigue, K. M. , Kennedy, K. M. , Devous, M. D. , Rieck, J. R. , Hebrank, A. C. , Diaz‐Arrastia, R. , … Park, D. C. (2012). β‐Amyloid burden in healthy aging: Regional distribution and cognitive consequences. Neurology, 78, 387–395. [DOI] [PMC free article] [PubMed] [Google Scholar]
- Satterthwaite, T. D. , Elliott, M. A. , Ruparel, K. , Loughead, J. , Prabhakaran, K. , Calkins, M. E. , … Gur, R. E. (2014). Neuroimaging of the Philadelphia neurodevelopmental cohort. NeuroImage, 86, 544–553. [DOI] [PMC free article] [PubMed] [Google Scholar]
- Smola, A. J. , & Schölkopf, B. (2004). A tutorial on support vector regression. Statistics and Computing, 14(3), 199–222. [Google Scholar]
- Stigler, S. M. (1997). Regression towards the mean, historically considered. Statistical Methods in Medical Research, 6, 103–114. [DOI] [PubMed] [Google Scholar]
- Twisk, J. W. R. (2003). Applied longitudinal data analysis for epidemiology: A practical guide. Cambridge: Cambridge University Press. [Google Scholar]
- Yan, C. , & Zang, Y. (2010). DPARSF: A MATLAB toolbox for “pipeline” data analysis of resting‐state fMRI. Frontiers in Systems Neuroscience, 4(13), 1–7. 10.3389/fnsys.2010.00013 [DOI] [PMC free article] [PubMed] [Google Scholar]
- Yudkin, P. L. , & Stratton, I. M. (1996). How to deal with regression to the mean in intervention studies. Lancet, 347, 241–243. [DOI] [PubMed] [Google Scholar]
- Zuo, X. N. , Anderson, J. S. , Bellec, P. , Birn, R. M. , Biswal, B. B. , Blautzik, J. , … Milham, M. P. (2014). An open science resource for establishing reliability and reproducibility in functional connectomics. Scientific Data, 1, 140049. [DOI] [PMC free article] [PubMed] [Google Scholar]