

Abstract
Affective temperaments have been described since the early 20th century and may play a central role in psychiatric illnesses, such as bipolar disorder (BD). However, the neuronal basis of temperament is still unclear. We investigated the relationship of temperament with neuronal variability in the resting state signal—measured by fractional standard deviation (fSD) of Blood‐Oxygen‐Level Dependent signal—of the different large‐scale networks, that is, sensorimotor network (SMN), along with default‐mode, salience and central executive networks, in standard frequency band (SFB) and its sub‐frequencies slow4 and slow5, in a large sample of healthy subject (HC, n = 109), as well as in the various temperamental subgroups (i.e., cyclothymic, hyperthymic, depressive, and irritable). A replication study on an independent dataset of 121 HC was then performed. SMN fSD positively correlated with cyclothymic z‐score and was significantly increased in the cyclothymic temperament compared to the depressive temperament subgroups, in both SFB and slow4. We replicated our findings in the independent dataset. A relationship between cyclothymic temperament and neuronal variability, an index of intrinsic neuronal activity, in the SMN was found. Cyclothymic and depressive temperaments were associated with opposite changes in the SMN variability, resembling changes previously described in manic and depressive phases of BD. These findings shed a novel light on the neural basis of affective temperament and also carry important implications for the understanding of a potential dimensional continuum between affective temperaments and BD, on both psychological and neuronal levels.
Keywords: bipolar disorder, neuronal variability, resting state fMRI, sensorimotor network, temperament
1. INTRODUCTION
1.1. Affective temperaments
The idea of temperament arises from the antique Greek authors but, at the beginning of the 20th century, Kraepelin (1921) renewed their concept when clinically observing a continuum between premorbid temperament and full‐blown affective pathology. A century later, Akiskal conceptualized and operationalized four affective temperaments: the cyclothymic, hyperthymic, depressive, and irritable (Akiskal & Akiskal, 2005b; Placidi et al., 1998).
Affective temperaments can be characterized by different patterns of expression in the basic psychic components including psychomotricity, thought and mood (Supporting Information Figure S2). For instance, from a psychomotor point of view, the depressive temperament can be characterized by low energy levels while the hyperthymic and cyclothymic temperaments by high energy levels, stable or unstable respectively, and the irritable temperament by dysphoric restlessness (Rovai et al., 2013). Regarding thought and cognitive behaviors, the depressive displays indecision and a tendency to worry, while the hyperthymic and cyclothymic are usually full of plans, more stable or highly variable respectively, and the irritable is frequently brooding (Rovai et al., 2013). The mood of the depressive is frequently marked by gloominess, while the hyperthymic displays emotional intensity; moreover, the cyclothymic is characterized by emotional instability, and the irritable often shows an irritable mood (Rovai et al., 2013).
Affective temperaments play a key role in affective disorders (Akiskal & Akiskal, 2005b; Evans et al., 2005; Perugi et al., 2012) and exert an impact on symptoms and course of bipolar disorder (BD) (Akiskal, 2000; Iasevoli et al., 2013; Perugi et al., 2012). In particular, the link between cyclothymic temperament and BD is well established (Akiskal, 2001; Akiskal & Akiskal, 2005b; Perugi, Hantouche, & Vannucchi, 2017). Accordingly, effective temperaments may represent behavioral and biological endophenotypes that can affect the clinical presentation of psychiatric disorders, like BD (Perugi et al., 2012). However, their neurobiological underpinnings need to be clarified.
1.2. Neurobiology of temperament
To date, few neuroimaging studies have investigated affective temperaments. Cyclothymic temperament was found to be related to gray matter volume in the left medial frontal gyrus as well as to activation/deactivation of the left lingual gyrus during memory or judgments tasks (Hatano et al., 2014; Kodama et al., 2015; Mizokami et al., 2014). Temperamental features have also been investigated using Cloninger's model (Cloninger, 1986). A relationship between the cyclothymic temperament and high scores in novelty seeking (NS) subscale was found [Akiskal et al., 2005; Maremmani et al., 2005; Rozsa et al., 2008], hence making NS as a proxy of cyclothymic temperament. In neuroimaging studies, NS has been related to increased gray matter volume in the left middle frontal gyrus, and to increased structural connectivity between the striatum, orbitofrontal cortex, hippocampus, and amygdala (Kyeong, Kim, Park, & Hwang, 2014). NS has been associated to a functional clustering of basal ganglia and prefrontal cortex, and to increased power of low‐frequency oscillations in the medial part of prefrontal cortex (Kyeong et al., 2014; Nakao et al., 2013). Finally, to date, only one study explored the correlation between NS and resting state networks (RSNs), showing a negative correlation between NS and functional connectivity between the regions of salience network (SN) (Li et al., 2017).
However, the investigation of brain's spontaneous activity is of great importance as one would assume intrinsic patterns of temperaments (as structured by the different psychic dimensions, that is, thought, affectivity, and psychomotricity) to be related to analogous intrinsic pattern of brain activity (rather than task‐evoked activity), as organized in the RSNs. Accordingly, different RSNs are involved in distinct functions and can therefore be linked to the aforementioned psychic dimensions. Specifically, the sensorimotor network (SMN), as being central for sensory processing and motor functions (Gottlich et al., 2013; Huang et al., 2015), may be crucial for the psychomotor dimension. On the other hand, the default‐mode network (DMN), that regulates internal thoughts and affects (Christoff, Gordon, Smallwood, Smith, & Schooler, 2009; Davidson, 2000; Mason et al., 2007), may be implicated in affective and cognitive dimensions. Finally, other well‐defined networks are the SN, which responds to the degree of subjective salience and is implicated in the reward system (Goulden et al., 2014; Menon, 2011), and the central‐executive network (CEN), that links cognitive and executive functions (Goulden et al., 2014). The relationship of these various networks to affective temperaments remains unclear though.
RSNs are mainly investigated using functional connectivity. However, recent studies in both healthy and BD have shown that yet another measure like neuronal variability (operationalized as standard deviation (SD) of the amplitude of resting state activity) is related to neuronal processing of incoming stimuli and neuronal outputs (Basalyga & Salinas, 2006; Faisal, Selen, & Wolpert, 2008; Lugo, Doti, & Faubert, 2008; Ward, 2003; Zou et al., 2008; Zuo et al., 2010), thus being central in mediating the internal initiation of sensorimotor and cognitive behavior (Garrett et al., 2013; Garrett, Kovacevic, McIntosh, & Grady, 2010; Garrett, Kovacevic, McIntosh, & Grady, 2011; Garrett, McIntosh, & Grady, 2014; Martino et al., 2016; Northoff et al., 2018). Neuronal variability has been investigated in the range of low‐frequency oscillations (standard frequency band – SFB: 0.01–0.10 Hz), which have been further subdivided into two sub‐frequency bands: slow4 (0.027–0.073 Hz), which is stronger in the SMN regions, and slow5 (0.01–0.027 Hz), which is stronger in the DMN regions (Balduzzi, Riedner, & Tononi, 2008; Buzsaki & Draguhn, 2004; Fox & Raichle, 2007; Lee, Northoff, & Wu, 2014; Xue, Li, Weng, Northoff, & Li, 2014; Zuo et al., 2010). This makes neuronal variability an ideal candidate for investigating resting state activity in the different networks as related to the different affective temperaments.
1.3. Aims and hypotheses
The general aim of our study was to investigate the neural underpinnings, as measured by the resting state neuronal variability within the various RSNs, of affective temperaments in a large cohort of healthy subject.
We hypothesize that different, that is, opposite, patterns in psychic dimensions which characterize the different temperaments (e.g., excited psychomotricity in the cyclothymic and hyperthymic temperaments vs. inhibited psychomotricity in the depressive temperament) show different, that is, opposite, patterns of neuronal variability in distinct RSNs (e.g., the SMN).
2. MATERIALS AND METHODS
2.1. Participants and assessment
Participants were recruited from the Genoa metropolitan area (Italy). The study has been conducted on 109 healthy controls (HC) aged from 18 to 60 (Supporting Information Table S1). The Ethics Committee of San Martino Policlinic Hospital of Genoa approved the study and written informed consent was obtained from all participants. Each participant was evaluated using the semi‐structured version of the Temperament Evaluation of Memphis, Pisa, Paris and San Diego Scale (TEMPS‐I) to assess affective temperaments (i.e., cyclothymic, hyperthymic, depressive, and irritable) (Akiskal & Akiskal, 2005a; Akiskal et al., 1998 ; Placidi et al., 1998). Affective temperaments are dimensional construct (Akiskal, 2001), all four components (i.e., cyclothymic, hyperthymic, depressive, and irritable) are present in each subject, but only one gives the dominant temperament. Accordingly, TEMPS‐I is organized in four different subscales (one for each component) and a total score is calculated as a sum of the subscale's items. Every subject obtains a z‐score for each temperamental subscale, and the highest determines the dominant temperament (Akiskal et al., 1998; Placidi et al., 1998; Supporting Information Figure S1). Thus, according to the TEMPS‐I, the sample was subdivided into 23 cyclothymics, 39 hyperthymics, 27 depressives, and 20 irritables (Supporting Information Table S1).
Inclusion criteria were as follows: age between 18 and 60 and ability to provide written informed consent. Exclusion criteria were as follows: psychiatric disorders; neurological diseases (stroke, cerebral vascular malformations, or epilepsy); previous head injury with loss of consciousness (for 5 or more minutes); severe or decompensated somatic diseases, current alcohol, and substance abuse (during the preceding 3 months); history of alcohol or substance dependence; history of abuse of synthetic or new drugs; pregnancy and lactation; left‐handedness; the inability to undergo an magnetic resonance imaging (MRI) examination (claustrophobia, metal implants, and so forth); history of treatment with chemotherapy or brain radiotherapy.
2.2. fMRI data acquisition
Images were acquired using a 1.5‐T GE scanner with a standard head coil. Foam pads were used to reduce head motion and scanner noise. Functional MRI (fMRI) scanning was carried out in the dark, with participants instructed to keep their eyes closed, to relax, and to move as little as possible. Functional images were collected using a gradient Echo Planar Imaging (EPI) sequence sensitive to Blood‐Oxygen‐Level Dependent (BOLD) contrast (TR/TE = 2,000/30 ms, flip angle = 90°, FOV = 24 cm). Whole‐brain volumes were acquired in 33 contiguous 4‐mm‐thick transverse slices, with a 1‐mm gap and 3.75 × 3.75‐mm2 in‐plane resolution. For each participant, fMRI scanning lasted 5 min and acquired a total of 150 scans. In addition, 3D T1‐weighted anatomical images were acquired for all participants in a sagittal orientation by means of a 3D‐SPGR sequence (TR/TE = 11.5/5 ms, IR = 500 ms, flip angle = 8°, FOV = 25.6 cm) with an in‐plane resolution of 256 × 256, and slice thickness of 1 mm.
2.3. Data analysis
Processing analyses were performed using AFNI (http://afni.nimh.nih.gov/afni [Cox, 1996]). The first two volumes of each functional time series were discarded. The remaining functional images were slice‐timing corrected and aligned (head motion correction). Each participant's motion was assessed by means of translation/rotation, and an exclusion criterion (translation>2 mm, rotation>2°; in each direction) was set. The T1 anatomical images of all subjects were normalized to the Talairach space. Resting state data, masked with the T1 images, were then spatially transformed into the Talairach space (Talairach & Tournoux, 1988), resampled to 3 × 3 × 3 mm3 and spatially smoothed (6 mm). The estimated head motion and the mean time series from the WM and the cerebrospinal fluid were used as covariates in the correlation computation (Fox et al., 2005; Saad et al., 2012). The data were then filtered with a band‐pass filter within the standard frequency band (SFB) of 0.01–0.1 Hz, which is thought to reflect mainly neuronal fluctuations (Biswal, Yetkin, Haughton, & Hyde, 1995; Fox & Raichle, 2007; Zhang & Raichle, 2010). On the basis of recent findings in HC (Buzsaki & Draguhn, 2004; Zuo et al., 2010), the data were then filtered with two separate bands within the SFB: slow4 (0.027–0.073 Hz) and slow5 (0.01–0.027 Hz). These frequencies are not affected by physiological variables, like respiration and aliased cardiac signals, that fall in the other ranges (slow3 and slow2; Cordes et al., 2001; Zuo et al., 2010).
Then, the neuronal variability—operationalized as SD of the amplitude of resting‐state BOLD signal, which represents an indirect proxy of neuronal activity—was calculated in SFB, slow4, and slow5; the ratio between SD for each frequency band and the entire range (0–0.25 Hz) was then calculated, thus obtaining a normalized index of SD, that is, fractional SD (fSD), in SFB, slow4 and slow5, as a measure of frequency‐specific contribution of total variability (which is less sensitive to artifacts; Basalyga & Salinas, 2006; Faisal et al., 2008; Garrett et al., 2010; Garrett et al., 2013; Garrett et al., 2014; Garrett, Kovacevic, et al., 2011; Lugo et al., 2008; Ward, 2003; Zou et al., 2008; Zuo et al., 2010). The subject‐level voxel‐wise fSD maps were standardized into subject‐level z‐score maps per brain volume by subtracting the mean voxel‐wise fSD obtained for the whole brain, then dividing by the standard deviation (SD) across voxels (Gotts et al., 2013; Hoptman et al., 2010; Saad et al., 2012). Next, according to the literature, spherical regions of interest (ROIs) with a radius of 6 mm were placed in the Talairach coordinates of all cortical nodes of each network: the SMN (Gottlich et al., 2013), the DMN (Laird et al., 2009), the SN (Seeley et al., 2007) and the CEN (Seeley et al., 2007) (Figure 1). Then fSD values in SFB, slow4, and slow5 were extracted from all of the nodes. Finally, the mean fSD of all nodes was calculated within each RSNs.
Figure 1.
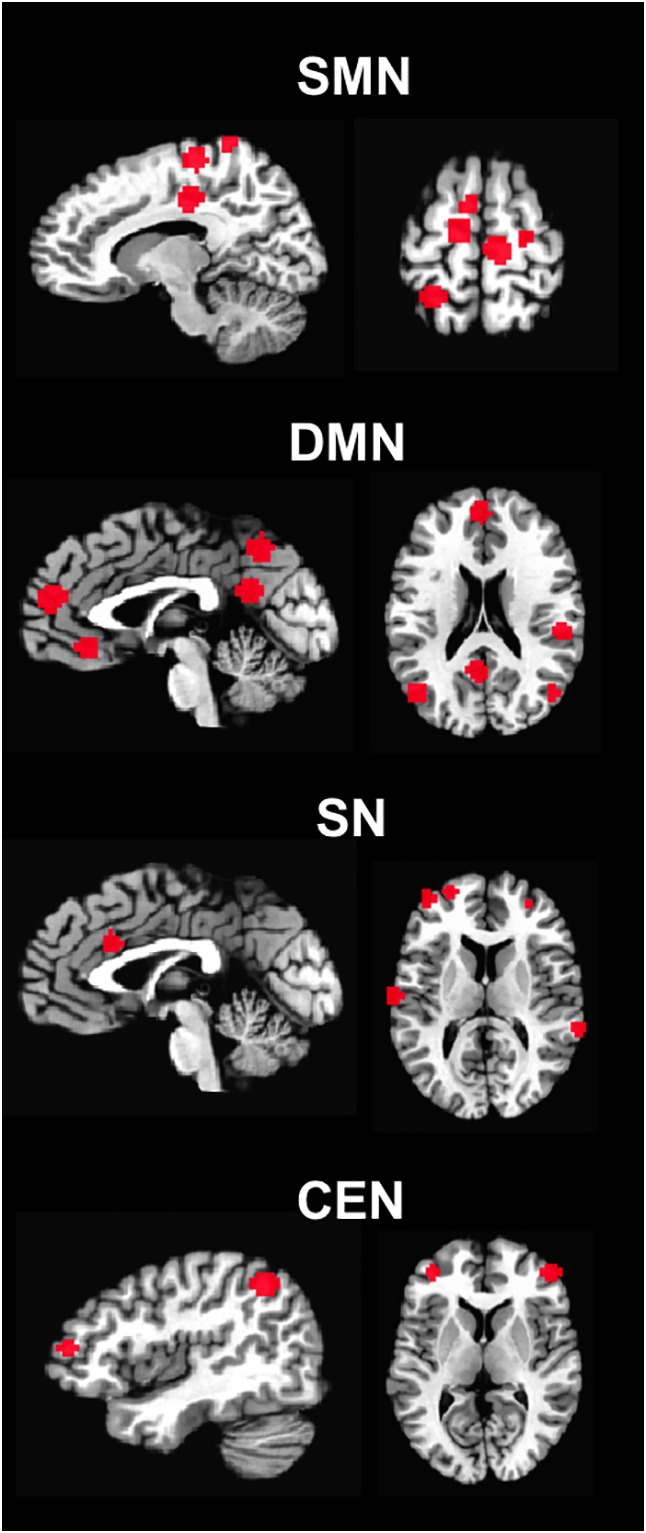
ROIs. Abbreviations: ROIs = regions of interest; SMN = sensorimotor network; DMN = default‐mode network; SN = salience network; CEN = central executive network [Color figure can be viewed at http://wileyonlinelibrary.com]
2.4. Statistical analysis
The relationship between temperament and fSD in the different RSNs was investigated.
First, a correlation between each temperamental z‐scores (i.e., cyclothymic, hyperthymic, depressive, and irritable) and the fSD in the various RSNs (i.e., SMN, DMN, SN, and CEN) in SFB was performed in the whole sample, using a Spearman partial correlation analysis with age, sex and motion as covariates.
Second, the sample was subdivided according to the subject's dominant temperament score, (i.e., cyclothymic, hyperthymic, depressive, and irritable). An ANCOVA (with age, gender, and motion as covariates) followed by Bonferroni post hoc tests were performed between subgroups for fSD in those RSNs that showed significant results from the previous correlation analysis. The same analysis was then performed for the other RSNs, as control.
Finally, the same analysis steps were carried out in slow4 and slow5, to specify the contribution of subfrequency bands on our findings.
All the results were thresholded at a corrected p < .05 (Bonferroni correction was carried out for multiple comparisons). The statistical analyses were performed in SPSS version 23 (SPSS Software Inc., Chicago, IL).
3. RESULTS
We investigated the relationship between temperament and network fSD using two different approaches.
First, we investigated the correlation in the whole sample of HC between the mean z‐scores obtained for each temperamental subscale and the fSD in the different RSNs in SFB. The cyclothymic z‐score showed a significant positive correlation specifically with the SMN fSD in SFB (ρ = 0.296; p = .002), but not with other RSNs (i.e., DMN, SN, CEN). No significant correlation was detected for the other temperamental z‐scores (i.e., hyperthymic, depressive, and irritable; Figure 2a; Supporting Information Table S2a).
Figure 2.
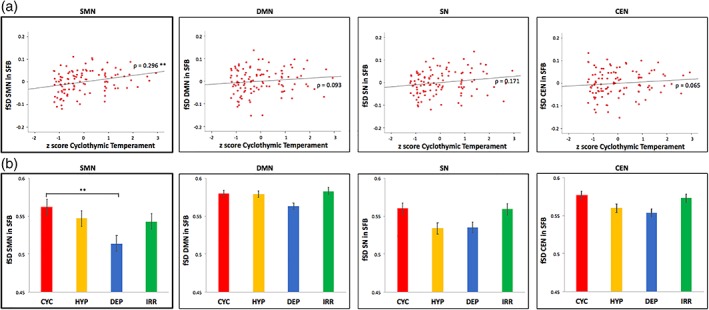
Relationships between temperaments and fSD in resting state networks. (a) Correlation between cyclothymic z‐score and fSD in resting state networks in SFB. Spearman correlation (with age, gender, and motion as covariates) between temperamental z‐scores (i.e., cyclothymic, hyperthymic, depressive, and irritable) and fSD in RSNs (i.e., SMN, DMN, SN, and CEN) in SFB, in the whole sample. Results are corrected with Bonferroni test for multiple comparisons. (b) Comparison of fSD in resting state networks in SFB between the temperamental subgroups. ANCOVAs (with age, gender, and motion as covariates) and Bonferroni post hoc tests of fSD in RSNs (i.e., SMN, DMN, SN, and CEN) in SFB between the temperamental subgroups (i.e., cyclothymic, hyperthymic, depressive, and irritable). Corrected p < .01**. Abbreviations: RSNs = resting state networks; SMN = sensorimotor network; DMN = default‐mode network; SN = salience network; CEN = central executive network; fSD = fractional standard deviation; SFB = standard frequency band; CYC = cyclothymic; HYP = hyperthymic; DEP = depressive; IRR = irritable [Color figure can be viewed at http://wileyonlinelibrary.com]
Second, basing on previous result, we compared the SMN fSD in SFB between the different temperamental subgroups, performing an ancova (with age, gender, and motion as covariates). A significant difference between subgroups was found (F = 4.209; p = .008). Bonferroni corrected post hoc analysis revealed a significantly higher SMN fSD in SFB in the cyclothymic subgroup when compared to the depressive one (p = .007); no other significant results were found for the SMN. As control analysis, potential differences between the temperamental subgroups were also investigated for the other networks (i.e., DMN, SN, and CEN), and ancovas yield no significant results (Figure 2b; Supporting Information Tables S3 and Table S4a).
Finally, SMN findings were further explored and characterized in the subfrequency bands slow4 and slow5 (using the same approach as for SFB). A positive correlation between the cyclothymic z‐score and the SMN fSD was found in the whole sample in slow4 (ρ = 0.259; p = .007), while no correlation was observed in slow5 (Figure 3a; Supporting Information Table S2b). The ANCOVA of SMN fSD showed a significant difference between the temperamental subgroups in slow4 (F = 2.9; p = .039); in particular, the Bonferroni post hoc analysis revealed significantly higher SMN fSD in slow4 in the cyclothymic temperament when compared to the depressive (p = .027). No significant difference was found between subgroups in slow5 (Figure 3b; Supporting Information Table S4b).
Figure 3.
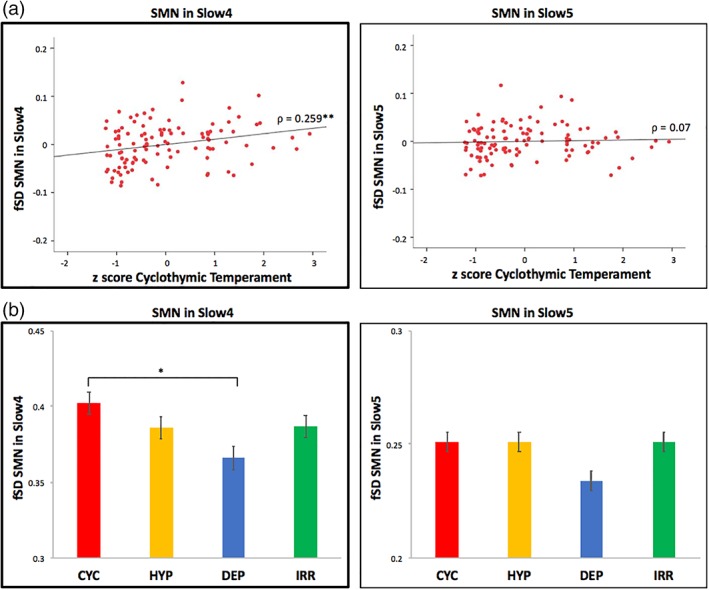
Relationships between temperaments and fSD in SMN in Slow4 and Slow5. (a) Correlation between cyclothymic z‐score and fSD in the SMN in slow4 and slow5. Spearman correlation (with age, gender, and motion as covariates) between temperamental z scores (i.e., cyclothymic, hyperthymic, depressive, and irritable) and fSD in the SMN in slow4 and slow5, in the whole sample. Results are corrected with the Bonferroni test for multiple comparisons. (b) Comparison of fSD in the SMN in slow4 and slow5 between the temperamental subgroups. ANCOVAs (with age, gender and motion as covariates) and Bonferroni post hoc tests of fSD in the SMN in slow4 and slow5 between the temperamental subgroups (i.e., cyclothymic, hyperthymic, depressive, irritable). Corrected p < .05*; p < .01**. Abbreviations: SMN = sensorimotor network; fSD = fractional standard deviation; CYC = cyclothymic; HYP = hyperthymic; DEP = depressive; IRR = irritable [Color figure can be viewed at http://wileyonlinelibrary.com]
3.1. Replication study in an independent dataset
To replicate our findings, we applied the same analysis steps to an independent data set which consisted of 121 HC and is part of an openly available fMRI resting‐state data set (OpenfMRI database UCLA Consortium for Neuropsychiatric Phenomics LA5c Study—CNP: https://openfmri.org/dataset/ds000030/). Although the sample was not characterized according to the TEMPS, all subjects have been tested with a battery of scales including the Temperament and Character Inventory (TCI) instrument for assessing Cloninger temperaments. The NS from the TCI is associated with the cyclothymic temperament (Akiskal et al., 2005; Maremmani et al., 2005; Rozsa et al., 2008); this allows to indirectly replicate our result on the neuronal background of temperaments, and more specifically on the relationship between cyclothymic temperament and SMN fSD, using the TCI data. For each participant, images were acquired using a 3 T scanner. Functional images were collected using a gradient 5 min length Echo Planar Imaging (EPI) sequence sensitive to BOLD contrast (TR/TE = 2,000/30 ms). Anatomical images used were three‐dimensional T1‐weighted anatomical images (TR/TE = 2.53/0.331 ms). For more detailed information, see the website. We applied the same processing steps to these data as in our main sample to obtain the fSD in the SMN.
Considering the relationships between NS and cyclothymic temperament (Akiskal et al., 2005; Maremmani et al., 2005; Rozsa et al., 2008), as well as the relationship between cyclothymic temperament and SMN fSD (observed in our main sample), we investigated the correlation between the NS (as proxy of cyclothymic temperament) and the SMN fSD in SFB. A positive correlation was found (ρ = 0.195; p = .039), coherently with our main finding (Figure 4).
Figure 4.
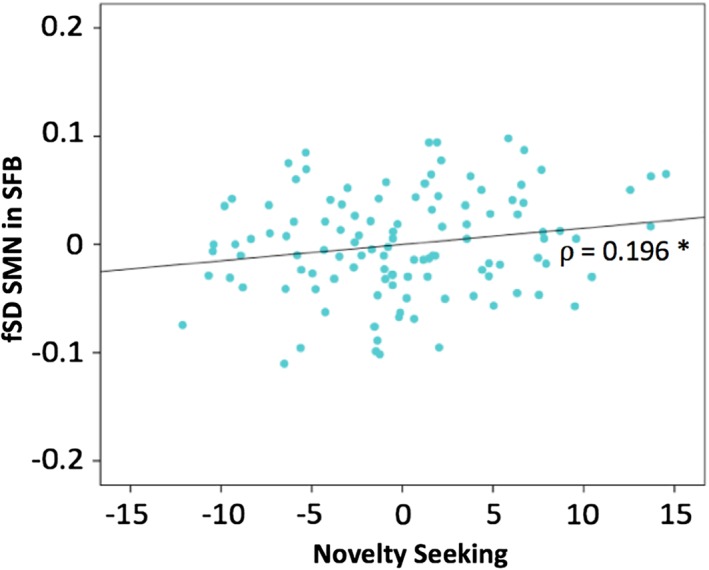
Replication of results in an independent dataset. Spearman correlation (with age, gender, and motion as covariates) between TCI Novelty Seeking score and fSD in the SMN in SFB, in the whole sample. p < .05*. Abbreviations: TCI = Temperament and Character Inventory; SMN = sensorimotor network; fSD = fractional standard deviation; SFB = standard frequency band [Color figure can be viewed at http://wileyonlinelibrary.com]
4. DISCUSSION
4.1. Main findings
Our main findings are the following: (a) in the whole sample of HC the cyclothymic z‐score is positively correlated to the SMN fSD in SFB; (b) the SMN fSD in SFB is significantly increased in the cyclothymic temperament subgroup compared to the depressive temperament subgroup; (c) the relationship between SMN fSD and cyclothymic temperament concerns the faster frequency of slow4 rather than the slower frequency of slow5; (d) our finding is further supported by a positive correlation between NS from TCI (as proxy of cyclothymic temperament) and SMN fSD (detected in an independent dataset). Together, our results demonstrate a specific relationship between cyclothymic score and neuronal variability in the SMN, which shows an opposite pattern between the cyclothymic (i.e., high SMN fSD) and depressive (i.e., low SMN fSD) temperaments. Thus, our data show for the first time neural correlates of intrinsic brain functioning for affective temperaments, specifically cyclothymic versus depressive temperaments in HC, also carrying major implications for psychiatry and especially for BD.
4.2. Sensorimotor network and cyclothymic temperament
Our findings show a strict relationship between neuronal variability in the SMN and the cyclothymic component of temperament. The variability of neuronal activity has been proposed as a central feature for the “tonic” ongoing activity of the brain and this activity is a fundamental substrate for the “phasic” or stimulus‐driven activity which permits specific behaviors (Garrett et al., 2013). Consequently, an increase of variability in a neural system can enhance the detection of weak signals, allowing subthreshold neurons to fire and facilitating outputs, thus affecting the neuronal processing of incoming stimuli and neuronal outputs (Basalyga & Salinas, 2006; Faisal et al., 2008; Garrett et al., 2013; Lugo et al., 2008; Ward, 2003). Considering that the SMN is involved in processing of incoming sensory stimuli and motor outputs (Basalyga & Salinas, 2006; Faisal et al., 2008; Garrett, McIntosh, & Grady, 2011; Gottlich et al., 2013; Huang et al., 2015; Lugo et al., 2008; Ward, 2003; Zou et al., 2008; Zuo et al., 2010), the setting of threshold for external or internal stimuli by decreases or increases in neuronal variability in the SMN might affect different patterns in the behavioral manifestation of psychomotricity in subjects with cyclothymic and depressive temperaments. In particular, the increased neuronal variability that makes the SMN more reactive to internal and external stimuli for initiating movements might result in NS with over‐reactions to external stimuli and tendency to act with impulsivity, core features of the cyclothymic temperament. On the contrary, decreased neuronal variability in SMN might results in inhibited psychomotricity with low energy levels and less reactivity to external stimuli (Perugi et al., 2017; Rovai et al., 2013), as manifested in the depressive temperament (Figure 5).
Figure 5.
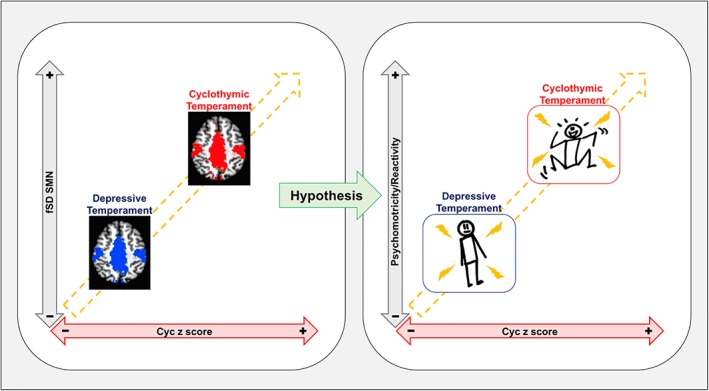
Schema of results and hypothesis. Opposing relationship of neuronal variability in the SMN between cyclothymic and depressive temperaments. Increased SMN fSD in the cyclothymic temperament might underpin an excited psychomotricity and hyper‐reactivity to environmental stimuli, while reduced SMN fSD in the depressive temperament might underpin an inhibited psychomotricity and hyporeactivity to environmental stimuli. Abbreviations: SMN = sensorimotor network; fSD = fractional standard deviation; CYC = cyclothymic [Color figure can be viewed at http://wileyonlinelibrary.com]
This particular relationship between SMN fSD and cyclothymic/depressive temperaments is further confirmed by its specific occurrence in slow4 rather than slow5, in accordance with previous data showing stronger power of slow4 specifically in the sensorimotor areas (Zuo et al., 2010). Moreover, our findings are indirectly confirmed by the replication study in an independent dataset where NS was positively correlated to the SMN fSD (since cyclothymic and depressive temperaments have been positively and negatively associated with the TCI NS, respectively; Akiskal et al., 2005; Maremmani et al., 2005; Rozsa et al., 2008). Cloninger described the NS as responsible for the behavioral activation system that is involved in responses to positive stimuli (Cloninger, 1987; Cloninger, Svrakic, & Przybeck, 1993; Kyeong et al., 2014). Thus, these data suggest that changes in neuronal variability in the SMN affect the relationship between sensory input and psychomotor response, as manifested in opposite way in the cyclothymic and depressive temperaments.
On the other hand, hyperthymic temperament did not show any significant relationship with SMN fSD, despite it is characterized by high energy levels and increased psychomotricity (Akiskal, 2004; Rovai et al., 2013). This might depend on specific psychomotor pattern of hyperthymics that is more stable and less sensitive to external stimuli with respect to the cyclothymics. Moreover, no significant relationships were found between neuronal variability in the other networks (i.e., DMN, SN, and CEN) and temperaments. This might suggest the specificity of the relationship between SMN fSD and psychomotor behavior as manifested in the cyclothymic/depressive temperaments, while the proper investigation of other temperaments and their psychic dimensions might need different neuronal measures or different temperamental constructs.
In summary, we can speculate that the more is the neuronal variability in the SMN (an indirect index of intrinsic neuronal activity that favors the motor response to incoming stimuli), the more is the excitation of psychomotor activity as manifested in the cyclothymic temperament. On the other hand, reduced neuronal variability in the SMN could underpin an inhibition of psychomotricity, as manifested in the depressive temperament. However, future investigations are needed to confirm such correspondence between neuronal variability in the SMN and psychomotricity.
4.3. Implications for psychiatric disorders
Interestingly what we observe in HC is in line with results of our prior work on BD where we found a shift of the DMN/SMN fSD balance towards the SMN in mania and the opposite in depression (Martino et al., 2016). Psychomotricity in mania is usually described as increased, unstable, and influenced by external stimuli (as manifested in symptoms like hyperactivity and distractibility). This shows similarities with the physiological pattern of cyclothymic temperament, hypothetically representing its pathological side. On the contrary, psychomotricity in depression is typically inhibited and behavior withdrawn from the environment, potentially representing the pathological side of the depressive temperament (Kraepelin, 1902; Minassian et al., 2010; Northoff, 2014; Northoff, 2016a; Northoff, 2016b; Perugi et al., 2017; Rovai et al., 2013). These results on neuronal variability in the SMN suggest a continuum between affective temperaments and BD, in accordance with Kraepelinian clinical observations and the conceptualization of bipolar spectrum (Ghaemi, 2013; Ghaemi & Dalley, 2014; Kraepelin, 1921). Thus, we hypothesize fSD in SMN as a proxy of psychomotor behaviors, both in physiology and pathology. Future studies are needed to better clarify the common ground and specific differences between temperament, BD, and their relationship to the underlying neuronal variability in SMN. This view is also well compatible with the NIMH Research Domains Criteria (RDoC) approach which is mostly focused on clinical dimensions and on a neuroscience‐based classification of psychiatric disorders rather than on their diagnostic categorization based on clinical consensus (Cuthbert, 2014; Insel et al., 2010).
4.4. Limitations
Images were acquired using a 1.5‐T scanner. Thus, the analysis concerned only cortical areas. Moreover, the replication study was performed on a 3‐T data set, confirming our main findings.
5. CONCLUSION
We here report, for the first time, an association between neuronal variability in SMN and cyclothymic/depressive temperament in healthy. Neuronal variability in SMN is higher in cyclothymic temperament and lower in depressive temperament. This, in turn, could explain their opposite behavioral pattern with regard to psychomotricity, which is increased in cyclothymic and decreased in depressive temperaments. Our findings complement recent observations of abnormal neuronal variability in SMN in BD, suggesting a neuronal continuum between affective temperaments in healthy and BD, as well as neuronal variability in SMN as a proxy of psychomotricity. This is well in accordance both with Kraepelin's original description of affective disorders and with the recently introduced RDoC classification. Hence, our findings carry far‐reaching implications for psychiatry to obtain more specific, patient‐based, and individualized biomarkers of disease.
CONFLICT OF INTEREST
The authors declare no conflict of interest.
Supporting information
Figure S1 Contribution of temperamental mean z‐scores in the different groups of temperaments
Figure S2. Temperaments
Table S1. Demographic Information
Table S2a. Spearman correlations between temperaments z‐scores and fSD in RSNs
Table S2b. Spearman correlations between temperaments z‐scores and SMN fSD
Table S3. Neuronal variability in temperaments in the RSNs
Table S4a. Comparisons between groups of the fSD in SFB in the RSNs
Table S4b. Comparisons between groups of the fSD in slow4 and slow5 in the RSNs
ACKNOWLEDGMENTS
The authors thank Prof. Gianluigi Mancardi for the access to the MRI Unit (Magnetic Resonance Research Center, Department of Neuroscience, Rehabilitation, Ophthalmology, Genetics, Maternal, and Child Health, University of Genoa and IRCCS Ospedale Policlinico San Martino, Genoa, Italy).
Conio B, Magioncalda P, Martino M, et al. Opposing patterns of neuronal variability in the sensorimotor network mediate cyclothymic and depressive temperaments. Hum Brain Mapp. 2019;40:1344–1352. 10.1002/hbm.24453
Paola Magioncalda and Matteo Martino contributed equally to this work
REFERENCES
- Akiskal, H. (2004). The bipolar Spectrum in psychiatric and general medical practice. Primary Psychiatry, 11(9), 30–35. [Google Scholar]
- Akiskal, H. S. (2000). Temperament and mood disorders. The Harvard Mental Health Letter, 16, 5–6. [PubMed] [Google Scholar]
- Akiskal, H. S. (2001). Dysthymia and cyclothymia in psychiatric practice a century after Kraepelin. Journal of Affective Disorders, 62, 17–31. [DOI] [PubMed] [Google Scholar]
- Akiskal, H. S. , & Akiskal, K. K. (2005a). TEMPS: Temperament evaluation of Memphis, Pisa, Paris and San Diego. Journal of Affective Disorders, 85(1–2), 1–242. [DOI] [PubMed] [Google Scholar]
- Akiskal, H. S. , Mendlowicz, M. V. , Jean‐Louis, G. , Rapaport, M. H. , Kelsoe, J. R. , Gillin, J. C. , & Smith, T. L. (2005). TEMPS‐A: Validation of a short version of a self‐rated instrument designed to measure variations in temperament. Journal of Affective Disorders, 85, 45–52. [DOI] [PubMed] [Google Scholar]
- Akiskal, H. S. , Placidi, G. F. , Maremmani, I. , Signoretta, S. , Liguori, A. , Gervasi, R. , … Puzantian, V. R. (1998). TEMPS‐I: Delineating the most discriminant traits of the cyclothymic, depressive, hyperthymic and irritable temperaments in a nonpatient population. Journal of Affective Disorders, 51, 7–19. [DOI] [PubMed] [Google Scholar]
- Akiskal, K. K. , & Akiskal, H. S. (2005b). The theoretical underpinnings of affective temperaments: Implications for evolutionary foundations of bipolar disorder and human nature. Journal of Affective Disorders, 85, 231–239. [DOI] [PubMed] [Google Scholar]
- Balduzzi, D. , Riedner, B. A. , & Tononi, G. (2008). A BOLD window into brain waves. Proceedings of the National Academy of Sciences of the United States of America, 105, 15641–15642. [DOI] [PMC free article] [PubMed] [Google Scholar]
- Basalyga, G. , & Salinas, E. (2006). When response variability increases neural network robustness to synaptic noise. Neural Computation, 18, 1349–1379. [DOI] [PubMed] [Google Scholar]
- Biswal, B. , Yetkin, F. Z. , Haughton, V. M. , & Hyde, J. S. (1995). Functional connectivity in the motor cortex of resting human brain using echo‐planar MRI. Magnetic Resonance in Medicine, 34, 537–541. [DOI] [PubMed] [Google Scholar]
- Buzsaki, G. , & Draguhn, A. (2004). Neuronal oscillations in cortical networks. Science, 304, 1926–1929. [DOI] [PubMed] [Google Scholar]
- Christoff, K. , Gordon, A. M. , Smallwood, J. , Smith, R. , & Schooler, J. W. (2009). Experience sampling during fMRI reveals default network and executive system contributions to mind wandering. Proceedings of the National Academy of Sciences of the United States of America, 106, 8719–8724. [DOI] [PMC free article] [PubMed] [Google Scholar]
- Cloninger, C. R. (1986). A unified biosocial theory of personality and its role in the development of anxiety states. Psychiatric Developments, 4, 167–226. [PubMed] [Google Scholar]
- Cloninger, C. R. (1987). A systematic method for clinical description and classification of personality variants: A proposal. Archives of General Psychiatry, 44, 573–588. [DOI] [PubMed] [Google Scholar]
- Cloninger, C. R. , Svrakic, D. M. , & Przybeck, T. R. (1993). A psychobiological model of temperament and character. Archives of General Psychiatry, 50, 975–990. [DOI] [PubMed] [Google Scholar]
- Cordes, D. , Haughton, V. M. , Arfanakis, K. , Carew, J. D. , Turski, P. A. , Moritz, C. H. , … Meyerand, M. E. (2001). Frequencies contributing to functional connectivity in the cerebral cortex in "resting‐state" data. AJNR. American Journal of Neuroradiology, 22, 1326–1333. [PMC free article] [PubMed] [Google Scholar]
- Cox, R. W. (1996). AFNI: Software for analysis and visualization of functional magnetic resonance neuroimages. Computers and Biomedical Research, 29, 162–173. [DOI] [PubMed] [Google Scholar]
- Cuthbert, B. N. (2014). Research domain criteria: Toward future psychiatric nosology. Asian Journal of Psychiatry, 7, 4–5. [DOI] [PubMed] [Google Scholar]
- Davidson, R. J. (2000). Affective style, psychopathology, and resilience: Brain mechanisms and plasticity. The American Psychologist, 55, 1196–1214. [DOI] [PubMed] [Google Scholar]
- Evans, L. , Akiskal, H. S. , Keck, P. E., Jr. , McElroy, S. L. , Sadovnick, A. D. , Remick, R. A. , & Kelsoe, J. R. (2005). Familiarity of temperament in bipolar disorder: Support for a genetic spectrum. Journal of Affective Disorders, 85, 153–168. [DOI] [PubMed] [Google Scholar]
- Faisal, A. A. , Selen, L. P. , & Wolpert, D. M. (2008). Noise in the nervous system. Nature Reviews. Neuroscience, 9, 292–303. [DOI] [PMC free article] [PubMed] [Google Scholar]
- Fox, M. D. , & Raichle, M. E. (2007). Spontaneous fluctuations in brain activity observed with functional magnetic resonance imaging. Nature Reviews. Neuroscience, 8, 700–711. [DOI] [PubMed] [Google Scholar]
- Fox, M. D. , Snyder, A. Z. , Vincent, J. L. , Corbetta, M. , Van Essen, D. C. , & Raichle, M. E. (2005). The human brain is intrinsically organized into dynamic, anticorrelated functional networks. Proceedings of the National Academy of Sciences of the United States of America, 102, 9673–9678. [DOI] [PMC free article] [PubMed] [Google Scholar]
- Garrett, D. D. , Kovacevic, N. , McIntosh, A. R. , & Grady, C. L. (2010). Blood oxygen level‐dependent signal variability is more than just noise. The Journal of Neuroscience, 30, 4914–4921. [DOI] [PMC free article] [PubMed] [Google Scholar]
- Garrett, D. D. , Kovacevic, N. , McIntosh, A. R. , & Grady, C. L. (2011). The importance of being variable. The Journal of Neuroscience, 31, 4496–4503. [DOI] [PMC free article] [PubMed] [Google Scholar]
- Garrett, D. D. , McIntosh, A. R. , & Grady, C. L. (2011). Moment‐to‐moment signal variability in the human brain can inform models of stochastic facilitation now. Nature Reviews. Neuroscience, 12, 612 author reply 612. [DOI] [PubMed] [Google Scholar]
- Garrett, D. D. , McIntosh, A. R. , & Grady, C. L. (2014). Brain signal variability is parametrically modifiable. Cerebral Cortex, 24, 2931–2940. [DOI] [PMC free article] [PubMed] [Google Scholar]
- Garrett, D. D. , Samanez‐Larkin, G. R. , MacDonald, S. W. , Lindenberger, U. , McIntosh, A. R. , & Grady, C. L. (2013). Moment‐to‐moment brain signal variability: A next frontier in human brain mapping? Neuroscience and Biobehavioral Reviews, 37, 610–624. [DOI] [PMC free article] [PubMed] [Google Scholar]
- Ghaemi, S. N. (2013). Bipolar spectrum: A review of the concept and a vision for the future. Psychiatry Investigation, 10, 218–224. [DOI] [PMC free article] [PubMed] [Google Scholar]
- Ghaemi, S. N. , & Dalley, S. (2014). The bipolar spectrum: Conceptions and misconceptions. The Australian and New Zealand Journal of Psychiatry, 48, 314–324. [DOI] [PubMed] [Google Scholar]
- Gottlich, M. , Munte, T. F. , Heldmann, M. , Kasten, M. , Hagenah, J. , & Kramer, U. M. (2013). Altered resting state brain networks in Parkinson's disease. PLoS One, 8, e77336. [DOI] [PMC free article] [PubMed] [Google Scholar]
- Gotts, S. J. , Saad, Z. S. , Jo, H. J. , Wallace, G. L. , Cox, R. W. , & Martin, A. (2013). The perils of global signal regression for group comparisons: A case study of autism Spectrum disorders. Frontiers in Human Neuroscience, 7, 356. [DOI] [PMC free article] [PubMed] [Google Scholar]
- Goulden, N. , Khusnulina, A. , Davis, N. J. , Bracewell, R. M. , Bokde, A. L. , McNulty, J. P. , & Mullins, P. G. (2014). The salience network is responsible for switching between the default mode network and the central executive network: Replication from DCM. NeuroImage, 99, 180–190. [DOI] [PubMed] [Google Scholar]
- Hatano, K. , Terao, T. , Hoaki, N. , Kohno, K. , Araki, Y. , Mizokami, Y. , … Hayashi, T. (2014). Association between affective temperaments and regional gray matter volume in healthy subjects. Journal of Affective Disorders, 155, 169–173. [DOI] [PubMed] [Google Scholar]
- Hoptman, M. J. , Zuo, X. N. , Butler, P. D. , Javitt, D. C. , D'Angelo, D. , Mauro, C. J. , & Milham, M. P. (2010). Amplitude of low‐frequency oscillations in schizophrenia: A resting state fMRI study. Schizophrenia Research, 117, 13–20. [DOI] [PMC free article] [PubMed] [Google Scholar]
- Huang, S. , Li, Y. , Zhang, W. , Zhang, B. , Liu, X. , Mo, L. , & Chen, Q. (2015). Multisensory competition is modulated by sensory pathway interactions with Fronto‐sensorimotor and default‐mode network regions. The Journal of Neuroscience, 35, 9064–9077. [DOI] [PMC free article] [PubMed] [Google Scholar]
- Iasevoli, F. , Valchera, A. , Di Giovambattista, E. , Marconi, M. , Rapagnani, M. P. , De Berardis, D. , … de Bartolomeis, A. (2013). Affective temperaments are associated with specific clusters of symptoms and psychopathology: A cross‐sectional study on bipolar disorder inpatients in acute manic, mixed, or depressive relapse. Journal of Affective Disorders, 151, 540–550. [DOI] [PubMed] [Google Scholar]
- Insel, T. , Cuthbert, B. , Garvey, M. , Heinssen, R. , Pine, D. S. , Quinn, K. , … Wang, P. (2010). Research domain criteria (RDoC): Toward a new classification framework for research on mental disorders. The American Journal of Psychiatry, 167, 748–751. [DOI] [PubMed] [Google Scholar]
- Kodama, K. , Terao, T. , Hatano, K. , Kohno, K. , Makino, M. , Mizokami, Y. , … Kochiyama, T. (2015). Identification of the neural correlates of cyclothymic temperament using a working memory task in fMRI. Journal of Affective Disorders, 171, 1–5. [DOI] [PubMed] [Google Scholar]
- Kraepelin, E. (1902). Clinical Psychiatry. New York: Macmillan. [Google Scholar]
- Kraepelin E. (Ed.). (1921). Manic depressive insanity and paranoia. Edinburgh: Livingstone. [Google Scholar]
- Kyeong, S. , Kim, E. , Park, H. J. , & Hwang, D. U. (2014). Functional network organizations of two contrasting temperament groups in dimensions of novelty seeking and harm avoidance. Brain Research, 1575, 33–44. [DOI] [PubMed] [Google Scholar]
- Laird, A. R. , Eickhoff, S. B. , Li, K. , Robin, D. A. , Glahn, D. C. , & Fox, P. T. (2009). Investigating the functional heterogeneity of the default mode network using coordinate‐based meta‐analytic modeling. The Journal of Neuroscience, 29, 14496–14505. [DOI] [PMC free article] [PubMed] [Google Scholar]
- Lee, T. W. , Northoff, G. , & Wu, Y. T. (2014). Resting network is composed of more than one neural pattern: An fMRI study. Neuroscience, 274, 198–208. [DOI] [PubMed] [Google Scholar]
- Li, S. , Demenescu, L. R. , Sweeney‐Reed, C. M. , Krause, A. L. , Metzger, C. D. , & Walter, M. (2017). Novelty seeking and reward dependence‐related large‐scale brain networks functional connectivity variation during salience expectancy. Human Brain Mapping, 38, 4064–4077. [DOI] [PMC free article] [PubMed] [Google Scholar]
- Lugo, E. , Doti, R. , & Faubert, J. (2008). Ubiquitous crossmodal stochastic resonance in humans: Auditory noise facilitates tactile, visual and proprioceptive sensations. PLoS One, 3, e2860. [DOI] [PMC free article] [PubMed] [Google Scholar]
- Maremmani, I. , Akiskal, H. S. , Signoretta, S. , Liguori, A. , Perugi, G. , & Cloninger, R. (2005). The relationship of Kraepelian affective temperaments (as measured by TEMPS‐I) to the tridimensional personality questionnaire (TPQ). Journal of Affective Disorders, 85, 17–27. [DOI] [PubMed] [Google Scholar]
- Martino, M. , Magioncalda, P. , Huang, Z. , Conio, B. , Piaggio, N. , Duncan, N. W. , … Northoff, G. (2016). Contrasting variability patterns in the default mode and sensorimotor networks balance in bipolar depression and mania. Proceedings of the National Academy of Sciences of the United States of America, 113, 4824–4829. [DOI] [PMC free article] [PubMed] [Google Scholar]
- Mason, M. F. , Norton, M. I. , Van Horn, J. D. , Wegner, D. M. , Grafton, S. T. , & Macrae, C. N. (2007). Wandering minds: The default network and stimulus‐independent thought. Science, 315, 393–395. [DOI] [PMC free article] [PubMed] [Google Scholar]
- Menon, V. (2011). Large‐scale brain networks and psychopathology: A unifying triple network model. Trends in Cognitive Sciences, 15, 483–506. [DOI] [PubMed] [Google Scholar]
- Minassian, A. , Henry, B. L. , Geyer, M. A. , Paulus, M. P. , Young, J. W. , & Perry, W. (2010). The quantitative assessment of motor activity in mania and schizophrenia. Journal of Affective Disorders, 120, 200–206. [DOI] [PMC free article] [PubMed] [Google Scholar]
- Mizokami, Y. , Terao, T. , Hatano, K. , Kodama, K. , Kohno, K. , Makino, M. , … Kochiyama, T. (2014). Identification of the neural correlates of cyclothymic temperament using an esthetic judgment for paintings task in fMRI. Journal of Affective Disorders, 169, 47–50. [DOI] [PubMed] [Google Scholar]
- Nakao, T. , Matsumoto, T. , Shimizu, D. , Morita, M. , Yoshimura, S. , Northoff, G. , … Yamawaki, S. (2013). Resting state low‐frequency fluctuations in prefrontal cortex reflect degrees of harm avoidance and novelty seeking: An exploratory NIRS study. Frontiers in Systems Neuroscience, 7, 115. [DOI] [PMC free article] [PubMed] [Google Scholar]
- Northoff, G. (2014). How is our self altered in psychiatric disorders? A neurophenomenal approach to psychopathological symptoms. Psychopathology, 47, 365–376. [DOI] [PubMed] [Google Scholar]
- Northoff, G. (2016a). Spatiotemporal psychopathology I: No rest for the brain's resting state activity in depression? Spatiotemporal psychopathology of depressive symptoms. Journal of Affective Disorders, 190, 854–866. [DOI] [PubMed] [Google Scholar]
- Northoff, G. (2016b). Spatiotemporal psychopathology II: How does a psychopathology of the brain's resting state look like? Spatiotemporal approach and the history of psychopathology. Journal of Affective Disorders, 190, 867–879. [DOI] [PubMed] [Google Scholar]
- Northoff, G. , Magioncalda, P. , Martino, M. , Lee, H. C. , Tseng, Y. C. , & Lane, T. (2018). Too fast or too slow? Time and neuronal variability in bipolar disorder‐a combined theoretical and empirical investigation. Schizophrenia Bulletin, 44, 54–64. [DOI] [PMC free article] [PubMed] [Google Scholar]
- Perugi, G. , Hantouche, E. , & Vannucchi, G. (2017). Diagnosis and treatment of Cyclothymia: The "primacy" of temperament. Current Neuropharmacology, 15, 372–379. [DOI] [PMC free article] [PubMed] [Google Scholar]
- Perugi, G. , Toni, C. , Maremmani, I. , Tusini, G. , Ramacciotti, S. , Madia, A. , … Akiskal, H. S. (2012). The influence of affective temperaments and psychopathological traits on the definition of bipolar disorder subtypes: A study on bipolar I Italian national sample. Journal of Affective Disorders, 136, e41–e49. [DOI] [PubMed] [Google Scholar]
- Placidi, G. F. , Signoretta, S. , Liguori, A. , Gervasi, R. , Maremmani, I. , & Akiskal, H. S. (1998). The semi‐structured affective temperament interview (TEMPS‐I). reliability and psychometric properties in 1010 14‐26‐year old students. Journal of Affective Disorders, 47, 1–10. [DOI] [PubMed] [Google Scholar]
- Rovai, L. , Maremmani, A. G. , Rugani, F. , Bacciardi, S. , Pacini, M. , Dell'Osso, L. , … Maremmani, I. (2013). Do Akiskal & Mallya's affective temperaments belong to the domain of pathology or to that of normality? European Review for Medical and Pharmacological Sciences, 17, 2065–2079. [PubMed] [Google Scholar]
- Rozsa, S. , Rihmer, Z. , Gonda, X. , Szili, I. , Rihmer, A. , Ko, N. , … Akiskal, H. S. (2008). A study of affective temperaments in Hungary: Internal consistency and concurrent validity of the TEMPS‐A against the TCI and NEO‐PI‐R. Journal of Affective Disorders, 106, 45–53. [DOI] [PubMed] [Google Scholar]
- Saad, Z. S. , Gotts, S. J. , Murphy, K. , Chen, G. , Jo, H. J. , Martin, A. , & Cox, R. W. (2012). Trouble at rest: How correlation patterns and group differences become distorted after global signal regression. Brain Connectivity, 2, 25–32. [DOI] [PMC free article] [PubMed] [Google Scholar]
- Seeley, W. W. , Menon, V. , Schatzberg, A. F. , Keller, J. , Glover, G. H. , Kenna, H. , … Greicius, M. D. (2007). Dissociable intrinsic connectivity networks for salience processing and executive control. The Journal of Neuroscience, 27, 2349–2356. [DOI] [PMC free article] [PubMed] [Google Scholar]
- Talairach, J. , & Tournoux, P. (1988). Co‐planar stereotaxic atlas of the human brain. New York: Thieme Medical Publishers. [Google Scholar]
- Ward, L. M. (2003). Synchronous neural oscillations and cognitive processes. Trends in Cognitive Sciences, 7, 553–559. [DOI] [PubMed] [Google Scholar]
- Xue, S. W. , Li, D. , Weng, X. C. , Northoff, G. , & Li, D. W. (2014). Different neural manifestations of two slow frequency bands in resting functional magnetic resonance imaging: A systemic survey at regional, interregional, and network levels. Brain Connectivity, 4, 242–255. [DOI] [PubMed] [Google Scholar]
- Zhang, D. , & Raichle, M. E. (2010). Disease and the brain's dark energy. Nature Reviews. Neurology, 6, 15–28. [DOI] [PubMed] [Google Scholar]
- Zou, Q. H. , Zhu, C. Z. , Yang, Y. , Zuo, X. N. , Long, X. Y. , Cao, Q. J. , … Zang, Y. F. (2008). An improved approach to detection of amplitude of low‐frequency fluctuation (ALFF) for resting‐state fMRI: Fractional ALFF. Journal of Neuroscience Methods, 172, 137–141. [DOI] [PMC free article] [PubMed] [Google Scholar]
- Zuo, X. N. , Di Martino, A. , Kelly, C. , Shehzad, Z. E. , Gee, D. G. , Klein, D. F. , … Milham, M. P. (2010). The oscillating brain: Complex and reliable. NeuroImage, 49, 1432–1445. [DOI] [PMC free article] [PubMed] [Google Scholar]
Associated Data
This section collects any data citations, data availability statements, or supplementary materials included in this article.
Supplementary Materials
Figure S1 Contribution of temperamental mean z‐scores in the different groups of temperaments
Figure S2. Temperaments
Table S1. Demographic Information
Table S2a. Spearman correlations between temperaments z‐scores and fSD in RSNs
Table S2b. Spearman correlations between temperaments z‐scores and SMN fSD
Table S3. Neuronal variability in temperaments in the RSNs
Table S4a. Comparisons between groups of the fSD in SFB in the RSNs
Table S4b. Comparisons between groups of the fSD in slow4 and slow5 in the RSNs