

Abstract
Individuals often align their emotional states during conversation. Here, we reveal how such emotional alignment is reflected in synchronization of brain activity across speakers and listeners. Two “speaker” subjects told emotional and neutral autobiographical stories while their hemodynamic brain activity was measured with functional magnetic resonance imaging (fMRI). The stories were recorded and played back to 16 “listener” subjects during fMRI. After scanning, both speakers and listeners rated the moment‐to‐moment valence and arousal of the stories. Time‐varying similarity of the blood‐oxygenation‐level‐dependent (BOLD) time series was quantified by intersubject phase synchronization (ISPS) between speaker–listener pairs. Telling and listening to the stories elicited similar emotions across speaker–listener pairs. Arousal was associated with increased speaker–listener neural synchronization in brain regions supporting attentional, auditory, somatosensory, and motor processing. Valence was associated with increased speaker–listener neural synchronization in brain regions involved in emotional processing, including amygdala, hippocampus, and temporal pole. Speaker–listener synchronization of subjective feelings of arousal was associated with increased neural synchronization in somatosensory and subcortical brain regions; synchronization of valence was associated with neural synchronization in parietal cortices and midline structures. We propose that emotion‐dependent speaker–listener neural synchronization is associated with emotional contagion, thereby implying that listeners reproduce some aspects of the speaker's emotional state at the neural level.
Keywords: contagion, emotion, fMRI, speech, synchronization
1. INTRODUCTION
Humans easily catch each other's emotions. We cannot resist smiling when seeing a happy, babbling baby, and we often fail to hold back tears when hearing our friend telling us about the recent loss of a family member. Emotional contagion—automatic transfer of emotions from one individual to another via verbal and nonverbal cues—may be associated with automatic “mirroring” of emotional expressions, behavior, physiological, and neurochemical states in the observer (Gallese, 2003; Konvalinka et al., 2011; Lakin, Jefferis, Cheng, & Chartrand, 2003; Manninen et al., 2017). Neuroimaging studies have revealed overlapping brain activation patterns during observation and experience of emotional states such as pain (Jackson, Meltzoff, & Decety, 2005; Saarela et al., 2007; Singer et al., 2004), pleasure (Jabbi, Swart, & Keysers, 2007), and disgust (Wicker et al., 2003). Automatic alignment of emotion‐related neural and physiological states may allow interlocutors to “tune in” with each other, facilitating communication and mutual understanding (Hari, Henriksson, Malinen, & Parkkonen, 2015; Hatfield, Cacioppo, & Rapson, 1993; Nummenmaa et al., 2012; Nummenmaa, Lahnakoski, & Glerean, 2018). Neural mechanisms allowing flow of emotions across interacting persons remain, however, unresolved.
Naturalistic stimuli, such as movies and audiobooks, elicit time‐locked brain activity across individuals in both sensory and associative cortices (Boldt et al., 2013; Hasson, Nir, Levy, Fuhrmann, & Malach, 2004; Jääskeläinen et al., 2008; Malinen, Hlushchuk, & Hari, 2007). Such intersubject synchronization of brain activity is further increased in sensory and attention‐related brain areas during emotionally intense events (Nummenmaa et al., 2012; Nummenmaa, Saarimäki, et al., 2014), suggesting that emotions enhance similarity of sensory and affective processing across individuals. Furthermore, successful verbal (Stephens, Silbert, & Hasson, 2010) and nonverbal (Anders, Heinzle, Weiskopf, Ethofer, & Haynes, 2011; Schippers, Roebroeck, Renken, Nanetti, & Keysers, 2010) communication is associated with increased neural synchronization across the communicating individuals. Analogous emotion‐driven neural synchronization might accompany emotional contagion and psychological alignment of individuals, yet it remains unresolved whether emotional communication would increase interindividual brain synchronization.
Here, we tested whether emotional contagion between individuals would be associated with enhanced intersubject neural synchronization in a two‐person “pseudo‐hyperscanning” setup (Figure 1). We used naturalistic emotional speech to induce emotional contagion. Listening to emotional speech activates brain's emotion circuits (Costa, Lang, Sabatinelli, Versace, & Bradley, 2010; Jabbi et al., 2007; Wallentin et al., 2011) and modulates activity in the sensorimotor and visceral systems (Vrana & Lang, 1990), reflecting affective engagement. Two speaker subjects narrated emotional and neutral autobiographical events during functional magnetic resonance imaging (fMRI). Their narratives were recorded and played back to a group of listener subjects in a subsequent fMRI experiment. Similarity of brain activity between speaker and listener subjects was estimated with intersubject phase synchrony (ISPS; Glerean, Salmi, Lahnakoski, Jääskeläinen, & Sams, 2012). Our main hypothesis was that the strength of the speaker–listener ISPS is associated with the similarity of subjects' emotional states. More specifically, we expected that the degree of experienced emotional valence and arousal would be associated with speaker–listener ISPS in auditory, somatosensory, limbic and attention circuits, as well as in brain areas supporting in speech perception and production.
Figure 1.
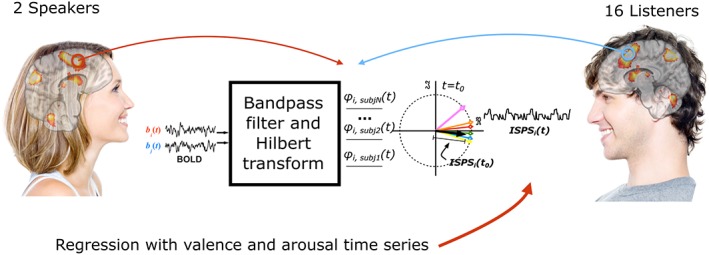
Overview of the experimental design and data analysis. Two individuals narrated 35 stories during functional magnetic resonance imaging (fMRI), and 16 listeners heard these stories while being scanned with fMRI. Neural synchronization between speakers and listeners was measured using intersubject phase synchronization (ISPS). ISPS allowed estimation of similarity between blood‐oxygen‐level‐dependent (BOLD) signals of speakers and listeners with the maximum theoretical resolution of the used MRI sequence
2. METHODS
2.1. Participants
Eighteen healthy right‐handed adult female volunteers (age 20–39 years, mean age 25 years; two “speakers” and 16 “listeners”) with normal or corrected to normal vision and self‐reported normal hearing volunteered for the study. All subjects were native Finnish speakers. Individuals with a history of neurological or psychiatric diseases, or current medication affecting the central nervous system, were excluded. All subjects were financially compensated for their time, and they signed informed consent forms. The research was approved by the Research Ethics Committee of Aalto University.
2.2. Experimental setup for speakers
The two speaker subjects narrated emotional episodes in Finnish, while their hemodynamic brain activity was measured with fMRI. Both subjects were experienced with fMRI and had practiced minimizing head motion while speaking. Approximately 2 weeks before the fMRI experiment, they were provided with a list of 35 story topics, describing pleasant, unpleasant, and neutral events, and were asked to generate 1‐min short episodes of each topic based on autobiographical events. Sample topics included “I was lying on a blanket underneath a tree with my lover. We were kissing passionately, and I felt I was so much in love with him” (pleasant), “I was spending an afternoon at home. There was nothing particular to do, so I went to the kitchen. I opened the fridge and started wondering what I should eat for dinner” (neutral) and “I was sitting on my mother's hospital bed. She had fallen into a coma during an unsuccessful operation. She could no longer talk to me, and I knew she would never recover” (unpleasant). Speakers were encouraged to imagine the events vividly, and rehearse each story so that they could narrate the stories effortlessly in the scanner.
The speakers narrated the stories aloud during fMRI. They were instructed to minimize head movements, and their heads were carefully padded inside the MRI head coil. Each trial started with a written cue defining the episode to be narrated (e.g., lovers under a tree) followed by the targeted emotion (e.g., happy). The cue stayed on the screen for 5 s, and was followed by 5 s of white fixation cross, prompting the speaker to prepare for narrating the story. Next, the fixation cross turned to green indicating that narration should begin. To help the speakers to time their story to last approximately 60 s, the fixation cross turned to yellow after 30 s to indicate the midpoint of the narration. After another 15 s, the fixation cross turned to red to indicate that 15 s are left for the speaker to finalize the story. Finally, after another 15 s, the fixation color changed back to white, indicating the start of an intertrial interval with a random 12–15 s duration.
Speech was recorded using an MR‐compatible noise‐canceling recording system (FOMRI; Optoacoustics Ltd., Or Yehuda, Israel). Stimulus delivery was controlled using Presentation software (Neurobehavioral Systems Inc., Albany, CA). Visual stimulation was back projected on a semitransparent screen using a 3‐micromirror data projector (Christie X3; Christie Digital Systems Ltd., Mönchengladbach, Germany) and reflected via a mirror to the subject. The audio recordings were edited to improve sound quality. We first recorded a high‐quality speech sample outside of the scanner from both speakers. To decrease noise and to improve naturalness of the speech recorded in the MRI scanner, we then equalized the recordings by matching their frequency spectra with those of high‐quality speech sample.
2.3. Experimental setup for listeners
In a subsequent fMRI experiment, the edited stories of both speakers were played back to the 16 listener subjects. The total number of scanning sessions was 27: 11 subjects listened to the stories of both speakers (N = 22); five subjects listened to only one speaker (N = 5). The trial structure and the timing corresponded to that of the speakers' but now the participants listened to the narratives using MRI‐compatible earphones.
Each trial began with a cue phase, similarly as in the speakers' experiment. The cue stayed on the screen for 5 s, and was followed for 5 s by a white fixation cross. Next, participants listened to the story while a fixation cross remained at the center of the screen. The stories were presented in the same order as the speakers narrated them to allow for the between‐subjects phase synchronization analyses (see below). Subjects were instructed to listen to the narratives similarly as if the narrator would be speaking to them during a face‐to‐face encounter, and to try to get involved in the stories by vividly imagining the described events. Auditory stimuli were delivered with Sensimetrics S14 insert earphones (Sensimetrics Corporation, Malden, MA). Sound intensity was adjusted individually for each subject to be loud enough to be heard over the scanner noise.
2.4. Self‐reports for valence and arousal
After brain imaging, both speakers and listeners listened to the narratives again via earphones outside the scanner and rated, on separate runs, valence (unpleasant–pleasant) and arousal (calm–aroused) of their moment‐to‐moment emotional feelings. The participants used a mouse to move a cursor up and down on a vertical scale to indicate their current emotional state (Dynamic annotation web‐tool: http://emotion.nbe.aalto.fi/software). Data were originally collected at 5 Hz but downsampled to 0.59 Hz (fMRI sampling rate) and rescaled to range from 0 (very unpleasant/very calm) to 1 (very pleasant/highly aroused).
2.5. Psychophysiological recordings
Heart and respiration rates were recorded from 24 out of total 27 scanning sessions for the listeners (two failed recordings for the listeners of the first speaker, and one failed recording for the listener of the second speaker), and from both speaker sessions with BIOPAC MP150 Data Acquisition System (BIOPAC System, Inc.). The speakers' respiration signals had, however, to be discarded because of the speech‐related artifacts. Out of 24 sessions recorded for the listeners, three sessions were discarded due to low quality (one for the listener of the first speaker, and two for the listeners of the second speaker). Heart rate was measured from the palmar surface of the participant's left index finger using BIOPAC TSD200 pulse plethysmogram transducer, which records optically the waveform of the blood‐volume pulse. Thoracic expansion and contraction movements during respiration were measured using BIOPAC TSD201 respiratory‐effort transducer attached to an elastic belt around the participant's chest. Both signals were sampled simultaneously at 1 kHz using RSP100C and PPG100C amplifiers for respiration and heart rate, respectively, and stored using the BIOPAC AcqKnowledge software (version 4.1.1). The heart and respiration signals were used to clean the corresponding physiological noise from the fMRI time series with the DRIFTER toolbox (Särkkä et al., 2012). If the physiological signals were correlated with emotional arousal and valence ratings, some emotion‐related fluctuations in brain signals might be lost due to this kind of preprocessing. To test this possibility, we calculated Spearman correlation coefficients between individual participant's valence and arousal ratings, and the estimates of heart and respiration rates acquired from DRIFTER and downsampled to 5 Hz to match valence and arousal time series. Altogether, we acquired 21 scanning sessions of the listeners with complete behavioral and physiological time series: eight sessions for individuals who listened to both speakers (N = 16 total), and five sessions for individuals who listened to only one speaker (N = 5). To acquire group estimate of correlation between physiological signals (heart and respiration rates) and emotions (valence and arousal ratings), we used Fisher's formula with degrees of freedom set to half of the input sample (df = 11; Heller, Golland, Malach, & Benjamini, 2007).
2.6. fMRI acquisition and preprocessing
MRI was performed with 3T Siemens MAGNETOM Skyra scanner at the Advanced Magnetic Imaging Centre, Aalto NeuroImaging, Aalto University, using a 20‐channel Siemens head coil. Whole‐brain functional images were collected using a whole brain T2*‐weighted echo‐planar imaging sequence, sensitive to blood oxygenation level‐dependent (BOLD) signal contrast, with the following parameters: 33 axial slices, repetition time (TR) = 1.7 s, echo time (TE) = 24 ms, flip angle = 70°, voxel size = 3 × 3 × 4.0 mm3. A total of 365 volumes were acquired in each run, and the first three volumes of each run were discarded. High‐resolution anatomical images with isotropic 1 × 1 × 1 mm3 voxel size were collected using a T1‐weighted MP‐RAGE sequence.
fMRI data were preprocessed using MATLAB (The MathWorks, Inc., Natick, MA), FSL (FMRIB's Software Library, http://www.fmrib.ox.ac.uk/fsl) and SPM8 (http://www.fil.ion.ucl.ac.uk/spm/). After slice‐timing correction, the functional images were realigned to the middle scan by rigid‐body transformations with MCFLIRT to correct subject's motion. Next, DRIFTER was used to clean respiratory and heart rate signal from the data (Särkkä et al., 2012). Next, nonbrain matter was removed from functional and anatomical images with BET (Smith, 2002). Functional images were registered to the MNI152 standard space template with 2‐mm resolution using FLIRT (Jenkinson, Bannister, Brady, & Smith, 2002). Motion artifacts were cleaned from the functional data using 24 motion regressors (Power et al., 2014). The data were spatially smoothed with a Gaussian kernel of full width at half maximum (FWHM) 10 mm to compensate for inaccuracies in coregistration. Optimal kernel has been suggested to be slightly larger than double the original voxel size (Pajula & Tohka, 2014), thus 10 mm was used in our preprocessing pipeline. All subsequent analyses were performed with these preprocessed data.
2.7. Intersubject phase synchronization
To estimate emotion‐dependent speaker–listener neural synchronization, we computed ISPS using FUNPSY toolbox (Figure 1; Glerean et al., 2012). ISPS analysis allows estimation of instantaneous synchronization of brain activity across individuals. Phase synchronization is based on the properties of the analytic signal, where the original time series is expanded into real and imaginary components. The time series can then be rewritten as instantaneous amplitude and instantaneous phase parts, allowing focusing only on the dynamic phase. For illustrative purposes, we can compare the procedure to a sliding‐window correlation where the window would shrink to zero with the discarded amplitude part comparable to the discarded mean in the sliding‐window correlation. For more details, see Glerean et al. (2012) and Pedersen, Omidvarnia, Zalesky, and Jackson (2018).
For ISPS analysis, the data were band‐pass filtered through 0.04–0.07 Hz to remove noise and because the concept of phase synchronization is meaningful only for narrowband signals. This frequency band is the least affected by physiological noise, as detailed by (Glerean et al., 2012). Next, the data were Hilbert transformed to acquire the analytic signal, and the ISPS time series were calculated for each voxel and each speaker–listener pair. The resulting synchronization time series between speakers and listeners can thus be further predicted with a stimulation model, here valence or arousal time series (Nummenmaa, Saarimäki, et al., 2014). Because we were interested in speaker–listener neural synchronization, only speaker–listener pairwise ISPS time series were used in subsequent analyses. The total number of sessions used in this analysis was 27 (11 listeners who listened to both speakers and five listeners who listened only to one speaker). To maximize statistical power, for each listener (n = 11) who had listened to both speakers, both the fMRI ISPS time series and the behavioral time series were concatenated across the two sessions.
2.8. Mean speaker–listener ISPS
We first calculated mean speaker–listener ISPS over all scans when speech stimuli were presented to reveal brain regions where the listener's and speaker's neural activity was synchronized regardless of their emotions. First, mean voxelwise ISPS was calculated for the ISPS time series between each speaker–listener pair, and voxelwise values were then averaged across subjects to yield the group‐level ISPS map. Only data acquired during speaking or listening to speech were used in the analysis. Statistical significance thresholding was performed with permutation testing. Since the mean ISPS does not follow any known parametric distribution, we estimated the cumulative distribution function by calculating the mean ISPS over permutations of time series for a subset of voxels spanning through all the range of mean ISPS values and for all speaker–listener pairs. The subset included 2,278 voxels (we took an MNI space cerebral mask, filtered only voxels that are included in the brain, and sampled every 100th voxel out of total ∼227,800 voxels), and performed 5,000 permutations for each voxel. We took only a subset of voxels to simplify and speed up the calculations that were computationally prohibitive. For permutation resampling, we used a circular block‐resampling procedure that accounts for autocorrelation in the signal (Politis & Romano, 1992). In each permutation, the time series were divided into blocks (block size at maximum 10% of the total length of the time series, ranged from 21 to 198 scans); the blocks were then randomly shuffled. After shuffling, we calculated the mean ISPS for each of the included voxels, producing a null distribution for each voxel to calculate its related p‐value. First, p‐values for the voxels included in permutations were calculated, and then p‐values for the whole brain were obtained by linear interpolation using the permutation distribution. We then performed Benjamini–Hochberg false‐discovery‐rate (BH‐FDR; Benjamini & Hochberg, 1995) correction for the multiple comparisons with q < 0.05.
2.9. Emotion‐dependent speaker–listener ISPS
To estimate how emotions modulate speaker–listener ISPS, we predicted the voxelwise speaker–listener ISPS time series with the averaged listeners' valence and arousal time series. Mean valence and arousal time series were z‐transformed and convolved with a gamma function (θ = 1, k = 6) to account for the hemodynamic lag. To account for possible confounding effects of BOLD changes triggered by the context‐evoking text cues presented on the screen, we convolved the hemodynamic response function with a boxcar regressor containing the time points when cue was present, to create a model that predicted a positive effect of text presentation. Time points that included story presentation but might have been contaminated by confounds from the beginning of stimulus presentation (n = 6, 10 s) were then discarded from the analysis. We then calculated voxelwise Pearson's correlation coefficient between the speaker–listener ISPS and the time series of valence and arousal separately for each speaker–listener pair. These correlations were converted to t‐values for each pair, using degrees of freedom adjusted for serial correlations: due to serial correlations in the fMRI data, the effective degrees of freedom are smaller than the total number of sample points (for details, see Alluri et al., 2012, appendix B). Autocorrelations were estimated by computing the cross‐correlation between the signal and lagged version of the same signal. The resulting degrees of freedom were one seventh of the number of samples in the time series, indicating that the autocorrelation dropped to negligible after seventh time point. Group‐level p‐values were computed using Fisher's method (Lazar, 2008) by combining the p‐values for each subject pair for each voxel into a single chi‐square test statistic which was then used to determine the group‐level statistical significance. Group‐level p‐values were subsequently corrected for multiple comparisons using BH‐FDR with q < 0.05. The resulting maps thus revealed brain regions where the speaker–listener neural synchronization was associated with valence and arousal dimensions of emotions across subject pairs.
2.10. Correlation between similarity of speaker–listener emotions and speaker–listener ISPS
Finally, we investigated the correlation between the similarity of speaker–listener emotional states and speaker–listener neural synchronization, using similar methodological approach as in Nummenmaa et al. (2012). To that end, we first computed ISPS for the self‐reported arousal and valence time series between speakers and listeners to index similarity of emotional feelings between each speaker–listener pair. This calculation was similar to that for the neural ISPS. Then, we used Pearson's correlation coefficient to estimate voxelwise similarity between neural synchronization time series and synchronization of emotional valence/arousal time series for each speaker–listener pair. Subsequently, using the same procedure as in the analysis of emotion‐dependent ISPS changes, we converted the correlation values to t‐values with degrees of freedom adjusted for autocorrelation and then calculated the group level p‐values using Fisher's method. Multiple comparison correction (BH‐FDR, q < 0.05) was done similarly as described above. The voxel intensities on resulting maps reflect the degree to which brain‐to‐brain similarity between speaker and listener was associated with similarity of their emotional feelings.
3. RESULTS
3.1. Self‐reported emotional feelings
The narratives elicited strong time‐varying emotional reactions in both speakers and listeners (Figure 2). Feelings of valence (r = .79, p < .001) and arousal (r = .59, p < .001) were strongly correlated between speaker–listener pairs. In both listeners and speakers, the individual valence and arousal ratings were anticorrelated (mean r = −.45, p < .001) but independent of heart and respiration rates (ps > .5). We also computed pairwise correlation across listeners for valence and arousal time series to verify that the valence and arousal were consistent across the listeners. For the first speaker, the average Pearson correlation coefficients were .45 and .68 for arousal and valence, respectively (group p < .001, estimated using Fisher formula). For the second speaker, the corresponding values were .43 and .58 (group p < .001). Arousal was typically higher for negative emotions; valence was higher for positive, and lower for negative, as expected (Table 1).
Figure 2.
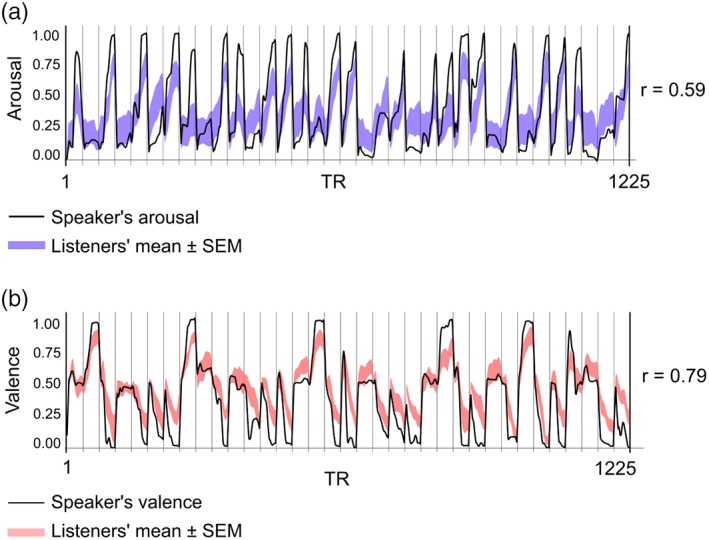
Self‐reported valence and arousal rating time series of speaker and listener subjects. Ratings were collected in a separate session after the functional magnetic resonance imaging (fMRI), where speakers and listeners in real time rated their emotions while listening to the stories. Solid black line indicates speaker's emotional ratings, and shaded area indicates ±1.96 SE of the mean (SEM), derived from listeners' data
Table 1.
Average arousal and valence ratings and correlation between arousal and valence ratings for different emotion categories. Valence and arousal scales range from 0 to 1
| Surprise | Happiness | Disgust | Neutral | Fear | Sadness | Anger | |
|---|---|---|---|---|---|---|---|
| Average arousal | 0.29 | 0.23 | 0.46 | 0.18 | 0.40 | 0.33 | 0.41 |
| Average valence | 0.56 | 0.74 | 0.27 | 0.58 | 0.37 | 0.27 | 0.37 |
| Arousal–valence correlation | −0.09 | 0.15 | −0.44 | 0.01 | −0.61 | −0.42 | −0.5 |
3.2. Emotion‐related speaker–listener neural synchronization
To reveal brain regions where the fMRI time courses were similar between speakers and listeners, we first computed mean speaker–listener neural synchronization across all stimuli, irrespective of emotional valence/arousal of the narratives. Statistically significant synchrony was observed in left inferior frontal gyrus (IFG), left temporal pole, bilateral superior‐temporal auditory cortex, right angular gyrus (AG), left V2, V3, and V4, left precuneus, and anterior cingulate cortex (Figure 3).
Figure 3.
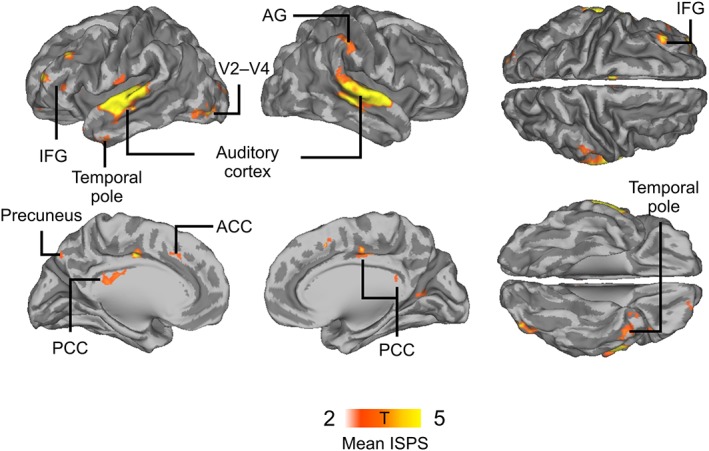
Mean speaker–listener neural synchronization throughout the experiment, indicating brain regions where neural synchronization was enhanced across all speaker–listener pairs regardless of emotional content of the speech
We next correlated the speaker–listener ISPS with the averaged listeners' valence and arousal time series to find out whether the neural synchronization between speakers and listeners would depend on the emotional intensity of the narrative. Arousal was positively associated with neural synchronization in left primary and secondary somatosensory cortices (SI and SII), left superior parietal lobule (SPL), left middle frontal gyrus, right posterior superior temporal sulcus (pSTS), bilateral superior temporal gyrus, left premotor cortex, precuneus, and supplementary motor area (SMA). Negative associations were observed in bilateral temporal pole, right AG, thalamus, and lingual gyrus (Figure 4a). Valence was positively associated with neural synchronization in bilateral temporal pole, left pSTS, right AG, right IFG/frontal pole, as well as lingual gyrus, bilateral amygdala and hippocampus, thalamus, and left fusiform cortex. Negative associations were observed in bilateral superior frontal gyrus, left SPL, left Heschl's gyrus, left lateral occipital cortex, as well as right pSTS (Figure 4b).
Figure 4.
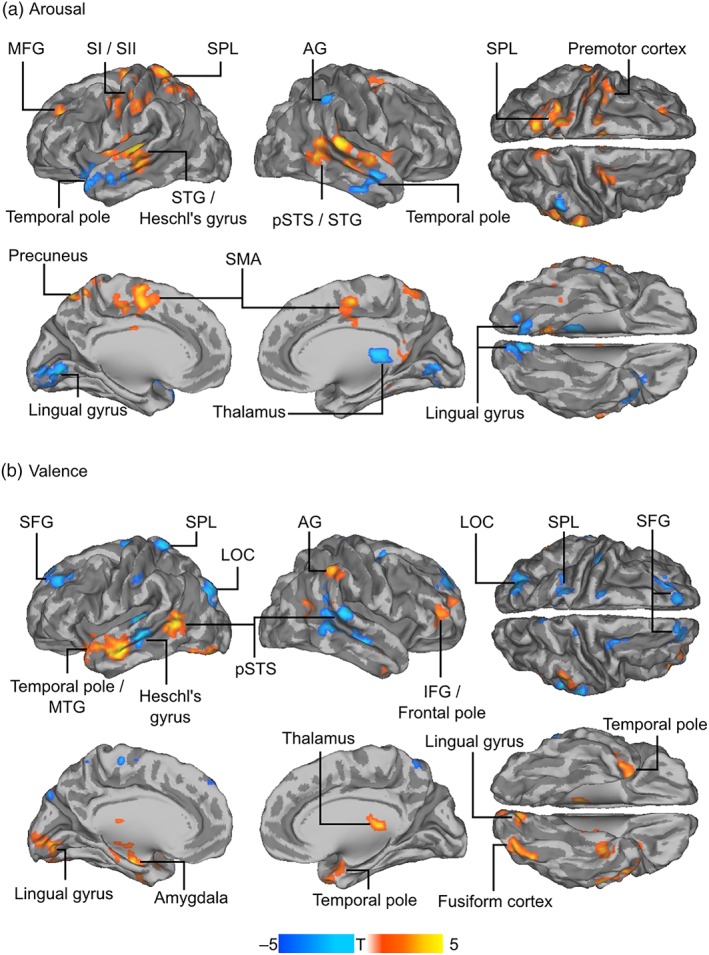
Speaker–listener neural synchronization (intersubject phase synchronization [ISPS]) as a function of valence and arousal. Speaker–listener ISPS was correlated with listeners' valence and arousal time series to reveal brain regions where neural synchronization would be associated with emotional intensity of the narratives. Warm colors indicate regions where ISPS was significantly positively correlated with average listeners' emotions (arousal: Panel A; valence: Panel B), cold colors indicate regions where ISPS was statistically significantly negatively correlated with average listeners' emotions. The data are thresholded at p < .05, false‐discovery rate (FDR) corrected
To provide more comprehensive view on the neural activation during the listening to emotional narratives, we performed several supplementary analyses. We evaluated, using general linear model, the effects of valence and arousal on BOLD responses while listening to the narratives, showing that valence and arousal of speech‐modulated activity in similar regions in the speakers and listeners. We also evaluated whether neural synchronization was stronger during emotional stories, compared to neutral stories, by calculating two‐sample t test between ISPS during emotional stories and neutral stories, see Supporting Information for details.
3.3. Neural synchronization associated with synchronization of emotions
Finally, we investigated whether speaker–listener neural synchronization would depend spatially selectively on the synchronization of the subjective emotional states between speakers and listeners. This analysis extended the findings from the above analysis of emotion‐dependent neural synchronization by testing whether experiencing more similar emotions across each speaker–listener pair would be associated with regionally selective neural synchronization. Similarity in feelings of arousal was associated with increased neural synchronization in V2 and somatosensory cortex, bilateral fusiform cortex and right amygdala/hippocampus (Figure 5, cold colors). Similarity of valence was, in turn, associated with increased neural synchronization in anterior cingulate cortex (ACC), left SPL and precuneus, premotor cortex, bilateral AG/SMG, right temporal pole, right MTG, and right amygdala (Figure 5, warm colors).
Figure 5.
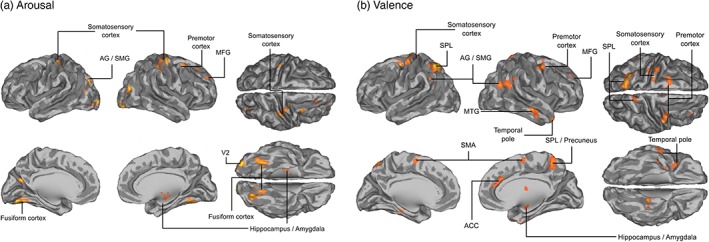
Neural synchronization between speakers and listeners as a function of synchronization of their feelings of emotional arousal and valence. Speaker–listener ISPS was correlated with speaker–listener similarity of valence/arousal ratings to reveal the regions where more similar emotions were associated with higher neural synchronization. (a) Neural synchronization between speakers and listeners associated with increase in synchronization of arousal ratings. (b) Neural synchronization between speakers and listeners associated with increase in synchronization of valence ratings. The data are thresholded at p < .05, false‐discovery rate (FDR) corrected
4. DISCUSSION
Our main finding was that increase similarity of emotional feelings across speakers and listeners—a marker of emotional contagion—is associated with regionally specific synchronization between speakers' and listeners' brain activity. Listeners closely tracked the speakers' affective state, as evidenced by the correlated feelings of arousal and valence across speakers and listeners. The degree of moment‐to‐moment speaker–listener neural synchronization also depended linearly on the valence and arousal of listeners' emotional state. Arousal was associated with enhanced synchrony in sensory areas (SI, auditory and superior parietal cortex), whereas enhanced valence was associated with increased synchrony in components of the emotion circuit (amygdala, thalamus). These data are in line with the view that emotional contagion is associated with the alignment of mental (Hatfield et al., 1993) and neural (Jabbi et al., 2007; Singer et al., 2004; Wicker et al., 2003) states of the individuals engaged in emotional communication. Such alignment provides contextual information for observed emotional expression. Previous research shows that such contextual information is critical for comprehension of multiple types of communicative signals (Bransford & Johnson, 1972; Smirnov et al., 2014; Stolk, Verhagen, & Toni, 2016). Similarity of emotional states across individuals and the concomitant remapping of the bodily states from the speaker to the listener may facilitate understanding others' emotional states and intentions.
4.1. Emotional valence and arousal are associated with increased speaker–listener neural synchronization
We found that valence and arousal dimensions of subjective emotional feelings were associated with the moment‐to‐moment speaker–listener neural synchrony in a number of brain regions. While previous studies have shown how information flows between individuals engaged in nonverbal interaction and communication (Anders et al., 2011; Schippers et al., 2010), our results also reveal, for the first time, that the emotional features of verbal communication are associated with increased speaker–listener neural synchronization in multiple brain regions. Arousal was positively associated with speaker–listener neural synchronization in the posterior auditory cortex and regions involved in attentional control (SPL; Corbetta & Shulman, 2002). This finding accords with a bulk of behavioral and neurophysiological evidence suggesting that emotional arousal serves to gate the incoming sensory information (Vuilleumier, 2005), leading to increased synchrony in the sensory (here auditory) cortices processing the incoming information in a group of subjects exposed to similar emotional stimulation (Nummenmaa et al., 2012; Nummenmaa, Saarimäki, et al., 2014). Here, we extend these findings to continuous speech‐based emotional communication from person to person. We used mean valence/arousal ratings across the listeners as predictors of neural synchrony, with an assumption that they reflect the population‐level response, informing which brain regions are synchronized more when the individuals perceive stimuli that have higher valence/arousal. Complementary analyses using subject‐wise emotion ratings also yielded comparable results (data not shown).
Significant arousal‐dependent effects were also observed in the SMA, primary left SI, SII, and premotor cortices. Prior studies have established that different emotions are associated with discernible activation patterns in SI (Saarimäki et al., 2016), possibly reflecting specific emotion‐related changes in bodily states (Nummenmaa, Glerean, Hari, & Hietanen, 2014; Nummenmaa, Hari, Hietanen, & Glerean, 2018; Volynets, Glerean, Hietanen, Hari, & Nummenmaa, 2019). The presently observed emotion‐dependent synchronization of somatosensory and motor brain areas likely reflects engaging in similar bodily perspective across the speakers and listeners. This view is supported by studies showing that somatosensory cortex becomes synchronized across individuals who simulate others' emotional and sensorimotor states (Nummenmaa, Smirnov, et al., 2014), thereby demonstrating a link between narrative‐triggered emotions and bodily feelings (Nummenmaa, Saarimäki, et al., 2014).
Experienced valence was positively associated with neural synchronization in amygdala, thalamus, temporal pole, and pSTS. Amygdala and temporal pole are involved in emotional processing and support generation of multiple emotions (Saarimäki et al., 2018; Saarimäki et al., 2016; Sander, Grafman, & Zalla, 2003). Synchronization in the pSTS might, in turn, reflect temporally aligned analysis of intentions across the interlocutors (Lahnakoski et al., 2012; Nummenmaa & Calder, 2009).
Both valence and arousal were negatively associated with neural synchronization in a number of regions: arousal in temporal poles, thalamus, and AG, and valence in right pSTS, left Heschl's gyrus, left lateral occipital cortex (LOC), and bilateral superior frontal gyrus (SFG). These negative associations reveal brain regions where higher synchronization was correlated with lower arousal/valence, as well as regions where lower synchronization was correlated with high arousal/valence. At present, we cannot provide a mechanistic neuronal level interpretation for neither these findings nor possible causal effects. However, since the valence scale is bipolar (i.e., midpoint refers to neutral emotional state), brain regions where valence is negatively associated with neural synchronization could also be interpreted as regions where similarity of brain activity was higher when emotions were negative.
Behavioral studies have shown that humans have the tendency to synchronize each other's expressive behavior (Dimberg & Thunberg, 1998) and physiological states (Konvalinka et al., 2011) during emotional episodes. Such synchronization may enhance rapport and connectedness (Miles, Nind, & Macrae, 2009) and promote social bonding (Hove & Risen, 2009; Tarr, Launay, & Dunbar, 2016; van Baaren, Holland, Kawakami, & van Knippenberg, 2004; Wiltermuth & Heath, 2009). The present findings suggest that a similar emotion‐related synchronization occurs at the neural level, as the speaker's emotional state was found to “resonate” in the listeners' somatosensory, auditory, attentional, and emotional circuits. This neural synchronization during emotional communication may be associated with emotional contagion, potentially allowing listeners to replicate in part the mental and bodily state of the speaker.
4.2. Similarity of emotional states is associated with similarity of neural states
Previous studies have shown that emotions are associated with increased synchronization of brain activation across groups of individuals exposed to similar emotional content (Nummenmaa et al., 2012; Nummenmaa, Saarimäki, et al., 2014). We extended these findings to a “pseudointeractive” two‐person setting, revealing the brain regions where the speakers' and listeners' synchronous brain activity is associated with the similarity of their subjective feelings of valence and arousal. This analysis, in contrast to the correlation between ISPS and the average valence/arousal ratings, presented above, reflected the individual‐level responses by quantifying the emotional similarity for each speaker–listener pair and its correlation with the neural synchronization of the same pair.
Similarity of arousal and valence between speakers and listeners was associated with synchronization of neural states in somatosensory and subcortical brain regions, and similarity of valence was also associated with synchronization in parietal cortices. Additional effects were observed in the midline structures (ACC and precuneus), which become increasingly synchronized when individuals perceive emotional valence of the stimuli more similarly. Cortical midline activity has been consistently found during various emotional processing tasks (for review, see Kober et al., 2008; Phan, Wager, Taylor, & Liberzon, 2002). Specifically, ACC activity has been linked with appraisal of emotional and motivational salience of events and regulation of emotional responses (for review, see Bush, Luu, & Posner, 2000). Emotional tasks with cognitive components also engage ACC more strongly than emotional conditions do, and ACC is also engaged when subjects are recalling or imagining an emotionally charged personal event (Phan et al., 2002).
The cortical midline structures, including precuneus, may support the imagination and active inference of the mental states of the other individual, integrating inputs from somatosensory, memory and motor brain networks (Mar, 2011). Several studies support the integrational role of midline structures, suggesting that they may integrate inputs from sensorimotor and interoceptive systems with contextual knowledge, thus providing the basis of emotional feelings (Northoff et al., 2006; Saarimäki et al., 2016) and also for understanding and simulating others' feelings (Karjalainen et al., 2017; Karjalainen et al., 2019). Synchronous neural activity of the midline regions, coupled with similarity in emotional feelings may thus reflect adopting the perspective of the speaker by the listeners, which in turn might enhance the ability to understand and predict others' feelings, goals and intentions.
4.3. Limitations
The present results highlight how speaker–listener synchronization in the brain's auditory, somatosensory, attention, speech processing, and emotional circuits is associated with the emotional content of the speech, thus potentially underlying emotional contagion. However, with the temporal resolution of fMRI, we cannot tell whether emotional contagion or synchronization of brain activity across the interlocutors occurs first. Most likely, the effect is bidirectional and based on reciprocal effects of emotional contagion and neural synchronization: as we catch others' emotions, our brains become more synchronized; such synchronization makes it easier to share our emotions as we perceive emotions of others more similarly, which may in turn further increase the similarity in BOLD activation time courses. Future research could address possible interactions between neural and emotional synchronization using temporally more accurate measures, such as two‐person magnetoencephalography (MEG; Baess et al., 2012) to also unravel the direction of information flow across the interacting brains.
Previous research has also shown that synchronization between speaker and listener occurs with a delay, with predictive synchronization in some brain areas (Stephens et al., 2010). Here, we did not analyze the timing aspects of synchronization between speakers and listeners, be it predictive or delayed. However, performing such analysis in the future might reveal new insights on different phases of emotional communication. In the future, it would also be interesting to contemplate the listener–listener and speaker–listener neural synchronization patterns, as such approach could be used to parse the components of synchronization that are independent (speaker–speaker) and dependent (speaker–listener) of the generation of the emotional speech in the first place.
Our current results cannot tell whether emotional contagion requires selective neural synchronization, because we did not address the directionality or causality of emotional contagion and neural synchronization. The degree of neural synchronization between speakers and listeners is, however, correlated with successful communication (Stephens et al., 2010) and the ability to predict the spoken utterance increases the neural synchronization between speaker and listener (Dikker, Silbert, Hasson, & Zevin, 2014). Moreover, when individuals interact in a decision game, their brains—when considered as a hyperbrain network (including multiple brains from the analytic standpoint)—show more modularity and less interbrain links, for example, tendency to form disjoint subgraphs rather than a single network, when the couples are less cooperative (De Vico Fallani et al., 2010). Together these studies suggest that effective communication is associated with more similar and more joint activity of the brains across the interacting individuals. Our study, in turn, suggests that catching the speaker's emotions is associated with increased similarity of activity in brain areas involved in speech and emotions. Future studies need to test how different aspects of spoken communication influence the degree of emotional contagion.
It is possible that emotional versus nonemotional stories were more engaging and attracting more attention, which then could lead to higher neural synchronization during the former stories. We, however, acquired no data on attention towards the speech stimuli. We have earlier indeed suggested that lower comprehension of the stories would increase the dissimilarity of neural activation across listeners (Smirnov et al., 2014). Yet another issue might be the potential priming by the title of the emotion presented before each narrative. While we used the emotion title to provide guidance as to which emotion the speaker was experiencing, we believe that discarding the 10 s after that presentation should severely limit the priming effect of the word. Moreover, we show that neural synchronization is correlated with the dynamic changes in emotions, suggesting that just the word did not drive the correlations.
Finally, our experiment was not truly interactive, since speakers and listeners were recorded in different sessions and could not directly influence each other. Thus, our experiment cannot address reciprocal feelings emerging during interaction. True “hyperscanning” designs or real‐time scanning of two individuals involved in face‐to‐face interaction could resolve the bidirectional dynamics of emotional contagion across individuals.
5. CONCLUSIONS
We conclude that emotional transfer emerging during verbal communication is accompanied by regionally selective synchronization of the speakers' and listeners' somatosensory, limbic and attention brain circuits. Similarity of emotional feelings across speakers and listeners was further associated with increasingly similar neural activity in the somatosensory, parietal, subcortical, and cortical midline regions. While these results suggest that emotional contagion is associated with regionally selective neural synchronization, future studies need to test the direction of information flow affecting neural synchronization during emotional contagion.
Supporting information
Appendix S1 Supporting Information
Figure S1 BOLD‐GLM activation associated with self‐reported valence and arousal for speakers and listeners. Warm and cold colors indicate activation and deactivation respectively, of brain regions in GLM. A) Activation during the story telling regardless of the emotional feelings. B) Activation during listening to the story regardless of the emotional feelings. C) Activation during the story telling associated with changes in arousal. D) Activation during the listening associated with changes in arousal. E) Activation during the story telling associated with changes in valence. F) Activation during the listening associated with changes in valence.
Figure S2 Regions where neural synchrony (ISPS) between speakers and listeners is stronger during emotional vs neutral narratives. Warm colors indicate regions where neural synchrony was higher during emotional stories. Cold colors indicate regions where neural synchrony was higher during neutral stories.
ACKNOWLEDGMENTS
The authors would like to thank Marita Kattelus for her help with the data acquisition. The calculations presented above were performed using computer resources within the Aalto University School of Science “Science‐IT” project. This work was supported by the aivoAALTO project of the Aalto University, Academy of Finland (#265917 to L.N. and #131483 to R.H.), ERC Starting Grant (#313000 to L.N.); ERC Advanced Grant (#232946 to R.H.).
Smirnov D, Saarimäki H, Glerean E, Hari R, Sams M, Nummenmaa L. Emotions amplify speaker–listener neural alignment. Hum Brain Mapp. 2019;40:4777–4788. 10.1002/hbm.24736
Funding information ERC Advanced Grant, Grant/Award Number: 232946; ERC Starting Grant, Grant/Award Number: 313000; Suomen Akatemia, Grant/Award Numbers: 131483, 265917; Suomen Kulttuurirahasto, Grant/Award Number: 150496
DATA AVAILABILITY STATEMENT
The data that support the findings of this study are available from the corresponding author upon reasonable request.
REFERENCES
- Alluri, V. , Toiviainen, P. , Jääskeläinen, I. , Glerean, E. , Sams, M. , & Brattico, E. (2012). Large‐scale brain networks emerge from dynamic processing of musical timbre, key and rhythm. NeuroImage, 59(4), 3677–3689. 10.1016/j.neuroimage.2011.11.019 [DOI] [PubMed] [Google Scholar]
- Anders, S. , Heinzle, J. , Weiskopf, N. , Ethofer, T. , & Haynes, J. (2011). Flow of affective information between communicating brains. NeuroImage, 54(1), 439–446. 10.1016/j.neuroimage.2010.07.004 [DOI] [PMC free article] [PubMed] [Google Scholar]
- Baess, P. , Zhdanov, A. , Mandel, A. , Parkkonen, L. , Hirvenkari, L. , Mäkelä, J. P. , … Hari, R. (2012). MEG dual scanning: A procedure to study real‐time auditory interaction between two persons. Frontiers in Human Neuroscience, 6, 7 10.3389/fnhum.2012.00083 [DOI] [PMC free article] [PubMed] [Google Scholar]
- Benjamini, Y. , & Hochberg, Y. (1995). Controlling the false discovery rate: A practical and powerful approach to multiple testing. Journal of the Royal Statistical Society Series B, 57(1), 289–300. 10.2307/2346101 [DOI] [Google Scholar]
- Boldt, R. , Malinen, S. , Seppä, M. , Tikka, P. , Savolainen, P. , Hari, R. , & Carlson, S. (2013). Listening to an audio drama activates two processing networks, one for all sounds, another exclusively for speech. PLoS One, 8(5), e64489 10.1371/journal.pone.0064489 [DOI] [PMC free article] [PubMed] [Google Scholar]
- Bransford, J. , & Johnson, M. (1972). Contextual prerequisites for understanding: Some investigations of comprehension and recall. Journal of Verbal Learning and Verbal Behavior, 11(6), 717–726. 10.1016/S0022-5371(72)80006-9 [DOI] [Google Scholar]
- Bush, G. , Luu, P. , & Posner, M. (2000). Cognitive and emotional influences in anterior cingulate cortex. Trends in Cognitive Sciences, 4(1), 215–222. [DOI] [PubMed] [Google Scholar]
- Corbetta, M. , & Shulman, G. (2002). Control of goal‐directed and stimulus‐driven attention in the brain. Nature Reviews. Neuroscience, 3(3), 215–229. 10.1038/nrn755 [DOI] [PubMed] [Google Scholar]
- Costa, V. , Lang, P. , Sabatinelli, D. , Versace, F. , & Bradley, M. (2010). Emotional imagery: Assessing pleasure and arousal in the brain's reward circuitry. Human Brain Mapping, 31(9), 1446–1457. 10.1002/hbm.20948 [DOI] [PMC free article] [PubMed] [Google Scholar]
- De Vico Fallani, F. , Nicosia, V. , Sinatra, R. , Astolfi, L. , Cincotti, F. , Mattia, D. , & Babiloni, F. (2010). Defecting or not defecting: How to “read” human behavior during cooperative games by EEG measurements. PLoS One, 5(12), e14187. [DOI] [PMC free article] [PubMed] [Google Scholar]
- Dikker, S. , Silbert, L. J. , Hasson, U. , & Zevin, J. D. (2014). On the same wavelength: Predictable language enhances speaker–listener brain‐to‐brain synchrony in posterior superior temporal gyrus. The Journal of Neuroscience, 34(18), 6267–6272. [DOI] [PMC free article] [PubMed] [Google Scholar]
- Dimberg, U. , & Thunberg, M. (1998). Rapid facial reactions to emotional facial expressions. Scandinavian Journal of Psychology, 39(1), 39–45. 10.1111/1467-9450.00054 [DOI] [PubMed] [Google Scholar]
- Gallese, V. (2003). The roots of empathy: The shared manifold hypothesis and the neural basis of intersubjectivity. Psychopathology, 36(4), 171–180. [DOI] [PubMed] [Google Scholar]
- Glerean, E. , Salmi, J. , Lahnakoski, J. , Jääskeläinen, I. , & Sams, M. (2012). FMRImaging phase synchronization as a measure of dynamic functional connectivity. Brain Connectivity, 2(2), 91–101. 10.1089/brain.2011.0068 [DOI] [PMC free article] [PubMed] [Google Scholar]
- Hari, R. , Henriksson, L. , Malinen, S. , & Parkkonen, L. (2015). Centrality of social interaction in human brain function. Neuron, 88(1), 181–193. 10.1016/j.neuron.2015.09.022 [DOI] [PubMed] [Google Scholar]
- Hasson, U. , Nir, Y. , Levy, I. , Fuhrmann, G. , & Malach, R. (2004). Intersubject synchronization of cortical activity during natural vision. Science, 303(5664), 1634–1640. 10.1126/science.1089506 [DOI] [PubMed] [Google Scholar]
- Hatfield, E. , Cacioppo, J. , & Rapson, R. (1993). Emotional contagion. Current Directions in Psychological Science, 2(3), 96–100. 10.1111/1467-8721.ep10770953 [DOI] [Google Scholar]
- Heller, R. , Golland, Y. , Malach, R. , & Benjamini, Y. (2007). Conjunction group analysis: An alternative to mixed/random effect analysis. NeuroImage, 37(4), 1178–1185. 10.1016/j.neuroimage.2007.05.051 [DOI] [PubMed] [Google Scholar]
- Hove, M. , & Risen, J. (2009). It's all in the timing: Interpersonal synchrony increases affiliation. Social Cognition, 27(6), 949–960. 10.1521/soco.2009.27.6.949 [DOI] [Google Scholar]
- Jääskeläinen, I. , Koskentalo, K. , Balk, M. , Autti, T. , Kauramäki, J. , Pomren, C. , & Sams, M. (2008). Inter‐subject synchronization of prefrontal cortex hemodynamic activity during natural viewing. Open Neuroimaging Journal, 2, 14–19. 10.2174/1874440000802010014 [DOI] [PMC free article] [PubMed] [Google Scholar]
- Jabbi, M. , Swart, M. , & Keysers, C. (2007). Empathy for positive and negative emotions in the gustatory cortex. NeuroImage, 34(4), 1744–1753. 10.1016/j.neuroimage.2006.10.032 [DOI] [PubMed] [Google Scholar]
- Jackson, P. , Meltzoff, A. , & Decety, J. (2005). How do we perceive the pain of others? A window into the neural processes involved in empathy. NeuroImage, 24(3), 771–779. 10.1016/j.neuroimage.2004.09.006 [DOI] [PubMed] [Google Scholar]
- Jenkinson, M. , Bannister, P. , Brady, M. , & Smith, S. (2002). Improved optimization for the robust and accurate linear registration and motion correction of brain images. NeuroImage, 17(2), 825–841. 10.1016/S1053-8119(02)91132-8 [DOI] [PubMed] [Google Scholar]
- Karjalainen, T. , Karlsson, H. K. , Lahnakoski, J. M. , Glerean, E. , Nuutila, P. , Jääskeläinen, I. P. , … Nummenmaa, L. (2017). Dissociable roles of cerebral μ‐opioid and type 2 dopamine receptors in vicarious pain: A combined PET–fMRI study. Cerebral Cortex, 27, 4257–4266. [DOI] [PubMed] [Google Scholar]
- Karjalainen, T. , Seppälä, K. , Glerean, E. , Karlsson, H. K. , Lahnakoski, J. M. , Nuutila, P. , … Nummenmaa, L. (2019). Opioidergic regulation of emotional arousal: A combined PET–fMRI study. Cerebral Cortex, 10.1093/cercor/bhy281. [DOI] [PubMed] [Google Scholar]
- Kober, H. , Barrett, L. , Joseph, J. , Bliss‐Moreau, E. , Lindquist, K. , & Wager, T. (2008). Functional grouping and cortical‐subcortical interactions in emotion: A meta‐analysis of neuroimaging studies. NeuroImage, 42(2), 998–1031. 10.1016/j.neuroimage.2008.03.059 [DOI] [PMC free article] [PubMed] [Google Scholar]
- Konvalinka, I. , Xygalatas, D. , Bulbulia, J. , Schjødt, U. , Jegindø, E. , Wallot, S. , … Roepstorff, A. (2011). Synchronized arousal between performers and related spectators in a fire‐walking ritual. Proceedings of the National Academy of Sciences of the United States of America, 10(20), 8514–8519. 10.1073/pnas.1016955108 [DOI] [PMC free article] [PubMed] [Google Scholar]
- Lahnakoski, J. , Glerean, E. , Salmi, J. , Jääskeläinen, I. , Sams, M. , Hari, R. , & Nummenmaa, L. (2012). Naturalistic FMRI mapping reveals superior temporal sulcus as the hub for the distributed brain network for social perception. Frontiers in Human Neuroscience, 6 (August), 233–233. 10.3389/fnhum.2012.00233 [DOI] [PMC free article] [PubMed] [Google Scholar]
- Lakin, J. L. , Jefferis, V. E. , Cheng, C. M. , & Chartrand, T. L. (2003). The chameleon effect as social glue: Evidence for the evolutionary significance of nonconscious mimicry. Journal of Nonverbal Behavior, 27(1), 145–162. [Google Scholar]
- Lazar, N. A. (2008). The statistical analysis of functional MRI data. New York, NY: Springer. [Google Scholar]
- Malinen, S. , Hlushchuk, Y. , & Hari, R. (2007). Towards natural stimulation in fMRI‐issues of data analysis. NeuroImage, 35(1), 131–139. 10.1016/j.neuroimage.2006.11.015 [DOI] [PubMed] [Google Scholar]
- Manninen, S. , Tuominen, L. , Dunbar, R. I. M. , Karjalainen, T. , Hirvonen, J. , Arponen, E. , … Nummenmaa, L. (2017). Social laughter triggers endogenous opioid release in humans. The Journal of Neuroscience, 37, 6125–6131. [DOI] [PMC free article] [PubMed] [Google Scholar]
- Mar, R. (2011). The neural bases of social cognition and story comprehension. Annual Review of Psychology, 62, 103–134. 10.1146/annurev-psych-120709-145406 [DOI] [PubMed] [Google Scholar]
- Miles, L. , Nind, L. , & Macrae, C. (2009). The rhythm of rapport: Interpersonal synchrony and social perception. Journal of Experimental Social Psychology, 45(3), 585–589. 10.1016/j.jesp.2009.02.002 [DOI] [Google Scholar]
- Northoff, G. , Heinzel, A. , de Greck, M. , Bermpohl, F. , Dobrowolny, H. , & Panksepp, J. (2006). Self‐referential processing in our brain‐a meta‐analysis of imaging studies on the self. NeuroImage, 31(1), 440–457. 10.1016/j.neuroimage.2005.12.002 [DOI] [PubMed] [Google Scholar]
- Nummenmaa, L. , & Calder, A. J. (2009). Neural mechanisms of social attention. Trends in Cognitive Sciences, 13, 135–143. [DOI] [PubMed] [Google Scholar]
- Nummenmaa, L. , Glerean, E. , Hari, R. , & Hietanen, J. (2014). Bodily maps of emotions. Proceedings of the National Academy of Sciences of the United States of America, 111(2), 646–651. 10.1073/pnas.1321664111 [DOI] [PMC free article] [PubMed] [Google Scholar]
- Nummenmaa, L. , Glerean, E. , Viinikainen, M. , Jaaskelainen, I. , Hari, R. , & Sams, M. (2012). Emotions promote social interaction by synchronizing brain activity across individuals. Proceedings of the National Academy of Sciences of the United States of America, 109(24), 9599–9604. 10.1073/pnas.1206095109 [DOI] [PMC free article] [PubMed] [Google Scholar]
- Nummenmaa, L. , Hari, R. , Hietanen, J. K. , & Glerean, E. (2018). Maps of subjective feelings. Proceedings of the National Academy of Sciences of the United States of America, 115, 9198–9203. [DOI] [PMC free article] [PubMed] [Google Scholar]
- Nummenmaa, L. , Lahnakoski, J. M. , & Glerean, E. (2018). Sharing the social world via intersubject neural synchronisation. Current Opinion in Psychology, 24, 7–14. 10.1016/j.copsyc.2018.02.021 [DOI] [PubMed] [Google Scholar]
- Nummenmaa, L. , Saarimäki, H. , Glerean, E. , Gotsopoulos, A. , Jääskeläinen, I. , Hari, R. , & Sams, M. (2014). Emotional speech synchronizes brains across listeners and engages large‐scale dynamic brain networks. NeuroImage, 102(P2), 498–509. 10.1016/j.neuroimage.2014.07.063 [DOI] [PMC free article] [PubMed] [Google Scholar]
- Nummenmaa, L. , Smirnov, D. , Lahnakoski, J. , Glerean, E. , Jääskeläinen, I. , Sams, M. , & Hari, R. (2014). Mental action simulation synchronizes action‐observation circuits across individuals. The Journal of Neuroscience, 34(3), 748–757. 10.1523/JNEUROSCI.0352-13.2014 [DOI] [PMC free article] [PubMed] [Google Scholar]
- Pajula, J. , & Tohka, J. (2014). Effects of spatial smoothing on inter‐subject correlation based analysis of fMRI. Magnetic Resonance Imaging, 32, 1114–1124. [DOI] [PubMed] [Google Scholar]
- Pedersen, M. , Omidvarnia, A. , Zalesky, A. , & Jackson, G. D. (2018). On the relationship between instantaneous phase synchrony and correlation‐based sliding windows for time‐resolved fMRI connectivity analysis. NeuroImage, 181, 85–94. [DOI] [PubMed] [Google Scholar]
- Phan, K. , Wager, T. , Taylor, S. , & Liberzon, I. (2002). Functional neuroanatomy of emotion: A meta‐analysis of emotion activation studies in PET and fMRI. NeuroImage, 16(2), 331–348. 10.1006/nimg.2002.1087 [DOI] [PubMed] [Google Scholar]
- Politis, D. N. , & Romano, J. P. (1992). Exploring the limits of bootstrap In LePage R. & Billard L. (Eds.), A circular block‐resampling procedure for stationary data (pp. 263–270). Hoboken, NJ: Wiley‐Interscience. [Google Scholar]
- Power, J. , Mitra, A. , Laumann, T. , Snyder, A. , Schlaggar, B. , & Petersen, S. (2014). Methods to detect, characterize, and remove motion artifact in resting state fMRI. NeuroImage, 84, 320–341. 10.1016/j.neuroimage.2013.08.048 [DOI] [PMC free article] [PubMed] [Google Scholar]
- Saarela, M. , Hlushchuk, Y. , Williams, A. , Schürmann, M. , Kalso, E. , & Hari, R. (2007). The compassionate brain: Humans detect intensity of pain from another's face. Cerebral Cortex, 17(1), 230–237. 10.1093/cercor/bhj141 [DOI] [PubMed] [Google Scholar]
- Saarimäki, H. , Ejtehadian, L. F. , Glerean, E. , Jaaskelainen, I. P. , Vuilleumier, P. , Sams, M. , & Nummenmaa, L. (2018). Distributed affective space represents multiple emotion categories across the human brain. Social Cognitive and Affective Neuroscience, 13, 471–482. 10.1093/scan/nsy018 [DOI] [PMC free article] [PubMed] [Google Scholar]
- Saarimäki, H. , Gotsopoulos, A. , Jääskeläinen, I. , Lampinen, J. , Vuilleumier, P. , Hari, R. , … Nummenmaa, L. (2016). Discrete neural signatures of basic emotions. Cerebral Cortex, 26(6), 2563–2573. 10.1093/cercor/bhv086 [DOI] [PubMed] [Google Scholar]
- Sander, D. , Grafman, J. , & Zalla, T. (2003). The human amygdala: An evolved system for relevance detection. Reviews in the Neurosciences, 14(4), 303–316. 10.1515/REVNEURO.2003.14.4.303 [DOI] [PubMed] [Google Scholar]
- Särkkä, S. , Solin, A. , Nummenmaa, A. , Vehtari, A. , Auranen, T. , Vanni, S. , & Lin, F. (2012). Dynamic retrospective filtering of physiological noise in BOLD fMRI: DRIFTER. NeuroImage, 60(2), 1517–1527. 10.1016/j.neuroimage.2012.01.067 [DOI] [PMC free article] [PubMed] [Google Scholar]
- Schippers, M. , Roebroeck, A. , Renken, R. , Nanetti, L. , & Keysers, C. (2010). Mapping the information flow from one brain to another during gestural communication. Proceedings of the National Academy of Sciences of the United States of America, 107(20), 9388–9393. 10.1073/pnas.1001791107 [DOI] [PMC free article] [PubMed] [Google Scholar]
- Singer, T. , Seymour, B. , O'Doherty, J. , Dolan, R. , Kaube, H. , & Frith, C. (2004). Empathy for pain involves the affective but not sensory components of pain. Science, 303(5661), 1157–1162. 10.1126/science.1093535 [DOI] [PubMed] [Google Scholar]
- Smirnov, D. , Glerean, E. , Lahnakoski, J. , Salmi, J. , Jääskeläinen, I. , Sams, M. , & Nummenmaa, L. (2014). Fronto‐parietal network supports context‐dependent speech comprehension. Neuropsychologia, 64, 293–303. 10.1016/j.neuropsychologia.2014.09.007 [DOI] [PMC free article] [PubMed] [Google Scholar]
- Smith, S. (2002). Fast robust automated brain extraction. Human Brain Mapping, 17(3), 143–155. 10.1002/hbm.10062 [DOI] [PMC free article] [PubMed] [Google Scholar]
- Stephens, G. , Silbert, L. , & Hasson, U. (2010). Speaker‐listener neural coupling underlies successful communication. Proceedings of the National Academy of Sciences of the United States of America, 107(32), 14425–14430. 10.1073/pnas.1008662107 [DOI] [PMC free article] [PubMed] [Google Scholar]
- Stolk, A. , Verhagen, L. , & Toni, I. (2016). Conceptual alignment: How brains achieve mutual understanding. Trends in Cognitive Sciences, 20(3), 180–191. [DOI] [PubMed] [Google Scholar]
- Tarr, B. , Launay, J. , & Dunbar, R. I. M. (2016). Silent disco: Dancing in synchrony leads to elevated pain thresholds and social closeness. Evolution and Human Behavior, 37(5), 343–349. 10.1016/j.evolhumbehav.2016.02.004 [DOI] [PMC free article] [PubMed] [Google Scholar]
- van Baaren, R. , Holland, R. , Kawakami, K. , & van Knippenberg, A. (2004). Mimicry and prosocial behavior. Psychological Science, 15(1), 71–74. 10.1111/j.0963-7214.2004.01501012.x [DOI] [PubMed] [Google Scholar]
- Volynets, S. , Glerean, E. , Hietanen, J. K. , Hari, R. , & Nummenmaa, L. (2019). Bodily maps of emotions are culturally universal. Emotion. 10.1037/emo0000624. [DOI] [PubMed] [Google Scholar]
- Vrana, S. , & Lang, P. (1990). Fear imagery and the startle‐probe reflex. Journal of Abnormal Psychology, 99(2), 189–197. 10.1037/0021-843X.99.2.189 [DOI] [PubMed] [Google Scholar]
- Vuilleumier, P. (2005). How brains beware: Neural mechanisms of emotional attention. Trends in Cognitive Sciences, 9(12), 585–594. 10.1016/j.tics.2005.10.011 [DOI] [PubMed] [Google Scholar]
- Wallentin, M. , Nielsen, A. , Vuust, P. , Dohn, A. , Roepstorff, A. , & Lund, T. (2011). Amygdala and heart rate variability responses from listening to emotionally intense parts of a story. NeuroImage, 58(3), 963–973. 10.1016/j.neuroimage.2011.06.077 [DOI] [PubMed] [Google Scholar]
- Wicker, B. , Keysers, C. , Plailly, J. , Royet, J. , Gallese, V. , & Rizzolatti, G. (2003). Both of us disgusted in my insula: The common neural basis of seeing and feeling disgust. Neuron, 40(3), 655–664. 10.1016/S0896-6273(03)00679-2 [DOI] [PubMed] [Google Scholar]
- Wiltermuth, S. , & Heath, C. (2009). Synchrony and cooperation. Psychological Science, 20(1), 1–5. 10.1111/j.1467-9280.2008.02253.x [DOI] [PubMed] [Google Scholar]
Associated Data
This section collects any data citations, data availability statements, or supplementary materials included in this article.
Supplementary Materials
Appendix S1 Supporting Information
Figure S1 BOLD‐GLM activation associated with self‐reported valence and arousal for speakers and listeners. Warm and cold colors indicate activation and deactivation respectively, of brain regions in GLM. A) Activation during the story telling regardless of the emotional feelings. B) Activation during listening to the story regardless of the emotional feelings. C) Activation during the story telling associated with changes in arousal. D) Activation during the listening associated with changes in arousal. E) Activation during the story telling associated with changes in valence. F) Activation during the listening associated with changes in valence.
Figure S2 Regions where neural synchrony (ISPS) between speakers and listeners is stronger during emotional vs neutral narratives. Warm colors indicate regions where neural synchrony was higher during emotional stories. Cold colors indicate regions where neural synchrony was higher during neutral stories.
Data Availability Statement
The data that support the findings of this study are available from the corresponding author upon reasonable request.