

Abstract
There is growing evidence that rather than using a single brain imaging modality to study its association with physiological or symptomatic features, the field is paying more attention to fusion of multimodal information. However, most current multimodal fusion approaches that incorporate functional magnetic resonance imaging (fMRI) are restricted to second‐level 3D features, rather than the original 4D fMRI data. This trade‐off is that the valuable temporal information is not utilized during the fusion step. Here we are motivated to propose a novel approach called “parallel group ICA+ICA” that incorporates temporal fMRI information from group independent component analysis (GICA) into a parallel independent component analysis (ICA) framework, aiming to enable direct fusion of first‐level fMRI features with other modalities (e.g., structural MRI), which thus can detect linked functional network variability and structural covariations. Simulation results show that the proposed method yields accurate intermodality linkage detection regardless of whether it is strong or weak. When applied to real data, we identified one pair of significantly associated fMRI‐sMRI components that show group difference between schizophrenia and controls in both modalities, and this linkage can be replicated in an independent cohort. Finally, multiple cognitive domain scores can be predicted by the features identified in the linked component pair by our proposed method. We also show these multimodal brain features can predict multiple cognitive scores in an independent cohort. Overall, results demonstrate the ability of parallel GICA+ICA to estimate joint information from 4D and 3D data without discarding much of the available information up front, and the potential for using this approach to identify imaging biomarkers to study brain disorders.
Keywords: group independent component analysis, multimodal fusion, parallel independent component analysis, schizophrenia, subjects' variability, temporal information
1. INTRODUCTION
Magnetic resonance imaging (MRI) has provided remarkable new insights into the structure and function of human brain. Acquisition of multimodal MRI from the same subject has been widely adopted in brain imaging researches, as different modalities represent different perspectives of the brain functional, structural, or anatomical properties. Moreover, there is growing evidence suggesting that instead of using a single brain imaging modality to study the association with physiologic or pathological properties, researchers are paying more attention to fusion of multimodal information, a method that can take advantage of multiple imaging techniques, and to uncover the latent relationships that might be missed from single modality imaging analysis (Calhoun & Sui, 2016; Sui, Huster, Yu, Segall, & Calhoun, 2014; Zhang, et al., 2011). For instance, multimodal fusion can tell us how brain structure and function are impacted by psychopathology, and which structural or functional aspects of pathology could drive human behavior or cognition (Sui et al., 2014).
However, most current multimodal fusion approaches (including joint independent component analysis (jICA; Calhoun et al., 2006), multi‐set canonical correlation analysis (mCCA; Correa, Eichele, Adali, Li, & Calhoun, 2010), multiway partial least squares (N‐PLS; Martinez‐Montes, Valdes‐Sosa, Miwakeichi, Goldman, & Cohen, 2004), parallel ICA (pICA; Liu et al., 2009), parallel ICA with reference (pICAR; Chen et al., 2013), mCCA+jICA (Sui et al., 2011), mCCAR+jICA (Qi et al., 2016; Qi et al., 2018), and linked ICA (Groves, Beckmann, Smith, & Woolrich, 2011), and so on) are restricted to second‐level 3D fMRI features, for example, fractional amplitude of low frequency fluctuations (fALFF) or regional homogeneity (ReHo) for fMRI (subjects × imaging feature variables), rather than first‐level 4D imaging features (subjects × voxels × time points). The main reason for using second‐level features in multimodal fusion is to provide a simpler subspace in which to link the multimodal data (Calhoun & Adali, 2009). While this provides a powerful framework for capturing multimodal information, the trade‐off is that some essential information may be lost. For example, in fMRI related multimodal fusion analysis, the temporal dynamic information was not included in the above fusion methods.
It is well known that the temporal variation in fMRI signal conveys important information (Schmithorst & Holland, 2004). Reducing the 4D fMRI data to 3D spatial maps (nontemporal features) prior to the data fusion step does not allow the fusion process to utilize the temporal information. On the other hand, group ICA (GICA; Calhoun, Adali, Pearlson, & Pekar, 2001) is an approach that operates on first‐level 4D fMRI data for multiple subjects, which is able to extract both group and subject‐specific independent components (ICs) as well as their time courses. Although there are other ICA related method that can deal with fMRI, such as probabilistic ICA (Beckmann & Smith, 2004) and noisy ICA (Cichocki, Douglas, & Amari, 1998; Griffanti et al., 2017), GICA has demonstrated great potential to deal with multi‐subject fMRI data, so in this article our proposed method is based on GICA. GICA allows us to establish a correspondence of group ICs with subjects' ICs while fully leveraging the temporal information. In contrast, parallel ICA aims to simultaneously identify ICs of two modalities and the linkage between them by maximizing both intermodality correlation and intramodality independence. Building on the success of GICA to leverage temporal information as well as the flexible fusion framework of parallel ICA, we combine GICA and pICA in order to simultaneously analyze both first‐level fMRI and structural MRI (sMRI) features, with the purpose of identifying linked functional spatial network variability and structural covariations, while retaining the original desirable properties of both pICA and GICA. Therefore, we propose to extend the pICA method and link brain structure to first‐level functional MRI data via direct optimization of their associations, enabling us to reveal structural influence on coherent functional network variability.
Parallel GICA+ICA works by defining a variability matrix that measures the subject‐level variations between group and back‐reconstructed subject spatial maps within GICA, and maximizing the correlation of that measure with subject expression profiles from an ICA decomposition of a sMRI dataset. In order to achieve data fusion between structural (subjects × voxel‐wise gray matter [GM] volume values) and functional data (subjects × voxels × time points), a subject‐level summary feature that captures variability among subjects must be defined for fMRI, so that direct associations can be measured between both modalities. To that end, we note that the group‐level ICs from GICA capture spatial co‐activation patterns shared among all the subjects, each forming an independent brain network. In this sense, group ICs can be interpreted as a cohort common pattern representing a functional brain network template shared over all subjects. Therefore, it is worthwhile to examine how much the subject‐specific ICs deviate from the shared common pattern and whether this deviation may serve as a summarized fMRI feature, which associates with structural data (Chen et al., 2018). Based on this feature, a novel parallel GICA+ICA approach that leverages the first‐level temporal information from fMRI can be derived enabling the discovery of associations in the form of linked covariation between functional spatial network patterns and structural features. The key difference from pICA is that an intermediate subject‐level variability matrix (C1) is constructed for parallel GICA+ICA by calculating the L 2‐distance between group‐ and subject‐specific spatial component maps, capturing subject component variability from a group template. This variability matrix is then utilized to allow multimodal associations to directly influence the GICA and ICA estimation iteratively, hence leveraging the full temporal information of the fMRI as well as spatial variance (Figure 1). Another advantage of parallel GICA+ICA compared with current existing multimodal fusion methods is that it also enables functional network connectivity (FNC) analysis for fMRI after identification of sMRI links from the fusion analysis as well as other post analysis such as spectra and dynamic information (Hutchison et al., 2013) for fMRI.
Figure 1.
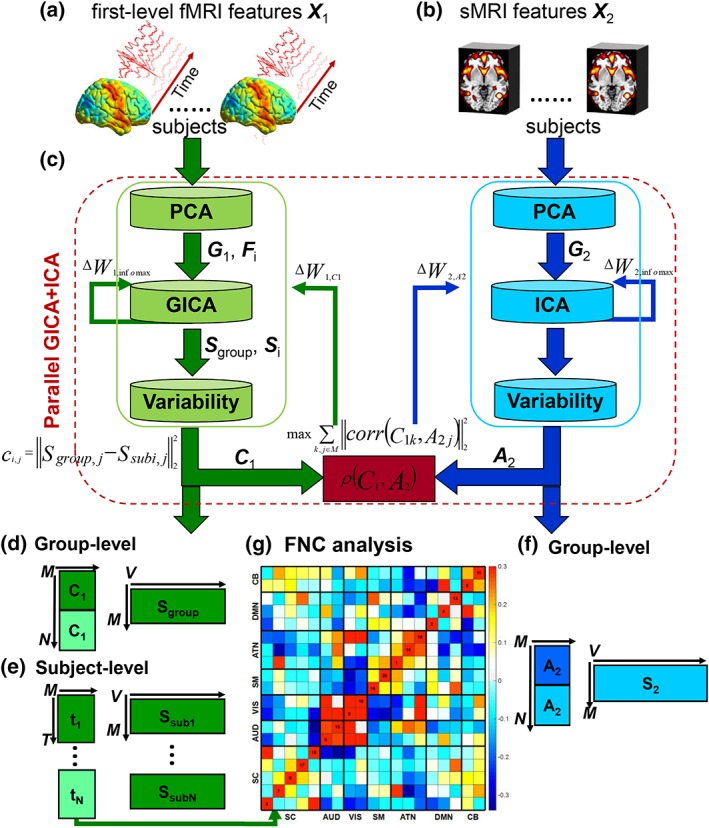
Flowchart of the proposed parallel GICA+ICA approach. (a) First‐level fMRI features (X1) from preprocessed fMRI data (e.g., preprocessed spatiotemporal fMRI data). (b) SMRI features (X2) from preprocessed sMRI data (e.g., voxelwise gray matter volume or concentration). (c) Parallel GICA+ICA, which includes maximizing the independence for both modalities based on GICA and ICA portions separately, as well as maximizing the correlation between the variability matrix from GICA of fMRI and subject expression profiles from ICA of sMRI. (d) Group‐level components and variability matrix obtained from GICA portion. (e) Subject‐level components and time courses obtained from GICA portion. (f) Group‐level components and subject expression profiles resulting from ICA portion. (g) Functional network connectivity (FNC) analysis for fMRI time courses. PCA: principal component analysis; GICA: group independent component analysis; Fi: dewhitening matrix from subject‐level PCA for fMRI; G1: dewhitening matrix from group‐level PCA for fMRI; G2: dewhitening matrix from group‐level PCA for sMRI; Sgroup, j: group components from GICA; Ssubi, j: subject‐specific components from GICA; C1: variability matrix calculated by the L2‐distance between group‐ and subject‐specific GICA spatial maps; A2: mixing matrix from sMRI, which also represents between‐subject variability. ΔW1, Infomax and ΔW2, Infomax are the gradient updates obtained from GICA and ICA portions, separately. ΔW1, C1 and ΔW2, A2 are the gradient updates obtained from the between‐modality linkage‐regularized optimization. Dark and light colors in the variability matrix in panels (d–f) represent two groups, for example, schizophrenia patients and healthy controls. GCIA, group independent component analysis; ICA, independent component analysis [Color figure can be viewed at http://wileyonlinelibrary.com]
In psychopathological studies, mounting evidence shows that schizophrenia (SZ) is associated with abnormal FNC between different brain networks, for example, visual, auditory and default mode networks (Friedman, Hastie, & Tibshirani, 2008). Based on the proposed method, we can perform FNC analysis to identify abnormal connections between brain networks that are also associated with structural covariation. In this article, we aim to apply the proposed method to identify linked functional network variability and structural covariations, and ultimately predict cognitive scores based on the identified linked fMRI‐sMRI features (GM volume). The Function Biomedical Informatics Research Network (fBIRN) phase III datasets (n = 311; Keator et al., 2016) were used as a discovery cohort and the Center for Biomedical Research Excellence dataset (Jorge Nocedal, 1999; COBRE, n = 177) were used as a replication cohort. Results show that the proposed method can extract linked fMRI‐sMRI components pair in both simulation and real human brain data, and this linkage can be replicated in an independent COBRE cohort. Moreover, the identified linked fMRI‐sMRI features can predict multiple cognitive scores of fBIRN cohort, which demonstrates the biomarker property of the multimodal features extracted by the proposed method. Furthermore, these identified linked fMRI‐sMRI features can also predict multiple cognitive scores of an independent COBRE cohort, demonstrating the ability of parallel GICA+ICA to identify potential biomarkers and the wide utility of the proposed method for the study of brain disorders.
2. METHODS AND MATERIALS
The main idea of parallel GICA+ICA is straightforward. As shown in Figure 1, in order to retain the temporal nature of fMRI, we define a new variability matrix (C1) to capture functional subject‐wise variability by calculating the L 2‐distance between group‐level ICs (Sgroup, j) and subject‐level ICs (Ssubi, j) (i = 1, 2, … , N, j = 1, 2, … , M, where N is subject number and M is component number), in correspondence to the subject expression profiles (A2) from sMRI. In addition to maximizing the independence of each component for each modality, a regularization term is added to simultaneously maximize the correlation between functional (C1) and structural (A2) between‐subject variabilities, as shown in Figure 1c.
2.1. Parallel group ICA+ICA
Assume that X1 = [x1; x2; … ; xN] is fMRI data that is concatenated over subjects in the temporal dimension, where X1 is in dimension of NT × V1, in which T is time point number, V1 represents voxel number, and xi is the T × V1 data matrix. First, principal component analysis (PCA) is performed on fMRI data (X1) for dimension reduction at subject‐ and group‐levels respectively. Let be the L × V1 dimension reduced data matrix of subject i, where is the L × T subject‐level whitening matrix (determined by subject‐level PCA decomposition) and L is the rank of the PCA decomposition. The temporal dimension reduced data are then concatenated over subjects in the temporal direction and a group‐level PCA is performed to further reduce the temporal dimension of the group data to the number of ICs M, as summarized in Equation (1).
| (1) |
where is the M × (N ∙ L) group‐level whitening matrix (determined by group‐level PCA), Z1 (M × V1) is the reduced data matrix for the fMRI modality.
After ICA decomposition, we can write Z1 = A1 ∙ Sgroup, where A1 is the M × M mixing matrix for fMRI and Sgroup is the M × V1 group‐level ICs. Substituting this equation for Z1 into Equation (1) and multiplying both sides by the group‐level dewhitening matrix G1, we have
| (2) |
The matrix G1 is partitioned by subject which provides the following expression
| (3) |
The equation for subject i by dealing only with the elements in partition i is as in Equation (4)
| (4) |
| (5) |
Ssubi includes spatial maps for subject i and is calculated from Equation (5). We now multiplying both sides of Equation (4) by the subject‐level dewhitening matrix Fi
| (6) |
which provides the ICA decomposition of xi from subject i. Ssubi (M × V1) contains M ICs and FiG1iA1 (N × M) is subject‐specific mixing matrix which contains the corresponding time course. This is the classic back‐reconstruction formula from GICA (Calhoun et al., 2001).
The between‐subject functional variability matrix C1 is defined as in Equation (7) below:
| (7) |
where W1 equals the inverse of mixing matrix A1.
Meanwhile, suppose that X2 (N × V2, N is subject number, V2 represents voxel number of sMRI) represents the sMRI data matrix, following the blind source separation theory, we can get Equation (8).
| (8) |
where G2 (N × M) is the dewhitening matrix for sMRI, A2 is the N × M mixing matrix for sMRI, S2 is the M × V2 ICs matrix.
Thus we can get the final cost function for the proposed method, parallel GICA+ICA, as in Equation (9):
| (9) |
where
| (10) |
| (11) |
And
| (12) |
where, Yi,ab and Ui,ab represent elements for matrix Yi and Ui, respectively, with row index |a| and column index |b|. H is the entropy and Corr is the correlation. k and j represent the selected constrained ICs in each maximization iteration. fy(Yl) is the probability density function of Yl. W10 and W20 represent the bias‐weight matrix for each modality. Although the cost function Equation (9) looks the same as pICA, we redefined a new variability matrix Equation (7) here for fMRI. This matrix estimates the degree to which the subject specific component deviates from the cohort‐common pattern, thus leads us to investigate whether this deviation may be associated with structural features. The first two terms in Equation (9) are solved in parallel using the infomax framework (Amari, 1998). The third term is optimized using the steepest descent method, and the step size is calculated at each iteration on the selected ICs. Finally, we obtain the update rules as following:
For the first term (major updates for W1):
| (13) |
For the second term (major updates for W2):
| (14) |
For the third term (minor updates for W1k and A2j):
| (15) |
where,
| (16) |
where, λcl is the learning rate for fMRI, sMRI, and ηl is the step size calculated at each step according to Wolfe conditions (Jorge Nocedal, 1999). The learning rate plays an important role in algorithm convergence and balance between the modalities, as well as determines the weights during the maximization process.
2.2. Simulation
Then we simulated fMRI and sMRI data to compare parallel GICA+ICA with separate GICA and ICA to access the capability to detect accurate intermodality linkage. Eight source maps were simulated using the simTB (Erhardt, Allen, Wei, Eichele, & Calhoun, 2012) for each modality, which can be freely downloaded at http://mialab.mrn.org/software. The simulated brain networks were used as true sources S1i (in dimension of 100 × 100) for fMRI, each has 100 time points, and S2 (in dimension of 150 × 150) for sMRI. TC matrix generated from simTB for fMRI is 100 × 8, mixing matrix A2 for sMRI was randomly constructed in a size of 100 × 8. Variability matrix C1 for fMRI is constructed by calculating the L2 norm between the group map and subject map, in which one column (the 1st and 6th column for C1 and A2) is carefully designed to be moderately (r = .28) or highly (r = 0.49) correlated. Therefore, a linear mixture of TCi ∙ S1i (A2 ∙ S2) will generate fMRI and sMRI data matrices of 100 samples with 10,000 and 22,500 voxels respectively. The observation matrix X2 for sMRI is generated according to X2 = I2 + N2 = A2S2 + N2 in which N2 is the added noise which contains 15 peak signal‐to‐noise ratios (PSNR) noise levels, I2 = A2S2 represents the simulated sMRI data without adding noise. Here, the PSNR level is calculated from Equation (17), which ranges from −10 to 17 dB. For fMRI, each xi is generated by xi = Ii + Ni = TCiS1i + Ni (i = 1, 2, … N). Here, for each specific PSNR, we randomly generated 10 same PSNR X2 and xi. Thus we can obtain the mean as well as the standard deviation of the intermodality linkage estimation.
| (17) |
2.3. Real human brain data
For real human brain data, we used subjects collected from the fBIRN (Keator et al., 2016) phase III study, including 149 SZ patients (37.9 ± 11.5) and 162 age‐gender matched HCs (37.0 ± 11.0). All participants are adults between 18 and 65 years old. The Structured Clinical Interview for DSM‐IV (SCID; First, 2002) was used to diagnose patients by doctors. Furthermore, current or past psychiatric disorder or having a first‐degree relative with an Axis‐I psychotic illness HCs were excluded. The cognitive performance for both SZ and HC were measured by the Computerized Multiphasic Interactive Neurocognitive System (CMINDS; van Erp et al., 2015). There is no significant age (p = .49) and gender (p = .23) difference between SZ and HC for the fBIRN cohort.
The COBRE cohort consists of 94 SZs (35.6 ± 13.1) and 83 age‐gender matched HCs (36.3 ± 12.5) and were assessed using a similar cognitive assessment battery, the Measurement and Treatment Research to Improve Cognition in Schizophrenia Consensus Cognitive Battery (MCCB; Green, Kern, & Heaton, 2004). Detailed cognitive information of fBIRN and COBRE subjects are presented in Supplementary Table SI and SII. There is also no significant age (p = .45) and gender (p = .91) difference for the COBRE cohort. Resting state functional MRI and structural MRI were obtained for both cohorts. Detailed imaging parameters and preprocessing steps can be found in Supplementary “Imaging parameters and preprocessing” section. Written informed consent was obtained from all participants under protocols approved by the Institutional Review Boards for both fBIRN and COBRE cohorts.
3. RESULTS
3.1. Simulation results
The proposed parallel GICA+ICA algorithm was compared with separate GICA and ICA on carefully designed simulated data. One important property is that whether the proposed method can detect the intermodality linkage of the target components accurately and significantly under both strong (r = .49) and weak (r = .28) intermodality associations. Figure 2a,b show the ability for estimating cross modality associations and corresponding significance for different fusion methods under 15 different noise levels with strong intermodality linkage. The green line in Figure 2b,d represents a significance level of p = .05. It is clear that the proposed method, parallel GICA+ICA (red), could detect more accurate intermodality linkage compared with separate GICA and ICA under strong real linkage. The estimation linkage accuracy trend goes down with high noise levels, which is also the same as in significance detection. Figure 2c,d show the boxplot of estimating intermodality associations and corresponding significance for different fusion methods under weak linkage. It is clear that parallel GICA+ICA outperforms separate GICA and ICA for weak linkage detection. More importantly, the association estimation of separate GICA and ICA decreases remarkably when the real correlation is weak (r = .28), when compared with Figure 2a,c, demonstrating the advantage of the proposed method in estimating association with weak linkage, the likely situation in real data. So collectively, the above results show that the proposed method provides more accurate detection of the intermodality associations for both strong and weak links, and importantly, the fusion approach does not appear to inflate the multimodal links artificially.
Figure 2.
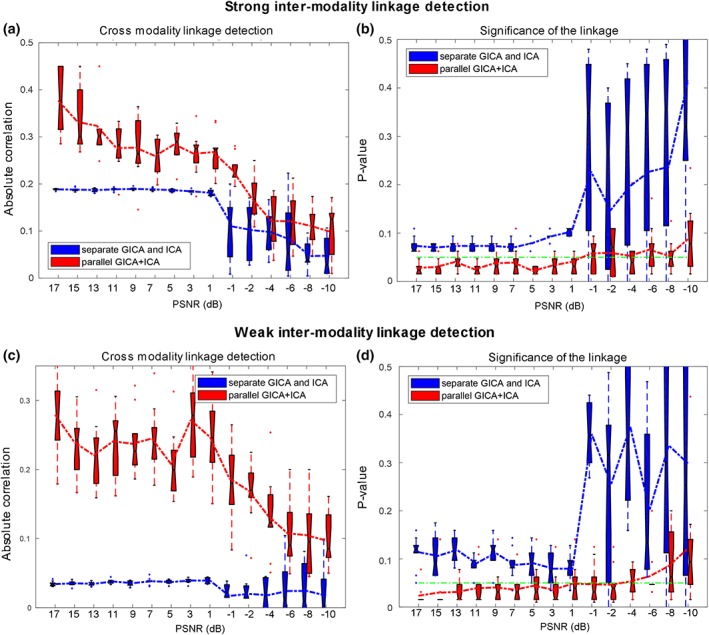
Comparison of parallel GICA+ICA (red) with separate GICA and ICA (blue) in a simulated two‐way data fusion. (a,b) Cross modality linkage detection under strong association (r = .49) and the corresponding significance p value. (c,d) Cross modality linkage detection under weak association (r = .28) and the corresponding significance p value. The green lines in (b) and (d) represent p = .05. These results show that, compared with separate GICA and ICA without fusion, parallel GICA+ICA yields more accurate (and significant) intermodality associations regardless of whether the association is strong or weak, that is, it improves the estimation of existing links while not inflating the link artificially. GICA, group independent component analysis; ICA, independent component analysis [Color figure can be viewed at http://wileyonlinelibrary.com]
Besides the linkage estimation, we also compared the source and mixing matrix (or variability matrix) estimation averaged over all components, as shown in Figure 3. The estimation accuracy is defined as the correlation between the true mixing matrices/source(s) and the estimated mixing matrices/component(s). It is clear that parallel GICA+ICA can achieve high estimation accuracy of subject variability within the fMRI modality (Figure 3a), and comparable estimation accuracy for structural mixing matrix and source, and also the subject specific functional source. Finally, the estimation accuracy for different IC numbers to extract modality linkage (under strong linkage, r = .49) between target ICs is presented in Figure 4. It is evident that parallel GICA+ICA out performs separate GICA and ICA in intermodality linkage estimation.
Figure 3.
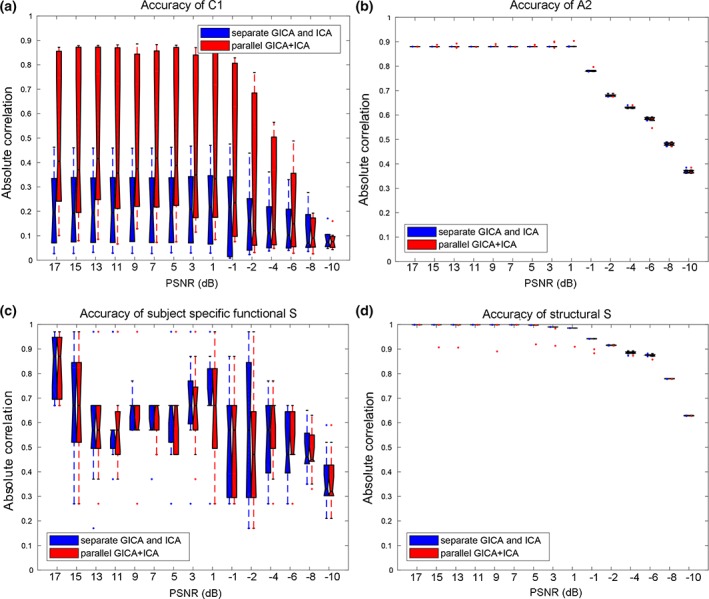
Estimation accuracy comparison for all the ICs under 15 levels noise between parallel GICA+ICA (red) and separate GICA and ICA (blue). Results show that parallel GICA+ICA can achieve comparable estimation accuracy for both source and variability matrix. GCIA, group independent component analysis; ICA, independent component analysis [Color figure can be viewed at http://wileyonlinelibrary.com]
Figure 4.
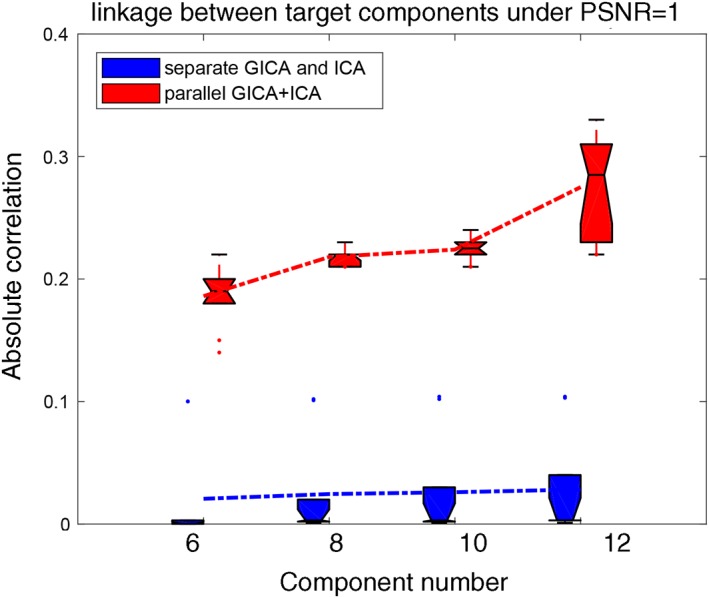
Comparison of inter modality linkage estimation when using different IC number M. The simulated true IC number = 8. Here we tested M that varies from 6 to 12. Parallel GICA+ICA outperforms separate GICA and ICA with regard to the inter modality linkage detection. GICA, group independent component analysis; ICA, independent component analysis [Color figure can be viewed at http://wileyonlinelibrary.com]
When determining the value of λci and ηi in Equations 13, 14, 15, 16) that control the weight between the independence constraint and the association constraint, we tune them adaptively. The criteria is that when the maximum value in Wi is bigger than the predefined weight maximum (1.0 × 10⁸), then λci(ηi) was update as λci(ηi) = 0.95 ∙ λci(ηi) to avoid the blown up of Wi. This means that keeping the independence among components is always the first aim, the second is to maximize the cross modality correlation simultaneously.
3.2. Results of real human brain data
3.2.1. Linked components pair
We also applied the proposed approach on fBIRN multimodal datasets including 311 subjects (162 HCs, 149 SZs). The original preprocessed TCs ×voxels from resting‐state fMRI, GM volume from sMRI were extracted and combined by parallel GICA+ICA to identify associated fMRI‐sMRI components. The subject‐level component was 50, which needs to be higher than the group level (Erhardt et al., 2011), and the group‐level component was 20 based on MDL (Li, Adali, & Calhoun, 2007) criterion for fMRI modality. Then two‐sample t‐tests was performed on the mixing coefficients as well as the variability loadings of each IC for each modality to compare patients and controls.
Among the 20 derived ICs, the 3rd IC of fMRI, the 19th and the 3rd IC of sMRI were found to be the linked components pair (r = .24, p = 2.6e−05* between fMRI_IC3 and sMRI_IC19). * means FDR corrected for multiple comparisons. Note that this association still exist even after regressing out diagnosis (r = .21, p = .0002*). The mixing coefficients (or variability loadings) of the paired components show significant group difference (p = 7.0e−06*, p = .01) for fMRI_IC3 and sMRI_IC19. Figure 5a shows the Z‐scored brain maps (visualized at |Z| > 2), Figure 5b presents the group difference of variability loadings for each modality, as well as the correlation between variability loadings and cognitive scores. So the red brain regions in sMRI denote a higher weights in HCs than SZs and the blue brain areas are opposite. While for fMRI component, the red regions indicate a higher variability compared with fMRI_IC3 in HCs than SZs and the blue regions are opposite. More importantly, this linkage can be replicated in independent cohort (COBRE), details can be found in Supplementary “Linkage replication” section.
Figure 5.
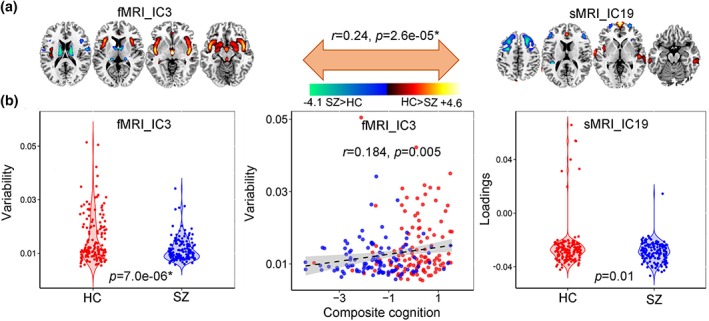
Linked components pair that indicate significant group differences in both fMRI and sMRI. (a) The brain maps of the identified linked component pair visualized at |Z| > 2. (b) Group difference of the loadings for linked IC pair, and correlation between variability loadings of fMRI_IC3 and the CMINDS composite cognitive scores [Color figure can be viewed at http://wileyonlinelibrary.com]
In addition, we found that fMRI_IC3 also correlated with sMRI_IC3 (r = .14, p = .01; r = .12, p = .051 after regressing out diagnosis). Significant group difference (p = .001*) exist for the variability loadings of sMRI_IC3, which is also positively correlated with speed of processing (r = .349, p = 4.3e−08*), working memory (r = .344, p = 6.1e−08*), visual learning (r = .336, p = 1.5e−07*), verbal learning (r = .337, p = 1.5e−07*), and composite cognitive scores (r = .30, p = 4.1e−06*), as displayed in Figure 6. The well‐replicated reduced GM volume in anterior cingulate cortex and insular in schizophrenia are observed in sMRI_IC3. Note that after regressing out group label, the correlation between loadings of sMRI_IC3 and cognitive scores still remain significant. Details are presented in Supplementary “Regression out diagnosis” section.
Figure 6.
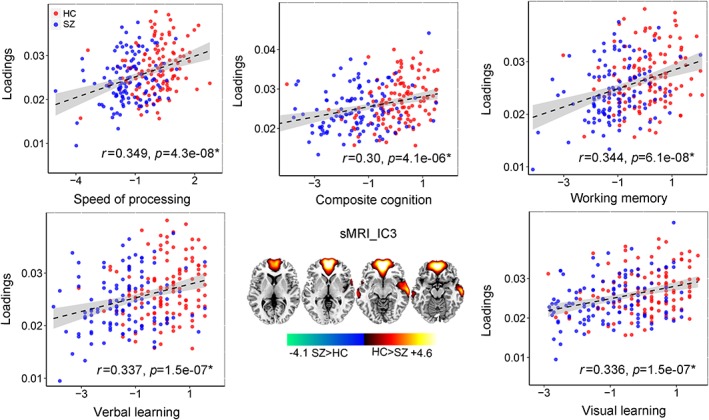
Correlation between loadings of sMRI_IC3 and multiple CMINDS cognitive domains [Color figure can be viewed at http://wileyonlinelibrary.com]
3.2.2. Modality specific group‐discriminative IC
Apart from the linked components pair, we also identified one fMRI component IC16 (Figure 7) containing the left attention network that shows marginal group difference (p = .045), and the corresponding variability loadings is negatively correlated with attention subdomain (r = −.132, p = .045). More importantly, the time courses of fMRI_IC16 were also anti‐correlated with attention scores (r = −.187, p = .004).
Figure 7.
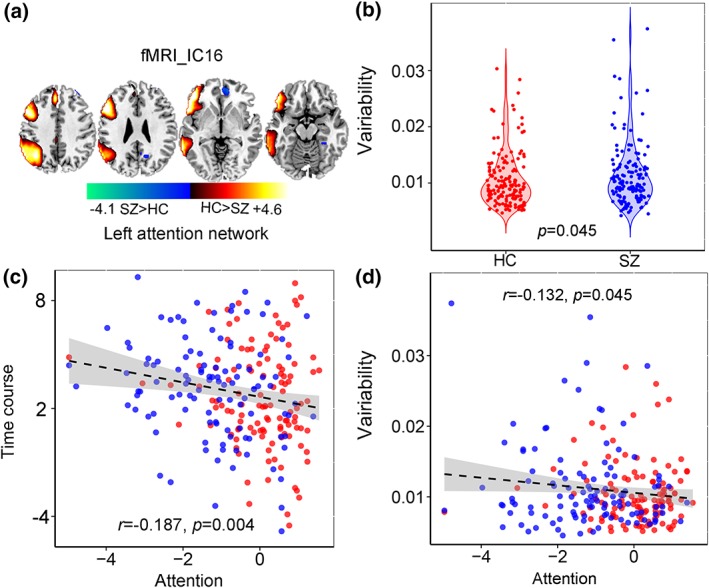
Modality specific and group discriminative left attention network in fMRI_IC16. (a) The brain maps visualized at |Z| > 2. (b) Group difference of the loadings for fMRI_IC16. (c) Correlations between time courses of fMRI_IC16 and the CMINDS attention scores (HC: red dots, SZ: blue dots. (d) Correlations between variability loadings of fMRI_IC16 and the CMINDS attention scores [Color figure can be viewed at http://wileyonlinelibrary.com]
3.2.3. FNC analysis
One of the advantages of the proposed method compared with other fusion methods is that after the fusion analysis, we can also perform FNC analysis using time courses of the corresponding components. Collectively, 19 components were selected from 20 components, with one artefactual component excluded (Du et al., 2016). Figure 8a,b shows the mean FNC matrix for HCs and SZs. The black lines partition the FNC matrix into the 7 categories: visual (VIS), default‐mode network (DMN), auditory (AUD), attention network (ATN), sensorimotor (SM), cerebellar (CB), and sub‐cortical (SC). We also compared the group difference of FNC matrix between HCs and SZs. Values in FNC matrix are calculated as −log10(p) × sign(t). Results show that the AUD‐VIS, AUD‐ATN, DMN‐SC are group discriminating FNCs when p was thresholded as p < .01, while the AUD‐VIS still remains significant group difference when p was thresholded as p < .0001 (FDR corrected).
Figure 8.
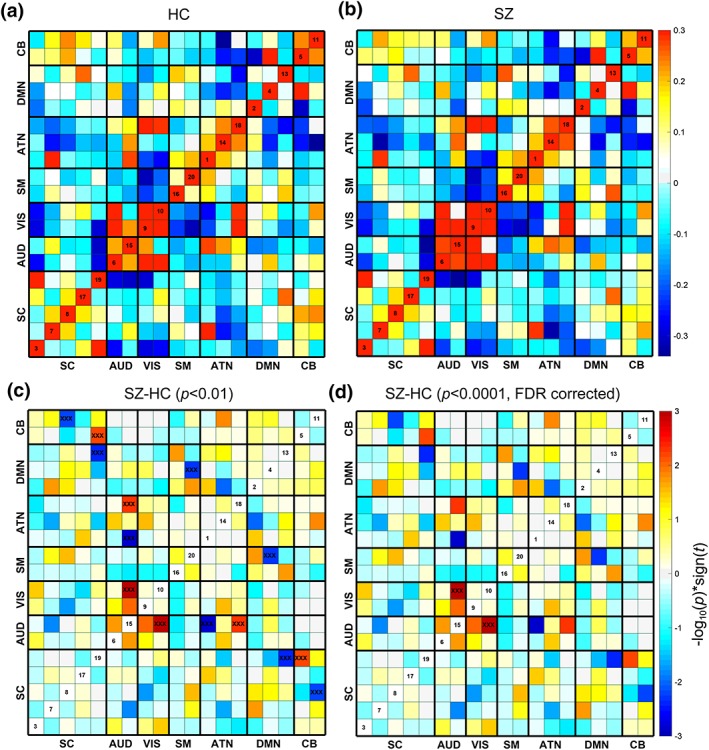
FNC analysis based on the fMRI results from parallel GICA+ICA. Mean FNC matrix for HCs (a) and SZs (b). (c,d) The group difference (SZ–HC) in FNC [Color figure can be viewed at http://wileyonlinelibrary.com]
3.2.4. Predicting ability
An ultimate goal of using imaging biomarkers is whether these identified imaging features is predictive on cognition or symptoms (Gabrieli, Ghosh, & Whitfield‐Gabrieli, 2015; Meng et al., 2016). To verify the predictability of the identified linked multimodal brain features by our proposed method, we used the extracted linked components ROIs (mean time courses in positive and negative brain networks in fMRI_IC3, and positive and negative brain networks in sMRI_IC19 and sMRI_IC3, details can be found in Supplementary “Predictive biomarker extraction” section) to predict multiple CMINDS cognitive scores. Based on the following Equation (18), a multiple linear regression for the cognitive scores was performed.
| (18) |
The predictive accuracy is measured by correlation between the estimated cognitive scores and its true values, as well as the normalized root mean squared prediction error (NRMSE; https://en.wikipedia.org/wiki/Root-mean-square_deviation). Multiple cognitive domain prediction results are shown in Figure 9. The five features identified based on the proposed parallel GICA+ICA were able to predict working memory (r = .266, p = 4.5e−05; NRMSE = 0.19), verbal learning (r = .254, p = 8.0e−05; NRMSE = 0.21), and composite cognitive scores (r = .261, p = 6.7e−05; NRMSE = 0.15). More importantly, after regressing out diagnosis, the prediction still keeps significant for verbal learning (r = .157, p = .016) and composite cognitive domains (r = .15, p = .02), demonstrating the effectiveness of the proposed method in identifying linked multimodal biomarkers associated with brain disorders. Note that comparing with the prediction in Figure 9, only using imaging features without the time course information the prediction analysis was lower or not significant (r = .17, p = .008 for working memory; r = .20, p = .001 for verbal learning; r = .11, p = .08 for composite), likely due to the availability of the temporal information throughout the estimation process, again highlighting a benefit of our proposed method.
Figure 9.
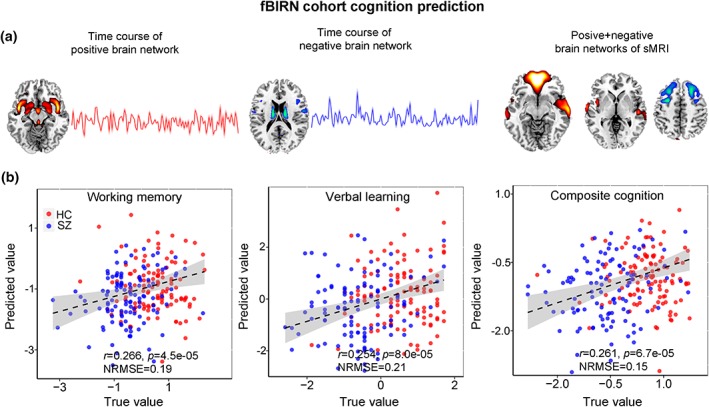
The identified linked fMRI‐sMRI biomarkers and prediction results on multiple cognitive and symptom scores of fBIRN cohort. Five modality‐specific time courses and brain networks (a) were used as regressors in the multiple linear regression models to predict cognitive scores (b) [Color figure can be viewed at http://wileyonlinelibrary.com]
To test the predictability of the extracted five linked multimodal features by the proposed method on new unseen dataset, we then extracted the brain features in COBRE cohort through fBIRN identified masks and predict an independent cohort (COBRE)‘s multiple MCCB cognitive scores for working memory (r = .235, p = .001; NRMSE = 0.15), verbal learning (r = .25, p = 8.5e−04; NRMSE = 0.17), and composite cognitive scores (r = .256, p = 9.2e−04; NRMSE = 0.18), as displayed in Figure 10. Note that MCCB and CMINDS are similar but not identical cognition assessment batteries (van Erp et al., 2015); hence, the cross‐cohort prediction is a strong evidence to demonstrate the predictability of the identified multimodal features detected by parallel GICA+ICA. Furthermore, after regressing out diagnosis, the prediction still keeps significant, details are presented in Supplementary “Regression out diagnosis” section.
Figure 10.
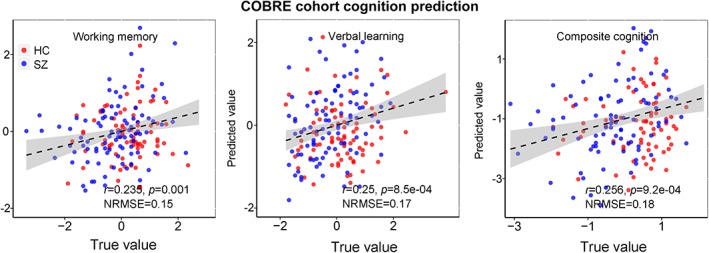
Prediction of multiple cognitive scores of COBRE cohort based on the identified multimodal features in the linked components pair by pGICA+ICA in fBIRN cohort [Color figure can be viewed at http://wileyonlinelibrary.com]
4. DISCUSSION AND CONCLUSION
In this article, we proposed a novel temporal information included parallel GICA+ICA, by adding a constraint that maximize the correlation between two variability matrices from fMRI and sMRI, aiming to extract the associated functional network variability with sMRI covariations. Compared with traditional multimodal fusion methods (mCCA, jICA, pICA, pICAR, mCCA+jICA, MCCAR+jICA, linked ICA), parallel GICA+ICA can deal with first‐level features (temporal information included) in fMRI related fusion analysis. Another advantage is that we can also perform FNC analysis based on the fMRI results of parallel GICA+ICA. To the best of our knowledge, this is the first established method to incorporate temporal information in multimodal fusion analysis, which provides a new perspective to interpret interrelated patterns between functional network variability and co‐varied structural measures.
In simulations, we compared parallel GICA+ICA with separate GICA and ICA on the performance of detecting linked fMRI‐sMRI components. Our results indicate that parallel GICA+ICA provides more accurate detection of intermodality linkage regardless of whether it's strong or weak, which means that it does not inflate the link artificially as well as achieves comparable accuracy on both source maps and mixing coefficients. More importantly, the association estimation of separate GICA and ICA decreases remarkably when the real correlation is weak (r = .28) compared with parallel GICA+ICA, as shown in Figure 2c,d, demonstrating the advantages of the proposed method in estimating association with weak linkage, which is always the case in real data.
In the real multimodal brain imaging fusion application, we combined data from gray matter volume and brain function from SZ patients and HCs. One linked component pair (fMRI_IC3‐sMRI_IC19) was identified that show significant group difference between SZ and HC. More importantly, this linkage can be replicated in independent cohort. Subcortical regions including bilateral insular, striatum, thalamus, and hippocampus are identified in the linked fMRI_IC3. These regions have been widely reported as dysfunctional brain areas in SZ (Friedman et al., 2008), and also associate with cognitive deficits in SZ (Bush, Valera, & Seidman, 2005; Glahn et al., 2005). SMRI_IC3 is correlated with several cognitive domains, which is consistent with the prefrontal cortex detected in sMRI in our results being involved in multiple high‐order cognitive functions including manipulating and maintaining information in problem solving (Minzenberg, Laird, Thelen, Carter, & Glahn, 2009), working memory (Aleman, Hijman, De Haan, & Kahn, 1999; Potkin et al., 2009), and decision making (Barch & Ceaser, 2012). We also identified one modality‐specific fMRI component containing the left attention network, whose variability loadings show group difference and also correlated with attention domain. More importantly, the corresponding time courses of fMRI_IC16 are also correlated with attention domain. The identified correspondence between the identified brain areas and the correlation with attention demonstrates well the effectiveness of the proposed method. Apart from the traditional multimodal fusion analysis, we also performed FNC analysis, and identified one abnormal FNC pair between visual and auditory networks compared with SZ and HC, which is widely reported associated with the auditory hallucination impairment with SZ (Friedman et al., 2008; Liu et al., 2018).
Finally, the primary goal of brain imaging studies is to identify biomarkers that can predict individual cognition or symptoms scores (Gupta et al., 2015). Based on the identified multimodal brain features in the linked component pair, multiple cognitive scores can be predicted in fBRIN cohort. These features can also be applied to independent cohort (COBRE) to predict unseen subjects on similar but different cognitive measures. All the above results demonstrate the ability of parallel GICA+ICA in detecting associated multimodal components pair that contains potential biomarkers related with mental disorders, suggesting a wide utility in the brain imaging community (Carter, Heckers, Nichols, Pine, & Strother, 2008; Jiang et al., 2018).
In addition to sMRI, other modalities could also be fused with temporal information included fMRI based on the proposed method, such as fractional anisotropy from dMRI (Caprihan et al., 2011; Sui et al., 2018). Parallel GICA+ICA can be applied straightforwardly to study other brain disorders, such as bipolar disorder, depression (Etkin & Wager, 2007; Qi et al., 2018), and attention‐deficit/hyperactivity disorder, suggesting a comprehensive application in brain disorder related imaging studies. Moreover, except for the distance that measuring the subject variability, other measures (such as correlation or covariance between group and subjects) can be directly incorporated into our proposed method as well. Furthermore, apart from static FNC analysis in the current study, dynamic FNC (Calhoun, Miller, Pearlson, & Adali, 2014) can also be calculated based on the parallel GICA+ICA results.
In summary, this study proposed a novel temporal information added multimodal fusion method, that is, parallel GICA+ICA, and verified its effectiveness in both simulation and real human brain imaging data. To the best of our knowledge, this is the first proposed method that can directly link first‐level fMRI features with sMRI data, seeking for potential linked multimodal MRI markers in brain disorders. Based on the proposed parallel GICA+ICA, we identified one linked fMRI‐sMRI pair that was indicated to be associated with major SZ deficits in multiple reports, which can also be used to predict multiple cognitive scores of fBIRN cohort, as well as an independent COBRE cohort, promising a wide usage of the proposed method in detecting potential linked multimodal biomarkers for psychosis.
CONFLICT OF INTEREST
The authors report no financial interests or potential conflict of interest.
Supporting information
Table SI. Demographics and the CMINDS scores of fBIRN cohort.
Table SII. Demographics and the MCCB scores of COBRE cohort.
Fig. S1. Linkage replication results for COBRE cohort.
ACKNOWLEDGMENTS
This work was supported by the National Institute of Health grants (R56MH117107, R01EB005846, 1R01MH094524, P20GM103472, P30GM122734), the National Science Foundation (1539067), China Natural Science Foundation (61773380), the Strategic Priority Research Program of the Chinese Academy of Sciences (XDB03040100), and Beijing Municipal Science and Technology Commission (Z181100001518005).
Qi S, Sui J, Chen J, et al. Parallel group ICA+ICA: Joint estimation of linked functional network variability and structural covariation with application to schizophrenia. Hum Brain Mapp. 2019;40:3795–3809. 10.1002/hbm.24632
Funding information Beijing Municipal Science and Technology Commission, Grant/Award Number: Z181100001518005; Natural Science Foundation of China, Grant/Award Numbers: 61773380, 81471367; NIH, Grant/Award Numbers: 1R01MH094524, P20GM103472, P30GM122734, R01EB005846, R56MH117107; National Science Foundation (NSF), Grant/Award Number: 1539067; Strategic Priority Research Program of the Chinese Academy of Sciences, Grant/Award Number: XDB03040100
Contributor Information
Jing Sui, Email: jing.sui@nlpr.ia.ac.cn.
Vince D. Calhoun, Email: vcalhoun@gsu.edu.
DATA ACCESSIBILITY
The code of parallel GICA+ICA will soon be added in Fusion ICA Toolbox (FIT, http://mialab.mrn.org/software/fit).
REFERENCES
- Aleman, A. , Hijman, R. , De Haan, E. H. F. , & Kahn, R. S. (1999). Memory impairment in schizophrenia: A meta‐analysis. American Journal of Psychiatry, 156, 1358–1366. [DOI] [PubMed] [Google Scholar]
- Amari, S.‐i. (1998). Natural Gradient Works Efficiently in Learning. Neural Computation, 10, 251–276. [Google Scholar]
- Barch, D. M. , & Ceaser, A. (2012). Cognition in schizophrenia: Core psychological and neural mechanisms. Trends in Cognitive Sciences, 16, 27–34. [DOI] [PMC free article] [PubMed] [Google Scholar]
- Beckmann, C. F. , & Smith, S. M. (2004). Probabilistic independent component analysis for functional magnetic resonance imaging. IEEE Transactions on Medical Imaging, 23, 137–152. [DOI] [PubMed] [Google Scholar]
- Bush, G. , Valera, E. M. , & Seidman, L. J. (2005). Functional neuroimaging of attention‐deficit/hyperactivity disorder: A review and suggested future directions. Biological Psychiatry, 57, 1273–1284. [DOI] [PubMed] [Google Scholar]
- Calhoun, V. D. , & Adali, T. (2009). Feature‐based fusion of medical imaging data. IEEE Transactions on Information Technology in Biomedicine, 13, 711–720. [DOI] [PMC free article] [PubMed] [Google Scholar]
- Calhoun, V. D. , Adali, T. , Kiehl, K. A. , Astur, R. , Pekar, J. J. , & Pearlson, G. D. (2006). A method for multitask fMRI data fusion applied to schizophrenia. Human Brain Mapping, 27, 598–610. [DOI] [PMC free article] [PubMed] [Google Scholar]
- Calhoun, V. D. , Adali, T. , Pearlson, G. D. , & Pekar, J. J. (2001). A method for making group inferences from functional MRI data using independent component analysis. Human Brain Mapping, 14, 140–151. [DOI] [PMC free article] [PubMed] [Google Scholar]
- Calhoun, V. D. , Miller, R. , Pearlson, G. , & Adali, T. (2014). The chronnectome: Time‐varying connectivity networks as the next frontier in fMRI data discovery. Neuron, 84, 262–274. [DOI] [PMC free article] [PubMed] [Google Scholar]
- Calhoun, V. D. , & Sui, J. (2016). Multimodal fusion of brain imaging data: A key to finding the missing link(s) in complex mental illness. Biological Psychiatry : Cognitive Neuroscience and Neuroimaging, 1, 230–244. [DOI] [PMC free article] [PubMed] [Google Scholar]
- Caprihan, A. , Abbott, C. , Yamamoto, J. , Pearlson, G. , Perrone‐Bizzozero, N. , Sui, J. , & Calhoun, V. D. (2011). Source‐based morphometry analysis of group differences in fractional anisotropy in schizophrenia. Brain Connectivity, 1, 133–145. [DOI] [PMC free article] [PubMed] [Google Scholar]
- Carter, C. S. , Heckers, S. , Nichols, T. , Pine, D. S. , & Strother, S. (2008). Optimizing the Design and Analysis of Clinical Functional Magnetic Resonance Imaging Research Studies. Biological Psychiatry, 64, 842–849. [DOI] [PubMed] [Google Scholar]
- Chen, J. , Calhoun, V. D. , Pearlson, G. D. , Perrone‐Bizzozero, N. , Sui, J. , Turner, J. A. , … Liu, J. (2013). Guided exploration of genomic risk for gray matter abnormalities in schizophrenia using parallel independent component analysis with reference. NeuroImage, 83, 384–396. [DOI] [PMC free article] [PubMed] [Google Scholar]
- Chen, J. , Rashid, B. , Yu, Q. , Liu, J. , Lin, D. , Du, Y. , … Calhoun, V. D. (2018). Variability in resting state network and functional network connectivity associated with schizophrenia genetic risk: A pilot study. Frontiers in Neuroscience, 12, 114. [DOI] [PMC free article] [PubMed] [Google Scholar]
- Cichocki, A. , Douglas, S. C. , & Amari, S. (1998). Robust techniques for independent component analysis (ICA) with noisy data. Neurocomputing, 22, 113–129. [Google Scholar]
- Correa, N. M. , Eichele, T. , Adali, T. , Li, Y. O. , & Calhoun, V. D. (2010). Multi‐set canonical correlation analysis for the fusion of concurrent single trial ERP and functional MRI. NeuroImage, 50, 1438–1445. [DOI] [PMC free article] [PubMed] [Google Scholar]
- Du, Y. H. , Allen, E. A. , He, H. , Sui, J. , Wu, L. , & Calhoun, V. D. (2016). Artifact removal in the context of group ICA: A comparison of single‐subject and group approaches. Human Brain Mapping, 37, 1005–1025. [DOI] [PMC free article] [PubMed] [Google Scholar]
- Erhardt, E. B. , Allen, E. A. , Wei, Y. , Eichele, T. , & Calhoun, V. D. (2012). SimTB, a simulation toolbox for fMRI data under a model of spatiotemporal separability. NeuroImage, 59, 4160–4167. [DOI] [PMC free article] [PubMed] [Google Scholar]
- Erhardt, E. B. , Rachakonda, S. , Bedrick, E. J. , Allen, E. A. , Adali, T. , & Calhoun, V. D. (2011). Comparison of multi‐subject ICA methods for analysis of fMRI data. Human Brain Mapping, 32, 2075–2095. [DOI] [PMC free article] [PubMed] [Google Scholar]
- Etkin, A. , & Wager, T. D.l. (2007). Functional neuroimaging of anxiety: A meta‐analysis of emotional processing in PTSD, social anxiety disorder, and specific phobia. The American Journal of Psychiatry, 164, 1476–1488. [DOI] [PMC free article] [PubMed] [Google Scholar]
- First, M. B. , Spitzer, R. L. , Gibbon, M. , & Williams, J. B. W. (2002). Structured Clinical Interview for DSM‐IV‐TR Axis I Disorders. New York, NY: ew York State Psychiatric Institute. [Google Scholar]
- Friedman, J. , Hastie, T. , & Tibshirani, R. (2008). Sparse inverse covariance estimation with the graphical lasso. Biostatistics, 9, 432–441. [DOI] [PMC free article] [PubMed] [Google Scholar]
- Gabrieli, J. D. , Ghosh, S. S. , & Whitfield‐Gabrieli, S. (2015). Prediction as a humanitarian and pragmatic contribution from human cognitive neuroscience. Neuron, 85, 11–26. [DOI] [PMC free article] [PubMed] [Google Scholar]
- Glahn, D. C. , Ragland, J. D. , Abramoff, A. , Barrett, J. , Laird, A. R. , Bearden, C. E. , & Velligan, D. I. (2005). Beyond hypofrontality: A quantitative meta‐analysis of functional neuroimaging studies of working memory in schizophrenia. Human Brain Mapping, 25, 60–69. [DOI] [PMC free article] [PubMed] [Google Scholar]
- Green, M. F. , Kern, R. S. , & Heaton, R. K. (2004). Longitudinal studies of cognition and functional outcome in schizophrenia: Implications for MATRICS. Schizophrenia Research, 72, 41–51. [DOI] [PubMed] [Google Scholar]
- Griffanti, L. , Douaud, G. , Bijsterbosch, J. , Evangelisti, S. , Alfaro‐Almagro, F. , Glasser, M. F. , … Smith, S. M. (2017). Hand classification of fMRI ICA noise components. NeuroImage, 154, 188–205. [DOI] [PMC free article] [PubMed] [Google Scholar]
- Groves, A. R. , Beckmann, C. F. , Smith, S. M. , & Woolrich, M. W. (2011). Linked independent component analysis for multimodal data fusion. NeuroImage, 54, 2198–2217. [DOI] [PubMed] [Google Scholar]
- Gupta, C. N. , Calhoun, V. D. , Rachakonda, S. , Chen, J. , Patel, V. , Liu, J. , … Turner, J. A. (2015). Patterns of gray matter abnormalities in schizophrenia based on an international mega‐analysis. Schizophrenia Bulletin, 41, 1133–1142. [DOI] [PMC free article] [PubMed] [Google Scholar]
- Hutchison, R. M. , Womelsdorf, T. , Allen, E. A. , Bandettini, P. A. , Calhoun, V. D. , Corbetta, M. , … Chang, C. (2013). Dynamic functional connectivity: Promise, issues, and interpretations. NeuroImage, 80, 360–378. [DOI] [PMC free article] [PubMed] [Google Scholar]
- Jiang, R. , Calhoun, V. D. , Zuo, N. , Lin, D. , Li, J. , Fan, L. , … Sui, J. (2018). Connectome‐based individualized prediction of temperament trait scores. NeuroImage, 183, 366–374. [DOI] [PubMed] [Google Scholar]
- Jorge Nocedal, S. J. W. (1999). Numerical Optimization (pp. 32–63). New York, NY: Springer. [Google Scholar]
- Keator, D.B. , van Erp, T.G. , Turner, J.A. , Glover, G.H. , Mueller, B.A. , Liu, T.T. , Voyvodic, J.T. , Rasmussen, J. , Calhoun, V.D. , Lee, H.J. , Toga, A.W. , McEwen, S. , Ford, J.M. , Mathalon, D.H. , Diaz, M. , O'Leary, D.S. , Jeremy Bockholt, H. , Gadde, S. , Preda, A. , Wible, C.G. , Stern, H.S. , Belger, A. , McCarthy, G. , Ozyurt, B. , Potkin, S.G. , Fbirn. (2016) The Function Biomedical Informatics Research Network Data Repository. NeuroImage, 124:1074–9. [DOI] [PMC free article] [PubMed] [Google Scholar]
- Li, Y. O. , Adali, T. , & Calhoun, V. D. (2007). Estimating the number of independent components for functional magnetic resonance imaging data. Human Brain Mapping, 28, 1251–1266. [DOI] [PMC free article] [PubMed] [Google Scholar]
- Liu, J. , Pearlson, G. , Windemuth, A. , Ruano, G. , Perrone‐Bizzozero, N. I. , & Calhoun, V. (2009). Combining fMRI and SNP data to investigate connections between brain function and genetics using parallel ICA. Human Brain Mapping, 30, 241–255. [DOI] [PMC free article] [PubMed] [Google Scholar]
- Liu, S. , Wang, H. , Song, M. , Lv, L. , Cui, Y. , Liu, Y. , … Sui, J. (2018). Linked 4‐way multimodal brain differences in schizophrenia in a large chinese han population. Schizophrenia Bulletin, 45, 436–449. [DOI] [PMC free article] [PubMed] [Google Scholar]
- Martinez‐Montes, E. , Valdes‐Sosa, P. A. , Miwakeichi, F. , Goldman, R. I. , & Cohen, M. S. (2004). Concurrent EEG/fMRI analysis by multiway partial least squares. NeuroImage, 22, 1023–1034. [DOI] [PubMed] [Google Scholar]
- Meng, X. , Jiang, R. , Lin, D. , Bustillo, J. , Jones, T. , Chen, J. , … Calhoun, V. D. (2016). Predicting individualized clinical measures by a generalized prediction framework and multimodal fusion of MRI data. Neuroimage, 145, 218–229. [DOI] [PMC free article] [PubMed] [Google Scholar]
- Minzenberg, M. J. , Laird, A. R. , Thelen, S. , Carter, C. S. , & Glahn, D. C. (2009). Meta‐analysis of 41 functional neuroimaging studies of executive function in schizophrenia. Archives of General Psychiatry, 66, 811–822. [DOI] [PMC free article] [PubMed] [Google Scholar]
- Potkin, S. G. , Turner, J. A. , Brown, G. G. , McCarthy, G. , Greve, D. N. , Glover, G. H. , … FBIRN . (2009). Working memory and DLPFC inefficiency in schizophrenia: The FBIRN study. Schizophrenia Bulletin, 35, 19–31. [DOI] [PMC free article] [PubMed] [Google Scholar]
- Qi, S. , Calhoun, V. D. , van Erp, T. G. M. , Bustillo, J. , Damaraju, E. , Turner, J. A. , … Sui, J. (2018). Multimodal Fusion With Reference: Searching for Joint Neuromarkers of Working Memory Deficits in Schizophrenia. IEEE Transactions on Medical Imaging, 37, 93–105. [DOI] [PMC free article] [PubMed] [Google Scholar]
- Qi, S. , Yang, X. , Zhao, L. , Calhoun, V. D. , Perrone‐Bizzozero, N. , Liu, S. , … Ma, X. (2018). MicroRNA132 associated multimodal neuroimaging patterns in unmedicated major depressive disorder. Brain, 141, 916–926. [DOI] [PMC free article] [PubMed] [Google Scholar]
- Qi, S.L. , Calhoun, V.D. , van Erp, T.G.M. , Damaraju, E. , Bustillo, J. , Du, Y.H. , Turner, J.A. , Mathalon, D.H. , Ford, J.M. , Voyvodic, J. , Mueller, B.A. , Belger, A. , Mc Ewen, S. , Potkin, S.G. , Preda, A. , Jiang, T.Z. , Sui, J. (2016). Supervised multimodal fusion and its application in searching joint neuromarkers of working memory deficits in schizophrenia. IEEE Engineering in Medicine and Biology Society. Conference. Proceedings of the Annual International Conference of the IEEE Engineering in Medicine and Biology Society. pp. 4021–4026. [DOI] [PubMed]
- Schmithorst, V. J. , & Holland, S. K. (2004). Comparison of three methods for generating group statistical inferences from independent component analysis of functional magnetic resonance imaging data. Journal of Magnetic Resonance Imaging, 19, 365–368. [DOI] [PMC free article] [PubMed] [Google Scholar]
- Sui, J. , Huster, R. , Yu, Q. , Segall, J. M. , & Calhoun, V. D. (2014). Function‐structure associations of the brain: Evidence from multimodal connectivity and covariance studies. Neuroimage, 1, 11–23. [DOI] [PMC free article] [PubMed] [Google Scholar]
- Sui, J. , Pearlson, G. , Caprihan, A. , Adali, T. , Kiehl, K. A. , Liu, J. , … Calhoun, V. D. (2011). Discriminating schizophrenia and bipolar disorder by fusing fMRI and DTI in a multimodal CCA+ joint ICA model. NeuroImage, 57, 839–855. [DOI] [PMC free article] [PubMed] [Google Scholar]
- Sui, J. , Qi, S. , van Erp, T. G. M. , Bustillo, J. , Jiang, R. , Lin, D. , … Calhoun, V. D. (2018). Multimodal neuromarkers in schizophrenia via cognition‐guided MRI fusion. Nature Communications, 9, 3028. [DOI] [PMC free article] [PubMed] [Google Scholar]
- van Erp, T.G. , Preda, A. , Turner, J.A. , Callahan, S. , Calhoun, V.D. , Bustillo, J.R. , Lim, K.O. , Mueller, B. , Brown, G.G. , Vaidya, J.G. , McEwen, S. , Belger, A. , Voyvodic, J. , Mathalon, D.H. , Nguyen, D. , Ford, J.M. , Potkin, S.G. , Fbirn. (2015) Neuropsychological profile in adult schizophrenia measured with the CMINDS. Psychiatry Research, 230:826–34. [DOI] [PMC free article] [PubMed] [Google Scholar]
- Zhang, D. , Wang, Y. , Zhou, L. , Yuan, H. , Shen, D. , & Alzheimer's Disease Neuroimaging, I . (2011). Multimodal classification of Alzheimer's disease and mild cognitive impairment. NeuroImage, 55, 856–867. [DOI] [PMC free article] [PubMed] [Google Scholar]
Associated Data
This section collects any data citations, data availability statements, or supplementary materials included in this article.
Supplementary Materials
Table SI. Demographics and the CMINDS scores of fBIRN cohort.
Table SII. Demographics and the MCCB scores of COBRE cohort.
Fig. S1. Linkage replication results for COBRE cohort.
Data Availability Statement
The code of parallel GICA+ICA will soon be added in Fusion ICA Toolbox (FIT, http://mialab.mrn.org/software/fit).