

Abstract
Despite substantial reductions in recent years in Nepal, stunting prevalence in children younger than 5 years remains high and represents a leading public health concern. To identify factors contributing to the stunting burden, we report multilevel risk factors associated with stunting in 4,853 children aged 6–59 months in a nationally and agroecologically representative random sample from the first year of the Policy and Science for Health, Agriculture, and Nutrition Community Studies, a community‐based observational, mixed‐panel study. Mixed effects logistic regressions controlling for multilevel clustering in the study design were used to examine the association of individual‐, household‐, and community‐level factors associated with stunting. Stunting prevalence was 38% in our sample. After adjustment for potential confounding variables, maternal factors, including maternal height and education, were generally the strongest individual‐level risk factors for stunting, adjusted odds ratio (AOR) = 2.52, 95% CI [1.96, 3.25], short (<145 cm) versus not short mothers; AOR = 2.09, 95% CI [1.48, 2.96], uneducated mothers versus secondary school graduates. Among the household‐ and community‐level factors, household expenditure and community infrastructure (presence of paved roads, markets, or hospitals) were strongly, inversely associated with increased stunting risk, AOR = 1.68, 95% CI [1.27, 2.24], lowest versus highest household expenditure quintile; AOR = 2.38, 95% CI [1.36, 4.14], less developed (lacking paved roads, markets, or hospitals) versus more developed communities. Although most factors associated with stunting are not rapidly modifiable, areas for future research and possible interventions emerged.
Keywords: children, multilevel, Nepal, risk factors, stunting, younger than 5 years
1. INTRODUCTION
Stunting (height‐for‐age z‐score [HAZ] < −2) affects close to a quarter of the world's child population younger than 5 years, with South Asia bearing over half of the childhood‐stunting burden (United Nations Children's Fund, 2015). Stunting both reflects chronic undernutrition and sustained resource‐constrained environments and is often associated with an increased risk of impaired cognition, reduced economic productivity, poor health outcomes throughout the life cycle, and poor survival overall (Fenske, Burns, Hothorn & Rehfuess, 2013; Dewey & Begum, 2011a). In recent years, efforts to prevent stunting have been among the leading priorities of governments, donors, and civil society organizations, reflected by stunting reduction goals embedded in global health policies and the targets of the Sustainable Development Goals (International Council for Science, 2015; International Food Policy Research Institute, 2015). Nepal, with an approximate population of children younger than 5 years of 3.5 million, has experienced major improvements in stunting between 2001 and 2011, with stunting prevalence decreasing 16.6% during this time (Headey & Hoddinott, 2015; Ministry of Health and Population, 2012). Nevertheless, the national stunting prevalence of children younger than 5 years still remains staggeringly high at 41% (Ministry of Health and Population, 2012). Since the late 1990s, substantial improvements have been made in infrastructure, health services access, sanitation, food access, and nutrient supplementation, all of which have contributed to the stunting decline (Headey & Hoddinott, 2015; Ministry of Health and Population, 2012). However, these improvements are still relatively recent and may be not be as widespread among the most impoverished or vulnerable populations, similar to inequities in nutritional health globally (Devkota, Adhikari & Upreti, 2016; Restrepo‐Mendez, Barros, Black, & Victora, 2015).
The causes of stunting are complex and consist of a web of underlying factors that span the individual, household, and community. Household wealth, sex of a child, infection, suboptimal childcare practices, birth order (presence of a younger sibling), and maternal undernutrition represent some of these multifaceted factors associated with stunting (Black et al., 2013). Studies in Nepal have identified child age, socioeconomic status, maternal undernutrition and education, and poor infant and young child feeding practices as some the strongest risk factors for child stunting (Pramod Singh, Nair, Grubesic, & Connell, 2009; Ruwali, 2011; Paudel, Pradhan, Wagle, Pahari, & Onta, 2012; Acharya, Gautam, Kaphle, & Naupane, 2013; Singh & Ram, 2014; Tiwari, Ausman, & Agho, 2014). Even so, most studies that explore determinants of stunting in Nepal have largely been limited to either certain geographical regions or disadvantaged subgroups (Acharya et al., 2013; Paudel et al., 2012; Pramod Singh et al., 2009; Ruwali, 2011; Singh & Ram, 2014). To our knowledge, only one study in Nepal has examined the relationship between multilevel risk factors for childhood stunting using a nationally representative sample collected in 2011 (Tiwari et al., 2014). This study utilizes Demographic Health Survey (DHS) datasets, and although an extensive number of risk factors were assessed, the DHS contains limited information on risk factors related to child care knowledge, household expenditure, agricultural factors, and community infrastructure (Tiwari et al., 2014); as a result, associations with these factors were not explored.
Since 2011, actors from the government, donor, and development communities in Nepal have coalesced to increase collaboration, investment, and action to improve nutritional outcomes of the population, including stunting in children younger than 5 years (National Planning Commission, 2012; 2013). Given the persistently high‐stunting rates, we found that there remains a need to identify and address risk factors for stunting within the context of increased policy and programmatic efforts. This paper aims to identify multilevel factors associated with stunting risk in children younger than 5 years utilizing a nationally and agroecologically representative random sample from the first panel survey of the Policy and Science for Health, Agriculture, and Nutrition (PoSHAN) Community Studies, an ongoing annual, same‐season community‐based observational, panel study.
Key messages.
Stunting prevalence remains a public health concern in Nepal, affecting 38% of children younger than 5 years in our nationally and agroecologically representative sample.
Some of the risk factors of stunting identified may not be rapidly modifiable, including poverty, limited community infrastructure, and maternal undernutrition.
Higher maternal education was strongly associated with reduced stunting risk, highlighting the importance of promoting education among girls.
Agricultural productivity was associated with reduced stunting in the terai, but not hills and mountains.
Targeted interventions, including health and nutrition education among uneducated women and improving agricultural productivity in the terai, may present opportunities to improve child nutrition.
2. METHODS
2.1. Study design
The PoSHAN Community Studies utilize a panel design with a nationally representative sample, wherein annual surveys are conducted in the same districts, village development committees (VDC), wards, and households over time across each of the three main agroecological zones. Each annual survey provides cross‐sectional data on market, community, household, and individual factors that may influence and/or be affected by pathways that link agriculture to nutrition outcomes. The panel surveys assess household factors (food security; agricultural production; income; expenditure; assets; exposure to agriculture, health, and microcredit extension services; and water, sanitation, and hygiene factors), individual factors (use of health and nutrition services, morbidity, dietary intake, and nutritional status among women and children younger than 5 years), and community factors (local market food prices and the presence of various infrastructure in wards and/or VDCs, such as markets, hospitals, and paved roads). The PoSHAN Community Studies' sample is agroecologically representative, achieved by stratifying the country into its three main agroecological zones: the mountains, hills, and plains (terai). From each stratified sampling frame, 7 VDCs were systematically randomly selected, producing a total sample of 21 VDCs spanning from west to east of each agro zone. Three wards were then selected using random sampling, rendering 64 wards in which data collection has been ongoing since 2013. Study sites are visited annually, in the same season, and data are collected from every consenting household that meet the following eligibility criteria: a child younger than 5 years or a woman married in the previous 2 years; thus, an embedded longitudinal sample is produced. Data from the first annual panel survey collected from May to July 2013 were analyzed to identify the risk factors for stunting in children younger than 5 years.
2.2. Data collection
Twenty‐one hired field teams, consisting of three interviewers and one supervisor in each VDC, from a local research firm (New ERA), performed the data collection, under the direction and supervision of JHU and the Nepal Nutrition Innovation Lab Kathmandu team. Field teams were trained and standardized in obtaining informed consent, conducting interviews, and anthropometric measurements (weight, height, and mid‐upper arm circumference [MUAC]) prior to the start of data collection. Household interviews were conducted with the head of household, woman surveys were conducted with newly married women or children's mothers, and child surveys were conducted with the child's mother or caretaker. Community and market assessments were also conducted; locations of health and agricultural services and infrastructure (schools, roads, hospitals, etc.) were mapped; and unit prices of foods and agricultural inputs in local markets recorded. Locations of households were also mapped to facilitate relocation of households in subsequent surveys. All data collection followed quality control procedures. Data were collected using paper forms that were sent to a central data management location for processing and entry where further quality assurance procedures were followed.
2.3. Anthropometric assessment
Anthropometric assessment included height, weight, and MUAC. Triplicate measurements for height or length were taken using Shorr height–length boards, for weight using SECA scales (Model 876, SECA, USA) and for MUAC measurements using a nonstretch insertion tape; mean values were utilized in analyses. Recumbent length was measured for children younger than 2 years; standing height was measured for women and children 2 years of age or older. A subset of households was revisited throughout the data collection period, and anthropometric measurements were retaken to ensure the quality of the data, improve reliability, and minimize measurement error. HAZ, weight‐for‐age (WAZ), and weight‐for‐height (WHZ) z‐scores were calculated for each child to assess nutritional status in reference to the Child Growth Standards of the World Health Organization (WHO) (WHO Multicentre Growth Reference Study Group, 2006). Children with an HAZ, WAZ, or WHZ < −2 standard deviations from the reference group median were defined as stunted, underweight, and wasted, respectively.
2.4. Risk factors
To facilitate the exploration of the breadth of risk factors for child stunting younger than 5 years, we categorized the explanatory variables into individual‐level (child and maternal factors), household‐level (socioeconomic; water, sanitation, hygiene [WASH], and agricultural factors), and community‐level factors. The selection of these variables was informed by a review of the existing literature and factors that have been shown or hypothesized to be associated with stunting (Acharya et al., 2013; Black et al., 2013; Headey & Hoddinott, 2015; Humphrey, 2009; Paudel et al., 2012; Pramod Singh et al., 2009; Ruwali, 2011; Singh & Ram, 2014; Tiwari et al., 2014).
2.4.1. Individual‐level factors
2.4.1.1. Child‐level factors
Sex; reported age; low MUAC (<12.5 cm) and wasting (at the time of the interview); dietary intake (assessed by a 51‐item 7‐day food frequency questionnaire [FFQ]) and dietary diversity (in 7 days prior to the interview); reported recent morbidity (within 30 days prior to the interview); receipt of prophylactic vitamin A capsules and/or deworming tablets during national distribution campaigns, utilization of health facilities, home visits by female community health volunteers (FCHV), and/or participation in a growth‐monitoring program (all within the year prior to the interview); and receipt of at least one dose of the diphtheria, pertussis, and tetanus (DPT) vaccine were included in the analysis. Child age was reported by mothers and checked by immunization cards, when available; supportive techniques, such as referencing events and calendars were also used to help the mother ascertain the child's age. The FFQ used in this study was adapted from previous studies conducted in Nepal (the Nepal Nutrition Intervention Project Sarlahi studies; Campbell et al., 2014; Campbell et al., 2015). Foods included represented a summary of items that are typically found in all three zones, but may not be available in all markets at the same time of year. After pretesting the questionnaire in different agroecological regions, the survey was revised to capture any additional foods commonly consumed that were not previously included in the questionnaire. The same questionnaire was administered to participants in each agroecological zone. For each child, we computed a dietary diversity score (DDS) adapted from the Food and Agriculture Organization's (FAO) nine food group DDS (Kennedy, Ballard, & Dop, 2011). In our study, organ meat was not included in the FFQ of the first annual survey, but has since been included in subsequent annual surveys. As a result, for these analyses, the DDS was computed based on the consumption of each of the following eight food groups (rather than nine as in the Food and Agriculture Organization DDS wherein organ meat is included) as reported through the 7‐day FFQ: starchy staples; legumes nuts and seeds; dairy (milk or yogurt); eggs; flesh foods (meat, poultry, and fish); dark green leaves; other provitamin A‐rich fruits and vegetables (ripe mango, jackfruit, pumpkin, papaya, and carrots); and other fruits and vegetables (Kennedy et al., 2011). Intake was categorized as any versus no consumption of any of the food items comprising a food group. Intake was not adjusted by agroecological zone as consumption of aggregate food groups, rather than specific foods, were studied. Recent morbidity in the previous 30 days included any reported occurrence of diarrhea, fever, acute respiratory infection (productive cough and ≥1 of the following: high fever, grunting, rapid breathing, and/or chest indrawing), and purulent ear or eye infections (with pus or discharge) as these are often linked to acute and chronic malnutrition. Each morbidity was examined separately, rather than as a composite variable for any illness, to elucidate which morbidities, if any, were associated with stunting in our sample. Receipt of the DPT vaccination was used as a surrogate for proper immunization due to its early administration (as young as 6 weeks), ensuring most children should have received at least one dose.
2.4.1.2. Maternal‐level factors
Age, reported pregnancy status, educational attainment, knowledge of childcare and feeding practices (knowledge score determined by the number of appropriate responses given to 18 questions regarding breastfeeding, complementary feeding, and treatment of child illness during the women's interview), and short stature (height < 145 cm), low weight (<45 kg), and low MUAC (<22.5 cm; assessed through anthropometric measurement) were included in the analysis.
2.4.2. Household‐level factors
Socioeconomic factors: head of household gender, household size, receipt of remittances in the last month, monthly expenditure, and food insecurity were included. Total monthly expenditure was used as a proxy for resources available to the household and was categorized into quintiles. Food insecurity was measured using FANTA's Household Food Insecurity Access Scale and Months of Adequate Household Food Provisioning (Coates, Swindale, & Bilinksy, 2007) that captured the household's perceived household food security over the past 30 days.
Water, Sanitation, and Hygiene factors (WASH): source of drinking water, location of child defecation, and location where animals are kept (all self‐reported), and the presence of rubbish and/or human and/or animal feces around the house or compound (determined through household observation by interviewers) were included.
Agricultural‐level factors: total land area cultivated (owned, rented, or used in the previous year), the number of different crops produced (this count included staple and cash crops, fruits, and vegetables) and the proportion of each sold by the household during both rainy (June to September) and dry seasons (October to May), and any reported expenditure on agricultural inputs (seed or fertilizer) during the previous year were employed in the analysis.
2.4.3. Community‐level factors
Agroecological zone and village development committee infrastructure were included in the analysis. A village development committee was considered more developed if it contained any one of the following: paved roads, a permanents bazaar (market), or a hospital. The presence of this infrastructure was determined through participatory community mapping conducted with a diverse group of VDC inhabitants and confirmed through collection of GPS coordinates.
2.5. Statistical analysis
All analyses were restricted to children 6–59 months of age, and stunting (HAZ < −2) was the outcome of interest. The unadjusted risk of stunting is reported as odds ratios (OR) with 95% confidence intervals (CI), associated with each of the of the individual‐, household‐, and community‐level factors. We utilized mixed effects logistic regressions, including agroecological zone as a fixed effect and VDC or ward clusters and households as random effects to control for clustering in the study design (Model 1). Models were subsequently adjusted for maternal and child age, child sex, and expenditure quintile to better isolate the effect of each explanatory variable on stunting risk, reported as adjusted OR with 95% CI (Model 2). Using stepwise regression, variables that retained statistical significance (OR p value < .05) were included in the final model (Model 3). Given the strong association between poverty and stunting, we also tested interactions between household expenditure and each of the risk factors. However, overall, the interactions were null, and household expenditure was retained in adjusted models. All analyses were conducted using STATA version 13 statistical software (StataCorp, College Station, TX, USA).
2.6. Ethical approval
Ethical approval for the study was provided by the Nepal Health Research Council, an autonomous body, under the Ministry of Health and Population, Government of Nepal and the Institutional Review Board at the Johns Hopkins Bloomberg School of Public Health, Baltimore, MD.
3. RESULTS
3.1. Study population
A total of 4,943 children 6–59 months of age from 3,665 households (674, 957, 2034 in mountains, hills, and terai, respectively) were surveyed. Ninety children (2% of total) were excluded from this analysis due to missing height or length data, resulting in an analytic sample of 4,853 children aged 6–59 months (Figure 1). Less than 1% of children were missing risk factor information.
Figure 1.
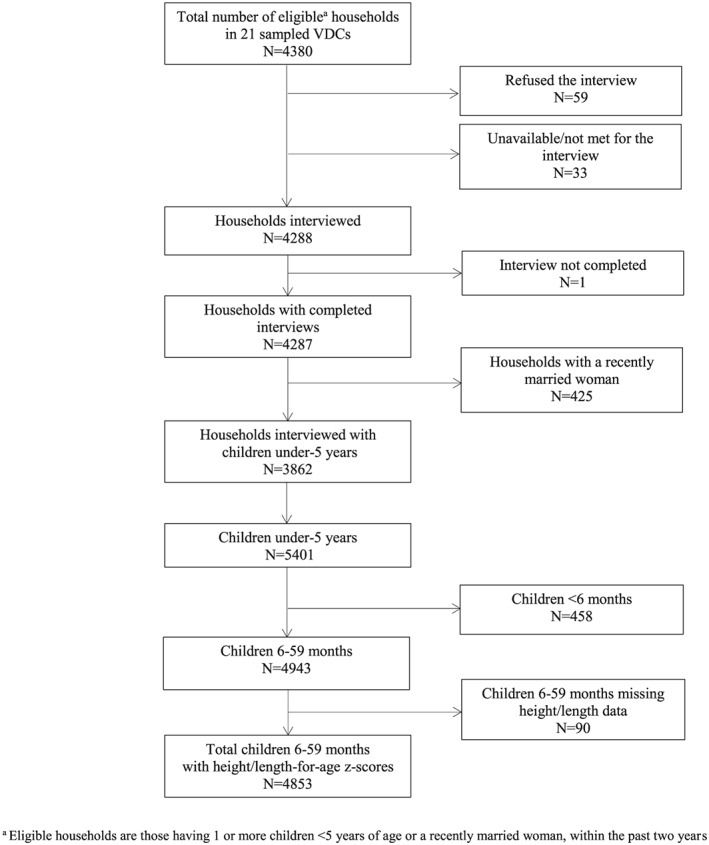
Consort diagram for children younger than 5 years with height‐for‐age/length‐for‐age z‐scores in the Policy and Science for Health, Agriculture, and Nutrition Community Studies annual survey, 2013. VDC = village development committees
3.2. Sample characteristics
Sample characteristics are presented in Table 1. The majority of the children were between 24 and 59 months of age (mean age: 33.0 ± 15.6 months). Overall stunting and wasting prevalence were high at 38% and 18%, respectively. Mothers' nutritional status was also poor, with nearly a third being undernourished (MUAC <22.5 cm). Most mothers were between 20 and 29 years of age and were largely uneducated.
Table 1.
Sample characteristics of children 6–59 months of age in the Policy and Science for Health, Agriculture, and Nutrition Community Studies annual survey, May–July 2013, Nepal
| Sample characteristics | N = 4,853a n (%) | Sample characteristics | N = 4,853a n (%) |
|---|---|---|---|
| Individual‐level factors: child | Household‐level factors: socioeconomic | ||
| Child Age | Male head of household | 3,576 (73.7) | |
| 6–11 months | 556 (11.5) | Children younger than 5 years in household | |
| 12–23 months | 1,052 (21.7) | 1 | 2,321 (47.8) |
| 24–59 months | 3,245 (66.9) | 2 | 1,878 (38.7) |
| Male children | 2,554 (52.6) | ≥3 | 654 (13.5) |
| Child stunting (height‐for‐age z‐score < −2) | 1,838 (37.9) | Expenditure quintile | |
| Child wasting (weight‐for‐height z‐score < −2) | 864 (17.8) | 1st (highest) | 887 (18.3) |
| Recent morbidity (any times in last 30 days): | 2nd | 1,031 (21.3) | |
| Diarrhea | 1,453 (30.0) | 3rd | 941 (19.4) |
| Fever | 743 (15.3) | 4th | 898 (18.5) |
| Acute respiratory infectionb | 401 (8.3) | 5th (lowest) | 1,095 (22.6) |
| Ear Infection (purulent) | 229 (4.7) | Household food insecurity | |
| Eye infection (purulent) | 220 (4.5) | None | 2,789 (57.5) |
| Dietary intake (any times in last 7 days): | Mild | 901 (18.6) | |
| Starchy staplesc | 4,751 (97.9) | Moderate | 828 (17.1) |
| Legumes, nuts, or seeds | 4,538 (93.5) | Severe | 333 (6.9) |
| Oil | 4,560 (94.0) | Remittances received (past year) | 1,685 (34.7) |
| Milk or yogurt | 3,017 (62.2) | Household‐level factors: water, sanitation, and hygiene | |
| Eggs | 1,360 (28.0) | Protected drinking water sourceg | 4,503 (92.9) |
| Fish | 823 (17.0) | Open child defecationh | 3,207 (66.2) |
| Meat | 2,557 (52.7) | Animals kept inside house/kitchen | 1,632 (33.6) |
| Dark green leaves | 2,989 (61.6) | Human and/or animal feces observable | |
| Provitamin A‐rich fruits and vegetablesd | 2,655 (54.8) | around the house or compound | 2,629 (54.2) |
| Other fruits and vegetables | 3,873 (79.8) | Rubbish observable around the house | |
| Dietary diversity score ≥ 4 | 4,180 (86.2) | or compound | 2,463 (50.8) |
| Breastfed in previous week | 2,407 (49.6) | Household‐level factors: agricultural production | |
| 6–11 months | 549 (98.7) | Any household crop productioni | |
| 12–23 months | 919 (87.4) | >5 crops | 2,060 (42.5) |
| 24–59 months | 939 (28.9) | 1–5 crops | 1,113 (22.9) |
| Health services (in past 12 months): | None | 1,680 (34.6) | |
| Received DPT (ever received ≥1 dose) | 4,612 (95.7) | Household sold any cropsj | 1,622 (33.4) |
| Participated in growth monitoring | 975 (20.1) | Land area cultivated by household (hectares) | |
| Received deworming tablete | 3,709 (76.9) | >0.5 ha | 1,488 (30.7) |
| Received vitamin A (≥1 dose)e | 4,180 (86.4) | ≤0.5 ha | 1,975 (40.7) |
| Visited by a female community health | None | 1,390 (28.6) | |
| volunteer | 1,124 (23.2) | Any household expenditure on | |
| Went to any health facility | 3,928 (80.9) | agricultural inputsk | 2,758 (57.2) |
| Individual‐level factors: mothers | Community‐level factors | ||
| Maternal age (years) | Agroecologic zone | ||
| <20 | 225 (4.7) | Mountains | 849 (17.5) |
| 20–29 | 3,265 (67.5) | Hills | 1,150 (23.7) |
| ≥30 | 1,347 (27.9) | Terai | 2,854 (58.8) |
| Low maternal height (<145 cm) | 576 (11.9) | Village development committee | |
| Low maternal weight (<45 kg) | 2,223 (46.1) | infrastructure is more developedl | 4,435 (91.4) |
| Low maternal mid‐upper arm | |||
| circumference (<22.5 cm) | 1,345 (27.8) | ||
| Currently pregnant | 478 (9.9) | ||
| Maternal education | |||
| Graduated secondary and above | 409 (8.5) | ||
| Some secondary | 1,014 (21.0) | ||
| Primary | 587 (12.1) | ||
| None | 2,826 (58.4) | ||
| Child care knowledge scoref | |||
| ≥16 | 316 (6.6) | ||
| 11–15 | 2,017 (41.9) | ||
| 5–10 | 2,341 (48.7) | ||
| <5 | 138 (2.9) | ||
DPT = diphtheria, pertussis, tetanus vaccine.
Information for each factor is missing for <1% of children.
Acute respiratory infection includes productive cough and ≥1 of the following: fever, rapid breathing, grunting, and/or chest‐in drawing.
Starchy staples include rice, maize, wheat, millet, and potatoes.
Vitamin A‐rich fruits and vegetables include carrots, drumstick, ripe pumpkin, ripe mango, ripe papaya, and ripe jackfruit.
Does not include provision of supplement and/or tablet for treatment.
Number of correct answers out of 18 given regarding breastfeeding, complementary feeding, and treatment of child illness.
Protected sources include a ring well, tube well and/or borehole, piped water, or bottled water; unprotected sources include a stone tap, stream, river, pond, canal, or unprotected ring well.
Open defecation includes an open field, outdoors, or in a body of water; not open defecation includes a toilet or diaper.
Number of different field crops produced in the rainy and dry season of previous year.
Sold any proportion of field crops produced in the rainy and dry season of the previous year.
Agricultural inputs include seed and/or fertilizer.
More developed infrastructure includes paved roads, a hospital, or a bazaar.
Diarrhea was the most prevalent morbidity, affecting one in three children in the month before the survey, followed by high fever in 15%. The majority of children received a high‐dose vitamin A supplement and a deworming tablet in the past year, although relatively few children were visited by an FCHV or participated in a growth‐monitoring program. Consumption of starchy staples, legumes, and oil were ubiquitous, and 80% of children reportedly consumed non‐vitamin A‐rich fruits and vegetables in the week prior to the survey. Only half consumed dairy products, meat, dark leafy greens, or vitamin A‐rich fruits and vegetables, whereas intake of egg and fish was limited. Breastfeeding remained common until 23 months of age, but diminished to 29% among children 24–59 months.
Households were generally male headed with one or two children younger than 5 years, and approximately one‐third received remittances in the past year. Forty percent of children lived in food insecure households, with slightly over 5% suffering from severe food insecurity. Most households were engaged in subsistence agriculture, cultivating small plots of land (<0.5 ha), and producing five or more crops, largely for home consumption. About 10% of households were located in wards with limited infrastructure lacking roads, a hospital, or a market. Overall, WASH practices were poor. Two‐thirds of households practiced open defecation, and rubbish or feces were observed in or around half of all homes. However, nearly all households consumed water from a protected source.
3.3. Risk factors for stunting
Risk factors, presented in Table 2, are reported sequentially from the more proximal factors (individual‐level factors), to more distal factors (household‐ and community‐level factors).
Table 2.
Unadjusted and adjusted odds of stunting (height‐for‐age z‐score < −2) among children 6–59 months (N = 4853), May–July 2013, Nepala
| Stunting | Risk of stunting | |||
|---|---|---|---|---|
| Risk factors | Prevalenceb n (%) | Model 1 OR (95% CI) | Model 2c AOR (95% CI) | Model 3c , d AOR (95% CI) |
| Individual‐level factors: child | ||||
| Child age | ||||
| 6–11 months | 104 (18.7) | 1.00 | 1.00 | 1.00 |
| 12–23 months | 385 (36.6) | 3.32 (2.42, 4.54) *** | 3.37 (2.46, 4.63) *** | 3.75 (2.72, 5.16) *** |
| 24–59 months | 1,349 (41.6) | 4.30 (3.22, 5.73) *** | 4.46 (3.33, 5.97) *** | 6.04 (4.33, 8.44) *** |
| Child sex | ||||
| Male | 964 (37.7) | 1.00 | 1.00 | 1.00 |
| Female | 874 (38.0) | 1.07 (0.93, 1.24) | 1.07 (0.92, 1.25) | 1.09 (0.93, 8.44) |
| Child wasting | ||||
| Not wasted | 1,433 (36.0) | 1.00 | 1.00 | 1.00 |
| Wasted | 399 (46.2) | 1.48 (1.23, 1.79) *** | 1.69 (1.38, 2.07) *** | 1.52 (1.24, 1.86) *** |
| Recent morbidity (last 30 days): | ||||
| Diarrhea | ||||
| None | 1,278 (37.6) | 1.00 | 1.00 | — |
| Any | 560 (38.5) | 0.93 (0.79, 1.09) | 1.06 (0.89, 1.26) | — |
| High fever | ||||
| None | 1,531 (37.3) | 1.00 | 1.00 | 1.00 |
| Any | 307 (41.3) | 1.24 (1.01, 1.52) * | 1.35 (1.08, 1.67) ** | 1.28 (1.03, 1.59) * |
| Acute respiratory infectione | ||||
| None | 1,694 (38.1) | 1.00 | 1.00 | — |
| Any | 144 (35.9) | 0.98 (0.74, 1.28) | 1.01 (0.76, 1.34) | — |
| Ear infection (purulent) | ||||
| None | 1,739 (37.6) | 1.00 | 1.00 | — |
| Any | 99 (43.2) | 1.31 (0.93, 1.84) | 1.28 (0.90, 1.84) | — |
| Eye infection (purulent) | ||||
| None | 1,741 (37.6) | 1.00 | 1.00 | 1.00 |
| Any | 97 (44.1) | 1.38 (0.97, 1.96) | 1.50 (1.03, 2.16)* | 1.53 (1.06, 2.21)* |
| Dietary intake (7‐day FFQ): | ||||
| Starchy staplef | ||||
| Any | 1,810 (38.1) | 1.00 | 1.00 | — |
| None | 28 (27.5) | 0.51 (0.30, 0.86) * | 1.92 (1.04, 3.55) * | — |
| Legumes, nuts, and seeds | ||||
| Any | 1,720 (37.9) | 1.00 | 1.00 | — |
| None | 118 (37.5) | 0.89 (0.66, 1.21) | 1.33 (0.95, 1.86) | — |
| Oil | ||||
| Any | 1,742 (38.2) | 1.00 | 1.00 | — |
| None | 96 (32.8) | 0.68 (0.50, 0.93) * | 1.67 (1.15, 2.41) ** | — |
| Milk and milk products | ||||
| Any | 1,081 (35.8) | 1.00 | 1.00 | — |
| None | 757 (41.2) | 1.09 (0.93, 1.28) | 1.18 (0.99, 1.40) | — |
| Eggs | ||||
| Any | 458 (33.7) | 1.00 | 1.00 | — |
| None | 1,380 (39.5) | 1.04 (0.86, 1.24) | 1.14 (0.94, 1.38) | — |
| Fish | ||||
| Any | 330 (40.1) | 1.00 | 1.00 | — |
| None | 1,508 (37.4) | 0.78 (0.63, 0.96) * | 0.90 (0.72, 1.11) | — |
| Meat | ||||
| Any | 948 (37.1) | 1.00 | 1.00 | — |
| None | 890 (38.8) | 0.88 (0.75, 1.03) | 1.02 (0.86, 1.21) | — |
| Dark green leafy vegetables | ||||
| Any | 1,128 (37.7) | 1.00 | 1.00 | — |
| None | 710 (38.1) | 0.80 (0.68, 0.94) ** | 1.00 (0.84, 1.18) | — |
| Other provitamin A‐rich fruits and vegetablesg | ||||
| Any | 978 (36.8) | 1.00 | 1.00 | — |
| None | 859 (39.2) | 0.85 (0.71, 1.02) | 1.07 (0.88, 1.29) | — |
| Other fruits and vegetables | ||||
| Any | 1,450 (37.4) | 1.00 | 1.00 | — |
| None | 388 (39.6) | 0.79 (0.64, 0.96) * | 1.26 (1.00, 1.58) * | — |
| Dietary diversity score | ||||
| ≥4 | 1,571 (37.6) | 1.00 | 1.00 | — |
| <4 | 267 (39.7) | 0.74 (0.59, 0.92) ** | 1.21 (0.93, 1.56) | — |
| Breastfed in previous week | ||||
| Yes | 868 (36.1) | 1.00 | 1.00 | 1.00 |
| No | 970 (39.7) | 1.27 (1.10, 1.46) ** | 0.79 (0.65, 0.95) * | 0.76 (0.63, 0.92) ** |
| Health services received in past 12 months: | ||||
| DPT (ever received ≥1 dose) | ||||
| Yes | 1,739 (37.7) | 1.00 | 1.00 | — |
| No | 85 (40.7) | 1.14 (0.79, 1.64) | 1.08 (0.74, 1.58) | — |
| Participation in growth monitoring | ||||
| Yes | 328 (33.6) | 1.00 | 1.00 | — |
| No | 1,506 (38.9) | 1.35 (1.10, 1.65) ** | 0.94 (0.76, 1.18) | — |
| Received deworming tabletsh | ||||
| Yes | 1,510 (40.6) | 1.00 | 1.00 | — |
| No | 321 (28.7) | 0.52 (0.42, 0.63) *** | 0.92 (0.73, 1.17) | — |
| Received vitamin A (≥1 dose)h | ||||
| Yes | 1,626 (38.9) | 1.00 | 1.00 | — |
| No | 206 (31.4) | 0.65 (0.51, 0.82) *** | 1.10 (0.85, 1.43) | — |
| Visited by female community health volunteer | ||||
| Yes | 463 (41.2) | 1.00 | 1.00 | — |
| No | 1,375 (36.9) | 1.13 (0.92, 1.39) | 1.08 (0.87, 1.35) | — |
| Went to any health facility | ||||
| Yes | 1,494 (38.0) | 1.00 | 1.00 | — |
| No | 344 (37.2) | 0.95 (0.78, 1.15) | 0.83 (0.68, 1.01) | — |
| Individual‐level factors: mothers | ||||
| Maternal age (years) | ||||
| <20 | 78 (34.7) | 1.00 | 1.00 | 1.00 |
| 20–29 | 1,217 (37.3) | 1.12 (0.78, 1.60) | 0.82 (0.56, 1.20) | 0.87 (0.59, 1.28) |
| ≥30 | 535 (39.7) | 1.16 (0.79, 1.68) | 0.75 (0.50, 1.13) | 0.76 (0.51, 1.15) |
| Maternal height | ||||
| Not low (≥145 cm) | 1,493 (35.1) | 1.00 | 1.00 | 1.00 |
| Low (<145 cm) | 336 (58.3) | 3.08 (2.43, 3.92) *** | 3.12 (2.43, 4.02) *** | 2.52 (1.96, 3.25) *** |
| Maternal weight | ||||
| Not low (≥45 kg) | 813 (31.2) | 1.00 | 1.00 | 1.00 |
| Low (<45 kg) | 1,016 (45.7) | 1.95 (1.66, 2.28) *** | 2.06 (1.74, 2.44) *** | 1.63 (1.37, 1.93) *** |
| Maternal mid‐upper arm circumference | ||||
| Not low (≥22.5 cm) | 1,198 (34.3) | 1.00 | 1.00 | — |
| Low (<22.5 cm) | 630 (46.8) | 1.60 (1.34, 1.90) *** | 1.70 (1.42, 2.05) *** | — |
| Maternal pregnancy status | ||||
| Not pregnant | 1,612 (37.2) | 1.00 | 1.00 | — |
| Pregnant | 205 (42.9) | 1.21 (0.94, 1.55) | 1.04 (0.80, 1.35) | — |
| Maternal education | ||||
| Graduated secondary | 83 (20.3) | 1.00 | 1.00 | 1.00 |
| Some secondary | 297 (29.3) | 1.74 (1.23, 2.46) ** | 1.73 (1.20, 2.48) ** | 1.52 (1.06, 2.17) * |
| Primary | 231 (39.4) | 2.68 (1.84, 3.91) *** | 2.55 (1.72, 3.78) *** | 2.14 (1.45, 3.16) *** |
| None | 1,217 (43.1) | 2.88 (2.07, 4.00) *** | 2.69 (1.90, 3.81) *** | 2.09 (1.48, 2.96) *** |
| Child care knowledge scorei | ||||
| ≥16 | 92 (29.1) | 1.00 | 1.00 | — |
| 11–15 | 716 (35.5) | 1.38 (0.98, 1.93) | 1.37 (0.96, 1.95) | — |
| 5–10 | 942 (40.2) | 1.94 (1.37, 2.76) *** | 1.84 (1.27, 2.65) *** | — |
| <5 | 64 (46.4) | 2.97 (1.69, 5.20) *** | 2.69 (1.49, 4.84) *** | — |
| Household‐level factors: socioeconomic | ||||
| Head of household gender | ||||
| Male | 1,368 (38.3) | 1.00 | 1.00 | 1.00 |
| Female | 470 (36.8) | 0.86 (0.72, 1.04) | 0.75 (0.62, 0.91) ** | 0.78 (0.64, 0.95)* |
| Children younger than 5 years in household | ||||
| 1 | 781 (33.7) | 1.00 | 1.00 | 1.00 |
| 2 | 771 (41.1) | 1.39 (1.17, 1.64) *** | 1.46 (1.22, 1.75) *** | 1.38 (1.15, 1.66) *** |
| ≥3 | 654 (43.7) | 1.71 (1.32, 2.22) *** | 2.06 (1.56, 2.73) *** | 1.91 (1.44, 2.52) *** |
| Expenditure quintile | ||||
| 1st (highest) | 263 (29.7) | 1.00 | 1.00 | 1.00 |
| 2nd | 336 (32.6) | 1.21 (0.94, 1.56) | 1.20 (0.92, 1.56) | 1.11 (0.85, 1.46) |
| 3rd | 343 (36.5) | 1.37 (1.06, 1.78) * | 1.40 (1.06, 1.83) * | 1.33 (1.02, 1.74) * |
| 4th | 386 (43.0) | 1.66 (1.27, 2.17) *** | 1.68 (1.27, 2.23) *** | 1.54 (1.16, 2.04) ** |
| 5th (lowest) | 510 (46.6) | 1.84 (1.40, 2.41) *** | 1.88 (1.42, 2.50) *** | 1.68 (1.27, 2.24) *** |
| Household food insecurity | ||||
| None | 960 (34.4) | 1.00 | 1.00 | — |
| Mild | 364 (40.4) | 1.18 (0.96, 1.45) | 1.13 (0.91, 1.41) | — |
| Moderate | 372 (44.9) | 1.48 (1.18, 1.85) ** | 1.36 (1.07, 1.72) * | — |
| Severe | 140 (42.0) | 1.39 (1.01, 1.91) * | 1.36 (0.97, 1.91) | — |
| Remittances received by household in past year | ||||
| Yes | 617 (36.6) | 1.00 | 1.00 | — |
| No | 1,221 (38.5) | 1.19 (1.00, 1.42) * | 1.23 (1.02, 1.47) * | — |
| Household‐level factors: water, sanitation, and hygiene | ||||
| Main source of drinking waterj | ||||
| Protected | 1,658 (36.8) | 1.00 | 1.00 | — |
| Not protected | 180 (51.9) | 1.18 (0.79, 1.76) | 1.18 (0.77, 1.80) | — |
| Location of child defecationk | ||||
| Not open | 541 (33.0) | 1.00 | 1.00 | — |
| Open | 1,292 (40.3) | 1.18 (0.98, 1.41) | 1.09 (0.90, 1.33) | — |
| Animals inside house or kitchen | ||||
| No | 1,134 (35.2) | 1.00 | 1.00 | — |
| Yes | 704 (43.1) | 1.16 (0.97, 1.40) | 1.14 (0.94, 1.38) | — |
| Human or animal feces observable in house or near compound | ||||
| No | 762 (34.3) | 1.00 | 1.00 | — |
| Yes | 1,075 (40.9) | 1.07 (0.90, 1.27) | 1.05 (0.87, 1.26) | — |
| Rubbish observable in house or near compound | ||||
| No | 792 (33.2) | 1.00 | 1.00 | — |
| Yes | 1,045 (42.4) | 1.35 (1.14, 1.60) ** | 1.30 (1.08, 1.55) ** | — |
| Household‐level factors: agricultural production | ||||
| Any household crop productionl | ||||
| >5 crops | 803 (39.0) | 1.00 | 1.00 | — |
| 1–5 crops | 453 (40.7) | 1.16 (0.94, 1.44) | 1.13 (0.90, 1.42) | — |
| None | 582 (34.6) | 1.39 (1.11, 1.72) ** | 1.36 (1.08, 1.71) ** | — |
| Household sold any cropsm | ||||
| Any | 604 (37.2) | 1.00 | 1.00 | — |
| None | 1,234 (38.2) | 1.19 (1.00, 1.42) * | 1.14 (0.95, 1.37) | — |
| Land area cultivated by household | ||||
| >0.5 hectares | 573 (38.5) | 1.00 | 1.00 | — |
| ≤0.5 hectares | 780 (39.5) | 1.12 (0.93, 1.36) | 1.09 (0.89, 1.34) | — |
| None | 490 (35.0) | 1.43 (1.14, 1.80) ** | 1.38 (1.08, 1.75) ** | — |
| Any household expenditure on agricultural inputsn | ||||
| Any | 1,068 (38.7) | 1.00 | 1.00 | — |
| None | 759 (36.8) | 1.28 (1.07, 1.52) ** | 1.26 (1.05, 1.51) * | — |
| Community‐level factors | ||||
| Agroecologic zone | ||||
| Mountains | 336 (39.6) | 1.00 | 1.00 | 1.00 |
| Hills | 445 (38.7) | 0.90 (0.51, 1.59) | 0.92 (0.51, 1.63) | 1.34 (0.80, 2.23) |
| Terai | 1,057 (37.0) | 0.92 (0.53, 1.60) | 0.94 (0.54, 1.64) | 0.74 (0.46, 1.18) |
| VDC infrastructure | ||||
| More developedo | 1,602 (36.1) | 1.00 | 1.00 | 1.00 |
| Less developed | 236 (56.5) | 2.65 (1.43, 4.89) ** | 2.66 (1.42, 4.96) ** | 2.38 (1.36, 4.14) ** |
Note.AOR = adjusted odds ratio, CI = confidence interval, DPT = diphtheria, pertussis, tetanus vaccine, FFQ = food frequency questionnaire, OR = odds ratio, VDC = village development committees.
All analyses utilize mixed effects models, including agroecological zone as a fixed effect, and VDC/ward and household cluster as random effects to control for hierarchical clustering in the study design. Unadjusted and adjusted odds ratios (OR and AOR) with 95% confidence intervals are reported. Covariate information is missing for less than 1% of children.
Denominators for stunting prevalence associated with each risk factor are reported in Table 1.
Adjusted models include maternal age, child age, child sex, and household expenditure quintile regardless of statistical significance to account for residual confounding.
Risk factors that were significant (p < 0.05) in individual adjusted regressions (Model 2) were included in a multiple logistic regression; risk factors that remained significant in the multiple logistic regressions were included in a final, parsimonious model (Model 3; N = 4,808). Dashes indicate the variable was not included in the final model.
Acute respiratory infection includes productive cough and greater or equal to 1 of the following: fever, rapid breathing, grunting, and/or chest‐in drawing.
Starchy staples include rice, maize, wheat, millet, and potatoes.
Vitamin A‐rich fruits and vegetables include carrots, ripe pumpkin, ripe mango, ripe papaya and ripe jackfruit.
Does not include provision of supplement and/or tablet for treatment.
Number of correct answers out of 18 given regarding breastfeeding, complementary feeding, and treatment of child illness.
Protected sources include a ring well, tube well and/or borehole, piped water, or bottled water; unprotected sources include a stone tap, stream, river, pond, canal, or unprotected ring well.
Open defecation includes an open field, outdoors, or in a body of water; not open defecation includes a toilet or diapers.
Number of different crops produced in the rainy and dry season of previous year.
Sold any proportion of field crops produced in the rainy and dry season of the previous year.
Agricultural inputs include seed or fertilizer.
More developed infrastructure includes paved roads, a hospital, or a bazaar.
p value ≤ .05.
p value ≤ .01.
p value ≤ .001.
3.3.1. Individual‐level factors: Child
With the exception of child age and wasting, most child‐level factors showed weak or null associations with child stunting. Older children were increasingly more likely to be stunted shown by children 12–23 and 24–59 months of age being over three and four times (95% CI > 1) more likely to be stunted than those 6–11 months, respectively, in unadjusted analyses; these associations were further strengthened after full adjustment. In all models, wasted children were 50% more likely to be stunted (95% CI > 1) than nonwasted children. Although morbidity in the previous month generally showed positive associations with stunting, after adjustment, these relationships were only weakly significant for high fever and purulent eye infection.
Age was a strong confounder in several of the relationships between child‐level factors and stunting risk. Intake of several individual food groups (starchy staples, oil, fish, dark green leafy vegetables, and other fruits groups), higher dietary diversity, and the receipt of vitamin A or deworming pills were associated with an increased risk of stunting in unadjusted analyses (ORs ranged from 0.50 to 0.80, 95% CI < 1). After controlling for age, however, these factors were associated with a decreased risk of stunting, although none were significant in the final model. Age was also a strong confounder in the relationship between stunting and breastfeeding. Prior to age adjustment, children not breastfed were 27% (95% CI > 1) more likely to be stunted but, after age adjustment, were 24% less likely to be stunted (95% CI > 1). This counterintuitive relationship is driven by the high prevalence of children aged 24–59 months in our sample and the negative association between breastfeeding and stunting among this age group, AOR: 0.71, 95% CI < 1 (Table S1).
3.3.2. Individual‐level factors: mothers
In our study population, indicators related to women's nutritional status and educational attainment were clear risk factors of stunting. In unadjusted analyses, children of short (<145 cm), low weight (<45 kg), and thin women (MUAC < 22.5) were 1.6–3 times (95% CI > 1) more likely to be stunted, while children of mothers not formally educated or mothers that lacked knowledge of appropriate child care practices (e.g. feeding and treatment for illness) were 3 times (95% CI > 1) more likely to be stunted. After full adjustment, only mother's height, weight, and educational attainment were significant predictors of stunting, although the strength of associations were somewhat attenuated. Neither maternal age nor pregnancy status showed an association with child stunting.
3.3.3. Household‐level factors: socioeconomic and WASH
In unadjusted analyses, children from larger households, those with lower monthly expenditure, moderate or severe food insecurity, or that did not receive remittances in the past year were 19–71% more likely to be stunted (95% CI > 1). Children from households with unhygienic environments or unprotected drinking water were 7–35% more likely to be stunted than children living in more sanitary environments, although only the presence of rubbish around the household was significantly associated with stunting. Additionally, after adjusting for household expenditure, we found children from female‐headed households were approximately 25% less likely (95% CI < 1) to be stunted than those from male‐headed households. In the final adjusted model, however, only household size, head of household gender, and monthly expenditure remained significantly associated with childhood stunting.
3.3.4. Household‐level factors: agricultural production
Overall, children from households not cultivating any land or growing or selling any crops appeared 1.2–1.4 times more likely to be stunted in adjusted analyses; although none of the agricultural factors examined were significant in the final model. Although all of Nepal is largely agrarian, the economy in the terai is particularly farm‐driven. To examine whether the relationships between stunting and the crop‐growing factors were modified by agroecology, we performed additional analyses stratified by region (Tables S2 and S3). In the terai only, children's likelihood of stunting increased by 33 to 90% in nonproducing households compared to those producing crops, selling their crops, and cultivating more land (95% CI > 1 for all). Similarly, children from households not purchasing fertilizer or seeds were 42% more likely to be stunted than those from households purchasing these agricultural inputs (95% CI > 1). In contrast, associations were largely null or negative, although statistically insignificant, in the mountains or hills.
3.3.5. Community‐level factors: agroecology and infrastructure
In our sample, no differences were found in stunting likelihood by agroecology, whereas the available infrastructure in communities proved to be one of the strongest predictors. Children's risk of stunting doubled if they resided in VDCs lacking paved roads, a market, or a hospital compared to more developed communities (95% CI > 1); this relationship was unaffected by adjustment.
4. DISCUSSION
In this study, we identified multilevel determinants of stunting in children 6–59 months of age in Nepal, using data from the first panel of a nationally representative random sample, balanced by agroecology, from the PoSHAN Community Studies. In our study, stunting prevalence was 38% in children 6–59 months of age. Our findings echo the 41% stunting prevalence estimated by the 2011 Nepal DHS (Ministry of Health and Population, 2012) and reflect a continued decline from 57% in 2006 and 49% in 2011. Nevertheless, stunting prevalence still remains high, underscoring the need to identify and address underlying causes of chronic child undernutrition.
At the individual‐level, maternal factors, rather than child factors, were generally the most robust predictors of child stunting. In accordance with other studies, low‐maternal weight and short stature indicative of poor maternal nutritional status, had particularly strong associations with child stunting (Acharya et al., 2013; Pramod Singh et al., 2009). Undernutrition and poor linear growth can have a lasting intergenerational effect, as children from short or underweight mothers are significantly more likely to suffer from intrauterine growth restriction (IUGR) and small‐for‐gestational age (SGA) at birth (Kozuki et al., 2015; Victora et al., 2015; Young et al., 2015; Goto, 2016). Meta‐analyses have further shown that following IUGR, growth faltering often continues, and children born SGA are over two times more likely to be stunted by age 5 (Christian et al., 2013; Xie et al., 2016). Indicators of IUGR were not examined in our study as formal medical care, and birth records are typically unavailable as most children are born at home. The DHS uses mothers' perception of size at birth as a proxy for low‐birth weight and SGA, which faces challenges in reliability and accuracy, particularly for older children, given the long‐recall period between birth and data collection (Ministry of Health and Population, 2012). For these reasons, we did not collect low‐birth weight and SGA in this study. Nevertheless, in Nepal where SGA prevalence climbs above 50% in some areas (Tielsch et al., 2007; Vaidya et al., 2008; Ministry of Health and Population, 2012), maternal undernutrition and its persistent, negative life cycle effects help explain the association between maternal nutritional status and child stunting.
Beyond maternal undernutrition, lower maternal educational attainment was also strongly associated with child stunting; this finding is consistent with results from numerous other studies conducted in Nepal and elsewhere (Semba et al., 2008; Pramod Singh et al., 2009; Abuya, Onsomu, Kimani, & Moore, 2011; Ruwali, 2011; Abuya, Ciera, & Kimani‐Murage, 2012; Paudel et al., 2012; Acharya et al., 2013; Leroy, Habicht, Gonzalez de Cossio, & Ruel, 2014; Tiwari et al., 2014). The pathway linking poor maternal education to child stunting is complex and unclear; although, it is hypothesized that the relationship is mediated in part by the higher likelihood of poverty, reduced allocation of resources to health services, poorer health knowledge, and suboptimal childcare and feeding practices associated with low‐maternal education (Glewwe, 1999; Joshi, Agho, Dibley, Senarath, & Tiwari, 2012b; Senarath et al., 2012; Gautam, Adhikari, Khatri, & Devkota, 2016). In our study, lower maternal educational attainment was strongly correlated with poorer knowledge of appropriate care practices (data not shown). Moreover, among uneducated mothers, there was a trend of decreased stunting risk among children whose mothers had greater knowledge of appropriate care practices (data not shown), presenting a potential opportunity for a nutrition education intervention targeted to uneducated women. Nevertheless, there are a myriad of mechanisms through which maternal education influences child nutritional status, and future studies should examine these pathways in greater depth.
Additionally, although our findings generally did not show an association with stunting and dietary intake in the previous week, prolonged breastfeeding (beyond 24 months) was associated with increased stunting risk. Prolonged breastfeeding has been associated with low‐maternal education and household wealth in India and likely reflects limited knowledge of appropriate feeding behaviors or inadequate food access (Malhotra, Noheria, Amir, Ackerson, & Subramanian, 2008; Arnold, Parasuraman, Arokiasamy, & Kothari, 2009). Children continuing to breastfeed beyond 24 months may not be meeting their energy and nutrient requirements if breastmilk is replacing rather than complementing appropriate foods after 6 months of age, particularly if children are ill (Marquis, Habicht, Lanata, Black, & Rasmussen, 1997). In other studies, investigators have suggested that providing counseling regarding proper nutrition and optimal feeding practices to more uneducated households and complementary foods to food insecure households could help improve nutritional outcomes (Bhutta et al., 2008; Dewey & Adu‐Afarwuah, 2008; Imdad, Yakoob, & Bhutta, 2011). Future analyses should further examine the relationship between childcare and feeding practices and stunting in greater depth in order to identify whether similar interventions would be appropriate and effective in Nepal.
At the household‐level, we identified a strong inverse relationship between stunting risk and household wealth and access to resources, as has been reported widely elsewhere (Hong & Mishra, 2006; Mostafa, 2011; Tiwari et al., 2014; Corsi, Mejia‐Guevara, & Subramanian, 2015). Impoverished households are less likely to have sufficient access to the resources necessary to ensure children's health. In our study, children living in poorly developed communities lacking basic infrastructure including paved roads, hospitals, or permanent bazaars were at a 200% greater risk of stunting than children in developed VDCs. Unsurprisingly, half of the children living in these undeveloped VDCs were also from the most impoverished families (data not shown).
The evidence linking poor WASH practices with child malnutrition is growing (Spears, Ghosh, & Cumming, 2013; Ngure et al., 2014; Rah et al., 2015). This relationship is thought to be mediated through increased pathogen exposure, leading to more frequent infection and inflammation, which in turn diminishes appetite, impairs intestinal functioning and nutrient absorption, and increases nutrient losses (Dewey & Mayers, 2011b). Additionally, chronic intestinal inflammation associated with frequent exposure to fecal matter and unsanitary living conditions may also contribute to stunting as the inflamed gut becomes more permeable to pathogens, resulting in chronic systemic immune activation, which in turn suppresses growth hormone production (Humphrey, 2009; Prendergast et al., 2014). In our study, more unhygienic environments were generally associated with an increased likelihood of stunting, although none were significant in the final model. However, our findings may owe in part to the transient nature of many of the WASH variables (e.g., presence of rubbish or animal feces in the home). Households may have been miscategorized if interviewers did not witness these transient, unhygienic, factors on the day of the home visit, which in turn could weaken the relationship of these factors with stunting.
Although WASH factors were not strongly associated with stunting in our study, we observed a higher likelihood of stunting among children suffering from high fever and eye infection in the 30 days than their healthy counterparts. To explore these relationships further, we examined the association between stunting and morbidity in the previous week. Overall, approximately half of those children with diarrhea, high fever, acute respiratory infection, or purulent ear or eye infection in the previous month suffered illness in the previous week (data not shown). However, illness in the previous week was not significantly associated with stunting, possibly due to the short recall period in relation to child growth trajectories. Future analyses may consider the frequency of illness episodes to assess whether stunting is related to more chronic or repeated illness. The association with stunting and morbidity could, however, also reflect reverse causation, where undernourished children are more susceptible to infection (Calder & Jackson, 2000). Regardless, in our population, the concomitant high prevalence of wasting, caused by periods of acute infection and/or inadequate food intake, and stunting, may reflect an inability to fully recover from episodic assaults to nutritional status (Richard et al., 2012; Martorell & Young, 2012).
As has been reported elsewhere, fewer children from female‐headed households were stunted than those in male‐headed households despite the higher likelihood of female‐headed households to be impoverished, food insecure, and practice unhygienic behaviors (data not shown; Johnson & Rogers, 1993; Rogers, 1996). However, female‐headed households also tended to be smaller, were more likely to receive remittances, had more mothers making decisions regarding their children's health, and had more children who received health services (data not shown). At the aggregate level, receipt of health services was not a significant predictor of stunting. In part, the null association between receipt of health services and stunting may reflect the wide reference period used for receipt of health services (e.g., any participation in growth‐monitoring program during the previous year), and more recent use of health services may be more strongly associated with stunting. Nevertheless, greater utilization of health services by female‐headed households may reflect better childcare practices or increased targeting of female‐headed households during health outreach efforts (United Nations Children's Fund, 2012). Future studies should aim to identify the protective factors evident in female‐headed households.
In our sample, adequate food access was not a robust predictor of child stunting. Associations between food insecurity and child stunting have been mixed in Nepal overall (Osei et al., 2010; Ruwali, 2011; Paudel et al., 2012; Singh & Ram, 2014). This may owe in part to the recall period of the household food insecurity index score, which is assessed over the past 30 days from the time of interview. Given that stunting is a process that may occur over many months or even years, we found that a month long recall of food insecurity may have limited our ability to capture any causal association between chronic food insecurity and child stunting. Given the complexity of the pathways linking socioeconomic status to food security to nutritional status, there is also the possibility of unmeasured confounding (Osei et al., 2010; Ali et al., 2013). For example, a study in Cambodia observed greater maternal thinness with increasing food insecurity, but no association with food insecurity and child undernutrition. The authors hypothesized that in food insecure households, food was preferentially allocated to children over mothers (McDonald et al., 2015). In our study population, further analyses revealed a clear dose response between maternal thinness (MUAC < 22.5 cm) and greater household food insecurity (data not shown), suggesting a similar prioritization of child over maternal health may occur in Nepal. Future analyses should continue to explore the pathway from food insecurity to child nutritional outcomes in greater depth.
Agriculture is the primary occupation in Nepal and acts as an important source of income and food for families (Joshi, Conroy & Witcombe, 2012a). We found that agricultural households in the terai growing more crops, cultivating more land, or selling their crops were less likely to have stunted children. However, no associations, or even somewhat negative associations were found with agricultural productivity and stunting in the mountains and hills. As cultivable land area and productivity is higher in the terai, farming households in this area may be more dependent on agriculture for their income, producing and selling more of their crops (Joshi et al., 2012a). In contrast, farming in the mountains and hills may be used to supplement income and food purchases made in markets rather than acting as a primary income source, thereby diminishing the relationship between crop production and stunting. Another study from Nepal showed that increasing overall agricultural yield was associated with decreased stunting risk; whereas, greater household consumption of crops produced as opposed to selling crops was associated with increased stunting risk (Shively & Sununtnasuk, 2015). A study in sub‐Saharan Africa revealed greater diversity in agricultural production (versus increased overall agricultural production) was associated with a significantly higher HAZ scores in children 24–59 months of age but not in younger children (Kumar, Harris, & Rawat, 2015). Variable construction for agricultural production diversity, child age cutoffs, and how nutritional status outcomes are defined are important considerations when discerning the varying results of this relationship across studies and contexts.
A myriad of risk factors contribute to the high‐stunting prevalence in Nepal, many of which interact to create an environment that is not conducive to optimal linear growth and perpetuate the transgenerational cycle of undernutrition. In our study, we examined multilevel determinants of stunting to attempt to untangle some of this complexity. Some limitations of our study included its cross‐sectional nature and our inability to determine causal relationships. Moreover, not all of our data (e.g. 7‐day food intake frequency) reflected the etiologically relevant time point for stunting, whereas other risk factors may have been weakened by wide reference periods (e.g., participation in a growth‐monitoring program in the previous year). Nevertheless, we were able to report persistent patterns, practices, and living conditions that contribute to child stunting. Some of the overarching risk factors of stunting we identified, such as poverty and limited community infrastructure, and the intergenerational effects of maternal undernutrition may not be rapidly modifiable; however, areas for more in‐depth future research and possible interventions also emerged, including identifying protective factors against stunting in female‐headed households, providing education on optimal feeding, and childcare practices to uneducated mothers, educating girls, and improving agricultural productivity in the terai. Moreover, the nationally and agroecologically representative nature of the PoSHAN communities enables more generalizability in our findings to assist the planning of interventions, programs, and policies, aiming to reduce stunting and improve child health nationwide.
CONFLICTS OF INTEREST
The authors declare that they have no conflict of interest.
CONTRIBUTION
RK and KW designed the study, JD led data analysis, JD, SM, KW, and RK led data interpretation, and JD and SM led manuscript writing. JD, SN, and BS led data management. All authors have read and approve the final manuscript.
Supporting information
Supporting info item
ACKNOWLEDGMENTS
This work was undertaken as part of the Feed the Future Innovation Lab for Nutrition, managed by Tufts University's Friedman School of Nutrition Science and Policy and funded by the US Agency for International Development (USAID), Washington DC, under the Cooperative Agreement AID‐OAA‐L‐10‐00005. This study was designed by the Center for Human Nutrition, Department of International Health, Bloomberg School of Public Health, Johns Hopkins University (JHU), and the authors gratefully acknowledge New ERA for their data collection efforts. We also acknowledge and thank the Child Health Division, Department of Health Services, and Ministry of Health and Population of Nepal as well as the district level offices of the 21 selected sites for their overall support of the study. We further acknowledge Dr. Patrick Webb, Dr. Shibani Ghosh and Diplav Sapkota of Tufts University's Friedman School of Nutrition Science and Policy, Dr. Devendra Gauchan of the Nepal Agricultural Research Council, and Dr. Ramesh K. Adhikari of the Institute of Medicine, Tribhuvan University for their supportive roles in conducting this research. We also acknowledge the Feed the Future Innovation Lab for Nutrition study team in Kathmandu‐Dev Mandal Narayan, Hari Krishna Shah and especially Abhigyna Bhattarai for field and training supervision, and Ruchita Rajbhandary and Dev Raj Gautam for data analysis and data management support. Finally, we gratefully acknowledge the households, families, and communities who provided consent to be part of this study.
Dorsey JL, Manohar S, Neupane S, Shrestha B, Klemm RDW, West KP Jr. Individual, household, and community level risk factors of stunting in children younger than 5 years: Findings from a national surveillance system in Nepal. Matern Child Nutr. 2018;14:e12434 10.1111/mcn.12434
REFERENCES
- Abuya, B. A. , Onsomu, E. O. , Kimani, J. K. , & Moore, D. (2011). Influence of maternal education on child immunization and stunting in Kenya. Maternal and Child Health Journal, 15, 1389–1389. [DOI] [PubMed] [Google Scholar]
- Abuya, B. A. , Ciera, J. , & Kimani‐Murage, E. (2012). Effect of mother's education on child's nutritional status in the slums of Nairobi. BMC Pediatrics, 12, 80. [DOI] [PMC free article] [PubMed] [Google Scholar]
- Acharya, D. , Gautam, S. , Kaphle, H. P. , & Naupane, N. (2013). Factors associated with nutrition status of under‐five children in Rupandehi district of Nepal. Journal of Health and Applied Sciences Nepal, 3, 56–59. [Google Scholar]
- Ali, D. , Saha, K. K. , Nguyen, P. H. , Diressie, M. T. , Ruel, M. T. , Menon, P. , & Rawat, R. (2013). Household food insecurity is associated with higher child undernutrition in Bangladesh, Ethiopia, and Vietnam, but the effect is not mediated by child dietary diversity. Journal of Nutrition, 143, 2015–2021. [DOI] [PubMed] [Google Scholar]
- Arnold, F. , Parasuraman, S. , Arokiasamy, P. , & Kothari, M . (2009). Nutrition in India: National Family Health Survey (NFHS‐3), India, 2005‐06. International Institute for Population Sciences & ICF Macro: Mumbai, India; Calverton, Maryland.
- Bhutta, Z. A. , Ahmed, T. , Black, R. E. , Cousens, S. , Dewey, K. , Giugliani, E. , … Shekar, M. (2008). What works? Interventions for maternal and child undernutrition and survival. The Lancet 371, 417–440. [DOI] [PubMed] [Google Scholar]
- Black, R. E. , Victora, C. G. , Walker, S. P. , Bhutta, Z. A. , Christian, P. , de Onis, M. , … Uauy, R. (2013). Maternal and child undernutrition and overweight in low‐income and middle‐income countries. The Lancet, 382, 427–451. [DOI] [PubMed] [Google Scholar]
- Calder, P. C. , & Jackson, A. (2000). Undernutrition, infection, and immune function. Nutrition Research Reviews, 13, 3–29. [DOI] [PubMed] [Google Scholar]
- Campbell, R. K. , Talegawkar, S. A. , Christian, P. , LeClerq, S. C. , Khatry, S. K. , Wu, L. S. , & West, K. P. Jr. (2014). Seasonal dietary intakes and socioeconomic status among women in the terai of Nepal. Journal of Health, Population and Nutrition, 32, 198–216. [PMC free article] [PubMed] [Google Scholar]
- Campbell, R. K. , Talegawkar, S. A. , Christian, P. , LeClerq, S. C. , Khatry, S. K. , Wu, L. S. , … West, K. P. Jr. (2015). Evaluation of a novel single‐administration food frequency questionnaire for assessing seasonally varied dietary patterns among women in rural Nepal. Ecology of Food and Nutrition, 54, 314–327. [DOI] [PubMed] [Google Scholar]
- Christian, P. , Lee, S. E. , Donahue, A. M. , Adair, L. S. , Arifeen, S. E. , Ashorn, P. , … Black, R. E. (2013). Risk of childhood undernutrition related to small‐for‐gestational age and preterm birth in low‐ and middle‐income countries. International Journal of Epidemiology, 42, 1340–1355. [DOI] [PMC free article] [PubMed] [Google Scholar]
- Coates, J. , Swindale, A. , & Bilinksy, P. (2007). Household food insecurity access scale (HFIAS) for measurement of food access: Indicator guide. FHI360/FANTA: Washington, DC.
- Corsi, D. J. , Mejia‐Guevara, I. , & Subramanian, S. V. (2015). Risk factors for chronic undernutrition among children in India: Estimating relative importance, population attributable risk and fractions. Social Science and Medicine, 157, 165–185. [DOI] [PubMed] [Google Scholar]
- Devkota, M. D. , Adhikari, R. K. , & Upreti, S. R. (2016). Stunting in Nepal: Looking back, looking ahead. Maternal & Child Nutrition, 12(suppl 1), 257–259. [DOI] [PMC free article] [PubMed] [Google Scholar]
- Dewey, K. G. , & Adu‐Afarwuah, S. (2008). Systematic review of the efficacy and effectiveness of complementary feeding interventions in developing countries. Maternal and Child Nutrition, 4(Supp 1), 24–85. [DOI] [PMC free article] [PubMed] [Google Scholar]
- Dewey, K. G. , & Begum, K. (2011a). Long‐term consequences of stunting in early life. Maternal and Child Nutrition, 7(Supp 3), 5–18. [DOI] [PMC free article] [PubMed] [Google Scholar]
- Dewey, K. G. , & Mayers, D. R. (2011b). Early child growth: How do nutrition and infection interact? Maternal and Child Nutrition, 7(Suppl 3), 129–142. [DOI] [PMC free article] [PubMed] [Google Scholar]
- Fenske, N. , Burns, J. , Hothorn, T. , & Rehfuess, E. A. (2013). Understanding child stunting in India: A comprehensive analysis of socio‐economic, nutritional and environmental determinants using additive quantile regression. PloS One, 8, e78692. [DOI] [PMC free article] [PubMed] [Google Scholar]
- Gautam, K. P. , Adhikari, M. , Khatri, R. B. , & Devkota, M. D. (2016). Determinants of infant and young child feeding practices in Rupandehi, Nepal. BMC Research Notes, 9, 135. [DOI] [PMC free article] [PubMed] [Google Scholar]
- Glewwe, P. (1999). Why does mother's schooling raise child health in developing countries? Evidence from Morocco. The Journal of Human Resources, 34, 124–159. [Google Scholar]
- Goto, E. (2016). Dose‐response association between maternal body mass index and small for gestational age: A meta‐analysis. The Journal of Maternal‐Fetal & Neonatal Medicine, 22, 1–25. [DOI] [PubMed] [Google Scholar]
- Headey, D. , & Hoddinott, J. (2015). Understanding the rapid reduction of undernutrition in Nepal, 2001‐2011. PloS One, 10, e0145738. [DOI] [PMC free article] [PubMed] [Google Scholar]
- Hong, R. , & Mishra, V. (2006). Effect of wealth inequality on chronic under‐nutrition in Cambodian children. Journal of Health, Population and Nutrition, 24, 89–99. [PubMed] [Google Scholar]
- Humphrey, J. H. (2009). Child undernutrition, tropical enteropathy, toilets, and handwashing. Lancet, 19, 1032–1035. [DOI] [PubMed] [Google Scholar]
- Imdad, A. , Yakoob, M. Y. , & Bhutta, Z. A. (2011). Impact of maternal education about complementary feeding and provision of complementary foods on child growth in developing countries. BMC Public Health, 11(Supp 3), S25. [DOI] [PMC free article] [PubMed] [Google Scholar]
- International Council for Science, & International Social Science Council . (2015). Review of the Sustainable Development Goals: The science perspective. Paris: International Council for Science. [Google Scholar]
- International Food Policy Research Institute . (2015). Global nutrition report 2015: Actions and accountability to advance nutrition and sustainable development. Washington, DC: International Food Policy Research Institute. [DOI] [PMC free article] [PubMed] [Google Scholar]
- Johnson, F. C. , & Rogers, B. L. (1993). Children's nutritional status in female‐headed households in the Dominican Republic. Social Science and Medicine, 37, 1293–1301. [DOI] [PubMed] [Google Scholar]
- Joshi, K. D. , Conroy, C. , & Witcombe, J. R. (2012a). Agriculture, seed, and innovation in Nepal: Industry and policy issues for the future. Washington, DC: International Food Policy Research Institute. [Google Scholar]
- Joshi, N. , Agho, K. E. , Dibley, M. J. , Senarath, U. , & Tiwari, K. (2012b). Determinants of inappropriate complementary feeding practices in young children in Nepal: Secondary data analysis of Demographic and Health Survey 2006. Maternal and Child Nutrition, 8(Supp 1), 45–59. [DOI] [PMC free article] [PubMed] [Google Scholar]
- Kennedy, G. , Ballard, T. , & Dop, M. C. (2011). Guidelines for measuring household and individual dietary diversity. Food and Agriculture Organization: Rome. [Google Scholar]
- Kozuki, N. , Katz, J. , Lee, A. C. , Vogel, J. P. , Silveira, M. F. , Sania, A. , … Black, R. E. (2015). Short maternal stature increases risk of small‐for‐gestational age and preterm births in low‐ and middle‐income countries: individual participant data meta‐analysis and population attributable fraction. Journal of Nutrition, 145, 2542–2550. [DOI] [PMC free article] [PubMed] [Google Scholar]
- Kumar, N. , Harris, J. , & Rawat, R. (2015). If they grow it, will they eat and grow? Evidence from Zambia on agricultural diversity and child undernutrition. Journal of Development Studies, 51, 1060–1077. [Google Scholar]
- Leroy, J. L. , Habicht, J. P. , Gonzalez de Cossio, T. , & Ruel, M. T. (2014). Maternal education mitigates the negative effects of higher income on the double burden of child stunting and maternal overweight in rural Mexico. Journal of Nutrition, 144, 765–770. [DOI] [PubMed] [Google Scholar]
- Malhotra, R. , Noheria, A. , Amir, O. , Ackerson, L. K. , & Subramanian, S. V. (2008). Determinants of termination of breastfeeding within the first 2 years of life in India: Evidence from the National Family Health Survey‐2. Maternal and Child Nutrition, 4, 181–193. [DOI] [PMC free article] [PubMed] [Google Scholar]
- Marquis, G. S. , Habicht, J. P. , Lanata, C. F. , Black, R. E. , & Rasmussen, K. M. (1997). Association of breastfeeding and stunting in Peruvian toddlers: An example of reverse causality. International Journal of Epidemiology, 26, 349–356. [DOI] [PubMed] [Google Scholar]
- Martorell, R. , & Young, M. F. (2012). Patterns of stunting and wasting: Potential explanatory factors. Advances in Nutrition, 3, 22–233. [DOI] [PMC free article] [PubMed] [Google Scholar]
- McDonald, C. M. , McLean, J. , Kroeun, H. , Talukder, A. , Lynd, L. D. , & Green, T. J. (2015). Household food insecurity and dietary diversity among correlates of maternal and child undernutrition in rural Cambodia. European Journal of Clinical Nutrition, 69, 242–246. [DOI] [PubMed] [Google Scholar]
- Ministry of Health and Population, New ERA, ICF International . (2012). Nepal Demographic and Health Survey 2011. International Institute for Population Sciences & ICF Macro: Kathmandu, Nepal; Calverton, MD.
- Mostafa, K. S. (2011). Socio‐economic determinants of severe and moderate stunting among under‐five children of Rural Bangladesh. Malaysian Journal of Nutrition, 17, 105–118. [PubMed] [Google Scholar]
- National Planning Commission . (2012). Multi‐sector nutrition plan for accelerating the reduction of maternal and child undernutrition in Nepal. Government of Nepal: Kathmandu. [Google Scholar]
- National Planning Commission, & Central Bureau of Statistics . (2013). Nepal thematic report on food security and nutrition 2013. National Planning Commission: Kathmandu. [Google Scholar]
- Ngure, F. M. , Reid, B. M. , Humphrey, J. H. , Mbuya, M. N. , Pelto, G. , & Stoltzfus, R. J. (2014). Water, sanitation, and hygiene (WASH), environmental enteropathy, nutrition, and early child development: Making the links. Annals of the New York Academy of Sciences, 1308, 118–128. [DOI] [PubMed] [Google Scholar]
- Osei, A. , Pandey, P. , Spiro, D. , Nielson, J. , Shrestha, R. , Talukder, Z. , … Haselow, N. (2010). Household food insecurity and nutritional status of children aged 6 to 23 months in Kailali District of Nepal. Food and Nutrition Bulletin, 4, 483–494. [Google Scholar]
- Paudel, R. , Pradhan, B. , Wagle, R. R. , Pahari, D. P. , & Onta, S. R. (2012). Risk factors for stunting among children: A community based case control study in Nepal. Kathmandu University Medical Journal, 10, 18–24. [DOI] [PubMed] [Google Scholar]
- Pramod Singh, G. C. , Nair, M. , Grubesic, R. B. , & Connell, F. A. (2009). Factors associated with underweight and stunting among children in rural terai of eastern Nepal. Asia‐Pacific Journal of Public Health, 21, 144–152. [DOI] [PubMed] [Google Scholar]
- Prendergast, A. J. , Rukobo, S. , Chasekwa, B. , Mutasa, K. , Ntozini, R. , Mbuya, M. N. , … Humphrey, J. H. (2014). Stunting is characterized by chronic inflammation in Zimbabwean infants. PloS One, 9, e86928. [DOI] [PMC free article] [PubMed] [Google Scholar]
- Rah, J. H. , Cronin, A. A. , Badgaiyan, B. , Aguayo, V. M. , Coates, S. , & Ahmed, S. (2015). Household sanitation and personal hygiene practices are associated with child stunting in rural India: A cross‐sectional analysis of surveys. BMJ Open, 5, e005180. [DOI] [PMC free article] [PubMed] [Google Scholar]
- Restrepo‐Mendez, M. C. , Barros, A. J. D. , Black, R. E. , & Victora, C. G. (2015). Time trends in socio‐economic inequalities in stunting prevalence: Analyses of repeated national surveys. Public Health Nutrition, 18, 2097–2104. [DOI] [PMC free article] [PubMed] [Google Scholar]
- Richard, S. A. , Black, R. E. , Gilman, R. H. , Guerrant, R. L. , Kang, G. , Lanata, C. F. , … Checkley, W. (2012). Wasting is associated with stunting in early childhood. Journal of Nutrition, 142, 1291–1296. [DOI] [PMC free article] [PubMed] [Google Scholar]
- Rogers, B. L. (1996). The implications of female household headship for food consumption and nutritional status in the Dominican Republic. World Development, 24, 113–128. [Google Scholar]
- Ruwali, D. (2011). Nutritional status of children under five years of age and factors associated in Padampur VDC, Chitwan. Health Prospect, 10, 14–15. [Google Scholar]
- Semba, R. D. , de Pee, S. , Sun, K. , Sari, M. , Akhter, N. , & Bloem, M. W. (2008). Effect of parental formal education on risk of child stunting in Indonesia and Bangladesh: A cross‐sectional study. The Lancet, 371, 322–328. [DOI] [PubMed] [Google Scholar]
- Senarath, U. , Agho, K. E. , Godakandage, S. S. , Hazir, T. , Jayawickrama, H. , Joshi, N. , … Dibley, M. J. (2012). Comparisons of complementary feeding indicators and associated factors in children 6‐23 months across five South Asian countries. Maternal and Child Nutrition, 8(Supp 1), 89–106. [DOI] [PMC free article] [PubMed] [Google Scholar]
- Shively, G. , & Sununtnasuk, C. (2015). Agricultural diversity and child stunting in Nepal. The Journal of Development Studies, 51, 1078–1096. [Google Scholar]
- Singh, A. , & Ram, F. (2014). Household food insecurity and nutritional status of children and women in Nepal. Food and Nutrition Bulletin, 35, 3–11. [DOI] [PubMed] [Google Scholar]
- Spears, D. , Ghosh, A. , & Cumming, O. (2013). Open defecation and childhood stunting in India: An ecological analysis of new data from 112 districts. PloS One, 8, e73784. [DOI] [PMC free article] [PubMed] [Google Scholar]
- Tielsch, J. M. , Darmstadt, G. L. , Mullany, L. C. , Khatry, S. K. , Katz, J. , LeClerq, S. C. , … Adhikari, R. (2007). Impact of newborn skin‐cleansing with chlorohexidine on neonatal mortality in southern Nepal: A community‐based, cluster‐randomized trial. Pediatric, 119, e330–e340. [DOI] [PMC free article] [PubMed] [Google Scholar]
- Tiwari, R. , Ausman, L. M. , & Agho, K. E. (2014). Determinants of stunting and severe stunting among under‐fives: Evidence from the 2011 Nepal Demographic and Health Survey. BMC Pediatrics, 27, 239. [DOI] [PMC free article] [PubMed] [Google Scholar]
- United Nations Children's Fund, & Government of Nepal . (2012). Country programme action plan 2013–2017. Kathmandu: United Nations Children's Fund. [Google Scholar]
- United Nations Children's Fund , World Health Organization , & The World Bank . (2015). Levels and trends in child malnutrition: 2015 edition In UNICEF: New York; World Health Organization: Geneva). Washington DC: The World Bank. [Google Scholar]
- Vaidya, A. , Saville, N. , Shrestha, B. P. , Costello, A. M. , Manandhar, D. S. , & Osrin, D. (2008). Effects of antenatal multiple micronutrient supplementation on children's weight and size at 2 years of age in Nepal: Follow up a double‐blind randomised controlled trial. The Lancet, 371, 492–499. [DOI] [PMC free article] [PubMed] [Google Scholar]
- Victora, C. G. , Villar, J. , Barros, F. C. , Ismail, L. C. , Chumlea, C. , Papageorghiou, A. T. , … Kennedy, S. H. (2015). Anthropometric characterization of impaired fetal growth: Risk factors for and prognosis of newborns with stunting or wasting. JAMA Pediatrics, 169, e151431. [DOI] [PubMed] [Google Scholar]
- World Health Organization Multicentre Growth Reference Study Group . (2006). WHO child growth standards based on length/height, weight and age. Acta Paediatrica. Supplement, 450, 76–85. [Google Scholar]
- Xie, C. , Epstein, L. H. , Eiden, R. D. , Shenassa, E. D. , Li, X. , Liao, Y. , & Wen, X. (2016). Stunting at 5 years among SGA newborns. Pediatrics, 137, 1–10. [DOI] [PubMed] [Google Scholar]
- Young, M. F. , Nguyen, P. H. , Addo, O. Y. , Hao, W. , Nguyen, H. , Pham, H. , … Ramakrishnan, U. (2015). The relative influence of maternal nutritional status before and during pregnancy on birth outcomes in Vietnam. European Journal of Obstetrics, Gynecology, and Reproductive Biology, 194, 223–222. [DOI] [PubMed] [Google Scholar]
Associated Data
This section collects any data citations, data availability statements, or supplementary materials included in this article.
Supplementary Materials
Supporting info item