

Abstract
There is controversy about fish‐oil supplementation and oxidative damage. This ambiguity should be explored to elucidate its role as modulator of oxidative stress, especially during gestation and postnatal life. This is the objective of this study. One hundred ten pregnant women were divided in two groups: control group CT (400 mL/day of the control dairy drink); supplemented group FO (400 mL/day of the fish oil‐enriched dairy drink (±400‐mg EPA‐DHA/day)). Different biomarkers of oxidative damage were determined in the mother's at enrolment, at delivery and at 2.5 and 4 months postpartum and newborns at delivery and at 2.5 months postpartum. Omega‐3 LC‐PUFA supplementation during pregnancy and lactation decreased plasma hydroperoxides especially in newborn at delivery (P = 0.001) and 2.5 months (P = 0.006), increased superoxide dismutase (SOD) and catalase (CAT) in mothers at delivery (P = 0.024 (SOD)) and after 2.5 months (P = 0.040 (CAT)) and in newborns at 2.5 months (P = 0.035 (SOD); P = 0.021 (CAT)). Also, supplementation increased α‐tocoferol in mothers at 2.5 months (P = 0.030) and in umbilical cord artery (P = 0.039). Higher levels of CoQ10 were found in mothers at delivery (P = 0.039) as well as in umbilical cord vein (P = 0.024) and artery (P = 0.036). Our supplementation prevents the oxidative stress in the mother and neonate during the first months of postnatal life, being a potential preventive nutritional strategy to prevent functional alterations associated with oxidative stress that have an important repercussion for the neonate development in the early postnatal life.
Keywords: docosahexaenoic acid (DHA), n‐3 fatty acids, pregnancy, infant development, oxidative stress, antioxidant defence
Introduction
There are numerous studies available in the scientific literature revealing the importance of docosahexaenoic acid (DHA) for a correct development of the neonates (Innis & Friesen 2008; Hui‐Min 2010; Smithers et al. 2011). Most of these studies are focused in mother's DHA consumption during pregnancy and the offspring's cognitive performance (Makrides et al. 2010; Poston et al. 2011; Campoy et al. 2012; Larqué et al. 2012; De Giuseppe et al. 2014). Nevertheless, there are other interesting effects of the dietary supplement with DHA that have not been deeply studied, for example, oxidative stress, a crucial factor for newborn development, aspect that should be elucidated (Ochoa et al. 2003, 2007).
Studies in vitro show that the polyunsaturation is directly correlated with higher susceptibility to lipid peroxidation, therefore DHA is highly susceptible to this aggression (Di Nunzio et al. 2011). Nevertheless, the studies with omega‐3 LC‐PUFA in this regard show contradictory results. Some studies show an antioxidant effect in the prevention of many chronic diseases (Bouzidi et al. 2010; Vericel et al. 2015), but, in others studies, report a pro‐oxidative effect increasing oxidative stress (Mas et al. 2010; Cai et al. 2014). It has been suggested that its antioxidant or pro‐oxidant effects depend on the dose and the oxidative stress and/or antioxidant defence of the subject (Shoji et al. 2009; Di Nunzio et al. 2011; Hajjaji & Bougnoux 2013). Therefore, this dual behaviour of DHA should be explored, especially in those situations in which oxidative stress and antioxidant defence are impaired, as occurs during gestation and labour (Ochoa et al. 2007; Díaz‐Castro et al. 2014).
Nevertheless, the studies about the effect of DHA supplementation on the oxidative stress evoked in the mother and neonate are really scarce. In the scientific literature an in vitro study is available (Shoji et al. 2009) and also in animals (Yavin 2006; Boulis et al. 2014). With regard to the mother supplementation, the few existing studies have been focused on the supplementation during the gestation (Barden et al. 2004; Shoji et al. 2006; García‐Rodríguez et al. 2012; Pietrantoni et al. 2014), while those performed in neonates were focused on the effect of supplemented formulae (Daisy et al. 2003). Therefore the data available is limited and contradictory, provided that some of them reported absence of effects (Shoji et al. 2006) or a slightly antioxidant effect in the mother (Barden et al. 2004; García‐Rodríguez et al. 2012) and even a pro‐oxidant effect which is dose dependent (Shoji et al. 2009).
Considering the controversy existing with DHA supplementation and the importance of oxidative stress in neonate, it is essential to know how this supplementation can affect the oxidative/antioxidant status of both the mother and the neonate. Therefore, this study was designed to study for the first time the effect of a dairy drink supplemented with DHA on antioxidant defence and oxidative stress in both, the mother and the newborn during the first stage of the life.
Key messages.
There is controversy about fish‐oil supplementation and its influence in oxidative damage, ambiguity that should be explored, especially during gestation and postnatal life.
Omega‐3 LC‐PUFA supplementation during pregnancy and lactation has beneficial effects on the evoked oxidative stress in mothers during the stage of lactation.
In the neonate, Omega‐3 LC‐PUFA supplementation had beneficial effects in terms of oxidative stress at birth and during first two months of postnatal life.
All these findings suggest a correlation between omega‐3 LC‐PUFA and the evoked oxidative stress in the mother during labor and in the neonate during the early postnatal life.
Methods
Study design and subjects
This study involved a group of mothers and their healthy term neonates enrolled in a registered, double‐blind, controlled, lasting form the sixth month gestation to fourth month of newborn's life. One hundred ten volunteers were recruited into the study from ‘Hospital Materno‐Infantil’ (Granada, Spain) and ‘Hospital Universitario Materno‐Infantil’ (Canary Islands, Spain). The inclusion criteria for the mother–child pair were: no presence of disease that affects the development of gestation or lactation, singleton gestation, body mass index of 18–30 kg/m2 at the start of pregnancy, weight gain of 8–12 kg since pregnancy onset, normal course of pregnancy, no intake of DHA supplements, spontaneous vaginal delivery, gestational age at delivery of 38–42 weeks, an appropriate weight for gestational age, Apgar index ≥ 7 and breastfeeding of the neonate. The flowchart for participant enrolment and drop‐outs is shown in Fig. 1. The study was approved by the Bioethical Committee on Research Involving Human Subjects at both Hospitals. The study is registered at http://www.clinicaltrials.gov (Clinical Trial Identifier NCT01947426).
Figure 1.
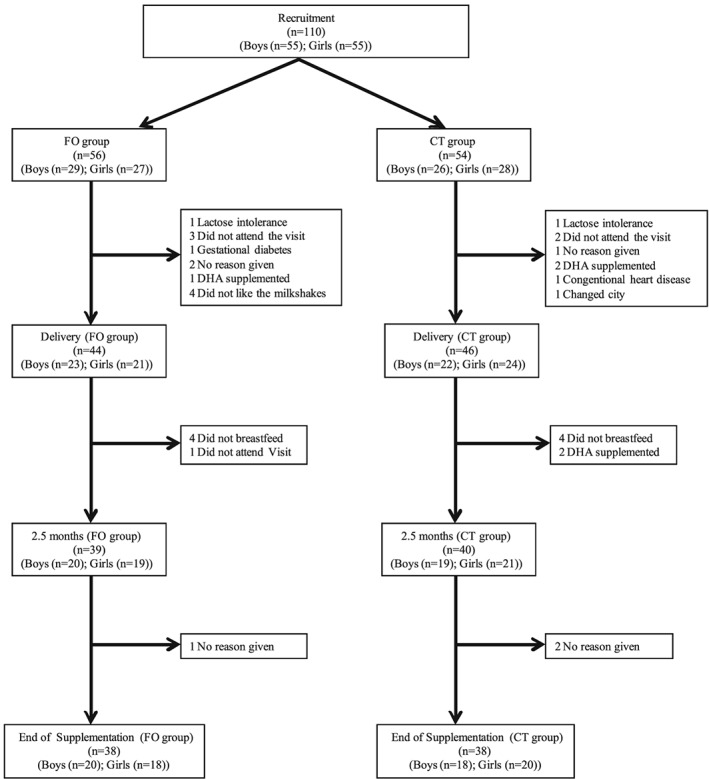
Flow chart showing participant progress and drop‐out in the study.
Women were randomly assigned to one of the following intervention groups following an unpredictable sequence computer‐generated: Fish oil group (FO): Consumption of 400 mL/day of fish oil enriched dairy drink; Control Group (CT): Consumption of 400 mL/day of the control dairy drink. Detailed information on the composition of the dairy drink is given in Table 1. The dairy products were distributed in white packing without any indication reflecting the type of product containing (double blind). The dietary intervention began in the 28th week of pregnancy and concluded at fourth month of lactation.
Table 1.
Composition of the dairy drinks used during the study
| Fish oil drink | Control drink | |
|---|---|---|
| Energy (kcal‐kJ/100 mL) | 58‐145 | 58‐145 |
| Protein (g/100 mL) | 3.7 | 3.7 |
| Carbohydrates (g/100 mL) | 6.7 | 6.7 |
| Fats (g/100 mL) | 1.8 | 1.8 |
| Saturated (g/100 mL) | 0.32 | 0.36 |
| Monounsaturated (g/100 mL) | 1.06 | 1.10 |
| Polyunsaturated (g/100 mL) | 0.42 | 0.34 |
| EPA (mg/100 mL) | 18 | ‐ |
| DHA (mg/100 mL) | 80 | ‐ |
| Folic Acid (µg/100 mL) | 80 | 80 |
| Vitamin B12 (µg/100 mL) | 0.4 | 0.4 |
| Vitamin C (mg/100 mL) | 9.0 | 9.0 |
| Vitamin D (µg/100 mL) | 0.75 | 0.75 |
| Vitamin E (mg/100 mL) | 1.5 | 1.5 |
| Calcium (mg/100 mL) | 160 | 160 |
| Iron (mg/100 mL) | 2.2 | 2.2 |
| Iodine (µg/100 mL) | 23.0 | 23.0 |
Ascertainment of mother's dietary intake
An important confounder in this kind of trials is the diet, and therefore, we supervised the mother's diet during the intervention period. Maternal dietary intake was recorded using a 110‐item food frequency questionnaire (Parra‐Cabrera et al. 2011; García‐Rodríguez et al. 2012) together with a 72‐h diet record, in the moment of the recruitment, a month after beginning the study and at first month of lactation. Nutritional recommendations adapted to the conditions of the mothers (gestation–lactation) were given and especially those related to the suitable consumption of fish (2/3 portions per week as daily sources of EPA+ DHA), something really important from an ethical point of view.
Blood sampling and measurements
Samples of mothers' blood (5 mL) were obtained at the enrollment (28th week of pregnancy) (M0), at delivery (M1), at 2.5 months of lactation (M2) and at the end of the dietetic intervention (M3). After delivery blood samples were collected from the umbilical vein and arteries (NOV and NOA, respectively) and from neonate at 2.5 months of life (N1). The samples were centrifuged to separate plasma and erythrocytes. Erythrocyte cytosolic and membrane fractions were prepared according to the method of Hanahan & Ekholm (1974).
Plasma hydroperoxide content was assessed using a commercial kit (Oxystat, Biomedica Gruppe, Vienna, Austria). Erythrocyte membrane hydroperoxides were assessed according to the method previously described by Ochoa et al. (2003).
Fat soluble antioxidants in plasma (retinol, α‐Tocoferol, β‐Carotene, Coenzyme Q9 and Coenzyme Q10) and erythrocyte membrane (α‐Tocoferol and Coenzyme Q10) were also determined. The equipment used was an ACQUITY UPLC H‐Class detector coupled to a triple quadrupole Xevo TQ‐S (Waters Corporation, Milford, USA). All the parameters studied were optimized individually using standard solutions from Sigma‐Aldrich (minimum 98% purity, Grade HPLC) and quantified with standard curves. MassLynx 4.1. (Waters Corporation, Milford, USA) software was used to obtain all the data.
Total plasma antioxidant capacity in plasma samples was measured using a kit (TAS Randox® kit, Randox Laboratories Ltd., Crumlin, UK).
Determinations of antioxidant enzymes, Glutathione Peroxidase (GPx), Superoxide dismutase (SOD) and Catalase (CAT) in erythrocyte cytosol were measured as previously described Díaz‐Castro et al. (2014).
Statistical analysis
On the basis of our main aim and according to the results previously reported (Hurtado et al. 2015), to detect a difference in DHA levels in mother's plasma of 2.26, with a standard deviation of 1.43, using a power of 87% and a significance level of 0.05, we needed 45 mothers per group. This amount is increased by 20%, taking into account possible dropouts, so the final sample size was 55 per group. All data are presented as the Mean ± SEM. All variables were tested to see if they followed the criteria of normality and homogeneity of variance using the Kolmogorov‐Smirnoff's and Levene's tests, respectively. To compare categorical variables we used chi‐squared test. U‐Mann Whitney non‐parametric test was used to find differences between groups for variables not normally distributed and unpaired Student's t test for variables normally distributed. In these statistical treatments a value of P < 0.05 was considered significant. To assess the effect of the evolution in the time of each variable studied in each experimental group, an analysis of variance for repeated measures with an adjustment by means of Bonferroni's test has been performed. For data analysis we used the SPSS version 20.0 (SPSS Statistics for Windows, 20.0.0. SPSS INC. Chicago, IL, USA).
Results
No statistically significant differences were found in the age, height, weight and biochemical parameters of the volunteers participating in the study (Table 2). Concerning Newborns, there were no statistically significant differences in anthropometric parameters between groups. The dropout percentage was similar in both groups (29% CT group and 32% FO group) (Fig. 1).
Table 2.
Characteristics of the mothers and their neonates
| FO group | CT group | ||
|---|---|---|---|
| Mothers | |||
| Age (years) | 30.5 ± 4.8 | 29.9 ± 4.7 | |
| Weight (kg) | 71.7 ± 11.5 | 73.2 ± 12.3 | |
| Length (cm) | 163.2 ± 6.3 | 164.2 ± 6.5 | |
| BMI | 26.9 ± 4.1 | 27.2 ± 4.6 | |
| Parity | Uni (%) | 64.4 % | 68.2 % |
| Multi (%) | 35.6 % | 31.8 % | |
| Weight gaining | 7.4 ± 2.8 | 7.0 ± 2.8 | |
| SBP (mm Hg) | 107.2 ± 8.7 | 110.5 ± 12.3 | |
| DBP (mm Hg) | 64.3 ± 6.5 | 65.5 ± 8.1 | |
| Haemoglobin (g/L) | 11.8 ± 0.8 | 11.7 ± 1.0 | |
| Haematocrit (%) | 34.4 ± 2.5 | 34.4 ± 2.5 | |
| Glucose (g/dL) | 102.5 ± 34.0 | 101.2 ± 29.2 | |
| Cholesterol | 253.2 ± 41.1 | 257.3 ± 39.2 | |
| Triglycerides | 157.7 ± 42.2 | 169.2 ± 72.5 | |
| Neonates | |||
| Gestational age (weeks) | 39.3 ± 1.8 | 39.6 ± 1.5 | |
| Gender | Boys (%) | 47.9 % | 51.9 % |
| Girls (%) | 52.1 % | 48.1 % | |
| Apgar 1 | 8.7 ± 0.7 | 8.6 ± 0.8 | |
| Apgar 2 | 9.0 ± 0.4 | 8.9 ± 0.5 | |
| Weight (kg) | 3.3 ± 0.5 | 3.2 ± 0.5 | |
| Height (cm) | 50.0 ± 2.5 | 50.2 ± 2.7 | |
| Craneal perimeter (cm) | 34.0 ± 1.5 | 34.1 ± 1.4 | |
| Weight gaining first year | 6.3 ± 0.9 | 6.6 ± 0.9 | |
| Height increase first year | 24.7 ± 2.4 | 25.3 ± 2.6 | |
| Craneal perimeter increase (first year) | 12.6 ± 6.3 | 11.92 ± 2.0 |
Values are means ± SEM. SBP (systolic blood pressure); DBP (diastolic blood pressure).
The analysis of both food frequency questionnaire and 72‐h diet record revealed no differences between groups (data not shown). No statistical differences were observed in the three nutritional surveys performed to the mothers during the study.
Plasma and erythrocyte membrane hydroperoxides are shown in Fig. 2 (plasma (Fig. 2A) and erythrocyte membrane (Fig. 2B)). Plasma hydroperoxides decreased in control and supplemented mothers at 2.5 months of lactation (M2) and at the end of the dietetic intervention (M3) in comparison with 28th week of pregnancy (M0), and delivery (M1) and increased in both groups of neonates at 2.5 months of life (N1) in comparison with blood samples from the umbilical vein and arteries (NOV and NOA, respectively). For both groups, the highest concentrations of plasma hydroperoxides were recorded during pregnancy (enrollment) and at delivery with a decreased postpartum, at 2.5 months and 4 months. In umbilical cord samples, concentrations of peroxides are lower to those found in their mother, although increased at 2.5 months of life. We found significant differences between groups (supplemented vs. control), with the lower concentrations in the experimental group in mothers at 2.5 months postpartum (329.02 ± 18.16 µmol/L vs. 417.58 ± 29.08 µmol/L; P = 0.006) in umbilical cord artery (51.70 ± 3.83 µmol/L vs. 84.65 ± 7.04 µmol/L; P = 0.001) and at 2.5 months of neonate's life (246.16 ± 21.92 µmol/L vs. 333.33 ± 29.23 µmol/L; P = 0.006).
Figure 2.
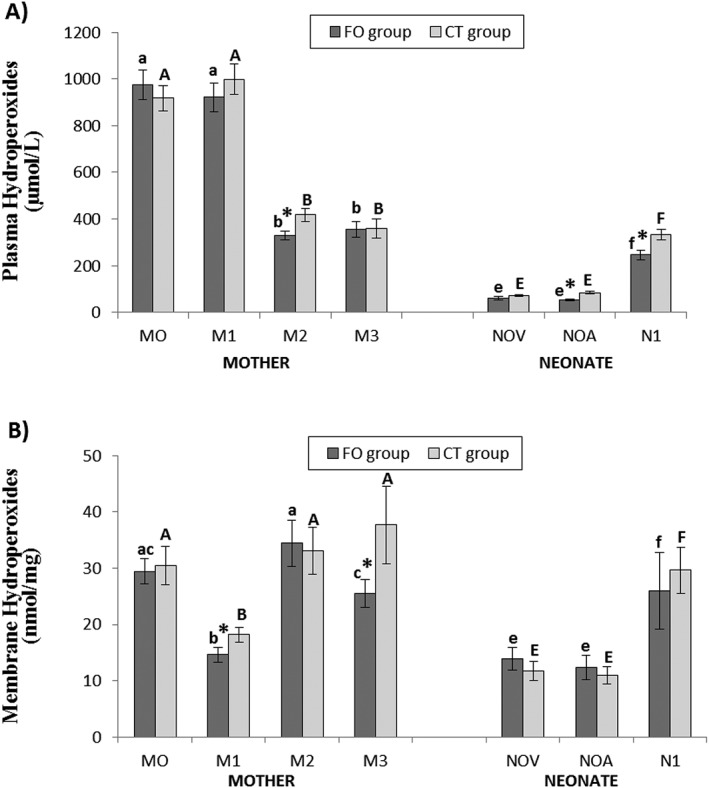
Hydroperoxide levels in plasma (A) and erythrocyte membrane (B) of mothers and their neonates. Values are means ± S.E.M. * means statistically significant differences between groups (P < 0.05). Different letters in every group indicate significant differences because of the time in the mothers and in the neonates (CT group: mother (A, B, C, D), newborn (E, F, G); FO group: mother (a, b, c, d), newborn (e, f, g) (adjustment by Bonferroni's test). M0: at recruitment; M1: at delivery; M2: at 2.5 months postpartum; M3: at 4 months postpartum; NOV: umbilical cord vein; NOA: umbilical cord artery; N1: at 2.5 months of life.
Erythrocyte membrane hydroperoxides decreased in both groups of mothers at delivery (M1) in comparison with 28th week of pregnancy (M0), 2.5 months of lactation (M2) and end of the dietetic intervention (M3), and increased in both groups neonates at 2.5 months of life (N1) in comparison with blood samples from the umbilical vein and arteries (NOV and NOA, respectively). In general, we found the lowest values in the mothers at birth, as well as in umbilical cord samples. Regarding to differences between groups (supplemented vs. control), we found statistically significant differences only in mothers, at labour (14.63 ± 1.28 nmol/mg vs. 18.18 ± 1.30 nmol/mg; P = 0.040) and at fourth month at postpartum (25.52 ± 2.44 nmol/mg vs. 37.68 ± 6.86 nmol/mg; P = 0.042).
Total antioxidant capacity decreased in control and supplemented mothers at delivery (M1) in comparison with M0, M2 and M3 and a decreased was observed in non‐supplemented neonates at 2.5 months in comparison with NOV and NOA. The highest antioxidant values (Fig. 3) were found in mothers at enrollment and during lactation (at 2.5 months and 4 months postpartum). Regarding to neonates we observed lower antioxidant capacity compared with mothers. We found a significant difference between groups (supplemented vs. control) at delivery (3.15 ± 0.14 nmol/mL vs. 3.66 ± 0.14 nmol/mL; P = 0.006) and at 2.5 months of life of newborn's life (1.72 ± 0.11 nmol/mL vs. 1.28 ± 0.08 nmol/mL; P = 0.001).
Figure 3.
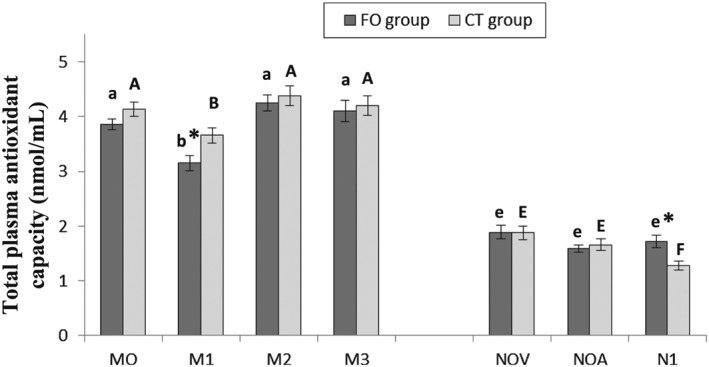
Total antioxidant status in plasma. Values are means ± S.E.M. * means statistically significant differences between groups (P < 0.05). Different letters in every group indicate significant differences because of the time in the mothers and in the neonates (CT group: mother (A, B, C, D), newborn (E, F, G); FO group: mother (a, b, c, d), newborn (e, f, g) (adjustment by Bonferroni's test). M0: at recruitment; M1: at delivery; M2: at 2.5 months postpartum; M3: at 4 months postpartum; NOV: umbilical cord vein; NOA: umbilical cord artery; N1: at 2.5 months of life.
Plasma fat soluble antioxidants in mothers and their neonates are shown in Table 3. Retinol increased in M2 and M3 with regard to M0 and M1 in both groups of mothers, while no effect of time was observed in neonates. In both groups, we found higher retinol levels in mothers at 2.5 and 4 months postpartum. We observed significant differences between the control group and the fish oil supplemented group, in mothers at 2.5 months postpartum (P = 0.031) and in newborn's umbilical cord vein (P = 0.034).
Table 3.
Plasma fat soluble antioxidants in mother and their neonates
| Mother | Neonate | ||||||
|---|---|---|---|---|---|---|---|
| M0 | M1 | M2 | M3 | NOV | NOA | N1 | |
| Retinol (µmol/L) | |||||||
| FO Group | 1.85 ± 0.10a | 1.93 ± 0.17a | 5.71 ± 0.29b * | 5.06 ± 0.21b | 1.84 ± 0.11e * | 1.71 ± 0.15e | 1.84 ± 0.16e |
| CT Group | 1.68 ± 0.12A | 1.89 ± 0.18A | 4.61 ± 0.30B | 4.71 ± 0.25B | 1.55 ± 0.09E | 1.53 ± 0.18E | 1.68 ± 0.15E |
| α‐Tocopherol (µmol/L) | |||||||
| FO Group | 24.31 ± 0.97a | 26.07 ± 2.19ab | 26.37 ± 0.91a * | 23.36 ± 0.84b | 6.09 ± 0.56e * | 6.29 ± 0.57e * | 15.39 ± 1.47f |
| CT Group | 25.73 ± 1.46A | 27.00 ± 2.54AB | 23.12 ± 1.22AB | 22.38 ± 1.18B | 4.97 ± 0.24E | 4.75 ± 0.59E | 14.89 ± 1.95F |
| β‐Carotene (µmol/L) | |||||||
| FO Group | 0.59 ± 0.09a | 0.52 ± 0.06a | 1.29 ± 0.18b * | 1.40 ± 0.20b * | 0.14 ± 0.05e | 0.07 ± 0.01e | 0.61 ± 0.20f |
| CT Group | 0.67 ± 0.11AB | 0.56 ± 0.08A | 0.94 ± 0.12B | 0.92 ± 0.11B | 0.09 ± 0.01E | 0.08 ± 0.01E | 0.59 ± 0.26F |
| Coenzyme Q9 (nmol/L) | |||||||
| FO Group | 43.45 ± 3.19a | 39.81 ± 3.44a | 36.87 ± 3.27a | 30.51 ± 1.74b | 7.13 ± 0.74e | 8.16 ± 0.29e * | 15.11 ± 2.23f |
| CT Group | 43.11 ± 2.86A | 37.03 ± 2.85AB | 37.18 ± 5.03AB | 30.97 ± 2.25B | 6.55 ± 0.26E | 7.07 ± 0.34E | 17.30 ± 2.91F |
| Coenzyme Q10 (µmol/L) | |||||||
| FO Group | 0.92 ± 0.02a | 0.95 ± 0.09a | 0.69 ± 0.09b | 0.66 ± 0.04b * | 0.16 ± 0.02e * | 0.16 ± 0.03e | 0.71 ± 0.04f * |
| CT Group | 0.92 ± 0.06A | 0.93 ± 0.06A | 0.63 ± 0.03B | 0.56 ± 0.03B | 0.12 ± 0.01E | 0.13 ± 0.01E | 0.59 ± 0.05F |
| n‐3 PUFA | 1.23 ± 0.41* | 1.72 ± 0.55 | |||||
Values are means ± S.E.M.
means statistically significant differences between groups (P < 0.05). Different letters in every group indicate significant differences because of the time in the mothers and in the neonates (CT group: mother (A, B, C, D), newborn (E, F, G); FO group: mother (a, b, c, d), newborn (e, f, g) (adjustment by Bonferroni's test). M0: at recruitment; M1: at delivery; M2: at 2.5 months postpartum; M3: at 4 months postpartum; NOV: umbilical cord vein; NOA: umbilical cord artery; N1: at 2.5 months of life.
α‐Tocopherol decreased in neonates at 2.5 months of life (N1) in comparison with blood samples from the umbilical vein and arteries (NOV and NOA). α‐Tocopherol concentrations found in mothers were higher than those found in newborns, especially compared with umbilical cord blood samples. Regarding statistically significant differences between groups, we observed differences in mothers at 2.5 months postpartum (P = 0.017), as well as in newborn's umbilical cord vein (P = 0.041) and artery (P = 0.035).
β‐Carotene increased in both groups of mothers in M2 and M3 with regard to M0 and also in control mothers in M2 and M3 with regard to M1 and also in neonates at 2.5 months of life (N1) in comparison with blood samples from the umbilical vein and arteries (NOV and NOA). β‐Carotene values followed a similar pattern than retinol. We found really low values in neonate (umbilical cord blood); however, both groups showed an increase at 2.5 months of newborn's life. We found significant differences only in mothers at postpartum, at 2.5 months (P = 0.042), as well as at 4 months postpartum (P = 0.039).
CoQ9 and CoQ10 decreased progressively in both groups of mothers when comparing M0 with the subsequent samples. CoQ 10 was lower in M1, M2 and M3 with regard to M0 in both groups. However, in neonates (control and supplemented), we found an increase in CoQ9 and CoQ10 in NOV and NOA in comparison with N1. With regard to CoQ9 and CoQ10 content, the lower values were found in both groups at 4 month after birth. The values found in umbilical cord are much lower to those found in mother plasma, although in both cases an increase was observed at 2.5 month postpartum. We only found significant differences for CoQ9 in neonate's umbilical cord artery samples (P = 0.010). With regard to CoQ10 in general, we observed greater values in the supplemented group, however statistically significant differences were only observed in mothers at fourth month postpartum (P = 0.037) and in neonate's umbilical cord vein (P = 0.036) as well as at 2.5 months after birth (P = 0.045).
Fat soluble antioxidants in mother and neonate erythrocyte membrane are shown in Table 4. α‐Tocoferol increased progressively in both groups of mothers in M1, M2 and M3 in comparison with M0. In neonates, α‐tocoferol was higher in N1 (supplemented group) in comparison with NOV and NOA and CoQ10 was lower in N1 (supplemented group) in compassion with NOVand NOA. With regard to α‐tocoferol we observed highest values in mothers at 2.5 months as well as at fourth month postpartum. Significant differences between groups were found in mothers at 2.5 months postpartum (P = 0.030) and in neonate umbilical cord artery (P = 0.039). In contrast, we found higher levels of CoQ10 in newborns, particularly in umbilical cord. Significant differences between groups were found in mothers at delivery (P = 0.039) as well as in neonates at birth, in umbilical cord vein (P = 0.024) and artery (P = 0.036).
Table 4.
Erythrocyte membrane fat soluble antioxidants in mother and their neonates
| Mother | Neonate | ||||||
|---|---|---|---|---|---|---|---|
| M0 | M1 | M2 | M3 | NOV | NOA | N1 | |
| α‐Tocopherol (mmol/mg) | |||||||
| FO Group | 0.98 ± 0.10a | 0.43 ± 0.06b | 1.66 ± 1.15c * | 1.98 ± 0.23c | 0.38 ± 0.06e | 0.42 ± 0.07e * | 0.69 ± 0.08f |
| CT Group | 1.06 ± 0.09A | 0.40 ± 0.05B | 1.25 ± 0.15A | 1.78 ± 0.13C | 0.42 ± 0.08EF | 0.27 ± 0.02E | 0.58 ± 0.08F |
| Coenzyme Q10 (pmol/mg) | |||||||
| FO Group | 12.31 ± 0.78a | 15.10 ± 1.26b * | 13.37 ± 1.29ab | 11.95 ± 0.89a | 30.69 ± 3.96e * | 22.29 ± 1.76f * | 18.36 ± 1.45g |
| CT Group | 13.01 ± 0.56A | 12.29 ± 0.91A | 12.30 ± 1.02A | 11.64 ± 0.71A | 20.54 ± 3.05E | 17.91 ± 1.58E | 16.45 ± 1.77E |
| n‐3 PUFA | 1.23 ± 0.41* | 1.72 ± 0.55 | |||||
Values are means ± S.E.M.
means statistically significant differences between groups (P < 0.05). Different letters in every group indicate significant differences because of the time in the mothers and in the neonates (CT group: mother (A, B, C, D), newborn (E, F, G); FO group: mother (a, b, c, d), newborn (e, f, g) (adjustment by Bonferroni's test). M0: at recruitment; M1: at delivery; M2: at 2.5 months postpartum; M3: at 4 months postpartum; NOV: umbilical cord vein; NOA: umbilical cord artery; N1: at 2.5 months of life.
Cytosolic antioxidant enzymes are shown in Table 5. SOD increased in M3 (in both groups of mothers) compared with M0 and M1. With regard to the superoxide dismutase (SOD), in general, both groups showed similar values in mothers and neonates. Significant differences between groups were observed in mothers at delivery (P = 0.024) and in newborns at 2.5 months of life (P = 0.035).
Table 5.
Cytosolic antioxidant enzymes in mothers and their neonates
| Mother | Neonate | ||||||
|---|---|---|---|---|---|---|---|
| M0 | M1 | M2 | M3 | NOV | NOA | N1 | |
| SOD (U/mg) | |||||||
| FO Group | 118.72 ± 8.34a | 130.82 ± 6.78a * | 134.44 ± 8.13ab | 151.55 ± 5.93b | 134.71 ± 9.18e | 150.00 ± 5.68e | 140.09 ± 6.98e * |
| CT Group | 114.67 ± 8.84A | 111.76 ± 6.50A | 124.21 ± 10.51AB | 138.58 ± 7.04B | 128.16 ± 7.70E | 139.06 ± 10.42E | 121.40 ± 7.07E |
| Catalase (U/mg) (µmol/L) | |||||||
| FO Group | 71.64 ± 3.85a | 69.32 ± 2.52a | 74.22 ± 3.43a * | 74.50 ± 8.09a | 70.12 ± 3.98e | 63.86 ± 6.22e | 70.02 ± 3.71e * |
| CT Group | 67.43 ± 3.63A | 74.31 ± 3.63A | 64.87 ± 3.96A | 68.67 ± 9.70A | 65.76 ± 3.16E | 63.53 ± 6.22E | 59.22 ± 3.49E |
| GPx (U/mg) | |||||||
| FO Group | 126.75 ± 6.98a | 139.31 ± 7.16ab | 157.18 ± 7.74bc | 174.96 ± 9.07c | 127.08 ± 11.44e | 124.83 ± 10.98e | 115.50 ± 8.57e |
| CT Group | 133.71 ± 5.74A | 148.00 ± 6.88A | 166.09 ± 5.48B | 170.14 ± 11.90B | 121.92 ± 10.98E | 101.09 ± 8.77E | 109.87 ± 8.64E |
| n‐3 PUFA | 1.23 ± 0.41* | 1.72 ± 0.55 | |||||
Values are means ± S.E.M.
means statistically significant differences between groups (P < 0.05). Different letters in every group indicate significant differences because of the time in the mothers and in the neonates (CT group: mother (A, B, C, D), newborn (E, F, G); FO group: mother (a, b, c, d), newborn (e, f, g) (adjustment by Bonferroni's test). M0: at recruitment; M1: at delivery; M2: at 2.5 months postpartum; M3: at 4 months postpartum; NOV: umbilical cord vein; NOA: umbilical cord artery; N1: at 2.5 months of life.
Similarly to SOD, both groups showed similar values in mothers for CAT activity. We found significant differences between groups in mothers after 2.5 months postpartum (P = 0.040), as well as in neonates at 2.5 months after birth (P = 0.021).
GPx increased in M2 and M3 compared with M1 and also in M2 and M3 compared with M0. With regard to GPx we observed higher values in mothers at 2.5 months and at 4 months postpartum. No differences were found between the supplemented and control group.
Discussion
As we have previously reported (Hurtado et al. 2015), our mother supplementation with omega 3 LC‐PUFA during the gestation and lactation increased the percentage of DHA and other fatty acids of the omega‐3 series in different cell compartments, both in the mother (placenta, plasma, erythrocyte membrane and milk) and in their neonates (plasma and erythrocyte membrane), reason why we have not included information about the mother or neonate fatty acids profile in the current study.
A noteworthy aspect to consider during pregnancy, labour and postnatal life is the oxidative stress affecting both the mother and neonate (Ochoa et al. 2003, 2007; Diaz‐Castro et al. 2015). Hung et al. (2010) reported a maximum peroxides output in mother at delivery and during pregnancy, results in agreement with the current study, also Diaz‐Castro et al. (2015) reported a lower peroxides content in umbilical cord than in plasma of the mothers, findings in agreement with the current study. Omega‐3 LC‐PUFA supplementation decreased hydroperoxides plasma in umbilical cord artery and at 2.5 months (mother and newborn) and reduced peroxide levels in erythrocyte membrane in mothers at delivery and postpartum (4 months). This finding may be because of the effect of the LC‐PUFA on free radical generation and/or on the antioxidant system in the mother and the newborn.
One possible protective mechanism of omega‐3 LC‐PUFA to oxidative stress underlies in the generating mechanisms of free radicals, which includes the inflammatory signalling related to arachidonic acid (AA) (Pietrantoni et al. 2014) and its conversion in eicosanoids, generating free radicals13. In this sense, the possible antioxidant role of DHA can be attributed to its inhibiting action on the AA/eicosanoid production and to the anti‐inflammatory and protective properties of the protectins and resolvins generated via DHA (Pietrantoni et al. 2014). González‐Périz et al. (2006) demonstrated that DHA prevents DNA damage and oxidative stress in liver cells, associated with a decrease in the synthesis of n‐6‐derived eicosanoids, as well as an increase in the generation of protective DHA‐derived lipid mediators.
Another aspect to be taken into account is the effect on the antioxidant defence. Our results show a decrease in the total antioxidant capacity in plasma in both groups with regard to the values obtained during the gestation and the lactation and, in this sense, Diaz‐Castro et al. (2015) reported a decrease in the total antioxidant capacity before the childbirth, with respect to parturition, which coincides, partly, with information obtained in the current study. The main differences between control and supplemented groups were found in mothers at parturition and in the newborn at 2.5 months. The lower value of total antioxidant capacity found in the supplemented mothers at the moment of childbirth, together with the lower peroxides level, especially in erythrocyte membrane could indicate a lower need of antioxidants in the supplemented group, probably because of a lower production of free radicals (Shoji et al. 2009; Hajjaji & Bougnoux 2013; Vericel et al. 2015). Although, we could also consider a higher transfer of antioxidants to the neonate, explaining the lower content in hydroperoxides found in umbilical cord artery of the supplemented group. Newborns are particularly susceptible to oxidative stress for several reasons (Saugstad 2005). Our results show that omega‐3 LC‐PUFA supplementation avoids the decrease of antioxidant capacity at 2.5 months of life in newborns and, in addition, also reduces peroxide levels in plasma.
With regard to the fat soluble antioxidants, there is a lower content in umbilical cord artery and vein, especially α‐tocoferol, a finding which is in agreement with a previous report (Helchowska et al. 2011). We did not find any significant difference in fat soluble antioxidants between the control and the supplemented group in mothers during the last trimester of pregnancy, finding which is in agreement with a previous study in mothers supplemented with salmon (García‐Rodríguez et al. 2012). In this study, the authors only observed significantly higher retinol concentrations in mothers supplemented with salmon during gestation, but this fact was attributed to the great retinol concentration in salmon. Nevertheless, we found significant differences in plasma and membrane samples at 2.5 months postpartum as well as in umbilical cord artery, suggesting that fish oil‐supplementation has positive effects on the neonate, enhancing the antioxidant capacity and reducing the evoked oxidative stress.
After parturition we observed higher levels of retinol, CoQ9 and α‐tocopherol in plasma in the supplemented group at 2.5 months postpartum and β‐carotene and CoQ10 at fourth month postpartum. In erythrocyte membrane, higher values of CoQ10 were found at delivery and α‐tocoferol at 2.5 months postpartum. These data suggest a higher fat soluble antioxidant defence in the supplemented mothers, especially after lactation. Schweigert et al. (2004) reported a significant decrease in α‐tocopherol levels in plasma at 2.5 months postpartum, which is in agreement with our results, although in the supplemented group, this decrease was not observed.
With regard to the newborns, in general, a higher content in retinol, CoQ10 and α‐tocopherol (in plasma and erythrocyte membrane) was observed in the supplemented group. This information indicates, once again, the higher antioxidant defence at the moment of the childbirth in the neonate and this is the moment when the maximum oxidative stress occurs (Saugstad 2005; Ochoa et al. 2007). In the same way, at 2.5 months, a higher CoQ10 content is observed in the supplemented group. All these findings can be correlated with the results found in plasma peroxides, because fish oil‐supplemented group showed a decrease of peroxides in umbilical cord vein and artery, as well as at 2.5 months of newborn's life.
Regarding antioxidant enzymes, both mothers and their neonates showed similar activity. With regard to SOD, in general, the omega‐3 LC‐PUFA supplementation leads to an increase in the activity of this antioxidant enzyme, though it is only significant at the moment of the delivery in the mother and at 2.5 months of postnatal life in the newborn. García‐Rodríguez et al. (2012) did not report any differences in the activity of this enzyme because of the maternal supplementation with two portions of salmon during gestation, though this study was only focused in the gestation period and not during the labour, neither in the newborn. On the other hand, Garrel et al. (2012) observed a significant increase in SOD activity in brain of rats that were fed with a diet rich in DHA, during postnatal development.
With regard to CAT, in the fish oil‐supplemented group, we observed higher values at 2.5 months postpartum in mothers, as well as at 2.5 months of newborn's life. We did not find significant differences for CAT during pregnancy neither the birth, which is in agreement with the results found by Garrel et al. (2012) and García‐Rodríguez et al. (2012).
Regarding to GPx, we did not find significant differences between groups. García‐Rodríguez et al. (2012) found a higher activity GPx in DHA‐supplemented mothers with salmon, though this increased activity was associated with the increase in the levels of selenium, because of the high content of this mineral in salmon. In general, it is noteworthy the effect of the mother supplementation with omega 3 LC‐PUFA in the newborn child at 2.5 months of life on the enzymatic activity of the complex SOD‐CAT, a very interesting finding, because of the importance in the development of the newborn child, because as it has been previously reported, a decrease in the activity of these enzymes promotes the oxidative damage in proteins and lipids (Slater et al. 1987; Saugstad 2005).
Conclusion
Omega‐3 LC‐PUFA supplementation during pregnancy and lactation has beneficial effects on the evoked oxidative stress in mothers, although the most noteworthy effect is recorded in the neonate at birth and during first two months of postnatal life. This finding can be explained because of the higher plasma total antioxidant capacity, the increase in fat soluble antioxidants (especially in umbilical cord artery) and the higher activity of the cytosolic antioxidant enzymes SOD and CAT at 2.5 months of postnatal life. In the mother those effects were more prominent during the stage of lactation. All these findings suggest a correlation between omega‐3 LC‐PUFA and the evoked oxidative stress in the mother during labor and in the neonate during the early postnatal life.
Acknowledgement
The authors express their sincere appreciation to the mothers for their participation.
Source of funding
University of Granada and Ministry of Economy and Competitiviness.
Conflict of interest
The authors declare that they have no conflicts of interest.
Contributions
JJO designed the study. NK, JJO, ML‐F and JD‐C analysed data, did the research, and wrote the manuscript. JAH, LP‐Q, MP, JR, YR‐S, EM‐A, ML‐F, OS, FL‐V included patients and obtained samples
Kajarabille, N. , Hurtado, J. A. , Peña‐Quintana, L. , Peña, M. , Ruiz, J. , Diaz‐Castro, J. , Rodríguez‐Santana, Y. , Martin‐Alvarez, E. , López‐Frias, M. , Soldado, O. , Lara‐Villoslada, F. , and Ochoa, J. J. (2017) Omega‐3 LCPUFA supplement: a nutritional strategy to prevent maternal and neonatal oxidative stress. Maternal & Child Nutrition, 13: e12300. doi: 10.1111/mcn.12300.
References
- Barden A.E., Mori T.A., Dunstan J.A., Taylor A.L., Thornton C.A., Croft K.D. et al. (2004) Fish oil supplementation in pregnancy lowers F2‐isoprostanes in neonates at high risk of atopy. Free Radical Research 38, 233–239. [DOI] [PubMed] [Google Scholar]
- Boulis T.S., Rochelson B., Novick O., Xue X., Chatterjee P.K., Gupta M. et al. (2014) Omega‐3 polyunsaturated fatty acids enhance cytokine production and oxidative stress in a mouse model of preterm labor. Journal of Perinatal Medicine 42, 693–698. [DOI] [PubMed] [Google Scholar]
- Bouzidi N., Mekki K., Boukaddoum A., Dida N., Kaddous A. & Bouchenak M. (2010) Effects of omega‐3 poly unsaturated fatty‐acid supplementation on redox status in chronic renal failure patients with dyslipidemia. Journal of Renal Nutrition 20, 321–328. [DOI] [PubMed] [Google Scholar]
- Cai F., Sorg O., Granci V., Lecumberri E., Miralbell R., Dupertuis Y.M. et al. (2014) Interaction of ω‐3 polyunsaturated fatty acids with radiation therapy in two different colorectal cancer cell lines. Clinical Nutrition 33, 164–170. [DOI] [PubMed] [Google Scholar]
- Campoy C., Escolano‐Margarit M.V., Anjos T., Szajewska H. & Uauy R. (2012) Omega 3 fatty acids on child growth, visual acuity and neurodevelopment. British Journal of Nutrition 107, S85–S106. [DOI] [PubMed] [Google Scholar]
- Daisy E., Kaempf‐Rotzoll G.H. & Otwin L. (2003) Influence of long‐chain polyunsaturated fatty acid formula feeds on vitamin E status in preterm infants. International Journal for Vitamin and Nutrition Research 73, 377–387. [DOI] [PubMed] [Google Scholar]
- De Giuseppe R., Roggi C. & Cena H. (2014) n‐3 LC‐PUFA supplementation: effects on infant and maternal outcomes. European Journal of Nutrition 53, 1147–1154. [DOI] [PubMed] [Google Scholar]
- Di Nunzio M., Valli V. & Bordoni A. (2011) Pro‐ and anti‐oxidant effects of polyunsaturated fatty acid supplementation in HepG2 cells. Prostaglandins, Leukotrienes, and Essential Fatty Acids 85, 121–127. [DOI] [PubMed] [Google Scholar]
- Díaz‐Castro J., Florido J., Kajarabille N., Garrido‐Sánchez M., Padilla C., de Paco C. et al. (2014) The timing of cord clamping and oxidative stress in term newborns. Pediatrics 134, 257–264. [DOI] [PubMed] [Google Scholar]
- Diaz‐Castro J., Florido J., Kajarabille N., Prados S., de Paco C., Ocon O. et al. (2015) A new approach to oxidative stress and inflammatory signaling during labour in healthy mothers and neonates. Oxidative Medicine and Cell Longevity 2015, 178536. [DOI] [PMC free article] [PubMed] [Google Scholar]
- García‐Rodríguez C.E., Mesa M.D., Olza J., Vlachava M., Kremmyda L.S., Diaper N.D. et al. (2012) Does consumption of two portions of salmon per week enhance the antioxidant defense system in pregnant women? Antioxidant Redox Signaling 16, 1401–1406. [DOI] [PubMed] [Google Scholar]
- Garrel C., Alessandri J.M., Guesnet P. & Al‐Gubory K.H. (2012) Omega‐3 fatty acids enhance mitochondrial superoxide dismutase activity in rat organs during post‐natal development. International Journal of Biochemistry & Cell Biology 44, 123–131. [DOI] [PubMed] [Google Scholar]
- González‐Périz A., Planagumà A., Gronert K., Miquel R., López‐Parra M., Titos E. et al. (2006) Docosahexaenoic acid (DHA) blunts liver injury by conversion to protective lipid mediators: protectin D1 and 17S‐hydroxy‐DHA. FASEB Journal 20, 2537–2539. [DOI] [PubMed] [Google Scholar]
- Hajjaji N. & Bougnoux P. (2013) Selective sensitization of tumors to chemotherapy by marine‐derived lipids: A review. Cancer Treatment Reviews 39, 473–488. [DOI] [PubMed] [Google Scholar]
- Hanahan D.J. & Ekholm J.E. (1974) The preparation of red cell ghosts (membranes). Methods in Enzymology 31, 168–172. [DOI] [PubMed] [Google Scholar]
- Helchowska M., Ambroszkiewicz J., Gajewska J., Laskowska‐Klita T. & Leibschang J. (2011) The effect of tobacco smoking during pregnancy on plasma oxidant and antioxidant status in mother and newborn. European Journal of Obstretics & Gynecology and Reproductive Biology 155, 132–136. [DOI] [PubMed] [Google Scholar]
- Hui‐Min S. (2010) Mechanisms of n‐3 fatty acid‐mediated development and maintenance of learning memory performance. Journal of Nutritional Biochemistry 21, 364–373. [DOI] [PubMed] [Google Scholar]
- Hung T.H., Lo L.M., Chiu T.H., Li M.J., Yeh Y.L., Chen S.F. et al. (2010) A longitudinal study of oxidative stress and antioxidant status in women with uncomplicated pregnancies throughout gestation. Reproductive Science 17, 401–409. [DOI] [PubMed] [Google Scholar]
- Hurtado J.A., Iznaola C., Peña M., Ruíz J., Peña‐Quintana L., Kajarabille N. et al. (2015) Effects of maternal omega‐3 supplementation on fatty acids and on visual and cognitive development: a randomized trial. Journal of Pediatrics and Gastroenterology Nutrition. DOI: 10.1097/MPG.0000000000000864. [DOI] [PubMed] [Google Scholar]
- Innis S.M. & Friesen R.W. (2008) Essential n‐3 fatty acids in pregnant women and early visual acuity maturation in term infants. American Journal of Clinical Nutrition 87, 548–557. [DOI] [PubMed] [Google Scholar]
- Larqué E., Gil‐Sánchez A., Prieto‐Sánchez M.T. & Koletzko B. (2012) Omega 3 fatty acids, gestation and pregnancy outcomes. British Journal of Nutrition 107, S77–S84. [DOI] [PubMed] [Google Scholar]
- Makrides M., Gibson R.A., McPhee A.J., Yelland L., Quinlivan J. & Ryan P. (2010) Effect of DHA supplementation during pregnancy on maternal depression and neurodevelopment of young children: a randomized controlled trial. JAMA 304, 1675–1683. [DOI] [PubMed] [Google Scholar]
- Mas E., Woodman R.J., Burke V., Puddey I.B., Beilin L.J., Durand T. et al. (2010) The omega‐3 fatty acids EPA and DHA decrease plasma F(2)‐isoprostanes: results from two placebo‐controlled interventions. Free Radical Research 44, 983–990. [DOI] [PubMed] [Google Scholar]
- Ochoa J.J., Contreras‐Chova F., Muñoz S., Araujo‐Nepomuceno E., Bonillo A., Molina‐Carballo A. et al. (2007) Fluidity and oxidative stress in erythrocytes from very low birth weight infants during their first 7 days of life. Free Radical Research 4, 1035–1040. [DOI] [PubMed] [Google Scholar]
- Ochoa J.J., Ramirez‐Tortosa M.C., Quiles J.L., Palomino N., Robles R., Mataix J. et al. (2003) Oxidative stress in erythrocytes from premature and full‐term infants during their first 72 h of life. Free Radical Research 37, 317–322. [DOI] [PubMed] [Google Scholar]
- Parra‐Cabrera S., Stein A.D., Wang M., Martorell R., Rivera J. & Ramakrishnan U. (2011) Dietary intakes of polyunsaturated fatty acids among pregnant Mexican women. Maternal & Child Nutrition 7, 140–147. [DOI] [PMC free article] [PubMed] [Google Scholar]
- Pietrantoni E., Del Chierico F., Rigon G., Vernocchi P., Salvatori G., Manco M. et al. (2014) Docosahexaenoic acid supplementation during pregnancy: a potential tool to prevent membrane rupture and preterm labor. International Journal of Molecular Science 15, 8024–8036. [DOI] [PMC free article] [PubMed] [Google Scholar]
- Poston L., Igosheva N., Mistry H.D., Seed P.T., Shennan A.H., Rana S. et al. (2011) Role of oxidative stress and antioxidant supplementation in pregnancy disorders. American Journal of Clinical Nutrition 94, 1980S–1985S. [DOI] [PubMed] [Google Scholar]
- Saugstad O.D. (2005) Oxidative stress in the newborn – a 30‐year perspective. Biology of the Neonate 88, 228–236. [DOI] [PubMed] [Google Scholar]
- Schweigert F.J., Bathe K., Chen F., Büscher U. & Dudenhausen J.W. (2004) Effect of the stage of lactation in humans on carotenoid levels in milk, blood plasma and plasma lipoprotein fractions. European Journal of Nutrition 43, 39–44. [DOI] [PubMed] [Google Scholar]
- Shoji H., Franke C., Campoy C., Rivero M., Demmelmair H. & Koletzko B. (2006) Effect of docosahexaenoic acid and eicosapentaenoic acid supplementation on oxidative stress levels during pregnancy. Free Radical Research 40, 379. [DOI] [PubMed] [Google Scholar]
- Shoji H., Franke C., Demmelmair H. & Koletzko B. (2009) Effect of docosahexaenoic acid on oxidative stress in placental trophoblast cells. Early Human Development 85, 433–437. [DOI] [PubMed] [Google Scholar]
- Slater T.F., Cheeseman K.H., Davies M.J., Proudfoot K. & Xin W. (1987) Free radical mechanisms in relation to tissue injury. Proceedings of the Nutrition Society 46, 1–12. [DOI] [PubMed] [Google Scholar]
- Smithers L.G., Gibson R.A. & Makrides M. (2011) Maternal supplementation with docosahexaenoic acid during pregnancy does not affect early visual development in the infant: a randomized controlled trial. American Journal of Clinical Nutrition 93, 1293–1299. [DOI] [PubMed] [Google Scholar]
- Vericel E., Colas R., Calzada C., Lê Q.H., Feugier N., Cugnet C. et al. (2015) Moderate oral supplementation with docosahexaenoic acid improves platelet function and oxidative stress in type 2 diabetic patients. Thrombosis and Haemostasis 114, 289–296. [DOI] [PubMed] [Google Scholar]
- Yavin E. (2006) Versatile roles of docosahexaenoic acid in the prenatal brain: from pro‐ and anti‐oxidant features to regulation of gene expression. Prostaglandins, Leukotrienes and Essential Fatty Acids 75, 203–211. [DOI] [PubMed] [Google Scholar]