

Abstract
Premixed flours for infant porridge are increasingly produced and sold in developing countries to complement continued breastfeeding. Such complementary food (CF) products have known efficacy against malnutrition in children from 6 to 24 months of age, but ingredient ratios and production processes may vary. This study provides the first systematic measurement of their actual nutrient composition. We purchased samples of 108 premixed CF products in 22 low‐ and middle‐income countries, and commissioned blind laboratory measurement of each product's macronutrients and micronutrients. We compared measured contents to nutrient claims on their packaging and to CF standards from the Codex Alimentarius, the Super Cereal Plus product used in nutrition assistance programs, and the Lutter and Dewey (2003) recommendations, as well as our own modeled nutrient requirements for a healthy breastfed child. Actual densities are significantly different from nutrient claims for protein (p = .013) and fat (p = .000). Only 15% of samples met two of the three benchmarks for fat, 32% met the most stringent protein standard, while only 22% met them for iron, and 21% for zinc. The median healthy child consuming breast milk plus enough of these solid foods to meet energy needs would experience deficits of zinc at 6 months, iron at 6 and 9 months, and dietary fat from 12 months of age. In summary, premixed CF products can provide adequate nutrient density but usually do not, revealing the need and opportunity for independent monitoring and quality assurance to help grain millers making premixed foods maintain uniform ingredient ratios and production practices.
Keywords: complementary foods, infant nutrition, IYCF, malnutrition, nutrient composition, quality assurance
Abbreviations used
- AMDR
Acceptable Macronutrient Distribution Range
- BM
breast milk
- CF
complementary food
- LMICs
low‐ and middle‐income countries
- L&D
Lutter and Dewey
- max
maximum
- min
minimum
- RNI
recommended nutrient intake
- SCP
Super Cereal Plus
- USD
United States Dollar
1. INTRODUCTION
Stunting and linear growth faltering affects approximately 165 million children under the age of five worldwide (Black et al., 2013), primarily in low‐ and middle‐income countries (LMICs) where its adverse effects on child survival and cognitive development have wide‐ranging consequences for social and economic life (Dewey & Begum, 2011). Linear growth faltering occurs primarily from 6 to 24 months after birth (Victora, de Onis, Hallal, Blössner, & Shrimpton, 2010) and is associated, among other things, with inadequate caloric and nutrient intake (Black et al., 2013). Nutrient inadequacy is particularly widespread at this age because the infant's small size and limited gastric capacity calls for food of higher nutrient density and digestibility than their family's normal diet (Brown, Dewey, & Allen, 1998; Chiocca, 2015). Meeting nutrient needs requires solid complementary foods (CFs) to accompany continued breast‐feeding, but preparing such foods from raw ingredients at home is sufficiently difficult that foods actually fed to infants often lack sufficient nutrient density (Dop & Benbouzid, 1999; Gibson, Bailey, Gibbs, & Ferguson, 2010; Solomons & Vossenaar, 2013;Ferguson, Chege, Kimiywe, Wiesmann, & Hotz, 2015).
Premixed CFs offer a way to prepare uniform, high‐density CFs frequently throughout the day, in the gradually increasing quantities needed by a growing infant. The flour is mixed with water and boiled to produce a solid, cereal‐based food. In contrast to liquid infant formulas that substitute for breast milk (BM; Zehner, 2016), eating porridge generally complements continued breast‐feeding. And unlike lipid‐based compounds or nutrient powders that supplement family foods (de Pee, 2015), premixed cereals can potentially meet all nutrient needs other than BM, with less vulnerability to the potential bacterial contamination and nutritional variation of family foods. Premixed cereals can readily be produced by local grain millers alongside other flour products, unlike either infant formulas or nutrient supplements that are typically manufactured by specialized multinational food and pharmaceutical companies. The oldest and best‐known premixed cereal developed for LMICs is Incaparina, launched in Guatemala in 1961 (Wise, 1980; Scrimshaw, 1980). Incaparina was launched initially as a beverage, but since then, it and a wide variety of similar products have been distributed for use as solid foods. These complete CF products are produced by various agencies and local grain millers, typically using a cereal such as rice, maize or wheat fortified with roasted legumes and other ingredients (Porter & Shafritz, 1999; Lutter, 2003).
With increased female labor force participation and schooling, there has been rapid growth in the marketing and consumption of both liquid and solid infant foods in developing countries, even among low‐income populations (Zehner, 2016; Nielsen, 2015; Ferguson & Darmon, 2007). Despite the growing demand for solid premixed CF in LMICs, the few studies to have assessed their nutritional quality have focused on micronutrients such as the works of Gibson et al. (2010), Gibbs et al. (2011), and Roos et al. (2013). But quality can vary for macronutrients as well, with protein and fat density that depends on ingredient ratios and production processes which are rarely subject to independent inspection and testing. This study provides the first systematic, large‐scale collection and measurement of such products, to compare their measured nutrient content against the information on their labels, relative to various international standards for CF products, and relative to the nutrient needs of an otherwise healthy child who might be fed with these foods to complement continued breast‐feeding. All measurements and comparisons are made in terms of macronutrients (protein, fat, and total energy) plus two sentinel micronutrients (iron and zinc), which have been identified as common constraints on infant nutrition in LMICs (Santika, Fahmida, & Ferguson, 2009; Skau et al., 2014).
Key messages.
Premixed complementary foods sold by local millers in developing countries can meet infants' nutritional needs at low cost, but products are rarely tested so actual nutrient composition is unknown.
Sampling 108 different products from 22 countries reveals their contents to be highly variable relative to nutrient claims on each product's own label, and often inadequate relative to three published standards and the nutrient needs of infants at 6, 9, 12, and 24 months of age.
Independent quality assurance services could inspect mills and test samples, offering a trademarked certification symbol assuring potential buyers that various products all meet a common standard.
Nutritional certification of premixed complementary foods would increase access to local products of uniformly high quality, meeting infant needs more reliably at lower cost than with existing practices.
2. MATERIALS AND METHODS
This study concerns the nutritional adequacy of premixed, packaged CFs produced and sold in LMICs around the world. Products included in the study were explicitly marketed as composite flours made with more than one ingredient, to be boiled with water and served as porridge to infants after 6 months of age. We excluded any products manufactured in high‐income countries, and also excluded any infant formulas to be served in liquid form. Almost all of the sampled products were locally made by small‐ and medium‐scale millers who also sold other packaged cereal products; a few of the products were made in other LMICs and brought by wholesalers to the country where we purchased them.
2.1. Design and execution of sample collection
To identify products for this study, we assembled a global catalogue of eligible CF between June and October of 2014, and then purchased a purposeful sample of one package for each product from local markets. To identify the products available for purchase, we contacted by email a wide range of potential collaborators across LMICs as classified by the World Bank (2013). We invited these collaborators to send us photographs of the locally produced packaged CF for sale at local retailers and then to purchase one sample of up to five different products from a typical vendor. Each participating collaborator was offered a Western Union cash transfer equivalent of 20 USD per sample to cover the costs of purchase and shipping. Samples to be tested were sent by collaborators to the study authors through their country's national postal service using Express Mail Service, or in some cases were hand‐carried into the United States. The target sample size was at least 100 different infant foods from at least 20 different countries. We stopped the data collection in November 2014 when we reached 108 samples from 22 countries.
2.2. Nutrient testing and statistical analyses
Each product was blind‐tested within a month of purchase by Midwest Laboratories in Omaha, Nebraska, a commercial laboratory whose selection was based on a competitive bidding and past performance (Masters et al. 2011). On receipt of the purchased foods, each product was removed from its packaging, repacked as a numbered sample in a sealed plastic bag, and shipped to the lab facility for measurement of total energy, total fat, total protein, total carbohydrates (by subtraction), total iron, and total zinc, as well as moisture and ash content.
The analytical methods carried out by Midwest Laboratories for testing the macronutrient and micronutrient contents of samples follows standards set by the Association of Official Analytical Chemists, with protein analysis by combustion, fat analysis by alkaline hydrolysis, carbohydrates by subtraction after calorimetry, and iron and zinc analysis by microwave digestion and spectrometry. Specific procedures are available on request from Midwest Laboratories.
Statistical analyses compared each product's measured nutrient composition to the nutrient claims on its packaging. The nutrient composition of each product was also compared to three published benchmarks for CF products: the Codex Alimentarius (FAO/WHO, 2013), the nutrient profile used for Super Cereal Plus (SCP; WFP, 2014; USDA, 2014), and the nutrient composition of CF proposed by Lutter and Dewey (2003). Codex standards are widely used to compare food products and have served as the basis for various benchmarks (Lutter et al., 2008; Mahmoud & Anany, 2014). SCP is a product standard used by various United Nations agencies and donor organizations for nutrition assistance and complementary feeding in institutional settings since 2010. The nutrient composition framework proposed by Lutter and Dewey (L&D) was developed as part of a consultative process convened by the Pan American Health Organization in 2001. The three standards are presented in Table 1. The benchmark proposed by L&D is generally more stringent than the SCP and the Codex standards; Codex is the least demanding standard, and SCP generally falls between the other two with the exception of protein for which the SCP is the more restrictive standard.
Table 1.
Benchmarks used to assess the nutritional quality of CF
| Nutrient content (per 100 g) | Codex | SCP | L&D |
|---|---|---|---|
| Energy (kcal) | 400 | 410 | 440 |
| Macronutrients | |||
| Protein (g) | 6.0 | 16.0 | 6.0 |
| Fat (g) | 9.0 | 9.0 | 12.7 |
| Micronutrients | |||
| Iron (mg) | 11.0 | 12.5 | 14.0 |
| Zinc (mg) | 4.1 | 7.6 | 8.3 |
Protein and fat contents are given per 100 g of dry matter. Iron and zinc contents are given per 100 g of finished product. Protein and fat for Codex and L&D are implied from their respective recommended Acceptable Macronutrient Distribution Range (AMDR) and converted using the Atwater conversion factors of 9 kcal/g of fat and 4 kcal/g of protein. Iron and zinc for the SCP are from Webb et al. (2011). L&D recommendations for total fat are from Lutter & Dewey (2003, Table 5) for children from 6 to 23 months, with more specific recommendations of 11.9 and 13.7 for children aged 6–11 and 12–23 months, respectively.
Note. SCP = Super Cereal Plus; L&D = Lutter and Dewey.
All statistical analyses for this research were carried out using Stata/SE 14 with preliminary data collected and tabulated in Excel. Statistical tests were considered significant at P‐values below 0.05.
2.3. Modeling infants and young children's intake relative to nutrient needs
In addition to the three fixed standards, we also compare each product to a child's changing needs as they develop from 6 to 24 months (Lutter & Rivera, 2003; Dewey, 2003). For this study, we use estimated requirements for healthy growth in a child at each age along the median of the WHO reference population (de Onis, Onyango, Borghi, Siyam, & Pinol, 2006), given consumption of sufficient quantities of each product to meet energy needs while continuing to breastfeed. This modeling approach is designed to provide a lower bound on the fraction of children who, despite exclusive breastfeeding for the first 6 months and continued breastfeeding and sufficient additional energy from the CF product until 24 months, would experience inadequate intake of specific nutrients due to insufficient density of that nutrient in each food. Actual diets include gradual introduction of family foods in addition to both BM and whatever premixed CF product might be used. Our model reveals which nutrients would be needed at each age, and whether it is even possible for a caregiver to fill those gaps during the infant's transition from BM to the family diet.
To estimate the quantity of each CF product consumed at each age, we use the total energy needs of a median male child in the WHO reference population at 6, 9, 12, and 24 months, and subtract the energy available from continued breast‐feeding. The resulting quantity of each CF product allows us to calculate total intake of protein, fat, iron, and zinc, based on the measured nutrient composition of each food in addition to the nutrients obtained from BM. We then subtract estimated nutrient needs, revealing the nutrient profile of other foods that would be needed to sustain healthy development of a child.
2.3.1. Recommended total energy and nutrient intakes
Total energy intake is modeled using age‐ and sex‐specific requirements of 77 to 79 kcal/kg/d from 6 to 12 months of age, and then 82 kcal/kg/d with moderate physical activity at 24 months of age, all obtained from FAO/WHO/UNU (2004). The corresponding recommended nutrient intake (RNI) for protein is 1.31 g/kg/d at 6 and 9 months, 1.14 g/kg/d at 12 months and 0.97 g/kg/d at 24 months obtained from FAO/WHO/UNU (2007). Total daily fat requirement was calculated on the basis of an Acceptable Macronutrient Distribution Range (AMDR) of 35% for infants and young children aged 6 to 24 months from Food and Agriculture Organization (FAO; 2010), using the Atwater conversion factor of 9 kcal/g of fat. The RNIs for iron and zinc were based on age‐specific nutrient requirements and assumed bioavailability of 10% and 30% for iron and zinc, respectively, from FAO/WHO (2004). Recommended intake for iron is 9.3 mg/d from six to11 months and 5.8 mg/d from 12 to 24 months, and for zinc it is 4.1 mg/d at each of these ages. These benchmarks designed to meet nutrient needs for 97–98% of healthy infants at each age, and some would need more or less than this depending on their nutritional status and disease conditions.
2.3.2. Energy and nutrient intakes available from continued breastfeeding
The energy and nutrients available from BM are calculated using the estimated average volume consumed at each age in LMICs, and the estimated energy density and nutrient concentration of mature human BM from Brown et al. (1998). BM intake was assumed to be 674 g/d for infants aged 6–8 months, 616 g/d for infants aged 9–11 months, and 549 g/d for young children aged 12–24 months. We used an average BM energy density of 0.67 kcal/g from Butte and King (2005), and a protein concentration of 10.5 g/L, a fat concentration of 39 g/L, an iron concentration of 0.3 mg/L, and a zinc concentration of 1.2 mg/L from Brown et al. (1998). As reported in the work of Vossenaar and Solomons (2012), the nutrients delivered by BM exceed the child's RNI at 6 months of age for only one nutrient, dietary fat. For all other nutrients, complementing BM with a high‐density solid food would be needed to achieve adequacy.
2.3.3. Modeled and desired nutrient intakes from CF
Given adequate quantity of each CF to meet a breastfed infant's energy needs, we use its measured protein, fat, iron, and zinc density to calculate nutrient intake and the resulting nutrient gaps at each age. To maintain energy adequacy, modeled intake of each food rises from an average of 40 g/day at 6 months to about 150 g/day at 24 months. This is within the range of 25–250 g/day suggested by Dewey (2003) and is designed to produce a conservative lower bound on the frequency of inadequate nutrient intake.
3. RESULTS
Our final sample consisted of 108 packaged CF products from 22 countries. Most of these products were purchased in Sub‐Saharan Africa (88 products from 17 countries), while the remainder was purchased in China, Haiti, Indonesia, Morocco, and Nepal. On average, we obtained five different products from each country, but only one variety was available at the time of purchase in China and the Democratic Republic of Congo, while we obtained 10 and 12 from Ghana and Ethiopia, respectively.
3.1. Nutrient content relative to published standards
Testing revealed that the nutritional content of these products was highly variable, with some varieties meeting each of the three published benchmarks but many falling short (Table 2). The nutrient that is most often inadequate is total fat, as only 15% of sampled products meet the Codex and SCP standards, and only 1% meet the higher L&D standard. Only 9% of products meet the L&D standard for total dietary energy, and 22% and 21% meet the L&D standard for iron and zinc, respectively. The full distribution of measured macronutrient and micronutrient content relative to each benchmark can be seen using box plots (Figure 1). For energy density, the mean and median of our sample are above the benchmarks set by Codex and SCP, but well below the more stringent requirement of L&D. For total protein, the mean and median of our sample contained more than twice the benchmarks set by Codex and L&D, and just below the more stringent requirement of SCP. Total fat is the most often limiting nutrient, with the 25th percentile well below all three standards. Iron is the most widely varying nutrient, with mean and median below all three standards. For zinc, the mean and median are below two of the three benchmarks. Looking across all five nutrients, it is clear that some products had levels well above the three standards while some others were far below.
Table 2.
Summary statistics for 108 complementary foods from 22 countries
| Mean ± SD1 (min–max) | Fraction that meets standard (%)a | |||
|---|---|---|---|---|
| Codex | SCP | L&D | ||
| Energy (kcal) | 419.0 ± 16.0 (378.6–466.2) | 94 (87.0) | 76 (70.4) | 10 (9.3) |
| Macronutrients | ||||
| Protein (g) | 13.8 ± 3.9 (1.5–23.3) | 104 (96.3) | 35 (32.4) | 104 (96.3) |
| Fat (g) | 5.7 ± 3.1 (0.0–15.0) | 16 (14.8) | 16 (14.8) | 1 (0.9) |
| Micronutrients | ||||
| Iron (mg) | 9.9 ± 8.8 (0.0–61.3) | 35 (32.4) | 29 (26.8) | 24 (22.2) |
| Zinc (mg) | 5.9 ± 4.9 (0.0–21.0) | 49 (45.4) | 26 (24.1) | 23 (21.3) |
All values are nutrient content per 100 g of dry matter.
Values are number of products that meet or exceed benchmark and in parentheses are the percentage of products that meet or exceed benchmark.
Note. SCP = Super Cereal Plus; L&D = Lutter and Dewey.
Figure 1.
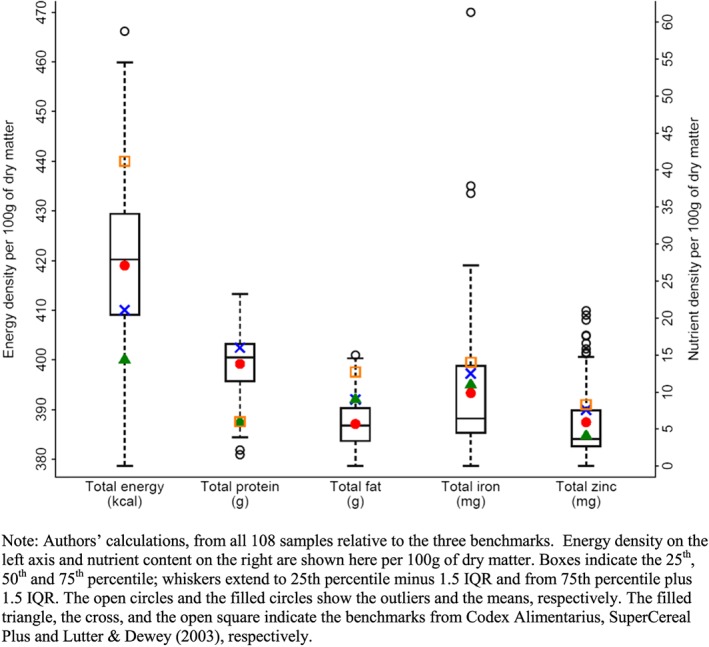
Variation in macronutrient and micronutrient content relative to desirable benchmarks
3.2. Nutrient content relative to products' own labels
Many of the purchased products include nutrient claims on their packaging. The nutrient claim most often provided is total protein, which is listed on 83 of the 108 products. Total energy is listed for 80 of them, while 77 list fat content, 58 list iron content, and 43 list zinc content. We compared our measured contents to those nutrient claims (Figure 2), and found little correlation between them. A Wilcoxon matched pairs test rejects equality between measured and labeled values for protein (p = .013) and fats (p = .000), and nearly rejects equality for zinc (p = .076) but not for iron (p = .130). The closest correlation between the measured and labeled value is for total energy, which was equal to, or above, the labeled value for 47.5% (38 of the 80 labeled products). For protein and fat, most products have less than their labeled content, 54% and 66% respectively, whereas products with labeled iron or zinc exceed the labeled values about as often as they fell short.
Figure 2.
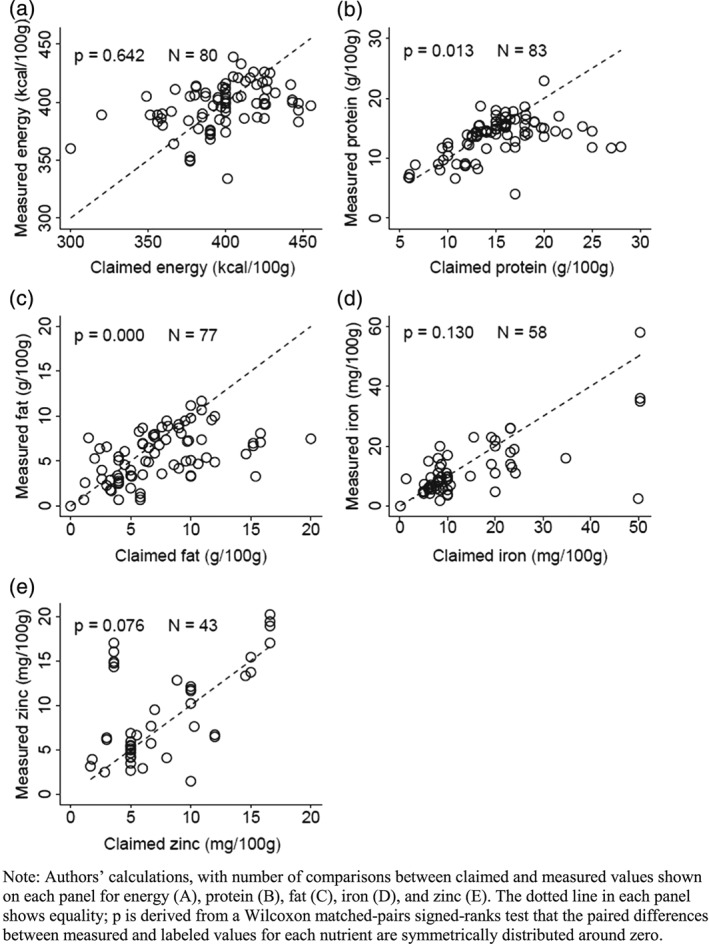
Variation in macronutrient and micronutrient contents relative to claims on product labels
3.3. Nutrient content relative to modeled needs of a healthy child
Based on our model of a healthy breastfed child at the median of WHO growth standards, Table 3 shows means for each age of the RNI, the estimated nutrient intake from BM, the desired nutrient intake from CF, the modeled intake of nutrient from CF, and the resulting difference between desired and modeled intake. In this model, the quantity of each CF consumed each day is exactly sufficient to meet estimated energy requirements. As shown in the rightmost column the resulting mean intake of protein is sufficient to meet modeled protein needs at every age from 6 to 24 months, but mean intake of both iron and zinc is insufficient at 6 months, and zinc remains insufficient at 9 months. At 12 and 24 months the mean intake of these micronutrients becomes adequate, but mean intake of dietary fat becomes insufficient.
Table 3.
Estimates of differences between desired and modeled nutrient intakes from 108 CF
| Energy, nutrient, and age | RNI | Intake from BM | Desired intake from CFa | Modeled intake from CF (Mean ± SD)b | Nutrient intakes gap (Mean ± SEM) | p‐valuec | Proportion of RNI from CF (%) | |||
|---|---|---|---|---|---|---|---|---|---|---|
| ‐100 | 99–75 | 74–50 | 49–0 | |||||||
| Energy (kcal) | ||||||||||
| 6 | 618.8 | 451.6 | 167.3 | |||||||
| 9 | 685.4 | 412.7 | 272.7 | |||||||
| 12 | 762.2 | 367.8 | 394.4 | |||||||
| 24 | 1,001.3 | 367.8 | 633.4 | |||||||
| Protein (g) | ||||||||||
| 6 | 10.4 | 7.1 | 3.3 | 5.5 ± 1.5 | 2.2 ± 0.1 | 1.00 | 90.7 | 5.6 | 1.8 | 1.8 |
| 9 | 11.7 | 6.5 | 5.2 | 9.0 ± 2.5 | 3.8 ± 0.2 | 1.00 | 91.7 | 4.6 | 1.8 | 1.8 |
| 12 | 11.0 | 5.8 | 5.2 | 13.0 ± 3.6 | 7.7 ± 0.3 | 1.00 | 96.3 | 1.8 | 0.0 | 1.8 |
| 24 | 11.8 | 5.8 | 6.0 | 20.8 ± 5.9 | 14.8 ± 0.6 | 1.00 | 98.1 | 0.0 | 0.9 | 0.9 |
| Fat (g) | ||||||||||
| 6d | 24.1 | 26.3 | 0.0 | 2.2 ± 1.1 | 2.2 ± 0.1 | 1.00 | 100.0 | 0.0 | 0.0 | 0.0 |
| 9 | 26.6 | 24.0 | 2.6 | 3.6 ± 1.8 | 1.0 ± 0.2 | 1.00 | 66.7 | 14.8 | 6.5 | 12.0 |
| 12 | 29.6 | 21.4 | 8.2 | 5.3 ± 2.7 | ‐3.0 ± 0.3 | 0.00 | 13.9 | 25.0 | 24.1 | 37.0 |
| 24 | 38.9 | 21.4 | 17.5 | 8.4 ± 4.3 | ‐9.1 ± 0.4 | 0.00 | 0.9 | 13.0 | 34.3 | 51.8 |
| Iron (mg) | ||||||||||
| 6 | 9.3 | 0.2 | 9.1 | 4.0 ± 3.6 | ‐5.1 ± 0.3 | 0.00 | 7.4 | 7.4 | 15.7 | 69.4 |
| 9 | 9.3 | 0.2 | 9.1 | 6.5 ± 5.9 | ‐2.6 ± 0.6 | 0.00 | 22.2 | 12.0 | 12.0 | 53.7 |
| 12 | 5.8 | 0.2 | 5.6 | 9.4 ± 8.6 | 3.7 ± 0.8 | 1.00 | 56.5 | 18.5 | 12.0 | 13.0 |
| 24 | 5.8 | 0.2 | 5.6 | 15.0 ± 13.8 | 9.4 ± 1.3 | 1.00 | 83.3 | 5.6 | 4.6 | 6.5 |
| Zinc (mg) | ||||||||||
| 6 | 4.1 | 0.8 | 3.3 | 2.4 ± 2.0 | ‐0.9 ± 0.2 | 0.00 | 20.4 | 13.0 | 11.1 | 55.6 |
| 9 | 4.1 | 0.7 | 3.4 | 3.9 ± 3.3 | 0.5 ± 0.3 | 0.95 | 39.8 | 5.6 | 33.3 | 21.3 |
| 12 | 4.1 | 0.6 | 3.4 | 5.6 ± 4.7 | 2.2 ± 0.5 | 1.00 | 48.1 | 23.1 | 19.4 | 9.3 |
| 24 | 4.1 | 0.7 | 3.4 | 9.0 ± 7.6 | 5.6 ± 0.7 | 1.00 | 84.3 | 9.3 | 1.8 | 4.6 |
Values are derived by subtracting energy and nutrient intakes provided by mature human breast milk from RNI.
Estimates are based on the quantity of product necessary to meet the energy requirement and the nutrient density of products. Estimated average quantity (minimum–maximum) of products necessary to satisfy energy requirements were 40.0 g (35.9–44.2) at 6 months, 65.2 g (58.5–72.0) at 9 months, 94.3 g (84.6–104.2) at 12 months, and 151.4 g (135.9–167.3) at 24 months.
p–value is derived from a one‐sided t test of the negative difference between the desired and the average modeled intake.
All products were assumed to provide at least 100% of RNI from CF for fat regardless of their fat content because at 6 mo BM provides ample fat to cover the RNI.
Note. CF = complementary foods; RNI = recommended nutrient intake; BM = breast milk; SD = standard deviation; SEM = standard error of the mean.
The distribution of intake among children fed each of these foods is also presented in Table 3. For protein, over 90% of products in our sample had sufficient density to meet recommended intake levels at every age. About 91% of products have adequate protein density to meet modeled needs at 6 months, and that fraction rises to 98% at 24 months. For fat, breast milk alone is adequate at 6 months of age so all products are adequate, but the proportion of products with adequate density to meet modeled needs falls rapidly to 67% at 9 months, 14% at 12 months and under 1% at 24 months. At 24 months of age most products would be providing less than half of the recommended RNI for dietary fat. Among the micronutrients, adequacy increases with age. For iron, only 7% of products have adequate density at 6 months, and 22% are adequate at 9 months, while for zinc, 20% are adequate at 6 months, and 40% are adequate at 9 months. That proportion rises to over 80% by 24 months of age for both minerals. As shown in the last column of Table 3, the magnitude of micronutrient deficiency at younger ages is very large. The proportion of products providing less than half of the recommended intake for iron is over two‐thirds at 6 months and over half at 9 months. For zinc, the corresponding share is over half at 6 months and more than one‐fifth at 9 months.
4. DISCUSSION
This study is, to the best of our knowledge, the first systematic sampling and testing for nutrient composition of locally premixed CFs being sold throughout the developing world. We extend previous work by measuring both macronutrients and micronutrients in a large sample of 108 products from 22 countries, testing them against three international standards for CF as well as each product's own packaging claims. In addition we use modeled intake relative to recommendations for healthy growth at 6, 9, 12, and 24 months to determine whether a product's nutrient density is sufficient to meet infants' changing needs over the entire period of complementary feeding.
Our main finding is that some premixed CF products can have adequate nutrient density, by any standard, but many products do not. This is consistent with the closest precedent to our study, Roos et al. (2013), who tested micronutrients in 12 CF products from Africa and Asia. In our larger sample, we find a wide variation in both macronutrients and micronutrients, and frequent inconsistency between these products' actual composition and the information printed on their labels. Many products fall short of published standards and would lead to inadequate intake, with large differences among nutrients relative to the children's needs at different ages. The first nutrient shortfalls appear at 6 and 9 months for iron and zinc, while for older children (12 and 24 months) the most widespread shortfall is for dietary fat. Levels of protein are generally adequate relative to international benchmarks and modeled requirements, which is consistent with previous studies such as the work of Lutter and Rivera (2003), although further analysis of the CF would be needed to assess protein quality (Suri, Tano‐Debrah, & Ghosh, 2014). The clearest deficits are in dietary fat, which is consistent with previous works by Prentice and Paul (2000) and Michaelsen et al. (2011). In our sample, only 14% of tested products have sufficient fat to meet infants' needs by 12 months of age; by 24 months, more than 50% of them provide less than half of the fat required for healthy child development. Adding some family foods cannot fill the gap, because caregivers cannot know what combination of foods (plus continued breast‐feeding) would achieve the desired nutrient ratios.
Our results imply that the potential for premixed CF products to meet infants' nutrient needs cannot be fulfilled until potential users can trust them to have high and uniform content of macronutrients and micronutrients. Under current conditions, the actual nutrient content of premixed products differs significantly from labeled nutrients and is often far below infants' requirements for healthy growth. However, some products do have adequate nutrient density, which confirms that local millers have the capacity to produce and sell sufficiently nutrient‐dense products. The WHO and UNICEF (2003) strategy for infant and young child feeding states that after 6 months of exclusive breast‐feeding, “… low‐cost complementary foods, prepared with locally available ingredients using suitable small‐scale production technologies in community settings, can help to meet the nutritional needs of older infants and young children”. We find that fulfillment of this potential is severely impeded by the variability and unpredictability of these products' actual nutrient content. Similar products sold in high‐income countries are much more uniform, as shown for example in the UK and Norway by Zand et al. (2012) and Melø, Gellein, Evje, and Syversen (2008), where a variety of voluntary and government standards are routinely enforced through inspection and testing.
Research on many other foods reveals how food standards arise and spread, resulting in increased sales of high‐quality products at competitive prices (Swinnen, Maertens, & Colen, 2015). Quality assurance for premixed CFs could have similar effects by giving local millers sufficient incentives to maintain uniform levels of attributes that consumers want to buy. The introduction of new inspection and testing services begins with agreement on what those attributes should be. For premixed CFs, research has generally focused on marketing regulations rather than production standards (e.g., Sweet, Jerling, & Van Graan, 2013), and policy documents typically treat premixed flour for CFs as similar to premixed formulas for BM substitutes (WHO, 2013, 2015). The recently revised Codex Alimentarius guidelines on nutrition labeling (FAO/WHO, 2015) do not mention macronutrient density at all, focusing instead on smaller recommended serving sizes to protect BM intake, guidance on essential fatty acids and their optimal ratio, and processing techniques to reduce anti‐nutrients (Siekmann et al., 2015).
If one or more organizations were to propose appropriate standards for the nutrient composition of CFs, local inspection and testing services to determine which products meet those standards could be provided by a wide range of private and public sector organizations. To be widely used a quality assurance service must be trusted by both potential producers and also potential consumers. Such services actively inspect production facilities, collect samples and conduct laboratory tests, before authorizing use of a licensed trademark. The cost of testing and inspection is typically shared between producers and consumers, in the form of a licensing fee paid by sellers and included in product prices, and may also be supported by philanthropic or donor funds.
The need for independent testing and product certification to create markets for high‐quality products was first demonstrated by George Akerlof (1970), for which he was awarded the 2001 Nobel Prize in economics. Sustaining a certification program depends on the tester's ability to measure an attribute that consumers need but cannot see for themselves, which is often the case for high‐quality food products (Caswell & Padberg, 1992). With premixed CF products, buyers can readily detect odors, colors, and textures but cannot observe nutrient density itself. Once mixed, the product's ingredient ratios can be detected only through testing, even after purchase and use. Products with inadequate nutrients will cause ill‐health and stunted growth, but for any given child, those effects could also have been caused by many intervening confounders and cannot be attributed to nutrient density without controlled trials. To be cost‐effective, certification programs must focus on the most important quality attributes that are otherwise unobservable. Other traits such as taste and convenience may be equally important, but need not be certified since they are directly observable by consumers. In effect, third‐party certification introduces a separate market for information about product quality, allowing consumers to see it directly and inducing suppliers to maintain quality at competitive prices.
When testing actually provides valuable information, certification programs can operate on a voluntary fee‐for‐service basis to which sellers subscribe (Crespi & Marette, 2001). For CF in Africa, a market experiment in Bamako, Mali, found that even very poor and illiterate mothers were aware of the risk that premixed products could have inadequate nutrient levels and were willing to pay more than enough to cover the estimated costs of inspection and testing (Sanogo & Masters, 2002), and a survey of small‐scale millers producing CF products in Ghana found them to be keenly interested in using certification to signal their quality (Masters, Kuwornu, & Sarpong, 2011).
A close precursor to what would be needed for infant foods is the seal of nutritional excellence that has been promoted by INCAP, the Institute of Nutrition in Central America and Panama (Tartanac, 2000). A major challenge is the size of market demand, which helps spread the fixed cost of certification over a larger volume of sales (Auriol & Schilizzi, 2015): infant foods are a niche product, and even within that market only lower‐income consumers would need certification, because higher‐income consumers can buy enough of the name‐brand products to meet their children's needs. Furthermore, certification programs are typically introduced to detect toxins and adulterants in response to fears of contamination. Quality assurance about nutritional composition would expand a small food category, rather than protect a large one, so there is no popular clamor to introduce infant food certification. End‐users who would benefit from such a program are infants and their caregivers, while the producers who would benefit are small‐scale local entrepreneurs for whom the lack of quality assurance is most constraining (Unnevehr & Hirschhorn, 2000).
In summary, premixed CF products can have adequate nutrient density, by any standard, but many products do not. To remedy this problem third‐party quality assurance for the nutrient density of solid CF products would help local millers meet caregivers' increasing demand for nutrient‐dense porridge at low cost, using local ingredients and packaging. Third party certification programs can emerge from either the public, private, or philanthropic sectors but require a high degree of coordination and responsiveness to earn the trust of both buyers and sellers. The data presented in this paper demonstrate the importance of that effort.
SOURCE OF FUNDING
United States Agency for International Development, through the International Food Policy Research Institute (Linkage Grant Number: 3047–001–56–01) and Feed the Future Nutrition Innovation Lab (Grant Number: AID‐OAA‐L‐1‐00005).
CONFLICTS OF INTEREST
The authors declare that they have no conflicts of interest.
CONTRIBUTIONS
WM designed research; WM, WB, and MN conducted research, analyzed data, and wrote the paper; WM had primary responsibility for final content. All authors read and approved the final manuscript.
ACKNOWLEDGMENTS
Many thanks are due to Patrick Webb and Jenny Aker at Tufts, Laurian Unnevehr at IFPRI, Jacquelyn Kerchevel for undergraduate research assistance, and numerous other colleagues for comments and advice on this project. Samples were collected with the help of Ambroise Agbota, Jean‐Paul Anoh, Mahaman Bamba, Aaron Cheng, Christian Gnangbo, Amelia Darrouzet‐Nardi, Issa Fadiga, Matt Hazel, Dorothy Nzembi Kimanthi, Yolande Kouame, Emmanuel Kouame, Rachid Laajaj, Perrine Loock, Janeen Madan, Menno Mulder‐Sibanda, Fatouman Ouattara, Galase Ramolefhe, Claude Emile Rwagacondo, Marianne Santoso, and Robin Shretha.
Masters WA, Nene MD, Bell W. Nutrient composition of premixed and packaged complementary foods for sale in low‐ and middle‐income countries: Lack of standards threatens infant growth. Matern Child Nutr. 2017;13:e12421 10.1111/mcn.12421
REFERENCES
- Akerlof, G. A. (1970). The Market for “Lemons”: Quality uncertainty and the market mechanism. Quarterly Journal of Economics, 84(3), 488–500. [Google Scholar]
- Auriol, E. , & Schilizzi, S. G. M. (2015). Quality signaling through certification in developing countries. Journal of Development Economics, 116, 105–121. [Google Scholar]
- Black R.E., Victora C.G., Walker S.P., Bhutta Z.A., Christian P., Onis M., … the Maternal and Child Nutrition Study Group . (2013). Maternal and child undernutrition and overweight in low‐income and middle‐income countries. The Lancet 382 (9890), 427–451. [DOI] [PubMed] [Google Scholar]
- Brown, K. , Dewey, K. , & Allen, L. (1998). Complementary Feeding of Young Children in Developing Countries: A Review of Current Scientific Knowledge. Geneva, Switzerland: World Health Organization. [Google Scholar]
- Butte, N. F. , & King, J. C. (2005). Energy requirements during pregnancy and lactation. Public Health Nutrition, 8(7a), 1010–1027. [DOI] [PubMed] [Google Scholar]
- Caswell, J. A. , & Padberg, D. I. (1992). Toward a more comprehensive theory of food labels. American Journal of Agricultural Economics, 74(2), 460–468. [Google Scholar]
- Chiocca, E. M. (2015). Advanced Pediatric Assessment. New York, NY: Springer Publishing Company, LLC. [Google Scholar]
- Crespi, J. M. , & Marette, S. (2001). How should food safety certification be financed? American Journal of Agricultural Economics, 83(4), 852–861. [Google Scholar]
- de Onis, M. , Onyango, A. , Borghi, E. , Siyam, A. , & Pinol, A. (2006). WHO Child Growth Standards: Length/height‐for‐age, Weight‐for‐age, Weight‐for‐length, Weight‐for‐height and Body Mass Index‐for‐age: Methods and Development. Geneva, Switzerland: World Health Organization. [Google Scholar]
- de Pee, S. (2015). Special nutritious solutions to enhance complementary feeding. Maternal & Child Nutrition, 11(S4), 1–8. [DOI] [PMC free article] [PubMed] [Google Scholar]
- Dewey, K. G. (2003). Nutrient composition of fortified complementary foods: Should age‐specific micronutrient content and ration sizes be recommended? The Journal of Nutrition, 133(9), 2950S–2952S. [DOI] [PubMed] [Google Scholar]
- Dewey, K. G. , & Begum, K. (2011). Long‐term consequences of stunting in early life. Maternal & Child Nutrition, 7(Supplement S3), 5–18. [DOI] [PMC free article] [PubMed] [Google Scholar]
- Dop, M.‐C. , & Benbouzid, D. (1999). Regional features of complementary feeding in Africa and the Middle East In Dop M.‐C., Benbouzid D., Treche S., de Benoist B., Verster A., & Delpeuch F. (Eds.), Complementary Feeding of Young Children in Africa and the Middle East. (pp. 43–58). Geneva, Switzerland: World Health Organization. [Google Scholar]
- FAO . (2010). Fats and fatty acids in human nutrition: Report of an expert consultation In FAO Food and Nutrition Paper). Rome, Italy: Food and Agriculture Organization of the United Nations. [PubMed] [Google Scholar]
- FAO/WHO . (2004). Vitamin and mineral requirements in human nutrition: Report of a joint FAO/WHO expert consultation, Bangkok, Thailand, 21–30 September 1998. Second edn. World Health Organization and Food and Agriculture Organization of the United Nations.
- FAO/WHO . (2013). Codex Alimentarius Guidelines for Formulated Complementary Foods for Older Infants and Young Children. Rome, Italy: Food and Agriculture Organization of the United Nations. [Google Scholar]
- FAO/WHO . (2015). Codex Alimentarius Guidelines on Nutrition Labeling. Rome, Italy: Food and Agriculture Organization of the United Nations. [Google Scholar]
- FAO/WHO/UNU . (2004). Human Energy Requirements: Report of a Joint FAO/WHO/UNU Expert Consultation: Rome, 17–24 October 2001 Food and nutrition technical report series No. 1. Rome, Italy: Food and Agriculture Organization of the United Nations. [Google Scholar]
- FAO/WHO/UNU . (2007). Protein and amino acid requirements in human nutrition: Report of a Joint FAO/WHO/UNU Expert Consultation WHO Technical Report Series No. 935. Geneva, Switzerland: World Health Organization. [PubMed] [Google Scholar]
- Ferguson, E. , Chege, P. , Kimiywe, J. , Wiesmann, D. , & Hotz, C. (2015). Zinc, iron and calcium are major limiting nutrients in the complementary diets of rural Kenyan children. Maternal & Child Nutrition, 11(Supplement S3), 6–20. [DOI] [PMC free article] [PubMed] [Google Scholar]
- Ferguson, E. L. , & Darmon, N. (2007). Traditional foods vs. manufactured baby foods In Agostoni C., & Brunser O. (Eds.), Issues in Complementary Feeding. (pp. 43–63). Basel, Switzerland: Nestec Ltd., Vevey/S. and Karger AG. [DOI] [PubMed] [Google Scholar]
- Gibbs, M. , Bailey, K. B. , Lander, R. D. , Fahmida, U. , Perlas, L. , Hess, S. Y. , … Gibson, R. S. (2011). The adequacy of micronutrient concentrations in manufactured complementary foods from low‐income countries. Journal of Food Composition and Analysis, 24(3), 418–426. [Google Scholar]
- Gibson, R. S. , Bailey, K. B. , Gibbs, M. , & Ferguson, E. L. (2010). A review of phytate, iron, zinc, and calcium concentrations in plant‐based complementary foods used in low‐income countries and implications for bioavailability. Food and Nutrition Bulletin, 31(Supplement 2), 134–146. [DOI] [PubMed] [Google Scholar]
- Lutter, C. K. (2003). Macrolevel approaches to improve the availability of complementary foods. Food and Nutrition Bulletin, 24(1), 83–103. [DOI] [PubMed] [Google Scholar]
- Lutter, C. K. , & Dewey, K. G. (2003). Proposed nutrient composition for fortified complementary foods. The Journal of Nutrition, 133(9), 3011S–3020S. [DOI] [PubMed] [Google Scholar]
- Lutter, C. K. , & Rivera, J. A. (2003). Nutritional status of infants and young children and characteristics of their diets. The Journal of Nutrition, 133(9), 2941S–2949S. [DOI] [PubMed] [Google Scholar]
- Lutter, C. K. , Rodriguez, A. , Fuenmayor, G. , Avila, L. , Sempertegui, F. , & Escobar, J. (2008). Growth and micronutrient status in children receiving a fortified complementary food. The Journal of Nutrition, 138(2), 379–388. [DOI] [PubMed] [Google Scholar]
- Mahmoud, A. H. , & Anany, A. M. E. (2014). Nutritional and sensory evaluation of a complementary food formulated from rice, faba beans, sweet potato flour, and peanut oil. Food and Nutrition Bulletin, 35(4), 403–413. [DOI] [PubMed] [Google Scholar]
- Masters, W. A. , Kuwornu, J. , & Sarpong, D. (2011). Improving child nutrition through quality certification of infant foods: Scoping study for a randomized trial in Ghana. IGC Working Paper (10/0828).
- Melø, R. , Gellein, K. , Evje, L. , & Syversen, T. (2008). Minerals and trace elements in commercial infant food. Food and Chemical Toxicology, 46(10), 3339–3342. [DOI] [PubMed] [Google Scholar]
- Michaelsen, K. F. , Dewey, K. G. , Perez‐Exposito, A. B. , Nurhasan, M. , Lauritzen, L. , & Roos, N. (2011). Food sources and intake of n‐6 and n‐3 fatty acids in low‐income countries with emphasis on infants, young children (6–24 months), and pregnant and lactating women. Maternal & Child Nutrition, 7(Supplement S2), 124–140. [DOI] [PMC free article] [PubMed] [Google Scholar]
- Nielsen . (2015). Oh, baby! Trends in the baby food and diaper markets around the world New York: The Nielsen Company. [Google Scholar]
- Porter, R. & Shafritz, L. (1999). Packaged foods for complementary feeding: Marketing challenges and opportunities. Linkages Project, Academy for Educational Development: Washington, DC.
- Prentice, A. M. , & Paul, A. A. (2000). Fat and energy needs of children in developing countries. The American Journal of Clinical Nutrition, 72(Supplement 5), 1253S–1265S. [DOI] [PubMed] [Google Scholar]
- Roos, N. , Sørensen, J. C. , Sørensen, H. , Rasmussen, S. K. , Briend, A. , Yang, Z. , &. Huffman, S. L. (2013). Screening for anti‐nutritional compounds in complementary foods and food aid products for infants and young children. Maternal & Child Nutrition, 9(Supplement S1), 47–71. [DOI] [PMC free article] [PubMed] [Google Scholar]
- Sanogo, D. , & Masters, W. A. (2002). A market‐based approach to child nutrition: Mothers' demand for quality certification of infant foods in Bamako, Mali. Food Policy, 27(3), 251–268. [Google Scholar]
- Santika, O. , Fahmida, U. , & Ferguson, E. L. (2009). Development of food‐based complementary feeding recommendations for 9‐ to 11‐month‐old peri‐urban Indonesian infants using linear programming. The Journal of Nutrition, 139(1), 135–141. [DOI] [PubMed] [Google Scholar]
- Scrimshaw, N. S. (1980). The background and history of Incaparina. Food and Nutrition Bulletin, 2(2), 1–2. [Google Scholar]
- Siekmann, J. , Badham, J. , Zlotkin, S. , Lartey, A. , Yang, Z. , & Schofield, D. (2015). Revised Codex Alimentarius Guidelines on formulated complementary foods for older infants and young children—better formulations, increased fortification fevels and smaller serving sizes to protect breastfeeding. European Journal of Nutrition & Food Safety, 5(5), 686–687. [Google Scholar]
- Skau, J. K. , Bunthang, T. , Chamnan, C. , Wieringa, F. T. , Dijkhuizen, M. A. , Roos, N. , & Ferguson, E. L. (2014). The use of linear programming to determine whether a formulated complementary food product can ensure adequate nutrients for 6‐ to 11‐month‐old Cambodian infants. The American Journal of Clinical Nutrition, 99(1), 130–138. [DOI] [PubMed] [Google Scholar]
- Solomons, N. W. , & Vossenaar, M. (2013). Nutrient density in complementary feeding of infants and toddlers. European Journal of Clinical Nutrition, 67(5), 501–506. [DOI] [PubMed] [Google Scholar]
- Suri, D. J. , Tano‐Debrah, K. , & Ghosh, S. A. (2014). Optimization of the nutrient content and protein quality of cereal–legume blends for use as complementary foods in Ghana. Food and Nutrition Bulletin, 35(3), 372–381. [DOI] [PubMed] [Google Scholar]
- Sweet, L. , Jerling, J. , & Van Graan, A. (2013). Field‐testing of guidance on the appropriate labelling of processed complementary foods for infants and young children in South Africa. Maternal & Child Nutrition, 9(Supplement S1), 12–34. [DOI] [PMC free article] [PubMed] [Google Scholar]
- Swinnen, J. , Maertens, M. , & Colen, L. (2015). The Role of Food Standards in Trade and Development In Food Safety, Market Organization, Trade and Development. (pp. 133–149). Basel, Switzerland: Springer. [Google Scholar]
- Tartanac, F. (2000). Incaparina and other Incaparina‐based foods: Experience of INCAP in Central America. Food and Nutrition Bulletin, 21(1), 49–54. [Google Scholar]
- Unnevehr, L. , & Hirschhorn, N. (2000). Food Safety Issues in the Developing World. Washington, DC: The World Bank. [Google Scholar]
- USDA . (2014). SCP1: Super Cereal Plus for use in international food assistance programs. United States Department of Agriculture.
- Victora, C. G. , de Onis, M. , Hallal, P. C. , Blössner, M. , & Shrimpton, R. (2010). Worldwide timing of growth faltering: Revisiting implications for interventions. Pediatrics, 125(3), e473–e480. [DOI] [PubMed] [Google Scholar]
- Vossenaar, M. , & Solomons, N. W. (2012). The concept of "critical nutrient density" in complementary feeding: The demands on the "family foods" for the nutrient adequacy of young Guatemalan children with continued breastfeeding. The American Journal of Clinical Nutrition, 95(4), 859–866. [DOI] [PubMed] [Google Scholar]
- Webb, P. , Rogers, B. , Rosenberg, I. , Schlossman, N. , Wanke, C. , Bagriansky, J. , … Narayan, A. (2011). Delivering Improved Nutrition: Recommendations for Changes to US Food Aid Products and Programs. Boston, MA: Tufts University. [Google Scholar]
- WFP . (2014). Technical specifications for the manufacture of Super Cereal Plus: Corn soya blend. World Food Programme.
- WHO . (2013). Country Implementation of the International Code of Marketing of Breast Milk Substitutes: Status Report 2011. Geneva, Switzerland: World Health Organization. [Google Scholar]
- WHO . (2015). Draft clarification and guidance on inappropriate promotion of foods for infants and young children: Report of the scientific and technical advisory group (STAG) on inappropriate promotion of foods for infants and young children. Discussion Paper.
- WHO/UNICEF . (2003). Global Strategy for Infant and Young Child Feeding. Geneva, Switzerland: World Health Organization. [Google Scholar]
- Wise, R. P. (1980). The case of incaparina in Guatemala. Food and Nutrition Bulletin, 2(2), 3–8. [Google Scholar]
- World Bank . (2013). Country and lending groups. The World Bank.
- Zand, N. , Chowdhry, B. Z. , Pollard, L. V. , Pullen, F. S. , Snowden, M. J. , & Zotor, F. B. (2012). Commercial ‘ready‐to‐feed' infant foods in the UK: macro‐nutrient content and composition. Maternal & Child Nutrition, 11(2), 202–214. [DOI] [PMC free article] [PubMed] [Google Scholar]
- Zehner, E. (2016). Promotion and consumption of breast milk substitutes and infant foods in Cambodia, Nepal, Senegal and Tanzania. Maternal & Child Nutrition, 12(S2), 3–7. [DOI] [PMC free article] [PubMed] [Google Scholar]