

Abstract
While the composition of human milk has been studied extensively in the first year of lactation, there is a paucity of data regarding human milk composition beyond one year postpartum. Policies vary at milk banks around the world regarding how long lactating women are eligible to donate their milk. The primary purpose of this study is to describe longitudinal changes in human milk composition in the second year postpartum to support the development of evidence based guidelines regarding how long lactating women can donate human milk to a milk bank. Nineteen lactating women in North Carolina provided monthly milk samples from 11 months to 17 months postpartum (N = 131), and two non‐profit milk banks provided (N = 33) pooled, unpasteurized milk samples from 51 approved donors less than one year postpartum. There was a significant increase (P < 0.05) in the concentration of total protein, lactoferrin, lysozyme, Immunoglobulin A, oligosaccharides and sodium in longitudinal samples of mother's milk between 11 and 17 months postpartum, while zinc and calcium concentrations declined, and no changes were observed in lactose, fat, iron and potassium. Human milk in the second year postpartum contained significantly higher concentrations of total protein, lactoferrin, lysozyme and Immunoglobulin A, than milk bank samples, and significantly lower concentrations of zinc, calcium, iron and oligosaccharides. Accepting milk bank donations beyond one year postpartum is a potential strategy for increasing the supply of donor milk, but may require mineral fortification.
Keywords: human milk, milk banking, lactation, pasteurized donor milk
Introduction
Human milk has long been considered the ‘gold standard’ of infant nutrition, supporting optimal growth and development in the neonate (Horta et al. 2007). While human milk composition has been studied extensively in the first year after parturition there is a paucity of data regarding milk composition beyond one year postpartum (Perrin et al. 2013). Weaknesses in the scientific literature include the use of cross‐sectional or semi‐longitudinal designs that may have masked changes because of inter‐individual variations; small sample sizes at later study time points; and limited or no information on major constituents in milk including bioactive proteins and human milk oligosaccharides (HMOS). Filling this research gap will create a greater understanding of the nutritional and immune contribution of human milk beyond infancy, and will also enable the creation of evidence‐based guidelines regarding milk bank donations.
Human milk banking is supported by the World Health Organization (WHO 2008), the American Academy of Pediatrics (AAP 2012) and The United States Surgeon General (DHHS 2011) as a strategy for improving health outcomes and lowering health care costs among medically fragile infants who do not have access to their mother's milk (Ganapathy et al. 2012; Quigley & McGuire 2014). The duration that a lactating woman is eligible to donate her milk to a milk bank varies across the world, with some milk banks excluding donors as early as six months postpartum (Association of Italian Milk Banks, Milan, Italy), and other milk banks having no limits on the duration of donation (Milk Matters Milk Bank, Cape Town, South Africa). A 2013 survey of milk banks in the Human Milk Banking Association of North America (HMBANA) network found that 8 of the 13 operating milk banks did not accept milk from donors beyond one year postpartum (Perrin et al. 2013). The use of donor milk is rising in United States' neonatal intensive care units (NICUs) (Perrine & Scanlon 2013), and so are donations to HMBANA milk banks (Updegrove 2013); however, currently less than 50% of NICUs in the United States use pasteurized donor milk (PDM) (Parker et al. 2013; Perrine & Scanlon 2013), suggesting that strategies may be needed to keep up with the growing demand. Allowing donation beyond one year postpartum for existing donors who continue to produce surplus milk is one potential strategy to increase supply.
The primary purpose of this study is to describe longitudinal changes in human milk composition in the second year postpartum to support the development of evidence based guidelines regarding how long lactating women can donate human milk to a milk bank. The scope of this research includes: analysis of macronutrients (total protein, total fat and lactose); bioactive proteins that are typically abundant in human milk (lactoferrin, lysozyme and immunoglobulin A) (Mantis & Forbes 2010; Hettinga et al. 2011; Lönnerdal 2013); key minerals for the preterm neonate (calcium, zinc and iron) (Rao & Georgieff 2009; Abrams & Committee on Nutrition 2013; Griffin et al. 2013); sodium and potassium to monitor mammary gland involution (Neville et al. 1991) and HMOS, which have a role in immunity and the development of the gastrointestinal microbiome (Newburg 2009; Zivkovic et al. 2011; Bode 2012). We hypothesized that there would be no change in milk composition in the second year postpartum while daily feeding frequencies were maintained. A secondary purpose of this study is to compare the composition of human milk in the second year postpartum to raw milk samples accepted for donation in the HMBANA milk bank network.
Key messages.
Human milk contains increasing concentrations of total protein, lactoferrin, lysozyme, IgA, sodium and oligosaccharides, and decreasing concentrations of zinc and calcium, between 11 and 17 months postpartum.
A subject‐effect explains more of the variability in milk composition than a time‐effect between 11 and 17 months postpartum.
Human milk between 11 and 17 months postpartum provides equal or greater concentrations of macronutrients and key bioactive proteins compared with mature milk bank samples donated in the first year postpartum, but may require mineral fortification to meet the nutrient requirements of preterm infants.
Subjects and methods
Lactating women were recruited within a 1‐h driving radius of Raleigh, North Carolina from May 2013 to December 2013 using local parenting groups that communicated via Facebook. Women were eligible to participate if they had: given birth to a healthy, term infant who was between 9 and 11 months old at the time of recruitment; intended to breastfeed until their child was at least 18 months old and had access to a breast pump. Based on the results from previous studies on protein and calcium concentrations in milk, critical nutrients for the preterm neonate, the largest sample size computed to achieve 80% power with an alpha of 0.05, assuming a 20% change in these nutrients over the 7 month study period, was 16. Thirty‐three women were initially recruited to participate, assuming there might be a 50% dropout rate because of unplanned weaning. At the time of enrollment, participants signed an informed consent and were provided with verbal and written instruction for milk sample collection, as well as sterile collection containers and labels for collecting additional data about each sample.
Sample collection
Women were instructed to collect one milk sample per month, starting when their child was 11 months old, by completely expressing the content of one breast during the first or second feeding of the morning. Expressed samples were transferred to a sterile collection container, labelled and stored in the subject's freezer until the researcher picked up the samples when the subject reached 18 months postpartum. Subjects were excluded from the study if they missed more than one collection in the 7‐month period. Feeding metrics collected with each sample included time of collection (FeedTime), time of prior feeding (PriorTime) and estimated number of feedings per day (FeedFreq). Month of lactation (Month) was assigned to each sample based on date of parturition, with the first sample collected before the infant turned one year old (Month = 11), representing milk that is eligible for donation to many milk banks. The average interval between sample collection was 31.5 ± 6.3 days (median = 31.0 days), suggesting that samples were consistently collected on a monthly cycle. The time interval between feedings (FeedInt) was computed using FeedTime and PriorTime. Volume was recorded for each sample, which represented the complete expression of the breast and provided an indication of overall milk making capabilities. Fourteen women dropped out of the study because of early weaning or missed sample collection, leaving 19 subjects who provided a total of 131 longitudinal samples of mother's own milk (MOM) for analysis. In addition, 33 unpasteurized, pooled human milk samples were obtained from Mother's Milk Bank (San Jose, CA) and The Northeast Mother's Milk Bank (Newton Upper Falls, MA), representing milk currently accepted by HMBANA milk banks (MB). MB samples had been pooled by multiple donors and/or multiple stages of lactation within a donor and represented milk from 51 women who delivered term infants, with an average stage of lactation of 4.8 ± 3.3 months (median = 4.0 months).
Sample analysis
Frozen samples were transported to our laboratory, thawed, aliquoted and stored at −80°C until further analysis. All samples were analysed in triplicate by the same researcher unless otherwise noted. The following nutrients were measured: total protein; total fat; lactose; lactoferrin; lysozyme; Immunoglobulin A (IgA); calcium; iron; zinc; potassium; sodium and total HMOS.
Total protein was analysed using the bicinchoninic acid assay (BCA), which is based on the Biuret Reaction (PI23227; Fisher Scientific, Waltham, Massachusetts, USA) (Miller et al. 2013). Lysozyme was analysed based on changes in turbidity of a Micrococcus lysodeikticus (M3770; Sigma‐Aldrich, St. Louis, Missouri USA) bacterial suspension (Shugar 1952), and was adapted to a 96‐well plate format (Meng 2014). Lactoferrin and IgA were measured using an ELISA assay (EL2011‐1 and EI7001‐1, respectively; AssayPro, St. Charles, Missouri USA). The average intra‐assay coefficient of variation (CV) was 1.6%, 3.7%, 3.8% and 4.0% for total protein, lysozyme, lactoferrin and IgA, respectively. All protein assays were completed within one year of sample expression to ensure protein retention (Jensen 1995) except 19 samples for IgA and lactoferrin because of the need to repeat some assays (mean days between expression and assay of 224; minimum days of 23; maximum days of 433).
Total fat was measured with a SMART Trac Rapid Moisture/Fat Analyzer (CEM Corporation, Mathews, NC) using microwave drying and nuclear magnetic resonance. This method was previously validated as reliable (Fogleman 2008); thus only 10% of the samples were analysed in duplicate. The average intra‐assay CV was 1.6%.
Lactose and HMOS were analysed at Boston College (Chestnut Hill, MA) using graphitic carbon high‐performance liquid chromatography with tandem mass spectrometry, which has been described in detail elsewhere (Bao et al. 2013). Total HMOS reflect the sum of 2′‐fucosyllactose; 3‐fucosyllactose; lacto‐N‐tetraose; lacto‐N‐fucopentaose I, II and III; lacto‐N‐difucohexaose I and II; lactodifucotetraose; monosialyllacto‐N‐neotetraose; monosialyllacto‐N‐tetraose; 3′‐sialylactose; 6′‐sialylactose; disiayllacto‐N‐tetraose and sialyllacto‐N‐fucopentaose II and IV. Aliquots of milk samples were sent to Boston College on dry ice via overnight shipping. Duplicates of 10% of the samples were blinded to the researcher to evaluate the reliability of our methods, and the average CV for samples assayed in duplicate was 5.0% for lactose and 8.1% for total HMOS.
Minerals were analysed using spectroscopy, and samples were prepared based on EPA Method 3052 for microwave assisted acid digestion (EPA 1996), with modifications as follows: 10 mL of room temperature, vortexed milk was freeze‐dried in Teflon bottles using a Virtis 12XL Freezemobile (Virtis Company, Inc., Gardiner, New York, USA) to reduce contamination and eliminate the need for transferring samples; samples were heated on a hot plate instead of a microwave to reduce the chance of sample explosion and to increase the efficiency of processing a large number of samples; samples were totally digested using 10 mL of 15.8 N trace metal grade nitric acid (A509‐P212; Fisher Scientific), followed by 2 mL 30% hydrogen peroxide. Acid digestates were analysed using inductively coupled plasma optical emission spectroscopy (ICP‐OES), which was performed using a Perkin Elmer 8000 DV ICP‐OES (OPTIMA8000; Perkin Elmer, Waltham, Massachusetts, USA). Mineral analysis was conducted on single samples. Three of the subjects did not provide sufficient sample volume for mineral analysis; thus the mineral data represents longitudinal analysis on 16 subjects.
Statistical analysis and ethical approval
Summary statistics were calculated for target nutrients and feeding metrics based on Month of Lactation. A Random Coefficient Model was used to evaluate changes in MOM over time, which accounts for repeated measures from the same subject (Twisk 2004). Coefficients of determination (R2) were calculated to evaluate the goodness of fit of a bivariate regression model between target nutrients and Month of Lactation (a time‐effect) or Subject ID (a subject‐effect). A stepwise implementation within the Random Coefficient Model was used to evaluate whether additional independent variables explained changes in the target nutrients. Comparisons between MOM and MB samples were evaluated using a t‐test, and comparisons between MOM at different stages of lactation were evaluated using a t‐test with a Bonferroni's correction. All analysis was done using SAS software 9.3 (Cary, North Carolina). This study (protocol 3268) received ethical approval from the North Carolina State University Institutional Review Board.
Results
Temporal changes in mother's own milk
Summary statistics by Month of Lactation are presented in Table 1. Total protein, lactoferrin, lysozyme, IgA, sodium and total HMOS showed a significant increase over time in MOM, while calcium and zinc decreased significantly over time when analysed with a Random Coefficient Model (Fig. 1). There was no evidence of longitudinal change in lactose, total fat, potassium and iron. The magnitude of the monthly change, as measured by the slope of the Random Coefficient Model divided by the average value at Month 11 (the control), was lowest for total protein (+1.9%) and total calcium (−1.6%), intermediate for sodium (+5.7%), zinc (−5.8%), IgA (+6.0%) and total HMOS (+5.0%), and largest for lactoferrin (+9.7%) and lysozyme (+10.2%). The Na : K ratio was significantly higher only at Month 16 (0.25 ± 0.20), compared with the control Month 11 (0.19 ± 0.06). One subject in the study consistently displayed the highest concentrations of total protein, lactoferrin, lysozyme and IgA over all months of the study period; therefore the Random Coefficient Model was rerun without the data from this subject and conclusions remained consistent. The number of daily feedings gradually decreased over the study period from 6.4 ± 1.5 at Month 11, to 4.3 ± 1.3 at Month 17 (Table 1). Similarly, the volume of milk extracted during the complete expression of the breast gradually declined, although a statistically significant difference was not observed until Month 17.
Table 1.
Composition of mother's own milk (MOM) by month of lactation
| Mother's own milk by month of lactation | |||||||
|---|---|---|---|---|---|---|---|
| 11 | 12 | 13 | 14 | 15 | 16 | 17 | |
| # samples | 19 | 19 | 19 | 19 | 18 | 18 | 18 |
| Volume (mL) | 59 (28) | 56 (33) | 49 (23) | 45 (24) | 48 (27) | 49 (28) | 35*, † (19) |
| Feedings/day | 6.4 (1.5) | 5.8 (1.5) | 5.2* (1.6) | 5.0* (2.1) | 4.6*, † (1.4) | 4.5*, † (1.4) | 4.3*, † (1.3) |
| Protein (g/dL) | 1.6 (0.2) | 1.6 (0.2) | 1.7* (0.2) | 1.8*, † (0.2) | 1.7*, † (0.2) | 1.7* (0.2) | 1.8* (0.3) |
| Lactose (g/dL) | 5.7 (0.7) | 6.0 (0.8) | 5.6 (0.7) | 5.9 (0.8) | 5.7 (0.8) | 5.5 (0.5) | 5.6 (0.9) |
| Fat (%) | 4.0 (2.0) | 3.9 (2.0) | 4.6 (1.9) | 5.4 (2.5) | 4.3 (2.7) | 3.9 (1.9) | 4.6 (2.1) |
| Lactoferrin (mg/dL) | 180 (66) | 200 (85) | 210 (80) | 230 (96) | 250* (90) | 270* (120) | 280*, † (110) |
| Lysozyme (units/mL) | 58 000 (31 000) | 66 000 (35 000) | 72 000 (40 000) | 79 000 (46 000) | 85 000* (43 000) | 86 000* (44 000) | 98 000*, † (50 000) |
| IgA (mg/dL) | 21 (7.7) | 23 (7.1) | 25 (9.8) | 28* (11) | 27 (10) | 28* (9.3) | 29* (10) |
| Total HMOS (mg/mL) | 7.0 (2.1) | 7.5 (1.9) | 7.2 (2.6) | 8.3 (3.4) | 8.3 (2.3) | 8.7 (2.9) | 8.8* (3.8) |
| Minerals | |||||||
| # of Samples | 16 | 16 | 16 | 16 | 16 | 16 | 14 |
| Total K (µg/mL) | 370 (51) | 380 (69) | 370 (53) | 380 (59) | 380 (73) | 360 (78) | 370 (78) |
| Total Na (µg/mL) | 70 (19) | 70 (24) | 74 (34) | 76 (34) | 88* (23) | 89* (25) | 86 (35) |
| Total Ca (µg/mL) | 200 (29) | 200 (25) | 190 (29) | 190 (27) | 190 (25) | 180 (36) | 180 (30) |
| Total Fe (ng/mL) | 180 (87) | 210 (110) | 170 (130) | 200 (100) | 180 (110) | 190 (91) | 260 (140) |
| Total Zn (ng/mL) | 560 (330) | 600 (360) | 600 (390) | 440 (250) | 470 (320) | 420 (350) | 420 (310) |
| Na : K ratio | 0.19 (0.06) | 0.19 (0.07) | 0.20 (0.09) | 0.20 (0.08) | 0.25 (0.09) | 0.25* (0.10) | 0.23 (0.08) |
Data represents mean and (standard deviation) reported to two significant figures.
P < 0.05 for individual, independent comparisons to a control (month = 11) using a t‐test.
P < 0.007 for multiple comparisons to a control (month = 11) using a t‐test with a Bonferroni correction.
Figure 1.
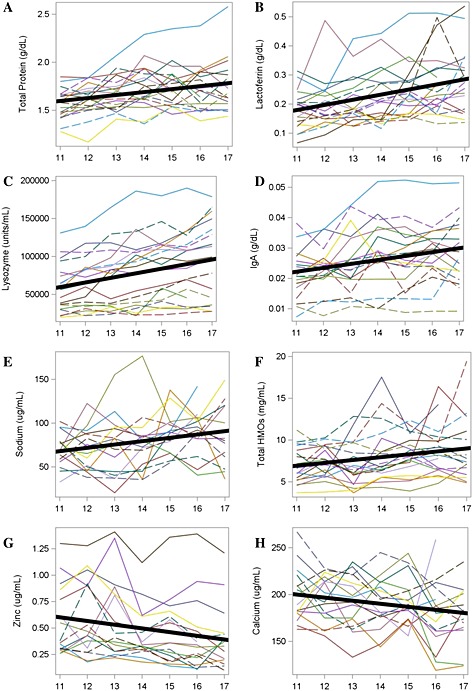
Individual subject changes and an overall model predicting target nutrients that changed significantly over time (P < 0.05).
There was a significant subject‐effect (P ≤ 0.01) for all nutrients in the Random Coefficient Model, regardless of whether there was a significant change over time. A bivariate analysis showed that the subject‐effect was greater than the time‐effect for all dependent variables, with R 2 ranging from 0.314 to 0.850 for Subject ID and 0.006 to 0.121 for Month of Lactation (Table 2).
Table 2.
Contribution of subject ID (a subject‐effect) and month of lactation (a time‐effect) on predicting target nutrients using a bivariate regression analysis
| Dependent variable (Y) | Coefficient of determination (R 2) | Ratio of subject effect : time effect | |
|---|---|---|---|
| Subject effect | Time effect | ||
| Protein | 0.711 | 0.103 | 6.9 |
| Lactose | 0.314 | 0.041 | 7.7 |
| Fat | 0.526 | 0.054 | 9.7 |
| Lactoferrin | 0.530 | 0.121 | 4.4 |
| Lysozyme | 0.850 | 0.086 | 9.9 |
| IgA | 0.755 | 0.080 | 9.4 |
| Total HMOS | 0.574 | 0.065 | 8.8 |
| Total K | 0.692 | 0.006 | 115.3 |
| Total Na | 0.449 | 0.078 | 5.8 |
| Total Ca | 0.543 | 0.056 | 9.7 |
| Total Fe | 0.441 | 0.061 | 7.2 |
| Total Zn | 0.823 | 0.058 | 14.2 |
| Na : K | 0.432 | 0.064 | 6.8 |
Other variables predicting changes in milk composition
In a stepwise multiple regression analysis, Volume was a significant predictor variable for 8 of the 12 target nutrients (P ≤ 0.10) and exerted an inverse effect (as volume decreased, the nutrient concentration increased). The nutrients that Volume did not predict were lactose, calcium, zinc and total HMOS. The second most common predictor variable was the Na : K ratio, which was positively associated with changes in protein, lactoferrin, lysozyme, IgA and total HMOS, and inversely associated with changes in total zinc and iron. FeedTime was positively associated with IgA, potassium and calcium concentration (feedings at later times in the day had higher concentrations), and was negatively associated with iron concentration (feeding at later times in the day had lower concentrations). FeedInt exerted a significant negative effect on total fat (as the number of hours between feedings increased, the fat content decreased) and a positive impact on sodium (as the number of hours between feedings increased, the sodium increased). FeedFreq exerted a significant negative effect on lysozyme and total iron. Lactose concentrations were not predicted by any of the independent variables in the model.
Second year mother's own milk vs. milk bank samples
Analysis of MOM samples was limited to those greater than 30 mL when comparing to MB samples because Volume was a predictor of several nutrient changes in our multiple regression analysis and because women must be producing a minimum amount of expressed milk in order to donate to a milk bank. Of the 112 samples of MOM that were expressed in the second year postpartum, 79 of the samples (70.5%), which came from 16 of the subjects, were greater than 30 mL. In a volume‐controlled analysis, MOM samples contained significantly higher concentrations of total protein, lactoferrin, lysozyme and IgA than MB samples (P ≤ 0.05), and significantly lower concentrations of calcium, iron, zinc and total HMOS (Table 3).
Table 3.
Comparison of mother's own milk > 30 mL to milk bank samples
| MOM > 30 mL (N = 79) | MB (N = 33) | P‐value | |
|---|---|---|---|
| Protein (g/dL)* | 1.7 (0.2) | 1.5 (0.2) | <0.01 |
| Lactose (g/dL) | 5.7 (0.8) | 5.6 (0.7) | 0.71 |
| Fat (%) | 4.1 (2.1) | 3.5 (1.7) | 0.14 |
| Lactoferrin (mg/dL)* | 210 (80) | 140 (66) | <0.01 |
| Lysozyme (units/mL)* | 68 000 (34 000) | 31 000 (24 000) | <0.01 |
| IgA (mg/dL)* | 23 (7.8) | 17 (7.2) | <0.01 |
| Total HMOS (mg/mL)* | 8.2 (2.8) | 9.3 (2.0) | 0.05 |
| Total K (µg/mL) | 370 (67) | 390 (75) | 0.15 |
| Total Na (µg/mL) | 76 (26) | 83 (31) | 0.26 |
| Total Ca (µg/mL)* | 190 (30) | 220 (49) | <0.01 |
| Total Fe (ng/mL)* | 190 (110) | 230 (64) | 0.05 |
| Total Zn (ng/mL)* | 540 (340) | 1200 (700) | <0.01 |
| Na K | 0.21 (0.08) | 0.21 (0.08) | 0.97 |
MOM, mother's own milk; MB, milk bank.
Data represent means (standard deviations) reported to two significant figures.
Significant difference at P < 0.05 using a t‐test.
Discussion
Macronutrients
The total protein concentration of human milk increased longitudinally in the second year postpartum, while there was no observed change in lactose concentration, which is consistent with other findings in the literature (Lauber & Reinhardt 1979; Garza et al. 1983; Dewey et al. 1984; Neville et al. 1991). The fat composition of human milk has traditionally been more difficult to assess because of within and between feed variations (Freed et al. 1986; Miller et al. 2013). Prior research on total fat composition in late lactation reported equivocal results, with some studies showing that total fat concentration increased (Underwood et al. 1970; Mandel et al. 2005), and other studies showing that fat content was stable (Lauber & Reinhardt 1979; Dewey et al. 1984). Our study, which controlled for month of lactation, collection time, collection volume and intervals between feeding, found that fat composition was not influenced by month of lactation, but increased as the milk volume in the breast decreased and as the interval between feedings decreased. Overall, these findings suggest that the macronutrient value of human milk in the second year postpartum is stable or increasing and is not inferior when compared with mature milk currently collected by HMBANA milk banks.
Antimicrobial proteins
We observed increases in three abundant antimicrobial proteins of human milk: lysozyme, lactoferrin and IgA. An increase in lysozyme concentration in the second year of lactation has been described by others using cross‐sectional or semi‐longitudinal study designs; however lactoferrin and IgA concentrations were reported as stable or declining in these studies (Goldman et al. 1983; Prentice et al. 1984; Hennart et al. 1991). Our research suggests that a strong subject‐effect explains the majority of differences in lactoferrin, lysozyme and IgA composition (R 2 of 0.530, 0.850 and 0.755, respectively); therefore subject‐effects may have masked time‐related changes in cross‐sectional and semi‐longitudinal studies. Others who have studied lactoferrin, lysozyme and IgA in human milk longitudinally have also reported a strong subject‐effect (Lewis‐Jones, Lewis‐Jones et al. 1985). These antimicrobial proteins have been described as providing increased antioxidant capacity (Mehta & Petrova 2014), greater bone mineralization (Cornish et al. 2004), responsive and protective immunity (Breakey et al. 2015), and development of a beneficial gut microflora (Mastromarino et al. 2014). Concentrations of IgA and lactoferrin are highest in the first days of lactation and then rapidly decline (Goldman et al. 1982; Lewis‐Jones, Lewis‐Jones et al. 1985; Rai et al. 2014); therefore the higher concentrations we observed in the second year postpartum may better meet preterm infants' needs for these proteins than mature milk donated in the first year postpartum.
Minerals
In contrast to stable or increasing macronutrients and antimicrobial proteins, we observed a gradual longitudinal decline in the concentration of zinc and calcium, which is consistent with other findings in the literature (Vaughan et al. 1979; Dewey et al. 1984; Karra et al. 1986; Casey et al. 1989; Bates & Tsuchiya 1990; Laskey et al. 1990; Shehadeh et al. 2006). Zinc and calcium decreased less than 5% per month, suggesting that milk bank donations beyond one year postpartum may be slightly lower in some micronutrients that are important for the preterm infant. We validated this finding in our comparison of late‐lactation MOM samples to MB samples, where zinc, calcium and iron were significantly lower in MOM samples.
Total HMOS
This is the first study to report on total HMOS concentrations in the second year after parturition. Prior longitudinal research described decreasing concentrations of fucosylated HMOS in the first 49 weeks of lactation (Chaturvedi et al. 2001). Our research showed a significant, gradual increase in total HMOS between 11 and 17 months postpartum in MOM; however HMOS composition in MOM was significantly lower than MB samples, and it was lower than values reported in the literature during early lactation (Chaturvedi et al. 2001; Bode 2012; Marx et al. 2014).
Mammary gland changes
The sodium–potassium ratio has been reported as a biomarker for measuring the function of mammary gland tight junctions, and thus the ability for some nutrients to flow into the mammary gland via paracellular pathways during the early lactation and weaning periods (Neville et al. 1991). Although minimal longitudinal changes in the mammary gland tight junction were observed using Na : K as a biomarker, it is possible that compositional changes were associated with decreased milk making capabilities in the mammary gland as evidenced by decreasing expression volumes and the significance of Volume as an inverse predictor variable for many analytes.
Subject vs. time effect
It is important to note that the subject‐effect explained more of the variation in all analytes within the longitudinal samples (R 2 from 0.314 to 0.850) compared with the time‐effect (R 2 from 0.006 to 0.121). This suggests that the duration of lactation will have a smaller impact on the composition of PDM than the individual milk bank donors, and that pooling strategies are important for milk banks to reduce the variation in nutrients provided in donor milk.
Limitations
This study had several limitations. All subjects were recruited from the same geographic area, and no information was gathered on maternal diet patterns or illnesses, so there is the possibility that other factors may have contributed to the longitudinal changes in MOM that were observed. Historical research suggests that maternal diet patterns do not alter the target nutrients we analysed (Lönnerdal 1986); however, a recent small cross‐over study showed that elevated maternal fat intake resulted in an increase in total milk fat, although no changes in mammary gland gene expression were identified (Yahvah et al. 2015). The sample size in our study was relatively small; however, this was balanced by the fact that we collected repeated monthly measures on all subjects over seven months. We reported higher total protein levels than those often cited in the literature, which may be a result of analysis using the BCA method, which has been shown to overestimate total protein in human milk compared with other methods (Lönnerdal et al. 1987). Although this warrants further investigation, we achieved very low CVs on analyses performed in triplicate and feel confident in the trends that were identified, irrespective of absolute protein values. Our analysis only went through 17 months postpartum; therefore findings may not be generalizable to later postpartum periods. However, this research suggests that volume was a more consistent predictor of milk composition than month of lactation, suggesting that women who are still expressing milk volumes that are adequate for milk bank donation are likely to experience similar trends beyond 17 months postpartum to those observed in this study.
Conclusions
Our study found that human milk in the second year postpartum contains stable or increasing concentrations of macronutrients and bioactive factors, and small decreases in concentrations of zinc and calcium in women who continue to breastfeed or express milk at least three to four times per day. Accepting milk bank donations from lactating mothers beyond one year postpartum could increase the supply of PDM while also raising the concentration of total protein, lactoferrin, IgA and lysozyme in pooled donor milk; however mineral fortification might be considered. The European Society of Pediatric Gastroenterology, Hepatology and Nutrition (ESPGHAN) recommends that preterm infants receive higher concentrations of total protein, calcium, zinc and other micronutrients than are typically found in human milk (Agostoni et al. 2010), and the American Academy of Pediatrics recommends appropriate fortification of human milk for infants weighing less than 1500 g (AAP 2012). Fortifier products currently on the market contain high levels of many minerals including calcium and zinc, which were declining in second year milk samples (Abbott Nutrition 2015; Prolacta 2015). Future research should focus on mineral bioavailability and outcomes for preterm infants fed fortified MOM or PDM. Research into optimal milk bank pooling protocols is also warranted.
Source of funding
Supported by a North Carolina State University College of Agriculture and Life Sciences Dean's Enrichment Grant (to ADF); the American Society of Nutrition's Gerber Foundation Predoctoral Fellowship Award (to MTP) and by research gifts from Mother's Milk Bank of San Jose, CA, Mother's Milk Bank of Denver, CO, and The Mother's Milk Bank Northeast (to ADF).
Conflicts of interest
ADF and DSN serve on the Board of Directors for the Human Milk Banking Association of North America without compensation. MTP and JCA have no conflicts of interest to report.
Contributions
The authors' responsibilities were as follows: MTP and JCA developed the study design; MTP and DSN conducted the research; MTP, JCA and ADF analysed the data; MTP wrote the first draft of the manuscript; JCA, ADF and DSN edited the manuscript; all authors read and approved the final manuscript. The funding organizations had no role in the design and conduct of the study; analysis or interpretation of the data; or preparation, review or approval of the manuscript.
Acknowledgement
We would like to thank the mothers who generously provided milk samples over the course of the study.
Perrin M. T., Fogleman A. D., Newburg D. S., and Allen J. C. (2017) A longitudinal study of human milk composition in the second year postpartum: implications for human milk banking, Maternal & Child Nutrition, 13, e12239. doi: 10.1111/mcn.12239.
References
- AAP (2012) Breastfeeding and the use of human milk. Pediatrics 129, e827–e841. [DOI] [PubMed] [Google Scholar]
- Abbott Nutrition (2015) Similac ® Human Milk Fortifier Powder. Available at: http://static.abbottnutrition.com/cms-prod/abbottnutrition.com/img/Similac-Human-Milk-Fortifier-Powder.pdf (Accessed 24 September 2015).
- Abrams S.A. & Committee on Nutrition (2013) Calcium and vitamin D requirements of enterally fed preterm infants. Pediatrics 131, e1676. [DOI] [PubMed] [Google Scholar]
- Agostoni C., Genzel‐Boroviczeny O., Goulet O., Kalhan S.C., Kolacek S., Koletzko B. et al. (2010) Enteral nutrient supply for preterm infants: commentary from the European Society of Paediatric Gastroenterology, Hepatology and Nutrition Committee on Nutrition. Journal of Pediatric Gastroenterology and Nutrition 50, 85. [DOI] [PubMed] [Google Scholar]
- Association of Italian Milk Banks . Donate milk. Available at: http://aiblud.com/donare-il-latte/ (Accessed 09 February 2015).
- Bao Y., Chen C. & Newburg D.S. (2013) Quantification of neutral human milk oligosaccharides by graphitic carbon high‐performance liquid chromatography with tandem mass spectrometry. Analytical Biochemistry 433, 28–35. [DOI] [PMC free article] [PubMed] [Google Scholar]
- Bates C.J. & Tsuchiya H. (1990) Zinc in breast milk during prolonged lactation: comparison between the UK and the Gambia. European Journal of Clinical Nutrition 44, 61. [PubMed] [Google Scholar]
- Bode L. (2012) Human milk oligosaccharides: every baby needs a sugar mama. Glycobiology 22, 1147–1162. [DOI] [PMC free article] [PubMed] [Google Scholar]
- Breakey A.A., Hinde K., Valeggia C.R., Sinofsky A. & Ellison P.T. (2015) Illness in breastfeeding infants relates to concentration of lactoferrin and secretory Immunoglobulin A in mother's milk. Evolution, Medicine, and Public Health 1, 21–31. [DOI] [PMC free article] [PubMed] [Google Scholar]
- Casey C.E., Neville M.C. & Hambidge K.M. (1989) Studies in human lactation: secretion of zinc, copper, and manganese in human milk. The American Journal of Clinical Nutrition 49, 773. [DOI] [PubMed] [Google Scholar]
- Chaturvedi P., Warren C.D., Altaye M., Morrow A.L., Ruiz‐Palacios G., Pickering L.K. et al. (2001) Fucosylated human milk oligosaccharides vary between individuals and over the course of lactation. Glycobiology 11, 365–372. [DOI] [PubMed] [Google Scholar]
- Cornish J., Callon K., Naot D., Palmano K., Banovic T., Bava U. et al. (2004) Lactoferrin is a potent regulator of bone cell activity and increases bone formation in vivo. Endocrinology 145, 4366–4374. [DOI] [PubMed] [Google Scholar]
- Dewey K.G., Finley D.A. & Lönnerdal B. (1984) Breast milk volume and composition during late lactation (7–20 months). Journal of Pediatric Gastroenterology and Nutrition 3, 713. [DOI] [PubMed] [Google Scholar]
- DHHS (2011) The Surgeon General's Call to Action to Support Breastfeeding. US Department of Health and Human Services, Office of the Surgeon General: Washington, DC. [Google Scholar]
- EPA (1996) Method 3052: microwave assisted acid digestion of siliceous and organically based matrices. Available at: http://www.epa.gov/solidwaste/hazard/testmethods/sw846/pdfs/3052.pdf (Accessed 01 June 2015).
- Fogleman A.D. (2008) Effect of storage time and temperature on components in human breast milk. Master thesis, North Carolina State University. Available at: http://www.lib.ncsu.edu/resolver/1840.16/1710 (Accessed 17 June 2014).
- Freed L.M., Neville M.C., Hamosh P. & Hamosh M. (1986) Diurnal and within‐feed variations in lipase activity and triglyceride content of human milk. Journal of Pediatric Gastroenterology and Nutrition 5, 938. [DOI] [PubMed] [Google Scholar]
- Ganapathy V., Hay J.W. & Kim J.H. (2012) Costs of necrotizing enterocolitis and cost‐effectiveness of exclusively human milk‐based products in feeding extremely premature infants. Breastfeeding Medicine 7, 29–37. [DOI] [PubMed] [Google Scholar]
- Garza C., Johnson C.A., Smith E.O. & Nichols B.L. (1983) Changes in the nutrient composition of human milk during gradual weaning. The American Journal of Clinical Nutrition 37, 61. [DOI] [PubMed] [Google Scholar]
- Goldman A.S., Garza C., Nichols B.L. & Goldblum R.M. (1982) Immunologic factors in human milk during the first year of lactation. The Journal of Pediatrics 100, 563. [DOI] [PubMed] [Google Scholar]
- Goldman A.S., Goldblum R.M. & Garza C. (1983) Immunologic components in human milk during the second year of lactation. Acta Paediatrica Scandinavica 72, 461. [DOI] [PubMed] [Google Scholar]
- Griffin I.J., Domellof M., Bhatia J., Anderson D.M. & Kler N. (2013) Zinc and copper requirements in preterm infants: an examination of the current literature. Early Human Development 89 Suppl 2, S29. [DOI] [PubMed] [Google Scholar]
- Hennart P., Brasseur D., Delogne‐Desnoeck J., Dramaix M. & Robyn C. (1991) Lysozyme, lactoferrin, and secretory immunoglobulin A content in breast milk: influence of duration of lactation, nutrition status, prolactin status, and parity of mother. American Journal of Clinical Nutrition 53, 32–39. [DOI] [PubMed] [Google Scholar]
- Hettinga K., Van Valenberg H., De Vries S., Boeren S., Van Hooijdonk T., Van Arendonk J. et al. (2011) The host defense proteome of human and bovine milk. PloS One 6, e19433. [DOI] [PMC free article] [PubMed] [Google Scholar]
- Horta B., Bahl R., Martines G. & Victora C. (2007) Evidence on the Long‐Term Effects of Breastfeeding: Systematic Review and Meta‐Analyses. World Health Organization: Geneva, Switzerland. [Google Scholar]
- Jensen R. (1995) Handbook of Milk Composition. Academic Press: San Diego. [Google Scholar]
- Karra M.V., Udipi S.A., Kirksey A. & Roepke J.L. (1986) Changes in specific nutrients in breast milk during extended lactation. The American Journal of Clinical Nutrition 43, 495. [DOI] [PubMed] [Google Scholar]
- Laskey M.A., Prentice A., Shaw J., Zachou T., Ceesay S.M., Vasquez‐Velasquez L. et al. (1990) Breast‐milk calcium concentrations during prolonged lactation in British and rural Gambian mothers. Acta Paediatrica Scandinavica 79, 507. [DOI] [PubMed] [Google Scholar]
- Lauber E. & Reinhardt M. (1979) Studies on the quality of breast milk during 23 months of lactation in a rural community of the Ivory Coast. The American Journal of Clinical Nutrition 32, 1159. [DOI] [PubMed] [Google Scholar]
- Lewis‐Jones D.I., Lewis‐Jones M.S., Connolly R.C., Lloyd D.C. & West C.R. (1985) Sequential changes in the antimicrobial protein concentrations in human milk during lactation and its relevance to banked human milk. Pediatric Research 19, 561–565. [DOI] [PubMed] [Google Scholar]
- Lönnerdal B. (1986) Effects of maternal dietary intake on human milk composition. The Journal of Nutrition 116, 499. [DOI] [PubMed] [Google Scholar]
- Lönnerdal B. (2013) Bioactive Proteins in Breast Milk. Wiley Subscription Services, Inc.: Australia. [Google Scholar]
- Lönnerdal B., Woodhouse L.R. & Glazier C. (1987) Compartmentalization and quantitation of protein in human milk. The Journal of Nutrition 117, 1385. [DOI] [PubMed] [Google Scholar]
- Mandel D., Lubetzky R., Dollberg S., Barak S. & Mimouni F.B. (2005) Fat and energy contents of expressed human breast milk in prolonged lactation. Pediatrics 116, e432. [DOI] [PubMed] [Google Scholar]
- Mantis N.J. & Forbes S.J. (2010) Secretory IgA: arresting microbial pathogens at epithelial borders. Immunological Investigations 39, 383–406. [DOI] [PMC free article] [PubMed] [Google Scholar]
- Marx C., Bridge R., Wolf A.K., Rich W., Kim J.H. & Bode L. (2014) Human milk oligosaccharide composition differs between donor milk and mother's own milk in the NICU. Journal of Human Lactation 30, 54–61. [DOI] [PubMed] [Google Scholar]
- Mastromarino P., Capobianco D., Campagna G., Laforgia N., Drimaco P., Dileone A. et al. (2014) Correlation between lactoferrin and beneficial microbiota in breast milk and infant's feces. BioMetals 27, 1077–1086. [DOI] [PubMed] [Google Scholar]
- Mehta R. & Petrova A. (2014) Is variation in total antioxidant capacity of human milk associated with levels of bio‐active proteins? Journal of Perinatology 34, 220. [DOI] [PubMed] [Google Scholar]
- Meng T. (2014) Effect of storage on bacteriological and immunological qualities in fresh, pasteurized and leftover human milk. Master Thesis, North Carolina State University. Available at: http://www.lib.ncsu.edu/resolver/1840.16/9404 (Accessed 3 June 2014)
- Milk Matters Milk Bank . How does one go about donating breastmilk? Available at: http://www.milkmatters.org/donatemilk/process.html (Accessed 09 February 2015).
- Miller E.M., Aiello M.O., Fujita M., Hinde K., Milligan L. & Quinn E.A. (2013) Field and laboratory methods in human milk research. American Journal of Human Biology 25, 1–11. [DOI] [PubMed] [Google Scholar]
- Neville M.C., Allen J.C., Archer P.C., Casey C.E., Seacat J., Keller R.P. et al. (1991) Studies in human lactation: milk volume and nutrient composition during weaning and lactogenesis. The American Journal of Clinical Nutrition 54, 81. [DOI] [PubMed] [Google Scholar]
- Newburg D.S. (2009) Neonatal protection by an innate immune system of human milk consisting of oligosaccharides and glycans. Journal of Animal Science 87 (Number 13, Supplement 1), 26–34. [DOI] [PubMed] [Google Scholar]
- Parker M.G.K., Barrero‐Castillero A., Corwin B.K., Kavanagh P.L., Belfort M.B. & Wang C.J. (2013) Pasteurized human donor milk use among US level 3 neonatal intensive care units. Journal of Human Lactation 29, 381–389. [DOI] [PubMed] [Google Scholar]
- Perrin M.T., Fogleman A. & Allen J.C. (2013) The nutritive and immunoprotective quality of human milk beyond 1 year postpartum: are lactation‐duration‐based donor exclusions justified? Journal of Human Lactation 29, 341–349. [DOI] [PubMed] [Google Scholar]
- Perrine C.G. & Scanlon K.S. (2013) Prevalence of use of human milk in US advanced care neonatal units. Pediatrics 131 (6), 1066. [DOI] [PMC free article] [PubMed] [Google Scholar]
- Prentice A., Prentice A.M., Cole T.J., Paul A.A. & Whitehead R.G. (1984) Breast‐milk antimicrobial factors of rural Gambian mothers. I. Influence of stage of lactation and maternal plane of nutrition. Acta Paediatrica Scandinavica 73, 796. [DOI] [PubMed] [Google Scholar]
- Prolacta (2015) Nutrition information. Available at: http://www.prolacta.com/Data/Sites/14/media/PDF/mkt-180-prolact-hmf-nutrition-labels.pdf (Accessed 24 September 2015).
- Quigley M. & McGuire W. (2014) Formula versus donor breast milk for feeding preterm or low birth weight infants. The Cochrane Database of Systematic Reviews 4, CD002971. [DOI] [PubMed] [Google Scholar]
- Rai D., Adelman A.S., Zhuang W., Rai G.P., Boettcher J. & Lönnerdal B. (2014) Longitudinal changes in lactoferrin concentrations in human milk: a global systematic review. Critical Reviews in Food Science and Nutrition 54, 1539–1547. [DOI] [PubMed] [Google Scholar]
- Rao R. & Georgieff M.K. (2009) Iron therapy for preterm infants. Clinics in Perinatology 36, 27–42. [DOI] [PMC free article] [PubMed] [Google Scholar]
- Shehadeh N., Aslih N., Shihab S., Werman M.J., Sheinman R. & Shamir R. (2006) Human milk beyond one year post‐partum: lower content of protein, calcium, and saturated very long‐chain fatty acids. The Journal of Pediatrics 148, 122–124. [DOI] [PubMed] [Google Scholar]
- Shugar D. (1952) The measurement of lysozyme activity and the ultra‐violet inactivation of lysozyme. BBA—Biochimica et Biophysica Acta 8, 302–309. [DOI] [PubMed] [Google Scholar]
- Twisk J.W.R. (2004) Longitudinal data analysis: a comparison between generalized estimating equations and random coefficient analysis. European Journal of Epidemiology 19, 769–776. [DOI] [PubMed] [Google Scholar]
- Underwood B.A., Hepner R. & Abdullah H. (1970) Protein, lipid, and fatty acids of human milk from Pakistani women during prolonged periods of lactation. The American Journal of Clinical Nutrition 23, 400. [DOI] [PubMed] [Google Scholar]
- Updegrove K.H. (2013) Donor human milk banking: growth, challenges, and the role of HMBANA. Breastfeeding Medicine 8, 435–437. [DOI] [PubMed] [Google Scholar]
- Vaughan L.A., Weber C.W. & Kemberling S.R. (1979) Longitudinal changes in the mineral content of human milk. The American Journal of Clinical Nutrition 32, 2301. [DOI] [PubMed] [Google Scholar]
- WHO (2008) Infant and young child nutrition: biennial progress report. World Health Assembly 61.20. World Health Organization.
- Yahvah K.M., Brooker S.L., Williams J.E. , Settles M., McGuire M.A. & McGuire M.K. (2015) Elevated dairy fat intake in lactating women alters milk lipid and fatty acids without detectible changes in expression of genes related to lipid uptake or synthesis. Nutrition Research 35, 221–228. [DOI] [PubMed] [Google Scholar]
- Zivkovic A.M., German J.B., LeBrilla C.B., Mills D.A. & Klaenhammer T.R. (2011) Human milk glycobiome and its impact on the infant gastrointestinal microbiota. Proceedings of the National Academy of Sciences of the United States of America 108, 4653–4658. [DOI] [PMC free article] [PubMed] [Google Scholar]