

Abstract
Corn Soy Blend (CSB) porridge is commonly prepared with oil for treatment of moderate acute malnutrition (MAM). A recent review recommended that 30 g of oil be used with 100 g of CSB to increase energy density and micronutrient absorption. This study assessed the effectiveness and cost‐effectiveness of program changes aimed at achieving that target oil:CSB ratio in prepared porridge. Caregivers of children in MAM supplementary feeding programs were assigned to three groups: a control group received monthly rations of 1 L oil, 8 kg CSB in bulk, and social and behavior change communication (SBCC); intervention groups received 2.6 L oil, 8 kg CSB provided either in bulk (Group 1) or four 2‐kg packages with printed messages (Group 2), and enhanced SBCC emphasizing the target oil:CSB ratio. Compared to the control, both intervention groups had higher mean added oil per 100 g CSB (18 g, p < 0.01, and 13 g, p= 0.04, higher in groups 1 and 2, respectively), and greater odds of meeting or exceeding the target ratio (28.4, p< 0.01, and 12.7, p= 0.02, in groups 1 and 2, respectively). Cost per caregiver reaching the target ratio was most favorable in Group 1 ($391 in Group 1, $527 in Group 2, and $1,666 in the control). Enhanced SBCC combined with increased oil ration resulted in increased use of oil in CSB porridge in a supplementary feeding program. Modified packaging did not improve effectiveness. However, both interventions were more cost‐effective than standard programming.
Keywords: corn soy blend, food aid, fortified blended food, Moderate acute malnutrition, social and behavior change communication, supplementary feeding
1. INTRODUCTION
It is estimated that globally, there are more than 33 million children suffering from moderate acute malnutrition (Patel, Sandige, & Ndekha, 2005; Phuka, 2008). Efforts to prevent and treat moderate acute malnutrition (MAM) typically rely on nutrient‐dense supplementary foods, including several variations of fortified blended foods, combinations of fortified blended foods with other commodities, and ready‐to‐use supplementary foods (RUSFs). Corn Soy Blend (CSB) with fortified vegetable oil is one such combination used in United States Agency for International Development (USAID), Office of Food for Peace supported programs to treat MAM.
A recent review of research on supplementary feeding (Webb et al., 2011) recommended that CSB be prepared into a porridge with vitamin A & D fortified vegetable oil at a ratio of 30 g added oil per 100 g CSB (abbreviated 30:100) to increase calorie density, enhance absorption of fat‐soluble vitamins, and improve the profile of essential fatty acids in order to address the nutritional needs of children with MAM (Webb et al., 2011). WHO recommends that supplementary foods for children with MAM contain 25–65 g fat per 1000 kcal (WHO, 2012). When 100 g of CSB porridge is prepared with the recommended 30 g of oil, the resulting fat content is 60 g of fat per 1000 kcal (Webb et al., 2011). This is higher than other fortified blended foods such as Super Cereal Plus (SC+), which has additional oil embedded during production and contains about 24 g of fat per 1000 kcal (Nguyen, 2014), and closer to the fat content of RUSFs such as Plumpy'Sup, which has 62 g of fat per 1000 kcal (WFP, n.d.).
Caregivers are often given oil for addition to CSB porridge, and use it as it improves palatability, but there is no standard amount of oil given with CSB in supplementary feeding programs, and programs do not typically emphasize the importance of using a specific quantity of oil (De Pee & Bloem, 2009). Some donors and implementing agencies argue that when oil is delivered as a commodity separate from CSB, the oil may be diverted for other uses, including for family meals or for sale in the market, yielding porridge with insufficient oil, or fat, content. Therefore, in order to ensure sufficient fat intake, many agencies preferentially provide SC+ or RUSF, which do not require added oil. These commodities, however, are more expensive per treated child than CSB with oil given separately (Webb et al., 2011).
The feasibility of increasing the ratio of oil to CSB in caregivers' porridge preparation has not been empirically tested. The purpose of this study was to assess the effectiveness and cost‐effectiveness of programmatic changes with regard to increasing the amount of oil caregivers add to CSB porridge to at least the targeted 30:100 ratio. This study did not assess MAM recovery outcomes. The study assessed whether providing CSB with sufficient oil to permit the 30:100 ratio, along with enhanced social and behavior change communication (SBCC) to encourage the use of oil, would succeed in increasing the amount of added oil in CSB porridge to at least the target ratio. The study also assessed the additional effect of repackaging CSB into smaller packets with printed messages to increase caregiver compliance with instructions on porridge preparation.
Key messages.
It is feasible to increase the amount of oil caregivers add to CSB porridge, through a combination of providing sufficient oil to permit preparation at the recommended ratio and enhanced SBCC.
Enhanced SBCC with increased oil ration resulted in increased use of oil in CSB porridge in a supplementary feeding program in which oil was provided separately from CSB. Modified CSB packaging did not improve effectiveness.
Both interventions were more cost‐effective than standard programming in increasing the oil:CSB ratio.
Further research should assess the effect of increased oil on child growth and development and on MAM recovery.
2. PARTICIPANTS AND METHODS
2.1. Study design and setting
This was a cross‐sectional effectiveness study, built upon an existing USAID, Office of Food for Peace supplementary feeding program for treatment of children with MAM called Wellness and Agriculture for Life Advancement (WALA), which served rural communities in low‐income areas of Malawi. The study was conducted in four districts in Southern Malawi (Mulanje, Chiradzulu, Machinga, Balaka) from March to July 2014.
Under the WALA program, children identified as having MAM at health clinics or during community screenings were eligible to receive a monthly food ration of 8 kg of CSB in bulk and 1 L of fortified vegetable oil for four consecutive months, to be collected at their food distribution point (FDP). The WALA program used the Care Group model (Perry et al., 2014) of having trained community volunteers called ‘lead mothers’ work with community health workers to spread SBCC through in‐home visits and care group meetings. We contracted an external agency to conduct a formative evaluation to develop the SBCC materials and messages related to preparation of CSB porridge with the 30:100 ratio. SBCC focused on correct preparation, feeding, storage, and targeting of the ration. The message on the ratio of 30:100 was emphasized by community health workers and lead mothers (Kumwenda et al., 2016).
Subjects were assigned to a study group based on their FDP; each FDP was assigned to one study group. Non‐random assignment of FDPs was required in order to ensure that those receiving a program change (intervention groups) and those receiving no program change (control) were geographically separate from each other to avoid potential spill‐over or contamination. Therefore, a quasi‐experimental design with non‐random assignment was chosen.
Due to the design of the WALA program, it was not feasible to collect longitudinal data from individual study participants. Individuals were enrolled for only four months, and implementation of the intervention took over a month period (training the staff in the SBCC messages and in the appropriate handling of food at distribution); participants needed to be exposed to the intervention for at least a month before being interviewed, so there was not time for the same individuals to be measured at baseline and again after implementation of the interventions.
Two groups that received intervention and one control group were included. To strengthen internal validity, data were collected from independent samples drawn from the groups that received intervention, 6 months prior to implementation. Due to budget and logistic constraints, control FDPs were only added at the time of implementation of the intervention. This provided information about baseline levels of added oil in CSB porridge, which justified post‐intervention comparison of study groups. CSB porridge samples collected at baseline prior to the intervention showed mean added oil per 100 g CSB to be 7 ± 8 (mean ± SD) in Group 1 and 7 ± 9 in Group 2. The control group received the standard monthly ration and SBCC covering general health messages on family planning, HIV, vaccinations, and other topics. Intervention Group 1 received 8 kg CSB/month in bulk, an increased oil ration of 2.6 L/month (so that the 30:100 target ratio could be met with the monthly CSB ration) and enhanced SBCC emphasizing the target oil:CSB ratio from community health workers at the FDP and from lead mothers during in‐home visits and care group meetings. Intervention Group 2 received the same amount of oil and CSB and the same SBCC as group 1, but their CSB ration was distributed in four 2‐kg bags with printed behavior‐change and preparation messaging on the package (Supplementary Figure 1). The study protocol was approved by the Health Sciences Institutional Review Board at Tufts University in Boston, MA, and by the National Health Sciences Research Committee of the Malawi Ministry of Health in Lilongwe, Malawi.
Figure 1.
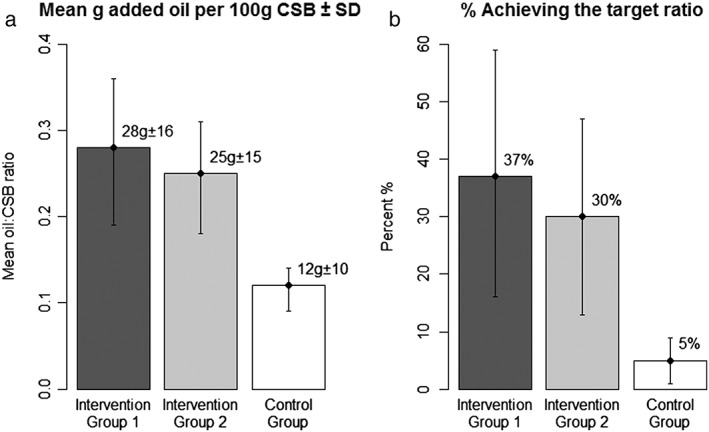
Mean g added oil per 100 g CSB (oil:CSB ratio) and percent of caregivers meeting or exceeding the target ratio (30:100) by study group a, b, and c
a Abbreviations: CSB, corn soy blend
b The error bars represent 95% CIs, adjusted for clustering at the FDP level
c Sample sizes by group are as follows: n = 142 for intervention group 1; n = 156 for intervention group 2; and n = 157 for the control group
2.2. Study participants, sampling and sample size
Study participants were caregivers of beneficiary children, 6–59 months of age, who were enrolled in the WALA program. Sampling occurred in three stages. The first stage of sampling was among the six private voluntary organizations (PVOs) through which the WALA treatment program operated under the overall supervision of Catholic Relief Services. All six had a history of working in the area before the program, and all had been implementing the program since its initiation. The research team, in consultation with CRS, selected three PVOs based on their willingness to participate in the study. The three PVOs managed a total of 32 FDPs, 16 of which were purposively selected for the research in the second stage of sampling. The FDPs were stratified by PVO and district, and assigned to treatment groups such that all three PVOs and all districts were represented in each group. The groups were formed with geographic buffer zones between them. The two treatment groups were randomly assigned to intervention groups 1 and 2 (six FDPs in each); the control group (four FDPs) was purposively chosen to represent all three PVOs and all districts, and to be geographically separate from the treatment groups in order to avoid contamination among the groups. Only four FDPs were included in the control group due to budget limitations. Both intervention groups received the additional oil ration with SBCC. One of these groups was randomly selected to receive CSB in the new packaging. In the third stage of sampling, a list of beneficiaries attending on a given day was generated at each FDP. This list served as the sampling frame from which beneficiaries were randomly selected for participation, with FDPs within each study group containing an equal number of subjects. Consent was obtained from all study participants prior to their involvement in the research.
Sample size was calculated based on two outcome variables: the average g added oil per 100 g CSB in prepared porridge (oil:CSB ratio), and the proportion of caregivers preparing porridge with a ratio of at least 30:100, as determined by lab analysis of porridge samples. At baseline, the amount of added oil to CSB porridge was low, at about 7 g per 100 g of CSB, and the goal was to achieve a substantial difference (that is, a large effect). Applying an ICC of .05 (calculated from baseline data), we calculated that a sample size of 200 per group, obtained by sampling from six clusters per group with an average of 33 subjects per cluster, would permit detection of mean differences between 5 and 21 g of added oil per 100 g CSB depending on the standard deviation (from 10 to 40, respectively), and a difference in group proportions of caregivers meeting or exceeding the target ratio of between 14 and 20 percentage points depending on the initial proportion (from 5 to 15 percentage points, respectively), with a power of .8 and an alpha of .05. Due to logistical reasons, only four FDPs were included in the control group. For this scenario – comparing one group with four clusters and 50 subjects per cluster to a group with six clusters and 33 subjects per cluster – using the same criteria as above, the detectable effect sizes ranged from 6 to 22 g of added oil and a 17 to 21 percentage point difference.
2.3. Data collection
Enumerators conducted interviews among caregivers to collect the following information: participant and household characteristics; enrollment and experience in the WALA treatment program; sharing of supplement ration with other household members or outside the household; accessibility of the FDP and means of transport used to reach FDP; preparation and consumption of CSB porridge; and handling and storage of ration. Preparation and consumption of porridge were measured by asking the beneficiary to demonstrate, using food models (water for oil and rice for CSB and porridge) in her own utensils, the amounts of ingredients used and or porridge consumed by the child at the last feeding. In addition, samples of prepared porridge were collected during interviews. (Note that the estimate of oil:CSB ratio was based on laboratory analysis, not caregiver's self‐report.) Household characteristics included number of possessions and food access, adapted from the 2010 Malawi DHS and FANTA Household Food Insecurity Access Scale (HFIAS) for Measurement of Food Access (2007) respectively. Longitude and latitude were obtained using Global Positioning System in order to determine distance between each interviewed household and its respective FDP, calculated using ArcMap 10.31 (Esri, Redlands, CA, USA). Data were entered in CSPro 6.1 and cleaned in two stages, first by the field data manager then by data analysts.
Cost data were collected through key informant interviews with program staff, reviews of financial records maintained by participating PVOs, and direct observations of ration transportation and the time required for distribution at FDPs. Cost components included the cost of commodities (oil and CSB), international shipping, national and local transportation, warehousing, distribution, pre‐implementation program costs (including initial training of health workers, purchasing jerry cans and crates for additional oil rations, formative research for SBCC, design, preparation, and pretesting of smaller CSB packaging and package messages), ongoing intervention costs (including SBCC refresher training for health workers, monitoring of health workers, commodity repackaging), and program personnel costs. Costs were tabulated in Microsoft Excel 2011 (Redmond, WA, USA). Costs collected in Malawian Kwacha (MWK) were converted to US dollars using the exchange rate of 397 MWK to 1 US dollar (2014) (Reserve Bank of Malawi, 2016 2016).
2.4. Outcomes
The primary study outcomes were mean oil:CSB ratio, and percent of caregivers meeting or exceeding the target ratio of 30:100 in prepared porridge. The primary cost‐effectiveness indicator was the group‐specific program cost per caregiver reaching or exceeding the target oil:CSB ratio. Due to the cross‐sectional sampling method, it was not possible to measure the total number of monthly rations received by each caregiver, and therefore, cost per beneficiary was based on the assumption of receipt of four monthly rations as programmed.
2.5. Data analysis
Porridge samples were analyzed by Chancellor College Laboratory at University of Malawi, Zomba, for fat and non‐fat dry matter content. As it was not possible to differentiate between fat from the CSB and added oil through lab analysis, dummy samples that contained no added oil were used to determine the intrinsic fat content of the CSB. The oil‐to‐CSB ratio was then estimated by subtracting the intrinsic fat value from the total fat in the sample to calculate the amount of added oil.
Descriptive statistics and study participant characteristics were stratified by study group. Homogeneity of characteristics by study group was assessed using chi‐square and ANOVA tests (Kruskal‐Wallis when appropriate). Mixed effects regression models were fit to determine the effect of the intervention on the mean oil:CSB ratio (linear model), and the probability of meeting or exceeding the target ratio (30:100) (logistic model), controlling for demographic, and household characteristics (listed in Table 2). Mixed models are a special class of conditional models that are commonly used for analysis of clustered data. To adjust for the cluster sample design, FDP unique identifiers were used as a random intercept in all models. Postestimation Wald tests compared the two intervention groups. For all regression models, diagnostics were assessed by calculating Cook's distance (Cook, 1977), which assess whether any individual data point has an excessive influence on the regression results. Scatterplots of Cook's distances and of predicted versus residual values were examined. All analyses were conducted using Stata 13.1 (StataCorp LP, College Stataion, TX, USA). Statistical significance was determined at p < 0.05.
Table 2.
Mixed effects regression models of mean oil:CSB ratio and odds of caregivers meeting or exceeding the 30:100 target ratio, n = 419
| Mean oil to CSB ratio | Odds of meeting or exceeding target ratio | |||||
|---|---|---|---|---|---|---|
| Beta | 95% CI | P | OR | 95% CI | P | |
| Study Group | ||||||
| Control Group | ref. | ref. | ||||
| Intervention Group 1 | 0.18 | (0.05, 0.31) | 0.01 | 28.4 | (3.2, 251.1) | <0.01 |
| Intervention Group 2 | 0.13 | (0.01, 0.26) | 0.04 | 12.7 | (1.5, 109.5) | 0.02 |
| No. household members | <0.01 | (−0.00, 0.01) | 0.43 | 1.1 | (1.0, 1.4) | 0.13 |
| Age (mos) of child | <0.01 | (−0.00, 0.00) | 0.13 | 1.0 | (0.9, 1.0) | 0.14 |
| Age (y) of caregivers | <0.01 | (−0.00, 0.00) | 0.10 | 1.0 | (1.0, 1.1) | 0.51 |
| Caregiver level of education | ||||||
| None | ref. | ref. | ||||
| Primary | 0.01 | (−0.03, 0.04) | 0.72 | 1.0 | (0.4, 2.5) | 0.95 |
| Secondary or higher | 0.04 | (−0.01, 0.09) | 0.12 | 1.8 | (0.5, 6.0) | 0.35 |
| Previous enrollment in a SFP | 0.01 | (−0.02, 0.04) | 0.53 | 1.3 | (0.6, 2.9) | 0.47 |
| Household Food Insecurity a | ||||||
| Food secure | ref. | ref. | ||||
| Mildly insecure | 0.04 | (−0.01, 0.08) | 0.12 | 2.7 | (0.8, 9.3) | 0.13 |
| Moderately insecure | 0.03 | (−0.01, 0.06) | 0.11 | 2.4 | (0.8, 6.7) | 0.11 |
| Severely insecure | 0.03 | (0.00, 0.06) | 0.05 | 2.6 | (1.0, 6.7) | 0.05 |
| No. possessions a | 0.01 | (−0.01, 0.00) | 0.13 | 0.8 | (0.7, 1.0) | 0.03 |
| Distance to FDP (km) | <0.01 | (−0.01, 0.00) | 0.49 | 1.1 | (0.9, 1.2) | 0.35 |
| No. distributions since enrollment | ||||||
| One | ref. | ref. | ||||
| Two | 0.01 | (−0.09, 0.07) | 0.81 | 0.9 | (0.1, 6.7) | 0.89 |
| Three | 0.01 | (−0.07, 0.08) | 0.89 | 0.6 | (0.1, 4.3) | 0.63 |
| Four | 0.01 | (−0.06, 0.09) | 0.73 | 0.9 | (0.2, 6.0) | 0.94 |
| Over four | 0.01 | (−0.07, 0.08) | 0.85 | 0.8 | (0.1, 4.9) | 0.79 |
| Random Effects Parameter | 0.01 | (0.00, 0.02) | <0.01 | 2.1 | (0.8, 6.0) | <0.001 |
2.6. Costs and cost‐effectiveness
For the cost estimates, a single PVO was selected from which detailed data from multiple FDPs were collected. Project Concern International, of average size amongst the three PVOs participating in the study, was selected as a representative PVO by the field research coordinator. Sensitivity analysis was conducted to assess potential differences in costs between Project Concern International and the other PVOs; no potentially influential differences in levels and structures of cost were identified across PVOs. Beneficiary time—which included time to travel to and from the FDP, and time spent waiting for and collecting the ration—was measured and valued at the Malawian government minimum wage of 14,000 MWK (US dollar $35.26) per month (LO/FTF Council, 2014). Total cost (inclusive of the value of beneficiary time) in each study group was used to determine the cost per beneficiary as programmed, that is, the total cost was divided by the number of intended treatments (four monthly rations). (Although women were eligible to receive four rations, some may have collected fewer.) Cost‐effectiveness was examined in two ways: cost‐effectiveness ratio (the cost per caregiver meeting or exceeding the target ratio), and marginal cost‐effectiveness (the cost per additional caregiver meeting or exceeding the target ratio, beyond the number meeting or exceeding the target ratio in the Control group). The cost‐effectiveness ratio was calculated from the total program costs per study group divided by the number of caregivers meeting or exceeding the target oil:CSB ratio. Marginal cost‐effectiveness was calculated by subtracting the total cost of the control group per 100 beneficiaries from the costs of the intervention groups per 100 beneficiaries; the remaining costs were then divided by the number of caregivers that met or exceeded the target ratio beyond that of the control group, per 100 beneficiaries. Sensitivity analyses were performed to test the effects on the cost‐effectiveness results of changes to the prices of oil and CSB, increasing distance to FDPs, and the impact of the pre‐implementation investment costs of the intervention groups.
3. RESULTS
A descriptive summary of participants' characteristics, stratified by study group, is in Table 1. Less than 5% of data were missing for any variable. The study groups were similar with respect to age, gender of the child, household size, number of household possessions, household food insecurity, caregiver's level of education, and distance to FDP. The study groups differed with respect to number of children in the household less than 5 years of age and number of distributions received since enrolment (Table 1).
Table 1.
Household and participant characteristics by study group, n = 584 a
| Intervention Group 1 | Intervention Group 2 | Control Group | |
|---|---|---|---|
| Household and participant characteristics | n = 192 | n = 196 | n = 196 |
| Mean ± SD | |||
| Age of caregiver (y) | 27.9 ± 8.3 | 28.4 ± 7.6 | 27.0 ± 7.0 |
| Age of child (mos.) | 25.1 ± 10.9 | 25.1 ± 11.7 | 25.5 ± 13.3 |
| Number of household members | 5.1 ± 1.8 | 5.5 ± 1.8 | 5.2 ± 2.0 |
| Number of household possessions b | 1.9 ± 2.1 | 1.8 ± 1.8 | 1.9 ± 1.8 |
| Distance to FDP1 (km) | 3.3 ± 2.0 | 3.6 ± 2.5 | 3.1 ± 2.0 |
| Number of children <5 yrs. c | 1.3 ± 0.5 | 1.4 ± 0.6 | 1.5 ± 0.7 |
| n (%) | |||
| Female‐headed household | 1 (1) | 1 (1) | 0 (0) |
| Household Food Insecurity d | |||
| Food secure | 38 (20) | 33(17) | 36 (18) |
| Mildly insecure | 17 (9) | 18 (9) | 15 (8) |
| Moderately insecure | 35 (18) | 40 (21) | 47 (24) |
| Severely insecure | 102 (53) | 104 (53) | 98 (50) |
| Caregiver's level of education | |||
| None | 23 (12) | 16 (8) | 14 (7) |
| Primary (some or completed) | 141 (74) | 155 (80) | 153 (79) |
| Secondary (some, completed, or higher) | 26 (14) | 23 (12) | 26 (13) |
| Distributions received since enrollment c | |||
| One | 5 (3) | 2 (1) | 5 (3) |
| Two | 10 (5) | 14 (7) | 19 (1) |
| Three | 42 (22) | 45 (23) | 87 (44) |
| Four | 42 (22) | 47 (24) | 32 (16) |
| Over four | 92 (48) | 88 (45) | 53 (27) |
Homogeneity of characteristics were assessed using anova test (Kruskal‐Wallis when appropriate) or χ2 test; for each of the variables, less than 5% of data were missing.
Adapted from 2010 Malawi DHS (National Statistical Office (NSO) and ICF Macro, 2011)
Statistically significant, p < 0.05
Adapted from FANTA Household Food Insecurity Access Scale (HFIAS) for Measurement of Food Access: Indicator Guide (2007) (Coates, Swindale, & Bilinsky, 2007)
Lab analysis of test porridge samples with no added oil showed the mean and standard deviation (SD) of intrinsic fat in the CSB to be 2.83 ± 0.13 g per 100 g dry weight. This value was used to adjust the estimated grams of added oil in the prepared porridge samples per 100 g CSB. The mean (±SD) grams added oil per 100 g CSB (oil:CSB ratios) and percentage of caregivers meeting or exceeding the target ratio of 30 g added oil per 100 g CSB is displayed in Figure 1. Each intervention group had a higher mean oil:CSB ratio and a higher percentage of caregivers meeting or exceeding the target ratio of 30:100 than the control (Figure 1). Median (minimum, 25% IQR, 75% IQR, maximum) of the oil:CSB ratio was: 25 g (0, 15, 36, 59) in Group 1; 23 g (0, 15, 32, 60) in Group 2; 10 g (0, 5, 15, 51) in the control group. Upon examining the distribution of the oil:CSB ratio, it was noted that three FDPs had considerably higher than average fat content in the lab analysis of the porridge relative to other FDPs, with values ranging from 0 to 60 g added oil per 100 g CSB. Sensitivity analysis found that excluding these outliers did not have a statistically significant effect on the results, so the analyses included all FDPs. Additionally, the quantity of porridge fed to children per feeding (estimated by volume from caregiver self‐report) did not vary across groups: (267 ± 109 mL in Group 1, 277 ± 101 mL in Group 2 and 267 ± 105 mL in the control group, p = 0.57).
There were 165 observations excluded from all regression analyses due to missing data, yielding a sample size of 419 caregivers in both adjusted and unadjusted models. In order to assess whether omitted observations presented a bias, they were compared to included observations with regard to non‐missing values for demographic and household characteristics, and the outcomes. No statistical differences were noted between the omitted and included caregivers; therefore complete case analysis was deemed appropriate. Results of the adjusted regression models are displayed in Table 2. Both intervention groups had a significantly higher mean oil:CSB ratio than the control group: mean added oil was 18 g (p < 0.01) and 13 g (p = 0.04) higher per 100 g CSB in intervention groups 1 and 2, respectively, compared to the control group. Both intervention groups showed greater odds of meeting or exceeding the target ratio than the control group: caregivers in intervention groups 1 and 2 had 28.4 (p < 0.01) and 12.7 (p = 0.02) times the odds of meeting or exceeding the target ratio, respectively, than the control group. The random effects parameters were significant in both adjusted models, indicating that between‐FDP variations in the outcomes remained that were unexplained by study group and the other explanatory variables (Table 2). In both of the adjusted models, the intervention groups did not significantly differ from each other in the postestimation tests (Chi‐squared: X1 2 = 0.70, p = 0.40 for the linear model; Chi‐squared: X1 2 = 0.76, p = 0.38 for the logistic model). For the linear model, the scatter plot of the residual versus fitted values was homoscedastic (indicting that the linear model was appropriate). No highly influential observations were noted (i.e., Cook's D ≥ 1).
3.1. Costs and cost‐effectiveness
The cost of treating a single beneficiary child with four monthly rations was $143 in Group 1, $158 in Group 2, and $83 in the Control group (Table 3). CSB and oil, and their transport to Malawi, contributed to about one‐half of the program cost to treat one beneficiary in the intervention groups ($72.05 per beneficiary, 50.3% in intervention group 1 and 45.6% in intervention group 2) and more than two‐thirds of the cost in the control group ($57.25, 68.8%). In the intervention groups, one‐time pre‐implementation costs and ongoing costs related to the interventions comprised another third of their costs, accounting for much of the intervention groups' overall cost differences from the Control group. The largest components of the intervention‐specific costs were the initial and ongoing SBCC training of the healthcare workers. Ongoing intervention costs were slightly higher in Group 2, due to materials and labor to repackage the CSB.
Table 3.
Program component costs per beneficiary and percent contribution of cost components to total costs, by study group over the four‐month intervention, 2014 US dollars a , b
| Intervention Group 1 | Intervention Group 2 | Control Group | Intervention Group 1 | Intervention Group 2 | Control Group | ||
|---|---|---|---|---|---|---|---|
| Cost Component | Description | Cost per beneficiary (USD) | Contribution of cost components to total (%) | ||||
| Corn‐soy blend | Product cost | 27.61 | 27.61 | 27.61 | 19.3% | 17.5% | 33.2% |
| Fortified vegetable oil | Product cost | 17.38 | 17.38 | 6.68 | 12.1% | 11.0% | 8.0% |
| To‐country transport of CSB and oil | From US production plants to CRS warehouse in Blantyre, Malawi | 27.06 | 27.06 | 22.96 | 18.9% | 17.1% | 27.6% |
| In‐country transportation | From CRS warehouse to PVO warehouse, then FDP | 10.65 | 10.35 | 9.00 | 7.4% | 6.6% | 10.8% |
| Warehousing | Storage at CRS and PVO warehouses | 3.56 | 3.56 | 3.18 | 2.5% | 2.3% | 3.8% |
| Personnel | CRS and PVO program‐related personnel | 10.75 | 10.75 | 9.60 | 7.5% | 6.8% | 11.5% |
| Distribution | Cost of unloading and distributing rations at FDPs | 0.41 | 0.38 | 0.27 | 0.3% | 0.2% | 0.3% |
| Caregivers | Monetized time cost to receive ration (transport and waiting time at FDP) | 3.73 | 3.75 | 3.98 | 2.6% | 2.4% | 4.8% |
| Intervention‐related costs (ongoing) | CHW training and monitoring | 14.54 | 12.76 | — | 10.1% | 8.1% | — |
| CSB repackaging materials and labor | — | 12.16 | — | — | 7.7% | — | |
| Oil repackaging materials and labor | 2.55 | 2.55 | — | 1.8% | 1.6% | — | |
| Intervention‐related costs (one‐time) | Initial CHW training | 16.56 | 14.54 | — | 11.5% | 9.2% | — |
| Oil repackaging materials, crates | 8.58 | 7.54 | — | 6.0% | 4.8% | — | |
| Formative research for SBCC and CSB repackaging | — | 3.51 | — | — | 2.2% | — | |
| CSB package design | — | 1.39 | — | — | 0.9% | — | |
| Pretesting package design and SBCC | — | 2.67 | — | — | 1.7% | — | |
| Total | 143.38 | 157.97 | 83.29 | ||||
Cost estimates were based on the six FDPs run by Project Concern International, which served 502 beneficiaries over the four‐month study period (151 in Group 1, 172 in Group 2 and 179 in the Control Group), estimated as the number of rations distributed, divided by four, that is, four monthly rations for each beneficiary enrolled in the program, as programmed.
Abbreviations: CHW, community health worker; CRS, Catholic Relief Service; CSB, corn soy blend; FDP, food distribution point; PVO, private voluntary organization; SBCC, social behavior change communication
While cost per beneficiary was lower in the control group, as expected, cost‐effectiveness was more favorable in the intervention groups (Figure 2). The cost‐effectiveness ratios, or cost per caregiver meeting or exceeding the target oil to CSB ratio of 30:100, were $391, $527 and $1,666 in Group 1, Group 2 and the Control group, respectively. The marginal cost‐effectiveness, or cost per additional caregiver meeting or exceeding the target ratio beyond the number doing so in the control group, was $188 in Group 1 and $300 in Group 2. As the proportions of caregivers meeting the target ratio in the two intervention groups were not statistically significantly different, the increased costs in Group 2 related to repackaging of CSB conferred no additional increase in the number of caregivers meeting or exceeding the target ratio of oil:CSB, so that cost‐effectiveness was more favorable in Group 1.
Figure 2.

Comparison of costs per treated beneficiarya, cost‐effectiveness ratiob and marginal cost‐effectivenessc based on the proportion of caregivers meeting or exceeding the target ratio among the three study groups over a 4‐month treatment period, in 2014 US dollars
a Cost estimates were based on the six FDPs run by Project Concern International, which served 502 beneficiaries over the four‐month study period (151 in Group 1, 172 in Group 2 and 179 in the Control Group), estimated as the number of rations distributed, divided by four, that is, four monthly rations for each beneficiary enrolled in the program, as programmed.
b Cost per caregiver preparing porridge at or above target oil:CSB porridge ratio of 30:100 (number of caregivers meeting or exceeding target ratio divided by total group costs).
c Cost per additional caregiver preparing porridge at or above target oil:CSB porridge ratio of 30:100, compared to number in Control Group (reference group), per 100 treated beneficiaries
Sensitivity analysis showed that changes to specific individual cost components slightly altered the estimates of cost and cost‐effectiveness, but none of these results altered the rankings among the three groups. Furthermore, no reasonable changes in key parameters caused Intervention Group 2 to be more cost‐effective than Intervention Group 1. With regard to the use of Project Concern International to model cost data, the main difference in cost parameters compared to the other PVOs participating in the study was the average distance from the PVOs' warehouses to their FDPs; a doubling of this average distance increased costs by only about 2% and marginal cost‐effectiveness by 5–7%. The largest changes in cost per beneficiary and cost/effectiveness resulted from changes in the cost of the purchased commodities, but even a 20% increase in the cost of CSB and oil increased cost per beneficiary by only ~7%, and did not alter the conclusions concerning relative cost‐effectiveness of the intervention groups. The results of select sensitivity analyses on estimates of cost and cost‐effectiveness are shown in Supplemental Table 1 .
4. DISCUSSION
This study demonstrated that it is possible to achieve increases in the amount of oil used by caregivers to prepare CSB porridge by increasing the oil ration to the target 30:100 ratio and by providing enhanced SBCC emphasizing the use of oil. These results are important because a higher level of oil in CSB porridge achieves greater calorie density for a given volume and confers other nutritional benefits. This addresses the concern that fortified blended foods may not be able to deliver the same levels or concentrations of energy as alternative lipid‐based foods (e.g., RUSFs). Caregivers in all three groups reported similar quantities (by volume) of porridge fed to beneficiary children, suggesting that children in intervention groups 1 and 2 indeed consumed more calories from the ration than did children in the control group. Overall caregivers in the intervention groups appeared to be adding more oil to porridge. For example, 82% and 79% in the intervention groups reached a ratio of 13:100 (which meets the minimum fat content recommended by WHO for supplementary foods to treat MAM), while only 38% in the control group reached this threshold (WHO, 2012). Similarly, 63% and 62% in the intervention groups reached 20:100, compared to only 15% in the control group. It remains unknown how this will translate to recovery from MAM and growth outcomes, as these outcomes were not measured in the study.
We were not concerned with adverse effects (e.g., diarrhea) related to consumption of additional oil. The WHO recommends up to 65 g fat per 1000 kcal in supplementary foods to treat MAM (WHO, 2012) – our recommended target ratio results in 60 g of fat per 1000 kcal. Due to palatability reasons, we did not anticipate that caregivers would add substantially more than the recommended target. In our sample, only 5% had ratios that were considerably higher, ≥ 40:100 (excluding the outlier FDPs).
The intervention required investment in developing SBCC messages to be delivered by health care workers and volunteers; these were one‐time costs that would be spread out over additional beneficiaries if the intervention were scaled up. Health care workers and lead mothers provide health education to participants in MAM treatment programs through health talks at the FDP and care group meetings and home visits. Implementation of this intervention at scale would add some messages but not significantly increase the responsibilities of these workers and volunteers; the new information would be included in the training they already receive, and the messages incorporated into the health talks they already give. Therefore, it should be feasible for similar programs to incorporate the lessons from this study without greatly increasing program costs.
While we recognize that supplementary food rations may be subject to leakage (sharing) and diversion (selling or giving away the ration), the focus of this study was explicitly on porridge preparation. The observation that caregivers in the intervention groups used significantly more oil than those in the control group suggests that the oil provided in the ration was being used in the porridge rather than being used in family food or diverted to the market.
CSB is typically distributed to caregivers in bulk: 25 kg sacks of CSB are emptied into tubs, and the CSB is then measured and scooped into the caregivers' own containers. In this study, substantial investment was made in repackaging the CSB into 2 kg packets which were re‐sealable, and printed with messages and instructions about preparing the CSB with oil. This additional packaging/messaging intervention, beyond the extra oil and enhanced SBCC given to both intervention groups, had no additional effect on the amount of oil used in the CSB porridge. If the only goal of repackaging CSB were to increase the use of oil, the investment would not be justified. Qualitative interviews and direct observation of distribution, however, suggested that distributing CSB in individual packages may have other benefits that were not the focus of this study: the packages are sanitary and protected from contamination that can occur during bulk distribution. Repackaging simplifies distribution of CSB at the FDP compared with bulk distribution; and in qualitative interviews, caregivers expressed a preference for the individually‐packaged CSB. Since the printed messages did not appear to confer any additional behavior change, more efficient and more sanitary distribution could be achieved with a simpler approach to repackaging that would not incorporate behavior change messages on the packets.
We found that costs per beneficiary were of course higher in the intervention groups than in the control group. However, vis‐à‐vis the control group, both interventions resulted in statistically significantly more caregivers meeting or exceeding the target oil:CSB ratio. Both interventions were effective but one was more expensive, hence, one intervention (Group 1) was found to be more cost‐effective at meeting or exceeding this gain. Furthermore, the cost‐effectiveness rankings among the two intervention groups and the control group were not sensitive to changes in commodity and transportation costs, nor to changes in other cost components. Given that a substantial fraction of the cost per beneficiary in the intervention groups was faced during the pre‐implementation phase–including the development of SBCC messages, training health care workers, and preparing crates for the transportation of the larger oil ration–the cost per beneficiary would likely fall as the program scaled up to reach a larger number of beneficiaries. The costs of the commodities and overseas transportation together represent the largest component of ongoing program cost; any reduction in these costs—for example, if local commodities were less expensive, or if prices fell for the imported products—would also reduce cost per beneficiary, but would not alter relative cost‐effectiveness among the three groups.
The most important limitation of this study is the cross‐sectional design. To strengthen the validity, we collected data from independent samples at intervention group sites 6 months prior to implementation of the interventions. Because the samples were independent, it is possible that other factors may have confounded the differences we observed. Due to lack of random assignment of FDPs to study groups, it is possible the groups may have differed in ways which were not captured. Another limitation of the study is that the intervention tested two components: increasing the oil ration to permit preparation of porridge at the 30:100 ratio and enhanced SBCC emphasizing increased use of oil. Because the Ministry of Health mandates an 8 kg ration of CSB, increasing the oil ration was necessary to permit preparation of the porridge at the recommended ratio. The results demonstrate that considering the overall cost including both components, the intervention was cost‐effective; further research could disaggregate the effect of each component. Cost estimates were based on the distribution of four monthly rations as programmed. Because caregivers were sampled only once during their period of eligibility, we do not have information on the total number of rations collected. If women collected fewer than four rations on average, then costs may be overestimated, but the relative costs and cost‐effectiveness among the three arms would not be altered.
SOURCE FUNDING
This research was made possible by the generous support of the American people through the United States Agency for International Development (USAID). The contents are the responsibility of Tufts University under the terms of Contracts AFP‐C‐00‐09‐00016‐00 and AID‐OAA‐C‐16‐00020 and do not necessarily reflect the views of USAID or the United States Government.
CONFLICTS OF INTEREST
The authors declare that they have no conflicts of interest.
CONTRIBUTIONS
BR and PW designed the research project and had primary responsibility for final manuscript content. SW coordinated the research project. GM implemented the study. KC advised on data analysis; LW, BL and DS conducted the data analysis; DS and SV conducted the cost analysis. BR, LW, SW, BL, DS, JB and KC wrote the paper. All authors have read and approved the final manuscript.
Supporting information
Supplementary Figure 1: Corn Soy Blend (CSB) Package Image.
Supplementary Table 1: Comparison of changes to cost per beneficiarya using original and modeled values of select cost components among the three study groups, US dollar b.
Supporting Info
ACKNOWLEDGMENTS
This research would not have been possible without the collaboration between Tufts University, University of Malawi‐Center for Social Research, Catholic Relief Service, Save the Children, Project Concern International, Africare, and Pakachere Institute for Health and Development Communication. The Government of Malawi, specifically, the National Health Science Research committee, Malawi Government Department for Nutrition, Technical Nutrition Panel and the Ministry of Health personnel in Lilongwe, Mulanje, Zomba, Machinga, Balaka and Chiradzulu districts provided us the programmatic platform and all support needed to carry out this study. We also acknowledge research support provided by Kristine Caiafa from Tufts University. We gratefully acknowledge the work of our dedicated data collection team in Malawi and the respondents who generously provided information.
Rogers BL, Wilner LB, Maganga G, et al. Program changes are effective and cost‐effective in increasing the amount of oil used in preparing corn soy blend porridge for treatment of moderate acute malnutrition in Malawi. Matern Child Nutr. 2017;13:e12393 10.1111/mcn.12393
[The copyrightline of this article was changed on 4 April 2017 after original online publication.]
Footnotes
MAM is defined by the World Health Organization as having a weight for height Z‐score (WHZ) < −2 and ≥ − 3 with absence of edema (WHO, 2006).
Market observation data found no evidence that the packets were sold.
A number of World Food Programme and USAID Office of Food for Peace supplementary feeding programs repackage bulk fortified blended foods into smaller‐quantity plastic bags sealed with tape or twine with adhesive labels for branding and best‐use dates but without other messaging. Examples include Burkina Faso (USAID, Office of Food for Peace), Cambodia (World Food Programme) and others (based on authors' personal observations).
REFERENCES
- Coates, J. , Swindale, A. , & Bilinsky, P. (2007). Household Food Insecurity Access Scale (HFIAS) for measurement of food access: Indicator guide (v. 3). Washington, D.C: FANTA Project. [Google Scholar]
- Cook, R. D. (1977). Detection of influential observation in linear regression. Technometrics, 19(1), 15–18. Available at: http://www.ime.usp.br/~abe/lista/pdfWiH1zqnMHo.pdf [Google Scholar]
- Kumwenda, G. , Nhlema, B. , Maganga, G. , Rogers, B. , Walton, S. , & Boiteau, J. W. P. (2016). Feasibility and acceptability study of preparing corn soy blend with fortified vegetable oil in Malawi: Formative research a report from the Food Aid Quality Review. Boston, MA: Friedman Nutrition School. [Google Scholar]
- LO/FTF Council . (2014). Malawi Labour Market Profile 2014. Available at: http://www.ulandssekretariatet.dk/sites/default/files/uploads/public/PDF/LMP/lmp_malawi_2014_final_version.pdf
- National Statistical Office (NSO) and ICF Macro . (2011). Malawi Demographic and Health Survey 2010. Malawi and Calverton, Maryland, USA: Zomba. [Google Scholar]
- Nguyen, V. H. (2014). Technical specifications for the manufacture of super cereal plus‐ corn soya blend. Available at: http://documents.wfp.org/stellent/groups/public/documents/manual_guide_proced/wfp262697.pdf
- Patel, M. , Sandige, H. , & Ndekha, M. (2005). Supplemental feeding with ready‐to‐use therapeutic food in Malawian children at risk of malnutrition. Journal of Health and Population Nutrition, 23(4), 351–357. [PubMed] [Google Scholar]
- Pee, S. De & Bloem, M. W. (2009). Current and potential role of specially formulated foods and food supplements for preventing malnutrition among 6‐23 months old and treating moderate malnutrition among 6‐59 months old children, pp.1–40. [DOI] [PubMed]
- Perry, H. , Morrow, M. , Davis, T. , Borger, S. , Weiss, J. , DeCoster, M. , & Ernst, P. (2014). Care groups–An effective community‐based delivery strategy for improving reproductive, maternal, neonatal and child health in high‐mortality, resource‐constrained settings: A guide for policy makers and donors. Washington, D.C: CORE Group. [Google Scholar]
- Phuka, J. , Maleta, K. , Thakwalakwa, C. , Cheung, Y. B. , Briend, A. , Manary, M. J. , & Ashorn, P. (2008). Complementary feeding with fortified spread and incidence of severe stunting in 6‐to 18‐month‐old rural Malawians. Archives of Pediatrics & Adolescent Medicine, 2008 Jul 162(7), 619–626. [DOI] [PMC free article] [PubMed] [Google Scholar]
- Reserve Bank of Malawi . (2016). Foreign Exchange Rates. Available at: https://www.rbm.mw/Statistics/MajorRates [Accessed July 15, 2016].
- Webb, P. , Rogers, B. L. , Rosenberg, I. , Schlossman, N. , Wanke, C. , Bagriansky, J. , … Narayan, A. (2011). Improving the nutritional quality of U.S. food aid: Recommendations for changes to products and programs. Boston, MA: Available at: http://pdf.usaid.gov/pdf_docs/pnadz841.pdf [Google Scholar]
- WFP , WFP Specialized nutritious foods sheet. Available at: http://documents.wfp.org/stellent/groups/public/documents/communications/wfp255508.pdf
- WHO . (2006). WHO child growth standards: Length/height‐for‐age, weight‐for‐age, weight‐for‐length, weight‐for‐height and body mass index‐for‐age: Methods and development. Geneva: WHO. [Google Scholar]
- WHO . (2012). Technical note: Supplementary foods for the management of moderate acute malnutrition in infants and children 6–59 months of age. Geneva: WHO. [Google Scholar]
Associated Data
This section collects any data citations, data availability statements, or supplementary materials included in this article.
Supplementary Materials
Supplementary Figure 1: Corn Soy Blend (CSB) Package Image.
Supplementary Table 1: Comparison of changes to cost per beneficiarya using original and modeled values of select cost components among the three study groups, US dollar b.
Supporting Info