

Abstract
Caesarean section is associated with weaker newborn suction pressure. This nonblinded, randomized trial explored the effect of suction pressures generating by a breast pump on mothers' onset of lactation and milk supply after caesarean section. A high pressure group (−150 mmHg), a low pressure group (−100 mmHg), and a control group (none) were generated under computer random assignment with concealed allocation in 2 tertiary hospitals. The breast pumping began within 2 hr after caesarean operation (6 times a day and 30 min per time) until onset of lactation. The primary outcomes were the timing of onset of lactation, milk supply, and mother's satisfaction in lactation, using both intention‐to‐treat and per‐protocol analyses. The secondary endpoints were the pumping‐related pain, nipple injury, and maternal fatigue. All 164 women randomized were included in analysis. The breast pumping at −150 mmHg optimally advanced the timing of the onset of lactation and increased daytime milk supply. The pumping also appeared to boost mothers' confidence in lactation. The results in the per‐protocol population (n = 148) were consistent with those of intention‐to‐treat population (n = 164). However, the pumping aggravated maternal nipple pain and fatigue, though there was no statistical significance. The findings suggest that a higher pumping pressure within the range of normal vaginally born infant suction could promote onset of lactation and milk supply among mothers giving birth by caesarean section. The pumping could also enhance mothers' confidence in breastfeeding.
Keywords: breastfeeding, breastfeeding confidence, breastfeeding promotion, breastfeeding support, caesarean delivery, randomised controlled trial
1. INTRODUCTION
Lactogenesis Stage II, defining as the initiation of copious milk production, normally begins at 36–72 hr postpartum (Neville et al., 1988) at the trigger of a drop in progesterone after placenta separation. It acts as the mediator of successful breastfeeding (Zhu, Hao, Jiang, Huang, & Tao, 2013). However, this physiologic phenomenon may be affected by numerous factors including early suckling (Nommsen‐Rivers, Chantry, Peerson, Cohen, & Dewey, 2010), parity, delivery mode (Dewey, Nommsen‐Rivers, Heinig, & Cohen, 2003), maternal age (Nommsen‐Rivers, Dolan, & Huang, 2012), maternal body mass index (BMI; Dewey et al., 2003; Nommsen‐Rivers et al., 2012), and endocrine status (Nommsen‐Rivers et al., 2012). Delayed onset of lactation (OL; >72 hr postpartum) has been proved to be a predictor of early cessation of breastfeeding (Hruschka, Sellen, Stein, & Martorell, 2003; Liu et al., 2013).
Caesarean section is associated with early cessation of exclusive breastfeeding (Yeneabat, Belachew, & Haile, 2014) and breastfeeding (Hobbs, Mannion, McDonald, Brockway, & Tough, 2016). It has become a public health concern due to its 30% unexpected global rate (Souza et al., 2016). And this number has reached to 60% in some areas of China (Bogg, Huang, Long, Shen, & Hemminki, 2010). The influence of caesarean section mainly appears in the early stage of breastfeeding (Prior et al., 2012), presenting delayed initiation of first suckling (Perez‐Rios, Ramos‐Valencia, & Ortiz, 2008), decreased breastfeeding frequency (Woods et al., 2012), shortened suckling duration, and insufficient milk production (Lin, Lee, Yang, & Gau, 2011).
A prior study implied that infant suction pressure was the major force driving the milk out of the breasts (Geddes, Kent, Mitoulas, & Hartmann, 2008). Healthy full‐term infants after caesarean section display more anterior tongue movement, faster suck rates, and lower neurobehavioral scores compared with those after normal vaginal delivery, suggesting that sucking may have been affected by the caesarean birth and then caused a delayed OL (Sakalidis, Williams, et al., 2013). Our previous research discovered that caesarean infants had a weaker suction pressure compared with that of the vaginally born. The suction pressure of normal vaginally delivery infants was −19.89 kpa (−149.18 mmHg), whereas it was −13.42 kpa (−100.65 mmHg) for those after caesarean birth (Zhang, Xia, Li, et al., 2016). Multivariate regression showed that the decreased suction pressure was related to the delayed OL and insufficient milk supply after controlling for maternal gestational weight gain, delivery mode, time to first breastfeeding, breastfeeding duration, frequency of giving formula, cracked nipple, and prolactin (PRL) level (Zhang, Xia, Li, et al., 2016).
Therefore, we speculate that, for the caesarean parturient, an increased suction pressure (to the level of vaginally born newborns' suction) stimulus on breasts could promote mothers' OL and milk supply. Because of the impossibility to manipulate the strength, frequency, and duration of infant suction, the electric breast pump is applied as a research tool to provide additional breast stimulation.
This study explores the effect of suction pressures generating by a breast pump on mothers' OL and milk supply after caesarean section.
Key Messages.
Cesarean section is associated with weaker newborn suction pressure.
This study evaluates the effectiveness of suction pressure on the onset of lactation and milk supply among women after Cesarean section.
Infants’ weakened suction pressure is one reason that leads to delayed onset of lactation. A higher pumping pressure can advance the timing of onset of lactation, increase milk supply and enhance mothers’ satisfaction in lactation among women after Cesarean section.
2. METHOD
2.1. Study design and participants
This research was a multicentre, nonblinded, and randomized grouping design with a convenience sample. It was carried out in the Affiliated Hospital of Nantong University and Maternal and Children Health Care Service Hospital. The number of newborns delivered in these two hospitals accounts for over 50% of the total births in Nantong City. They are baby‐friendly hospitals with obstetric rooming‐in wards. To avoid any contamination between the experimental group and control group, only the single‐room departments were selected. Therefore, selective bias may occur.
The protocol was approved by Ethics Committee of both Nantong University (2014‐068) and Fudan University (201503‐1) and registered on the Chinese Clinical Trial Registry (no. ChiCTR‐IOR‐14005321). Verbal and written information regarding the aims, procedures, potential risks, and benefits was introduced to all participants who have been informed about the freedom to withdraw from this study at any time without declaring any reason. Written informed consent was obtained from each participant before enrolment.
We recruited single‐birth primipara aged from 20 to younger than 35 years old. Woman gave birth by caesarean section and had stable vital signs. The parturient was willing to breastfeed her baby on breast and stay in hospital for at least 4 days postpartum. Infant criteria were healthy full‐term newborn with an Apgar score ≥8. The exclusion criteria were (a) parturient who was receiving other lactation promotion programs; (b) parturient who was not suggested to breastfeed due to physical or mental problems; (c) any other condition that may impede successful breastfeeding or lactation, such as mammary dysplasia, breast surgery/injury, hypothyroidism, hypopituitarism, polycystic ovarian syndrome, ovarian theca‐lutein cyst, gestational diabetes mellitus, diabetes, hypertension, pregnancy‐induced hypertension, placenta implantation, amniotic fluid embolism, or postpartum haemorrhage; (d) mother–infant separation immediately after delivery; (e) maternal smoking; and (8) pre‐pregnant BMI >27 kg/m2 (obesity). Recruitment was from August 2015 to February 2016 until the target sample size was achieved.
2.2. Randomization and masking
A simple randomization was conducted on the basis of the computer‐generated random numbers. Group numbers were sealed into the nontransparent envelopes kept by an assigned personnel. The grouping was concealed to participant, clinical staff, and research nurses until the entry of study object. Because of the nature of intervention, the masking could no longer be applied after allocation.
Parturients were randomly divided into three groups on the basis of suction pressures of breast pump. (a) High pressure group. The pumping pressure was −150 mmHg (equal to the suction pressure of normal vaginally delivered infant (Zhang, Xia, Li, et al., 2016). (b) Low pressure group. The pumping pressure was −100 mmHg (equal to the suction pressure of caesarean infant (Zhang, Xia, Li, et al., 2016). (c) Control group. There was no suction stimulation before OL. Low pressure group was to control the effect of increased suction frequency and duration caused by breast pumping. Control group presented the status without additional suction frequency, duration, and pressure.
2.3. Procedures
The first breast pumping started within 2 hr after caesarean section. Hospital‐level electric breast pumps (CoreMed HLX‐1, FutureMed Medical Devices Co., Ltd., Shanghai, China) were adopted. The cycling rate is 60 cycles/min with a sucking‐releasing‐stopping action in each cycle. A single breast pumping mode was used to simulate single infant suckling. The pressure was precisely set using a pressure sensor (TCT‐1202; Lenosensor Co., Ltd, Beijing, China) and marked with a label (Figure 1) before. Breast pumping was regulated upward from 0 mmHg and rose slowly to target pressure within 3–5 min (−150 mmHg for the high pressure group and −100 mmHg for the low pressure group), then maintained for 30 min on breasts (15 min each). Considering the blood clearance of PRL (Nunley et al., 1991), an optimum frequency of every 3 hr was designed. However, to avoid sleeping disruption at night, the protocol was adjusted to every 3 hr in daytime and 4–6 hr in night‐time. Mothers were not allowed to regulate the suction pressure. We down‐regulated the pressure or terminate the pumping when mother felt pain or uncomfortable. Infants have priority to breastfeed at any point. The pumping can be applied before, after, or independent of breastfeeding episode. The expressed colostrum was fed to infant with spoon.
Figure 1.

Setting the target pumping pressures with pressure sensor
No breast pump was given to mothers in the control group before OL. If newborns were transferred to Newborn Intensive Care Unit after enrolment, their mothers were asked to pump the milk every 3 hr according to breastfeeding guideline even they were assigned in the control group.
All participants in the three groups received the same assistance including positioning, latch‐on, and breastfeeding technique. All infants were breastfed on demand and breastfed at breast directly.
After OL, the electric breast pump was available to all participants in case of galactostasis for ethic consideration. The maximum comfortable vacuum was suggested by guideline (Obstetric and Gynecological Nursing Committee of Chinese Nursing Association, 2012). Women kept logs of the frequency, duration, and suction pressure of pumping. The research nurse recorded once a day.
Stopping rule was a greater than 20% occurrence of nipple injuries in any pumping group.
2.4. Outcomes
The primary outcomes were OL, milk supply, maternal PRL level, mother's satisfaction in lactation, and feeding methods. (a) The timing of OL refers to hours from the newborn birth to OL. Beginning at 24 hr after delivery and continuing every 4 hr until OL, mothers were questioned regarding if and when they noticed a sudden feeling of fullness in their breasts to confirm the OL (Parker, Sullivan, Krueger, Kelechi, & Mueller, 2012; Perez‐Escamilla & Chapman, 2001). (b) Milk supply was assessed by weighing. 8‐hr daytime output was measured by weighing (infant scale 2 g accuracy; Meier, 2001) in consideration of maternal adherence and staff workload. The daytime milk supply is highly related to the 24‐hr output based on Lai et al. (2010). The measurement began at 8:00 a.m. and ended at 4:00 p.m. on the fourth day after delivery as the milk volume plateaus at 96‐hr postpartum (Hruschka et al., 2003). Initially and finally, mothers' breasts were emptied by either newborn or breast pump with assistance of a specialist nurse. The baby was breastfed on demand. In case of mother–infant separation, the breast pump was used for 30 min every 3 hr to get the milk. All the milk sucked by infant or breast pump was calculated as a total 8‐hr milk supply except for that of the beginning at 8:00 a.m. (c) Prolactin (PRL). Blood sample of puerpera was collected 24 hr after birth when the breast has experienced several episodes of pumping stimulus. PRL increment was calculated by maternal serum PRL level immediately before and 20 min after pumping (infant sucking in the control group) to explore the effect of pumping pressure on endocrine secretion. PRL was measured by chemiluminescence immunoassay method. (d) Mother's satisfaction in lactation. The Chinese version of the H&H Lactation Scale (Huang, Lee, Huang, & Gau, 2009) was used for the evaluation of mother's satisfaction in lactation. H&H Lactation Scale is a 20‐item self‐evaluated tool with higher scores representing greater satisfaction in lactation. (e) Feeding methods at 1 month. Mothers were required to keep a record of the breastfeeding and formula frequency. Data were collected by our research nurse through telephone interview and evaluated on the basis of a previous 24‐hr feeding methods to decrease memory bias. Feeding methods are categorized into seven levels according to the World Health Organization definition (Kruse, Denk, Feldman‐Winter, & Rotondo, 2005), including exclusive breastfeeding, predominant breastfeeding, high level breastfeeding, middle level breastfeeding, low level breastfeeding, token breastfeeding, and artificial feeding. Infant feeding methods were evaluated by the frequency of breastfeeds and formula within 24‐hr period (breastfeeding frequency/(breastfeeding frequency + formula frequency) * 100%). Exclusive breastfeeding is defined as a 100% breastfeed. High level breastfeeding means that >80% feeds are breastfeeds. Middle level breastfeeding means that 20–80% feeds are breastfeeds. Low level breastfeeding refers to that <20% feeds are breastfeeds. Token breastfeeding is quantified as less than 15 min of breastfeeding per day or less than two to three short breastfeeds in a 24‐hr period. Artificial feeding means a 100% formula feeding without any breast milk.
The secondary outcomes were potential adverse effects of pumping. (a) Nipple injuries and nipple pain. Research nurse, who was blinded to the group assignment, evaluated pain level on the basis of maternal report using visual analogue scale (scored 0–10) once a day. (b) Maternal fatigue. It was measured by using the Chinese version of fatigue scale (Fatigue Scale‐14; Chalder et al., 1993) on the third day after delivery. Fatigue Scale‐14 is a 14‐item self‐evaluated tool consisted of two dimensions—physical fatigue and mental fatigue. A higher score indicates a more severe fatigue condition. (c) Maternal blood pressure and heart rate fluctuation. Systolic pressures, diastolic pressure, and heart rate were monitored before and after the first pumping. The multifunctional electrocardiogram monitor (Mindray U‐6000, Mindray PM‐9000, Mindray Biomedical Electronics Co., Ltd.) was applied for measurement.
Additionally, demographic information was collected via a face‐to‐face interview. Prenatal, delivery, and postnatal data were gathered through medical records. Breastfeeding data, such as time to first breastfeeding, time of first breastfeeding, newborn sucking duration, and formula volume, were recorded by our trained staff nurse on the basis of mothers' report 2–3 times every shift during hospitalization. After discharge, it was gathered by our research nurse through telephone interview on the basis of the previous 24‐hr feeding data. The use of pump (including the pressure and frequency) was monitored by research nurse in both the control group and two pumping groups within the hospitalization period. Newborn suction pressure was measured with a pressure sensor connected to a tube placed alongside the nipple during breastfeeding (Zhang, Xia, Li, et al., 2016). The infant's breastfeeding behaviour was evaluated using Infant Breastfeeding Assessment Tool, including arousal, rooting, time to latch and feed well (fixing), and suckling effectiveness (Huang et al., 2009).
2.5. Sample size
On the basis of our previous study (Zhang, Xia, Li, et al., 2016), the timing of OL for caesarean women is 68 hr with a standard deviation of 15 hr. We expect this time to be advanced to 55 hr with the high pressure pumping and 62 hr with the low pressure pumping according to our preliminary study. Two‐sided level of significance of 0.05 and power of 0.9 were set. Factoring in a 30% increase in sample size to account for any dropout, 53 subjects were estimated to be needed in each group.
2.6. Statistical analysis
Two persons were engaged in data entry separately. The input errors were checked by Epidata 3.1. The statistical analysis was made by Stata 14.0. Continuous data such as timing of OL, milk supply, scores of H&H Lactation Scale, PRL increment (Log‐transformed data), nipple pain, maternal fatigue score, and pressure of breast pumping after OL were expressed as means and standard deviations and analysed by analysis of variance followed with least significant difference method. Non‐parametric test was carried out for nonnormally distributed data expressing with median (interquartile range), such as changes of systolic pressure, diastolic pressure, and heart rate, hours of mother–infant separation, and frequency of pumping after OL. Chi‐squared test was adopted for dichotomous data, such as cracked nipple and breast pump usage after OL. PRL levels were analysed as log‐transformed data due to skewed distribution. For missing data imputation (n = 6, 3.66%; Hollis & Campbell, 1999), the last observed response method was adopted for repeated measure data (feeding methods and H&H Lactation Scale), and the group average method was used for data of milk supply and timing of OL.
We carried out both intention‐to‐treat (ITT) analysis and per‐protocol (PP) analysis (Hollis & Campbell, 1999). For ITT analysis, we compared data of all enrolled subjects (n = 164) in groups to which they were originally randomly assigned regardless of whether they actually satisfied the entry criteria, the treatment actually received, and subsequent withdrawal or deviation from the protocol. During PP analysis (n = 148), we removed all those disqualified data (n = 16). Allowing for the uncontrolled pumping pressures after OL, we conducted covariance analysis for adjusted milk supply comparison. Multivariate analysis of variance of repeated measuring was adopted for examining the differences in H&H Lactation Scale and feeding methods.
3. RESULTS
The number of participants from eligibility to data analysis was shown in Figure 2. Of 321 eligible mothers, 157 (48.91%) refused to participate in this research. There was no difference in the demographic information (maternal age t = 0.89, p = .37; education χ2 = 0.78, p = .44; race χ2 = 0.29, p = .59; residence χ2 = 0.67, p = 0.41; and employment χ2 = 0.46, p = .50) between the mothers who refused and those who participated.
Figure 2.
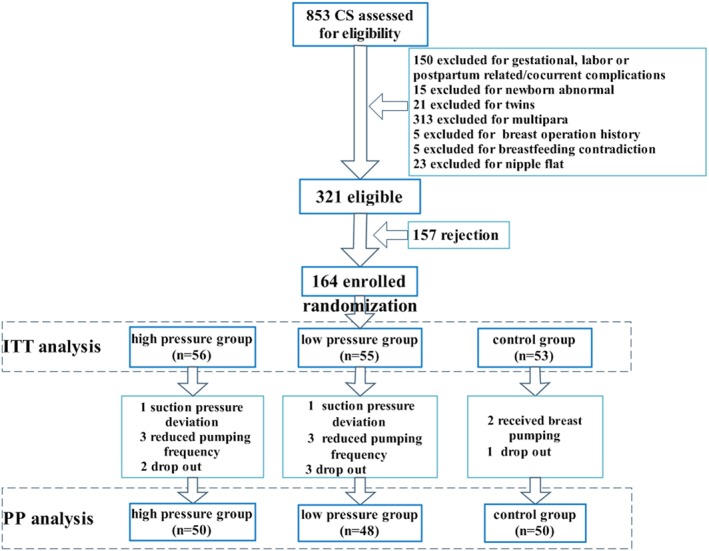
Flow chart of participants from eligibility to data analysis. CS = caesarean; ITT = intention‐to‐treat; PP = per‐protocol
Among the 164 mothers enrolled, 16 (9.76%) deviated from the protocol (suction pressure, frequency, and withdraw) because of ineffectiveness, nipple pain, maternal fatigue, no demand, others suggestion, and ethical consideration. Therefore, 148 subjects were included in PP analysis.
Before OL, there were totally 15.23 times and 449 min duration of breast pumping for the high pressure group. There was no statistical difference in suction duration and frequency between the high pressure group and low pressure group. Protocol adherence was 89.29%, 87.27%, and 94.34%, respectively (Table 1).
Table 1.
Frequency, duration, and adherence of breast pumping before onset of lactation
| High pressure group (n = 56) | Low pressure group (n = 55) | Control group (n = 53) | t | p | |
|---|---|---|---|---|---|
| Suction pressure, mmHg | 150 | 100 | — | — | — |
| Suction frequency, M (SD), number of sessions | 15.23 ± 3.79 | 15.90 ± 4.72 | — | −0.83 | .411 |
| Suction duration, M (SD), min | 449.11 ± 114.99 | 471.38 ± 141.02 | — | −0.91 | .364 |
| Adherence, n (%) | |||||
| Totally | 50 (89.29) | 48 (87.27) | 50 (94.34) | 1.62 | .445 |
| Partially | 6 (10.71) | 7 (12.73) | 3 (5.66) | — | — |
After OL, four newborns were transferred to neonatology department. Their mothers' milk supply was gained by breast pump. Additionally, we achieved two mothers' milk output by home visit and one by self‐reported breast pump suction because of their earlier hospital discharge. Those may skew the result.
Initially, there was no difference in demographic characteristics (Table 2-1), gestational and delivery information (Table 2-2), and breastfeeding related data (Table 2-3) of mother–infant dyads among three groups until 1 month after delivery (Table 2-4).
Table 2-1.
Demographic characteristics for mother–infant dyads
| High pressure group (n = 56) | Low pressure group (n = 55) | Control group (n = 53) | F/χ2 | p | |
|---|---|---|---|---|---|
| Maternal age, M (SD), years | 26.54 ± 3.43 | 27.49 ± 3.83 | 26.64 ± 3.07 | 1.26 | .287 |
| Race, n (%) | |||||
| Han | 55 (98.21) | 54 (98.18) | 53 (100) | 0.95 | .622 |
| Minority | 1 (1.79) | 1 (1.82) | 0 (0) | ||
| Household income, RMB/month | |||||
| <2000 | 3 (5.36) | 1 (1.82) | 3 (5.66) | 4.81 | .090 |
| 2001–3000 | 22 (39.29) | 17 (30.91) | 28 (52.83) | ||
| 3001–5000 | 15 (26.79) | 21 (38.18) | 10 (18.87) | ||
| >5001 | 16 (28.57) | 16 (29.09) | 12 (22.64) | ||
| Maternal education, n (%) | |||||
| ≤9 years | 3 (8.82) | 3 (8.11) | 2 (5.26) | 1.48 | .478 |
| 9–11 years | 3 (8.82) | 8 (21.62) | 6 (15.79) | ||
| 11–15 years | 25 (73.54) | 24 (64.86) | 27 (71.06) | ||
| ≥15 years | 3 (8.82) | 2 (5.41) | 3 (7.89) | ||
| Employment status, n (%) | |||||
| Employed | 34 (60.71) | 42 (76.36) | 31 (58.49) | 4.57 | .102 |
| Unemployed | 22 (39.29) | 13 (23.64) | 22 (41.51) | ||
| Marital status, n (%) | |||||
| Married | 55 (98.21) | 53 (96.36) | 53 (100) | 2.97 | .562 |
| Unmarried | 0 (0) | 1 (1.82) | 0 (0) | ||
| Lose spouse | 1 (1.79) | 1 (1.82) | 0 (0) | ||
| Newborn birth weight, M (SD), g | 3424.11 ± 408.88 | 3449.46 ± 337.83 | 3528.30 ± 407.92 | 2.45 | .294 |
| Newborn gender, n (%) | |||||
| Male | 33 (58.93) | 30 (54.55) | 24 (45.28) | 2.11 | .348 |
| Female | 23 (41.07) | 25 (45.45) | 29 (54.72) |
Table 2-2.
Gestational and delivery information
| High pressure group (n = 56) | Low pressure group (n = 55) | Control group (n = 53) | F/χ2 | p | |
|---|---|---|---|---|---|
| Gestational | |||||
| Numbers of antenatal care interviews, M (SD) | 9.39 ± 1.20 | 9.51 ± 21.19 | 9.49 ± 1.25 | 0.15 | .864 |
| Pregestational BMI, M (SD), kg/m2 | 20.51 ± 2.58 | 21.32 ± 3.10 | 21.26 ± 3.34 | 1.22 | .299 |
| Gestational BMI gain, M (SD), kg/m2 | 6.19 ± 1.85 | 6.20 ± 1.73 | 5.91 ± 2.02 | 0.41 | .667 |
| Gestational age, M (SD), weeks | 39.30 ± 0.94 | 39.35 ± 1.12 | 39.43 ± 0.92 | 0.24 | .788 |
| Gestational BMI gain, M (SD), kg/m2 | 6.19 ± 1.85 | 6.20 ± 1.73 | 5.91 ± 2.02 | 0.41 | .667 |
| Delivery | |||||
| Delivery mode, n (%) | |||||
| UCS | 37 (66.07) | 39 (70.91) | 38 (71.70) | 0.48 | .785 |
| LCS | 19 (33.93) | 16 (29.10) | 15 (28.30) | ||
| Caesarean section | |||||
| Scheduled | 45 (80.36) | 47 (85.45) | 47 (88.68) | 1.49 | .475 |
| Emergency | 11 (19.64) | 8 (14.55) | 6 (11.32) | ||
| Presentation, n (%) | |||||
| Head | 50 (89.29) | 48 (87.27) | 44 (83.02) | 0.95 | .621 |
| Breech | 6 (10.71) | 7 (12.73) | 9 (16.98) | ||
| Anaesthesia, n (%) | |||||
| General | 2 (3.57) | 1 (1.82) | 1 (1.89) | 1.60 | .953 |
| Epidural | 51 (91.07) | 52 (94.55) | 48 (90.57) | ||
| Spinal | 2 (3.57) | 1 (1.82) | 3 (5.66) | ||
| CSE | 1 (1.79) | 1 (1.82) | 1 (1.89) | ||
| Post‐operative anaesthesia, n (%) | |||||
| None | 14 (25.00) | 10 (18.18) | 9 (16.98) | 1.55 | .818 |
| PCEA | 37 (66.07) | 41 (74.55) | 40 (75.47) | ||
| PCIA | 5 (8.93) | 4 (7.27) | 4 (7.55) | ||
| PCEA/PEIA duration, M (SD), hr | 22.32 ± 20.76 | 18.65 ± 20.29 | 23.25 ± 20.85 | 0.74 | .478 |
Note. BMI = body mass index; CSE = combined spinal–epidural analgesia; LCS = laboured caesarean section (caesarean after trial of vaginal delivery or with signs of labour); PCEA = patient controlled epidural analgesia; PCIA = patient controlled intravenous analgesia; UCS = unlabored caesarean section (caesarean without signs of labour).
Table 2-3.
Breastfeeding related data during hospitalization
| High pressure group (n = 56) | Low pressure group (n = 55) | Control group (n = 53) | F/χ2 | p | |
|---|---|---|---|---|---|
| Early breastfeeding | |||||
| Time to first breastfeeding, M (SD), min | 99.75 ± 33.10 | 104.11 ± 36.89 | 103.82 ± 23.53 | 0.32 | .726 |
| Duration of first breastfeeding, M (SD), min | 16.92 ± 10.73 | 15.33 ± 11.07 | 14.66 ± 10.30 | 0.65 | .524 |
| IBAT score, M (SD) | 10.96 ± 1.46 | 10.36 ± 1.76 | 10.98 ± 1.61 | 2.60 | .077 |
| Newborn peak sucking pressure, M (SD), kPa | 14.20 ± 4.89 | 13.07 ± 4.39 | 13.71 ± 5.57 | 0.73 | .485 |
| Newborn mean sucking pressure, M (SD), kPa | 8.60 ± 4.41 | 7.47 ± 2.85 | 7.51 ± 2.93 | 1.87 | .157 |
| Newborn baseline sucking pressure, M (SD), kPa | 1.90 ± 0.86 | 1.73 ± 0.72 | 1.68 ± 0.65 | 1.31 | .273 |
| Breastfeeding before OL | |||||
| Breastfeeding frequency, M (SD), number of sessions/24 hr | 8.75 ± 2.09 | 8.03 ± 2.85 | 8.23 ± 2.33 | 1.28 | .280 |
| Sucking duration, M (SD), min/24 hr | 160.29 ± 65.23 | 141.23 ± 76.43 | 145.55 ± 69.88 | 1.11 | .332 |
| Formula frequency, M (SD), number of sessions/24 hr | 4.45 ± 2.63 | 4.68 ± 2.41 | 5.34 ± 2.26 | 1.97 | .143 |
| Formula volume, M (SD), ml/24 hr | 81.16 ± 62.07 | 85.45 ± 54.28 | 100.87 ± 61.39 | 1.65 | .196 |
| Use of formula before OL, n (%) | |||||
| No | 42 (75.00) | 43 (78.18) | 39 (73.58) | 0.33 | .849 |
| Yes | 14 (25.00) | 12 (21.82) | 14 (26.42) | ||
| Potential related factors | |||||
| EPDS score, M (SD) | 4.14 ± 3.08 | 4.42 ± 3.27 | 3.68 ± 2.72 | 0.81 | .445 |
| Maternal pain score before first pumping, M (SD) | 1.71 ± 1.71 | 2.29 ± 2.42 | 2.13 ± 1.69 | 1.27 | .284 |
| Maternal fatigue score before first pumping, M (SD) | 2.09 ± 2.19 | 2.57 ± 2.77 | 2.68 ± 2.41 | 0.89 | .412 |
| Postpartum hospital stay, M (SD), days | 5.75 ± 0.88 | 5.73 ± 0.95 | 5.75 ± 0.68 | 0.01 | .990 |
| Mother–infant separation, Mdn (Q), hr | 2.5 (2–3) | 2 (1.5–3) | 2.5(2–3) | 0.89 | .641 |
Note. EPDS = Edinburgh Postnatal Depression Scale; IBAT, Infant Breastfeeding Assessment Tool; Mdn = median; Q = interquartile range; OL = onset of lactation.
Table 2-4.
Breastfeeding related data at 1 month after delivery
| High pressure group (n = 50) | Low pressure group (n = 48) | Control group (n = 50) | F/χ2 | p | |
|---|---|---|---|---|---|
| Breastfeeding at 1 month | |||||
| IBAT score, M (SD) | 11.04 ± 2.54 | 10.20 ± 3.70 | 11.23 ± 2.38 | 1.88 | .155 |
| Breastfeeding frequency, M (SD), number of sessions/24 hr | 8.64 ± 2.18 | 7.38 ± 3.06 | 7.11 ± 3.26 | 4.48 | .013 |
| Sucking duration, M (SD), min/24 hr | 202.59 ± 90.00 | 148.89 ± 100.15 | 158.68 ± 107.97 | 4.58 | .012 |
| Formula frequency, Mdn (Q), number of sessions/24 hr | 0 (0–1) | 1 (0–4) | 3 (0–5) | 11.59 | .003 |
| Formula volume, Mdn (Q), ml/24 hr | 0 (0–100) | 100 (0–360) | 210 (0–510) | 9.93 | .007 |
| Potential related factors at 1 montha | |||||
| Return to work, n (%) | |||||
| Yes | 0 (0) | 1 (1.82) | 0 (0) | 2.10 | .350 |
| No | 50 (100) | 47 (98.18) | 50 (100) | ||
| Infant illness, n (%) | |||||
| Yes | 10 (20) | 13 (27.08) | 10 (20) | 0.94 | .625 |
| No | 40 (80) | 35 (72.91) | 40 (80) | ||
| Maternal illness, n (%) | |||||
| Yes | 8 (16) | 11 (22.92) | 16 (32) | 3.57 | .168 |
| No | 42 (84) | 37 (77.08) | 34 (68) | ||
| Mother–infant separation, Mdn (Q), hr | 0 (0–0) | 0 (0–0) | 0 (0–0) | 1.04 | .594 |
| Maternal pain score, Mdn (Q) | 0 (0–1) | 0 (0–1) | 0 (0–0) | 0.61 | .739 |
| EPDS score, M (SD) | 1.45 ± 2.16 | 1.33 ± 1.62 | 1.81 ± 1.77 | 0.98 | .378 |
| Breast pump usage, n (%) | |||||
| Yes | 35 (70) | 33 (68.75) | 26 (52) | 4.34 | .114 |
| No | 15 (30) | 15 (31.25) | 24 (48) | ||
Note. IBAT is a scale for infant breastfeeding behaviour assessment with a total maximum score of 12, which included arousal, rooting, time to latch and fixing, and suckling effectiveness.
EPDS = Edinburgh Postnatal Depression Scale; IBAT = Infant Breastfeeding Assessment Tool; Mdn = median; Q = interquartile range.
16 cases of data were missing (6 in high pressure group, 7 in low pressure group, and 3 in control group).
By ITT analysis, the timing of OL after −150 mmHg pumping was 6.82 hr ahead of those using −100 mmHg (p = .045). Milk output increased statistically on the fourth day after the −150 mmHg suction pressure stimulation. Additional suction frequency and duration achieved an earlier OL, whereas no statistical difference existed in milk supply between the low pressure group and control group. When controlling the pumping pressures after OL, the result of milk supply kept consistent with the unadjusted. PRL increment varied with the pumping pressure. Covariance analysis verified the above results of the timing of OL, PRL level, and milk supply after controlling for demographic characteristics including maternal age, BMI gain, gestational age, and newborn birth weight (Table 3-1). Mothers in two pumping groups seemed to be more satisfied with their lactation at discharge, and the group difference became significant at 1 month after delivery. Likewise, the results by PP analysis were consistent with those by ITT analysis (Table 3-2).
Table 3-1.
Intention‐to‐treat analysis of study outcomes
| High pressure group (n1 = 56) | Low pressure group (n2 = 55) | Control group (n3 = 53) | F/χ2/Z | p | |
|---|---|---|---|---|---|
| Timing of onset of lactationc, M (SD), hr | 53.34 ± 16.81 | 60.16 ± 18.16 | 70.39 ± 18.36 | 12.66 | .000 |
| 1 versus 2: p = .045; 2 versus 3: p = .003; 1 versus 3: p = .000 | |||||
| PRL incrementc, M (SD), ng/ml | 104.35 ± 87.12 | 67.20 ± 35.28 | 39.30 ± 64.24 | 13.40 | .000 |
| 1 versus 2: p = .003; 2 versus 3: p = .029; 1 versus 3: p = .000 | |||||
| Milk supplyc, M (SD), g | 157.69 ± 68.34 | 103.22 ± 45.04 | 84.51 ± 51.50 | 25.36 | .000 |
| 1 versus 2: p = .000; 2 versus 3: p = .084; 1 versus 3: p = .000 | |||||
| Milk supplyc , a, M (SE), g | 162.34 ± 7.98 | 102.46 ± 8.14 | 85.37 ± 8.32 | 24.97 | .000 |
| 1 versus 2: p = .000; 2 versus 3: p = .144; 1 versus 3: p = .000 | |||||
| Onset of lactationc , b, M (SE), hr | 53.89 ± 2.34 | 60.33 ± 2.37 | 69.64 ± 2.42 | 10.92 | .000 |
| 1 versus 2: p = .056; 2 versus 3: p = .007; 1 versus 3: p = .000 | |||||
| PRL incrementc , b, M (SE), ng/ml | 105.08 ± 8.77 | 67.64 ± 8.88 | 38.08 ± 9.07 | 14.14 | .000 |
| 1 versus 2: p = .003; 2 versus 3: p = .022; 1 versus 3: p = .000 | |||||
| Milk supplyc , b, M (SE), g | 156.81 ± 7.54 | 103.95 ± 7.64 | 84.68 ± 7.80 | 23.87 | .000 |
| 1 versus 2: p = .000; 2 versus 3: p = .081; 1 versus 3: p = .000 | |||||
| H&H Lactation Scale at dischargec, M (SD) | 130.05 ± 12.43 | 125.42 ± 13.18 | 108.23 ± 26.53 | 20.92 | .000 |
| 1 versus 2: p = .189; 2 versus 3: p = .000; 1 versus 3: p = .000 | |||||
| H&H Lactation Scale at 1 monthc, M (SD) | 133.32 ± 19.54 | 119.42 ± 28.40 | 99.42 ± 38.50 | 17.93 | .000 |
| 1 versus 2: p = .015; 2 versus 3: p = .001; 1 versus 3: p = .000 | |||||
| Group: F = 25.536, p = .000; time: F = 3.218, p = .075; group * time: F = 2.866, p = .060 | |||||
| Feeding methods at discharge | |||||
| EBF | 30 (53.57) | 26 (47.27) | 19 (35.85) | 11.19 | .004 |
| Predominant BF | 7 (12.5) | 6 (10.91) | 3 (5.66) | ||
| High BF | 10 (17.86) | 6 (10.91) | 4 (7.55) | ||
| Middle BF | 8 (14.29) | 12 (21.82) | 12 (22.64) | ||
| Low BF | 0 (0) | 5 (9. 09) | 13 (24.53) | ||
| Token BF/AF | 1 (1.79) | 0 (0) | 2 (3.77) | ||
| 1 versus 2: Z = −1.208, p = .227; 2 versus 3: Z = −2.170, p = .030; 1 versus 3: Z = −3.246, p = .001 | |||||
| Feeding methods at 1 monthc | |||||
| EBF | 33 (58.92) | 26 (47.27) | 20 (37.74) | 11.28 | .004 |
| Predominant BF | 14 (21.43) | 9 (18.18) | 6 (11.32) | ||
| High BF | 5 (8.93) | 5 (12.73) | 3 (5.66) | ||
| Middle BF | 1 (5.36) | 4 (7.27) | 12 (20.75) | ||
| Low BF | 2 (3.57) | 7 (10.91) | 6 (9.43) | ||
| Token BF/AF | 1 (1.79) | 4 (3.64) | 6 (15.10) | ||
| 1 versus 2: Z = −1.973, p = .049; 2 versus 3: Z = 1.318, p = .188; 1 versus 3: Z = −3.378, p = .001 | |||||
| Group: F = 9.096, p = .000; time: F = 0.523, p = .470; group * time: F = 0.886, p = .414 | |||||
Note. Feeding methods was evaluated by frequency of breastfeeds and formula within a 24‐hr period (breastfeeds frequency/(breastfeeds frequency + formula frequency) * 100%). H&H Lactation Scale evaluates mother's satisfaction in lactation.
PRL increment = PRL level after sucking − PRL level before sucking.
AF = artificial feeding; BF = breastfeeding; EBF = exclusive breastfeeding; PRL = prolactin.
Comparison of milk supply after adjusting the pumping pressure after onset of lactation.
Covariance analysis after controlling for maternal age, maternal BMI gain, gestational age, and newborn birth weight. Covariates appearing in the model were evaluated at the following values: maternal age = 26.89, gestational week = 275.52, newborn birth weight = 3,466.28, and maternal BMI gain = 15.89. Newborn birth weight impacts the timing of onset of lactation (F = 7.56, p = .007) and PRL increment (F = 4.48, p = .036).
Six cases with missing data imputation (group average and last observed response method), 2 (3.57%, 2/56) in high pressure group, 3 (5.45%, 3/55) in low pressure group, and 1(1.89%, 1/53) in control group. There was no statistical difference in the rate of dropout among three groups (χ 2 = 0.98, p = .61).
Table 3-2.
Per‐protocol analysis of study outcomes
| High pressure group (n1 = 50) | Low pressure group (n2 = 48) | Control group (n3 = 50) | F/χ2/Z | p | |
|---|---|---|---|---|---|
| Onset of lactation, M (SD), hr | 52.24 ± 16.61 | 59.96 ± 17.11 | 70.64 ± 18.43 | 12.71 | .000 |
| 1 versus 2: p = .030; 2 versus 3: p = .003; 1 versus 3: p = .000 | |||||
| PRL increment, M (SD), ng/ml | 117.65 ± 79.63 | 67.29 ± 35.30 | 39.78 ± 65.57 | 19.48 | .000 |
| 1 versus 2: p = .000; 2 versus 3: p = .033; 1 versus 3: p = .000 | |||||
| Milk supply, M (SD), g | 164.28 ± 69.14 | 102.60 ± 40.99 | 83.66 ± 52.24 | 28.76 | .000 |
| 1 versus 2: p = .000; 2 versus 3: p = .093; 1 versus 3: p = .000 | |||||
| Milk supplya, M (SE), g | 168.34 ± 8.34 | 101.53 ± 8.73 | 85.02 ± 8.43 | 27.66 | .00 |
| 1 versus 2: p = .000; 2 versus 3: p = .176; 1 versus 3: p = .000 | |||||
| Onset of lactationb, M (SE), hr | 53.92 ± 2.41 | 60.25 ± 2.47 | 69.67 ± 2.42 | 10.92 | .000 |
| 1 versus 2: p = .070; 2 versus 3: p = .008; 1 versus 3: p = .000 | |||||
| PRL incrementb, M (SE), ng/ml | 118.21 ± 8.91 | 68.61 ± 9.15 | 37.95 ± 8.97 | 20.42 | .000 |
| 1 versus 2: p = .003; 2 versus 3: p = .019; 1 versus 3: p = .000 | |||||
| Milk supplyb, M (SE), g | 163.43 ± 7.96 | 102.74 ± 8.17 | 84.38 ± 8.01 | 26.77 | .000 |
| 1 versus 2: p = .000; 2 versus 3: p = .114; 1 versus 3: p = .000 | |||||
| H&H Lactation Scale at discharge, M (SD) | 130.51 ± 12.97 | 125.29 ± 13.51 | 107.76 ± 26.56 | 19.79 | .000 |
| 1 versus 2: p = .175; 2 versus 3: p = .000; 1 versus 3: p = .000 | |||||
| H&H Lactation Scale at 1 month, M (SD) | 133.90 ± 20.33 | 120.35 ± 29.33 | 98.36 ± 38.83 | 17.32 | .000 |
| 1 versus 2: p = .030; 2 versus 3: p = .000; 1 versus 3: p = .000 | |||||
| Group: F = 24.842, p = .000; time: F = 2.402, p = .123; group * time: F = 2.542, p = .082 | |||||
| Feeding methods at discharge | |||||
| EBF | 28 (56.00) | 23 (47.92) | 17 (34.00) | 8.18 | .017 |
| Predominant BF | 6 (12.00) | 5 (10.42) | 3 (6.00) | ||
| High BF | 8 (16.00) | 6 (12.50) | 4 (8.00) | ||
| Middle BF | 7 (14.00) | 10 (20.83) | 12 (24.00) | ||
| Low BF | 0 (0) | 4 (8.33) | 12 (24.00) | ||
| Token BF/AF | 1 (2.00) | 0 (0) | 2 (4.00) | ||
| 1 versus 2: Z = 1.203, p = .229; 2 versus 3: z = 2.318, p = .020; 1 versus 3: z = 3.390, p = .001 | |||||
| Feeding methods at 1 month | |||||
| EBF | 33 (66.00) | 24 (50.00) | 18 (36.00) | 9.02 | .011 |
| Predominant BF | 10 (20.00) | 9 (18.75) | 6 (12.00) | ||
| High BF | 4 (8.00) | 5 (10.42) | 3 (6.00) | ||
| Middle BF | 1 (2.00) | 3 (6.25) | 11 (22.00) | ||
| Low BF | 1 (2.00) | 4 (8.33) | 6 (12.00) | ||
| Token BF/AF | 1 (2.00) | 3 (6.25) | 6 (12.00) | ||
| 1 versus 2: Z = 1.977, p = .048; 2 versus 3: z = 1.972, p = .049; 1 versus 3: z = 3.868, p = .000 | |||||
| Group: F = 10.775, p = .000; time: F = 1.769, p = .186; group * time: F = 0.554, p = .576 | |||||
Note. H&H Lactation Scale evaluates mother's satisfaction in lactation. PRL increment = PRL level after sucking − PRL level before sucking.
AF = artificial feeding; BF = breastfeeding; EBF = exclusive breastfeeding; PRL = prolactin.
Comparison of milk supply after adjusting the pumping pressure after onset of lactation.
Covariance analysis after controlling for maternal age, maternal BMI gain, gestational age, and newborn birth weight. Covariates appearing in the model were evaluated at the following values: maternal age = 26.93, gestational week = 275.94, newborn birth weight = 3,475.47, and maternal BMI gain = 15.97. Newborn birth weight impacts the timing of onset of lactation (F = 7.11, p = .009) and PRL increment (F = 4.78, p = .030).
As shown in Table 4, early breast pumping within 2 hr after caesarean section did not affect women's systolic pressure, diastolic pressure, and heart rate. However, suction at −150 mmHg led to a slight increase in nipple pain (p = .165) and occurrence of cracked nipples (58.93% vs. 54.55% vs. 50.98%, p = .710) though statistical significance was not achieved. Meanwhile, additional pumping resulted in a higher maternal fatigue score (p = .103) in pumping groups.
Table 4.
Potential side effect analysis of breast pumping
|
High pressure group (n = 56) |
Low pressure group (n = 55) |
Control group (n = 53) |
F/χ2 | p | |
|---|---|---|---|---|---|
| Systolic pressure change, Mdn (Q), mmHg | 1 (−2–4) | 2 (−2–4) | 4 (0–8) | 1.38 | .502 |
| Diastolic pressure change, Mdn (Q), mmHg | 1 (−4–4) | 2 (−2–4) | 4 (1–8) | 0.70 | .706 |
| Heart rate change, Mdn (Q), times/min | 1 (−4–4) | 1 (−3–3) | 2 (−2–4) | 1.31 | .519 |
| Nipple pain score, M (SD) | 1.27 ± 0.83 | 0.86 ± 1.44 | 1.19 ± 1.24 | 1.82 | .165 |
| Maternal fatigue score, M (SD) | 2.97 ± 2.01 | 2.84 ± 2.73 | 2.01 ± 2.76 | 2.31 | .103 |
| Cracked nipple, n (%) | 2 (−2 4) | 4 (0 8) | 0.69 | .710 | |
| Yes | 33 (58.93) | 30 (54.55) | 26 (50.98) | 2.25 | .324 |
| No | 23 (41.07) | 25 (45.45) | 25 (49.02) | 2.24 | .110 |
| Breast pump usage after OL, n (%) | 0.62 | .733 | |||
| Yes | 37 (66.07) | 35 (63.64) | 28 (52.83) | 1.38 | .502 |
| No | 19 (33.93) | 20 (36.36) | 25 (47.17) | 0.70 | .706 |
| Suction pressure of breast pumping after OL, M (SD), mmHg | 172.32 ± 58.91 | 148.47 ± 97.19 | 184.59 ± 108.85 | 1.31 | .519 |
| Frequency of pumping after OL, Mdn (Q), number of sessions | 2 (0–4) | 2 (0–3) | 2 (0–3) | 1.82 | .165 |
Note. Nipple pain score, Suction pressure, and frequency of pumping were compared by using their average data evaluated once a day within the hospitalization period.
OL = onset of lactation.
After OL, the usage of breast pump is 66.07% (n = 37) in the high pressure group, 63.64% (n = 35) in the low pressure group, and 52.83% (n = 28) in the control group (p = .324). There was no difference in the frequency of usage (2 times a day on average) among three groups. Mothers in the low pressure group tended to adopt a lower suction pressure than those in the high pressure group. Unexpectedly, women in the control group adopted the highest suction pressure with a relatively broad variance, though statistical difference was not achieved among groups.
4. DISCUSSION
Physiologically, a higher pressure stimulation advances the timing of OL and increases milk supply. An earlier OL may give women much more confidence in their milk supply and improve breastfeeding continuation and exclusivity. The caesarean newborns' intraoral vacuums ranged from −13.07 to −14.2 kPa (−98 to −107 mmHg) in this study, which are predominantly lower than those after normal vaginally delivery (−150 mmHg; Zhang, Xia, Li, et al., 2016). As expected, after an increase in suction pressure to −150 mmHg by breast pump, the early breastfeeding outcomes are improved. It supports our hypothesis that the weak suction pressure may be reason leading to the early cessation of breastfeeding for women who experience caesarean section. Zinaman, Hughes, Queenan, Labbok, and Albertson (1992) compared the effect of different pumping pressures at −110, −180, and −220 mmHg and found that the optimal efficiency in PRL secretion and lactation was obtained at −180 mmHg suction pressure, whereas the −110 mmHg stimulation was the worst. In the Zinaman et al. (1992) study, −180 mmHg was the level of normal infant suction, because this strength stimulation generated the same effect as that of infant suction on breast. It supports our outcome that a relatively strong suction strength within the range of normal infants' suction pressures is most effective in lactation promotion. Our prior observational study (Zhang, Xia, Shen, et al., 2016) discovered that PRL level and milk supply varied with the level of infants' suction pressures. Similarly, previous studies have considered the relationship between milk transfer and PRL level (Bruna, de Di Nasso, Soaje, Deis, & Caron, 2010) and the relationship between the suction pressure and milk consummation (Kron, Stein, & Goddard, 1966). Hence, a higher pressure pumping on breasts may impact the PRL secretion and, in turn, the milk supply.
Another explanation of the effectiveness of suction pressure on the OL and milk supply might be that pumping intervention boosts mother's confidence in breastfeeding. Evidence supports the contention that maternal breastfeeding confidence is a predominant predictor of breastfeeding duration (Blyth et al., 2002) and pumping may exert a positive effect for mothers to control breastfeeding process and to quantify the milk supply. However, some mothers may show an overdependency on a pumping device (Buckley, 2009) and shorten their breastfeeding duration (Forster et al., 2015; Jiang et al., 2015). Accordingly, both physiological and psychological measures should be provided to encourage and sustain mother's breastfeeding efficacy and effectiveness. Prudent evaluation is required before application of pumping.
A higher than normal infant suction pressure stimulation does not generate additional benefit (Zinaman et al., 1992). Inversely, an excessively high suction pressure (Perrella, Lai, & Geddes, 2015) (−233 ± 152 mmHg) may result in severe pain and nipple injuries. McClellan, Kent, Hepworth, Hartmann, and Geddes (2015) reported that extremely high sucking strength (−237.7 ± 59.6 mmHg) leads to a lowered flow rate of milk transfer. It is for this reason why our target pressure was set at −150 mmHg, the normal vaginally delivered newborn suction strength, and why a higher pressure group was not included in our research.
In contrast, Chapman, Young, Ferris, and Perez‐Escamilla (2001) reported that breast pumping at −100 mmHg was ineffective in promoting milk transfer after caesarean section, possibly due to sufficient stimulation of the breast. However, stronger stimulation (−150 mmHg) achieved a significant improvement in timing of the onset of lactation and increased daytime milk supply. Additionally, a delayed beginning (48th hr vs. 2nd hr after delivery) and infrequent (3 times/day vs. 6–7 times/day) use of the breast pump may be another cause of inconsistency amongst studies.
Suckling stimulation as early as possible is of vital importance for OL and milk supply. Evidence (Sakalidis, Kent, et al., 2013) supports the necessity of sufficient suction strength stimulation before OL, especially within the first 24 hr after delivery (Zhang, Xia, Li, et al., 2016). For mother–infant separation, preterm infants, and babies with latch issues, breast pumping at effective suction pressure can be one option for mothers to promote their onset and maintenance of lactation. Effective breast stimulation as early as possible has become the consensus for successful breastfeeding (Morton, Hall, & Pessl, 2013). Besides the suction pressure, hand expression has been shown to increase milk production in mothers of preterm infants (Morton et al., 2009). Further research should focus on mechanism of lactation and effective stimuli.
No serious adverse events related to pumping interventions occurred. However, it should be noted that nipple pain and fatigue scores are slightly higher in the pumping groups. One participant decreased the suction pressure due to nipple pain in the high pressure group, and six women decreased the pumping frequency. Though a statistical difference was not achieved, we concluded that additional stimulation with a breast pump may aggravate nipple pain and maternal fatigue.
Though a positive breastfeeding outcome was achieved when additional high pressure pumping was adopted, adverse effects of caesarean section are multi‐factorial have long term consequences (Zinaman et al., 1992). As the rate of caesarian section worldwide has increased to unprecedented levels, early support is necessary to mothers after caesarean section to promote their successful breastfeeding.
4.1. Limitation
Unfortunately, the nonblind design was conducted. The control group did not carry out any behaviours to mimic the behavioural aspects of use of the pump. Though these mothers were required to hold the breast shields of the pump to the breast with no suction initially, most of them saw through the trick and refused such request. It may influence outcomes especially for those measured by mother's perception due to the Hawthorne effect. Mothers in the pumping group may be more proficient in controlling the breast pump and sucking more milk. Additionally, only 8‐hr daytime rather than 24‐hr milk supply measurement was another limitation for this research. Because of the low participation rate (51.09%) and relatively high attrition (9.76%) in this study, the same effect may not be guaranteed in application.
5. CONCLUSION
Pumping at normal infant suction pressure is effective to advance OL and milk supply among mothers giving birth by caesarean section. Pumping enhances mothers' confidence in lactation. However, nursing staff should pay attention to maternal nipple pain and fatigue in application. It is imperative that mothers have access to appropriate pumping equipment with pressure screening and receive instructions on proper suction pressure to establish earlier OL and sufficient milk supply.
CONFLICT OF INTEREST
The authors declare that they have no conflict of interests.
AUTHOR CONTRIBUTION
FZ conceptualized the research questions, conducted data collection and statistical analyses, and drafted the initial and revised manuscripts. HX helped conceptualize the research questions, helped design the data collection methods, coordinated and supervised data collection, and critically revised manuscripts. YY, TB, LS, MS, XS, and MZ helped the research design, collected and inputted the data, conducted statistical analyses, and helped draft the initial manuscript. MG helped design the data collection instruments, supervised data collection, polished the language, and revised manuscripts. All authors approved the final manuscript as submitted.
ACKNOWLEDGMENTS
We are thankful to the midwives, nurses, and obstetricians at the Affiliated Hospital of Nantong University and Maternal and Children Health Care Service Hospital for their contribution.
Zhang F, Yang Y, Bai T, et al. Effect of pumping pressure on onset of lactation after caesarean section: A randomized controlled study. Matern Child Nutr. 2018;14:e12486 10.1111/mcn.12486
REFERENCES
- Blyth, R. , Creedy, D. K. , Dennis, C. L. , Moyle, W. , Pratt, J. , & De Vries, S. M. (2002). Effect of maternal confidence on breastfeeding duration: An application of breastfeeding self‐efficacy theory. Birth, 29, 278–284. [DOI] [PubMed] [Google Scholar]
- Bogg, L. , Huang, K. , Long, Q. , Shen, Y. , & Hemminki, E. (2010). Dramatic increase of cesarean deliveries in the midst of health reforms in rural China. Social Science & Medicine, 70, 1544–1549. [DOI] [PubMed] [Google Scholar]
- Bruna, F. A. , de Di Nasso, E. G. , Soaje, M. , Deis, R. P. , & Caron, R. W. (2010). Participation of opioid peptides in sucking‐induced oxytocin and prolactin secretions in lactating goats. Reproduction in Domestic Animals, 45, 796–802. [DOI] [PubMed] [Google Scholar]
- Buckley, K. M. (2009). A double‐edged sword: lactation consultants' perceptions of the impact of breast pumps on the practice of breastfeeding. The Journal of Perinatal Education, 18, 13–22. [DOI] [PMC free article] [PubMed] [Google Scholar]
- Chalder, T. , Berelowitz, G. , Pawlikowska, T. , Watts, L. , Wessely, S. , Wright, D. , & Wallace, E. P. (1993). Development of a fatigue scale. Journal of Psychosomatic Research, 37, 147–153. [DOI] [PubMed] [Google Scholar]
- Chapman, D. J. , Young, S. , Ferris, A. M. , & Perez‐Escamilla, R. (2001). Impact of breast pumping on lactogenesis stage II after cesarean delivery: A randomized clinical trial. Pediatrics, 107, E94. [DOI] [PubMed] [Google Scholar]
- Dewey, K. G. , Nommsen‐Rivers, L. A. , Heinig, M. J. , & Cohen, R. J. (2003). Risk factors for suboptimal infant breastfeeding behavior, delayed onset of lactation, and excess neonatal weight loss. Pediatrics, 112, 607–619. [DOI] [PubMed] [Google Scholar]
- Forster, D. A. , Johns, H. M. , McLachlan, H. L. , Moorhead, A. M. , McEgan, K. M. , & Amir, L. H. (2015). Feeding infants directly at the breast during the postpartum hospital stay is associated with increased breastfeeding at 6 months postpartum: A prospective cohort study. BMJ Open, 5, e7512. [DOI] [PMC free article] [PubMed] [Google Scholar]
- Geddes, D. T. , Kent, J. C. , Mitoulas, L. R. , & Hartmann, P. E. (2008). Tongue movement and intra‐oral vacuum in breastfeeding infants. Early Human Development, 84, 471–477. [DOI] [PubMed] [Google Scholar]
- Hobbs, A. J. , Mannion, C. A. , McDonald, S. W. , Brockway, M. , & Tough, S. C. (2016). The impact of caesarean section on breastfeeding initiation, duration and difficulties in the first four months postpartum. BMC Pregnancy and Childbirth, 16, 90. [DOI] [PMC free article] [PubMed] [Google Scholar]
- Hollis, S. , & Campbell, F. (1999). What is meant by intention to treat analysis? Survey of published randomised controlled trials. BMJ, 319, 670–674. [DOI] [PMC free article] [PubMed] [Google Scholar]
- Hruschka, D. J. , Sellen, D. W. , Stein, A. D. , & Martorell, R. (2003). Delayed onset of lactation and risk of ending full breast‐feeding early in rural Guatemala. Journal of Nutrition, 133, 2592–2599. [DOI] [PubMed] [Google Scholar]
- Huang, Y. Y. , Lee, J. T. , Huang, C. M. , & Gau, M. L. (2009). Factors related to maternal perception of milk supply while in the hospital. Journal of Nursing Research, 17, 179–188. [DOI] [PubMed] [Google Scholar]
- Jiang, B. , Hua, J. , Wang, Y. , Fu, Y. , Zhuang, Z. , & Zhu, L. (2015). Evaluation of the impact of breast milk expression in early postpartum period on breastfeeding duration: A prospective cohort study. BMC Pregnancy and Childbirth, 15, 268. [DOI] [PMC free article] [PubMed] [Google Scholar]
- Kron, R. E. , Stein, M. , & Goddard, K. E. (1966). Newborn sucking behavior affected by obstetric sedation. Pediatrics, 37, 1012–1016. [PubMed] [Google Scholar]
- Kruse, L. , Denk, C. E. , Feldman‐Winter, L. , & Rotondo, F. M. (2005). Comparing sociodemographic and hospital influences on breastfeeding initiation. Birth, 32, 81–85. [DOI] [PubMed] [Google Scholar]
- Lai, C. T. , Hale, T. W. , Simmer, K. , & Hartmann, P. E. (2010). Measuring milk synthesis in breastfeeding mothers. Breastfeeding Medicine, 5, 103–107. [DOI] [PubMed] [Google Scholar]
- Lin, S. Y. , Lee, J. T. , Yang, C. C. , & Gau, M. L. (2011). Factors related to milk supply perception in women who underwent cesarean section. Journal of Nursing Research, 19, 94–101. [DOI] [PubMed] [Google Scholar]
- Liu, P. , Qiao, L. , Xu, F. , Zhang, M. , Wang, Y. , & Binns, C. W. (2013). Factors associated with breastfeeding duration: A 30‐month cohort study in northwest China. Journal of Human Lactation, 29, 253–259. [DOI] [PubMed] [Google Scholar]
- McClellan, H. L. , Kent, J. C. , Hepworth, A. R. , Hartmann, P. E. , & Geddes, D. T. (2015). Persistent nipple pain in breastfeeding mothers associated with abnormal infant tongue movement. International Journal of Environmental Research and Public Health, 12, 10833–10845. [DOI] [PMC free article] [PubMed] [Google Scholar]
- Meier, P. P. (2001). Breastfeeding in the special care nursery. Prematures and infants with medical problems. Pediatric Clinics of North America, 48, 425–442. [DOI] [PubMed] [Google Scholar]
- Morton, J. , Hall, J. Y. , & Pessl, M. (2013). Five steps to improve bedside breastfeeding care. Nursing for Women's Health, 17, 478–488. [DOI] [PubMed] [Google Scholar]
- Morton, J. , Hall, J. Y. , Wong, R. J. , Thairu, L. , Benitz, W. E. , & Rhine, W. D. (2009). Combining hand techniques with electric pumping increases milk production in mothers of preterm infants. Journal of Perinatology, 29, 757–764. [DOI] [PubMed] [Google Scholar]
- Neville, M. C. , Keller, R. , Seacat, J. , Lutes, V. , Neifert, M. , Casey, C. , … Archer, P . (1988). Studies in human lactation: Milk volumes in lactating women during the onset of lactation and full lactation. American Journal of Clinical Nutrition, 48, 1375–1386. [DOI] [PubMed] [Google Scholar]
- Nommsen‐Rivers, L. A. , Chantry, C. J. , Peerson, J. M. , Cohen, R. J. , & Dewey, K. G. (2010). Delayed onset of lactogenesis among first‐time mothers is related to maternal obesity and factors associated with ineffective breastfeeding. American Journal of Clinical Nutrition, 92, 574–584. [DOI] [PubMed] [Google Scholar]
- Nommsen‐Rivers, L. A. , Dolan, L. M. , & Huang, B. (2012). Timing of stage II lactogenesis is predicted by antenatal metabolic health in a cohort of primiparas. Breastfeeding Medicine, 7, 43–49. [DOI] [PMC free article] [PubMed] [Google Scholar]
- Nunley, W. C. , Urban, R. J. , Kitchin, J. D. , Bateman, B. G. , Evans, W. S. , & Veldhuis, J. D. (1991). Dynamics of pulsatile prolactin release during the postpartum lactational period. The Journal of Clinical Endocrinology and Metabolism, 72, 287–293. [DOI] [PubMed] [Google Scholar]
- Obstetric And Gynecological Nursing Committee of Chinese Nursing Association (2012). Breastfeeding guide book. Beijing: Science and Technology Press. In Chinese [Google Scholar]
- Parker, L. A. , Sullivan, S. , Krueger, C. , Kelechi, T. , & Mueller, M. (2012). Effect of early breast milk expression on milk volume and timing of lactogenesis stage II among mothers of very low birth weight infants: A pilot study. Journal of Perinatology, 32, 205–209. [DOI] [PubMed] [Google Scholar]
- Perez‐Escamilla, R. , & Chapman, D. J. (2001). Validity and public health implications of maternal perception of the onset of lactation: An international analytical overview. Journal of Nutrition, 131, 3021S–3024S. [DOI] [PubMed] [Google Scholar]
- Perez‐Rios, N. , Ramos‐Valencia, G. , & Ortiz, A. P. (2008). Cesarean delivery as a barrier for breastfeeding initiation: The Puerto Rican experience. Journal of Human Lactation, 24, 293–302. [DOI] [PMC free article] [PubMed] [Google Scholar]
- Perrella, S. L. , Lai, C. T. , & Geddes, D. T. (2015). Case report of nipple shield trauma associated with breastfeeding an infant with high intra‐oral vacuum. BMC Pregnancy and Childbirth, 15, 155. [DOI] [PMC free article] [PubMed] [Google Scholar]
- Prior, E. , Santhakumaran, S. , Gale, C. , Philipps, L. H. , Modi, N. , & Hyde, M. J. (2012). Breastfeeding after cesarean delivery: A systematic review and meta‐analysis of world literature. American Journal of Clinical Nutrition, 95, 1113–1135. [DOI] [PubMed] [Google Scholar]
- Sakalidis, V. S. , Kent, J. C. , Garbin, C. P. , Hepworth, A. R. , Hartmann, P. E. , & Geddes, D. T. (2013). Longitudinal changes in suck‐swallow‐breathe, oxygen saturation, and heart rate patterns in term breastfeeding infants. Journal of Human Lactation, 29, 236–245. [DOI] [PubMed] [Google Scholar]
- Sakalidis, V. S. , Williams, T. M. , Hepworth, A. R. , Garbin, C. P. , Hartmann, P. E. , Paech, M. J. , … Geddes, D. T. (2013). A comparison of early sucking dynamics during breastfeeding after cesarean section and vaginal birth. Breastfeeding Medicine, 8, 79–85. [DOI] [PubMed] [Google Scholar]
- Souza, J. P. , Betran, A. P. , Dumont, A. , de Mucio, B. , Gibbs, P. C. , Deneux‐Tharaux, C. , … Gulmezoglu, A. M. (2016). A global reference for caesarean section rates (C‐Model): A multicountry cross‐sectional study. BJOG, 123, 427–436. [DOI] [PMC free article] [PubMed] [Google Scholar]
- Woods, A. B. , Crist, B. , Kowalewski, S. , Carroll, J. , Warren, J. , & Robertson, J. (2012). A cross‐sectional analysis of the effect of patient‐controlled epidural analgesia versus patient controlled analgesia on postcesarean pain and breastfeeding. Journal of Obstetric, Gynecologic, and Neonatal Nursing, 41, 339–346. [DOI] [PubMed] [Google Scholar]
- Yeneabat, T. , Belachew, T. , & Haile, M. (2014). Determinants of cessation of exclusive breastfeeding in Ankesha Guagusa Woreda, Awi Zone, Northwest Ethiopia: A cross‐sectional study. BMC Pregnancy and Childbirth, 14, 262. [DOI] [PMC free article] [PubMed] [Google Scholar]
- Zhang, F. , Xia, H. , Li, X. , Qin, L. , Gu, H. , Xu, X. , & Shen, M. (2016). Intraoral vacuum of breast‐feeding newborns within the first 24 hr: Cesarean section versus vaginal delivery. Biological Research for Nursing, 4, 445–453. [DOI] [PubMed] [Google Scholar]
- Zhang, F. , Xia, H. , Shen, M. , Li, X. , Qin, L. , Gu, H. , & Xu, X. (2016). Are prolactin levels linked to suction pressure? Breastfeeding Medicine, 9, 461–468. [DOI] [PubMed] [Google Scholar]
- Zhu, P. , Hao, J. , Jiang, X. , Huang, K. , & Tao, F. (2013). New insight into onset of lactation: Mediating the negative effect of multiple perinatal biopsychosocial stress on breastfeeding duration. Breastfeeding Medicine, 8, 151–158. [DOI] [PMC free article] [PubMed] [Google Scholar]
- Zinaman, M. J. , Hughes, V. , Queenan, J. T. , Labbok, M. H. , & Albertson, B. (1992). Acute prolactin and oxytocin responses and milk yield to infant suckling and artificial methods of expression in lactating women. Pediatrics, 89, 437–440. [PubMed] [Google Scholar]