

Abstract
The first two years of life are critical for growth and development. Little is known about infant and young child feeding (IYCF) practices in the Ecuadorian highlands and how they contribute to stunting. With the objective of understanding nutritional status and the influencing factors to design an intervention, we assessed the nutritional status of 293 infants and children between 0 and 24 months of age, living in 14 communities in the provinces of Tungurahua and Chimborazo using a cross‐sectional study design. We used the WHO IYCF indicators to assess feeding practices; estimated dietary intake with 24‐h recalls; and identified nutritious local foods by food frequency questionnaires. Multiple regression modelling was performed to identify correlates of nutritional status. Stunting was found in 56.2% of children. Mean protein, vitamin A and vitamin C intakes were above recommendations for all ages. Only infants 6.0 to 8.9 months of age and non‐breastfed children 12–23.9 months of age consumed energy intakes below recommendations. Younger age groups had below recommended intakes for iron and calcium. While mean complementary food densities met recommendations for protein, vitamin A, vitamin C and energy, those for zinc, iron and calcium were lower than recommended. Older age, respiratory infections and being male were predictors of lower HAZ, whereas early initiation of breastfeeding, higher socioeconomic status, consumption of iron‐rich foods and higher dietary protein density were protective. Interventions that promote and support optimal breastfeeding practices and enable increased consumption of nutritious local foods have potential to contribute to reducing stunting in this vulnerable population. © 2016 John Wiley & Sons Ltd
Keywords: Infants and young children, stunting, nutritional status, breastfeeding, complementary feeding, Ecuadorian Andes
Introduction
The estimated 195 million children who are stunted are at increased risk of morbidity, mortality and cognitive and developmental deficits that have implications for their own individual productivity as well as community and national productivity in adulthood (Pollitt et al. 1995; Black et al. 2008; Hoddinott et al. 2008; UNICEF 2008). The global nutrition community has recognized that addressing stunting, defined as height‐for‐age z score (HAZ) < −2, is most effective in pregnancy and the first two years of a child's life, a critical period for physical and cognitive development (Martorell et al. 1994; Shrimpton et al. 2001; Victora et al. 2010). Although the core recommended breastfeeding practices can apply to most countries, complementary feeding messages and key practices need to respond to specific available local foods, fortified products and micronutrient supplements, while following the general guiding principles for complementary feeding prepared by the World Health Organization (WHO) and the Pan American Health Organization (PAHO) (Pan American Health Organization/World Health Organization, PAHO/WHO, 2003). Complementary feeding requirements change with the growing infant, beginning at six months of age, when breast milk alone will not provide enough nutrition for the infant, until two years of age, as the child transitions to obtaining most nutrients from family foods.
Assessing infant and young child feeding practices previously required quantifying nutrient and energy intakes through a 24‐h recall, in order to compare intakes and nutrient and energy densities with recommendations (Brown et al. 1998; Dewey & Brown 2003). In 2008 WHO introduced eight core IYCF indicators (World Health Organization, WHO, 2008). These indicators can complement calculated nutrient densities and intakes, or can be used alone. With the exception of asking mothers about early initiation of breastfeeding, the new indicators can be assessed based on a 24‐h dietary recall. The 2008 WHO indicators may be advantageous over traditional dietary recalls as the estimated portion size and quantity of each food item consumed are not required, but rather a list of the foods and ingredients consumed. This can be especially beneficial in settings where capacity and resources are limited (World Health Organization, WHO, 2008). In some countries the indicators of diet diversity and quality have been positively associated with linear growth, but there is variation in the association between the IYCF indicators and anthropometric indices (Jones et al. 2014).
Ecuador has one of the highest rates of undernutrition in Latin America (UNICEF 2008), yet little is known about dietary practices among the most vulnerable populations. Stunting has been estimated to affect 25–29% of children under five years of age, global undernutrition was found in 6.2% and acute undernutrition in 2.3% (ENDEMAIN, Encuesta Demográfica y de Salud Materna e Infantil 2004; UNICEF et al. 2014). While stunting is a public health concern at a national level, indigenous children in the Ecuadorian highlands seem to bear a disproportional share of the burden, with rates estimated as high as 58%. Social exclusion and location, rather than ethnicity, have been suggested as the influencing factors impacting diet and health, especially for rural communities in the highlands (ENDEMAIN, Encuesta Demográfica y de Salud Materna e Infantil, 2004; World Bank 2007). Although high altitude communities in Ecuador are among the poorest, there may also be a small independent developmental influence of altitude on growth (Greksa 2006).
Ecuador has not achieved reductions in stunting relative to improvements in gross domestic product and classification as a middle‐income country (World Bank 2007). Little documentation is available on infant and young child feeding practices in the highlands of Ecuador (ENDEMAIN, Encuesta Demográfica y de Salud Materna e Infantil, 2004; UNICEF et al. 2014). Our overall objective, therefore, was to assess the feeding practices and nutritional status of infants and young children in high altitude communities of the Ecuadorian Andes. By identifying risk factors for stunting, key messages and local strategies could then be developed and promoted within a community nutrition intervention.
Key messages.
Stunting levels of 56.2% are of public health concern in rural highlands communities in Tungurahua and Chimborazo, Ecuador with the effects of stunting manifesting in the first two years of life.
Dietary data suggest adequate intake of vitamin A, vitamin C and protein while iron, zinc and calcium intakes were below recommendations.
Local nutritious foods are available and should be promoted in complementary feeding.
Methods
Study overview
The overall study design was a cross‐sectional survey with census style recruitment of mother and child pairs that was implemented to assess nutritional status and to inform the design of a community infant and young child feeding nutrition intervention. It also served as a baseline for the evaluation. The overall minimum sample size calculation estimated that 236 children would allow for detecting a mean difference of 0.30 WAZ or HAZ with a standard deviation of 1.00, using a power of 80% (β = 0.20) and confidence of 95% (α = 0.05). This calculation also accounted for clustering in communities and a potential loss to follow‐up.
Participants
Between March and April 2009, all mothers (or primary caregivers) and their infants and young children (under 24 months of age) from 14 communities in the provinces of Chimborazo and Tungurahua were invited to participate in the study and were informed that it would involve a 1‐h interview and having their children measured at the local health centres or community centres. Tungurahua and Chimborazo are among the provinces with the highest rates of stunting in Ecuador (World Bank 2007). Mothers were identified through local birth registries, community census information, midwives and received hand delivered invitations and verbal invitations by community health promoters. On the day before and day of interviews in each general reminders were broadcast over the community megaphone public announcement system. Of a list of 290 mothers, 280 were found. An additional 13 mothers joined after hearing announcements or being referred by a neighbour. Mothers were eligible to participate in the study if they had a child younger than 24 months, without congenital conditions that would affect growth. When a mother had more than one child under the age of two years, both children were assessed for anthropometry and the information was given to the mother, but only one child was randomly selected for inclusion in the study to complete assessment of dietary information and health and nutrition outcomes.
Anthropometry
Children were measured at local health centres by trained anthropometrists (Roche et al. 2015). Length was measured using a wooden reclined stadiometer and recorded with a precision of 0.1 cm (World Health Organization, WHO 1995). All lengths were measured in duplicate with lead researcher measuring all children in addition to one other trained anthropometrist. When duplicate measures differed by more than 0.2 cm, children were re‐measured. Mothers reported the child's age in months as well as the child's birth date. The birth date was confirmed with the child's immunization and growth monitoring card, when possible or otherwise in local birth registries. An exact age in months was calculated using WHO ANTHRO software (WHO, 2006). Sex was also recorded at the time of measurement, so that height‐for‐age z‐scores (HAZ) could be calculated. Overall stunting prevalence was classified as (HAZ < −2). Further classifications of normal (HAZ > −1), mild stunting (−2 ≥ HAZ < −1), moderate stunting (−3 ≥ HAZ < −2) and severe stunting (HAZ < −3) were also used for descriptive purposes (World Health Organization, WHO 1995).
Socio‐demographic and illness questionnaire
A socio‐demographic questionnaire was administered to collect information on maternal age and education, water source, latrine access, housing materials, home ownership, number of children (living and deceased), and electricity source. To estimate the relative socioeconomic status (SES) of families, a composite continuous SES variable was created based on a score, ranging from 3 to 11 points, which included housing materials (wall, roof, and floor), water access, and energy source, as there was variability among these measures. These variables have been identified as related to malnutrition in a previous study with women in Ecuador (Macdonald et al. 2004) and were based on questions and scoring from national level surveys (ENDEMAIN, Encuesta Demográfica y de Salud Materna e Infantil 2004). Altitude was recorded as that of the community where the child resided (INAMHI, Instituto Nacional de Meteorología e Hidrología/Republic of Ecuador National Institute of Hydrology and Weather 2008). Mothers were asked if the child had had any symptoms of an acute respiratory infection (rapid respiration; difficulty breathing; productive cough) or diarrhoea in the past 2 weeks.
Dietary recall data
Mothers completed one single 24‐h dietary recall of what their infant or young child had consumed the previous day. In some cases a grandmother or an aunt was the primary caregiver and completed the questionnaire. The 24‐h recall followed the multiple‐pass method; portion sizes were estimated using local food models, cups and plates, and subsequently converted to gram weight values by project nutritionists (Gibson & Ferguson 1999; Gibson 2005). Nutrient and energy values were calculated using ProPAN software (Pan American Health Organization, PAHO 2004), and nutrient and energy densities of complementary foods were calculated by dividing the estimated nutrient intake per total energy consumed and then converted to nutrient intake per 100 kcal. Energy density was calculated based on total energy consumed divided by total weight of food consumed (kcal/g). As the Ecuadorian food composition table had not been updated at the time of this study (Instituto Nacional de Nutrición, INN 1965), missing or updated nutrient data were obtained from the Peruvian food table (Instituto de Investigación Nutricional, IIN 2004), USDA nutrient database (United States Department of Agriculture, USDA Agricultural Research Service 2010), Mexican food composition tables (Bourges Rodríguez et al. 1996) and the INCAP database (Menchú et al. 2000), as appropriate. The dietary recall also captured the time of day that foods were consumed to calculate the number of meals and snacks (feeding episodes). In order to assess changing diet and respective requirements, most analyses were stratified by age groups in: 6.0–8.9 months, 9.0–11.9 months and 12.0–23.9 months. No analysis was done for children less than six months of age who consumed food or liquids in addition to breast milk, as the optimal nutrition recommendation for this age group is exclusive breastfeeding (Pan American Health Organization/World Health Organization, PAHO/WHO 2003). If a child older than 6 months had not consumed any food on the previous day, values of zero were entered. Iron bioavailability was assumed to be high, based on potential availability of flesh foods, iron rich grains and fortified foods in the local food system assessments. Zinc bioavailability was assumed to be moderate based on potential phytate content (Food and Agriculture Organization/World Health Organization, FAO/WHO 2002).
Infant feeding questionnaire
Additional information on mothers' knowledge, attitudes and practices was collected with respect to the time of initiation of breastfeeding after birth, age of introduction of liquids and foods and duration of continued breastfeeding. Attitudes were explored through questions on intended practices and cultural norms for IYCF practices.
Infant and young child feeding indicators
Early initiation of breastfeeding was assessed based on the infant feeding questionnaire; for infants 0.0–5.9 months of age, exclusive breastfeeding was recorded based on the 24‐h recall (World Health Organization, WHO 2008). The 24‐h dietary recall was also used to assess timely introduction of complementary foods (infants 6.0–8.9 months of age); continued breastfeeding (children 12.0–15.9 months of age); feeding frequency (number of meals and snacks reported) and dietary diversity (World Health Organization, WHO 2008). Diversity was calculated by coding items in the 24‐h recall into the seven specific food groups suggested by WHO (grains, roots, and tubers; legumes and nuts; dairy; flesh foods; eggs; vitamin A‐rich fruits and vegetables; other fruits and vegetables) and calculating the total number of food groups consumed by each infant, which was compared with the age‐specific recommendation as per the child's breastfeeding status (World Health Organization, WHO 2008; World Health Organization, WHO 2010). The minimum acceptable diet was determined by combining both the minimum dietary diversity and meal frequency indicators. A child was considered to have consumed iron‐rich foods if he or she had eaten a flesh food (beef, fish, chicken, guinea pig etc.) or an iron‐fortified infant food, such as mi papilla, a fortified food provided through government programs.
Food frequency questionnaire
A community participatory food system assessment helped to identify 23 foods for the food frequency questionnaire (Kuhnlein et al. 2006). The foods included staple foods, culturally important foods, nutritious local foods and market foods. The food frequency questionnaire determined whether or not the child had ever been fed each item, the age at which the child ate the food for the first time, frequency of consumption within the previous two weeks, cooking preparation and seasonal availability.
Analysis
All statistical analyses were performed with SPSS version 15.0 (SPSS 2006). A one‐sample t‐test was used to compare the mean intakes to the WHO recommended intake levels and densities. Mean differences in intake between breastfed and non‐breastfed children were calculated using independent Student's t‐tests and Fisher's exact two‐sided test was used to examine differences in the infant and young child feeding indicators between age groups. Multiple linear regression analysis was used to identify predictors for nutritional status for height‐for‐age z‐scores. Multiple logistic regression modelling was used to identify risk factors for stunting. For both linear and logistic regression, model selection proceeded from the identification of significant variables (p < 0.05) from univariate analyses and also addition of those suggested as potentially important from a review of the literature. The final model selection included variables that had tightened confidence intervals, plausibility and acceptable variable inflation factors (<10). When two variables were correlated (Pearson correlation coefficient r > 0.25; p < 0.05), the more significant variable was selected. Two‐way interaction terms with gender, SES and maternal education were tested. Statistical significance was considered at p < 0.05. Means are reported with standard deviations in the text and tables.
Ethics
Ethics approvals were obtained from the McGill University Faculty of Medicine Institutional Review Board in Montreal, Canada, and the Ministerio de Salud Pública Área de Nutrición in Quito, Ecuador. Community consent was obtained through written research agreements with community leaders following a community meeting and mothers/primary caregivers gave informed verbal consent for their own participation and also for that of their children.
Results
Study participants
A total of 293 children and their caregivers participated in this study (Table 1). This included 71 infants under six months of age, 80 from 6.0 to 11.9 months, and 142 from 12.0 to 23.9 months of age. Of these, 48% were female; 41% lived in the province of Chimborazo and 59% lived in the province of Tungurahua. Mean maternal age was 27 ± 7 years and ranged from 18 to 46 years. Mothers had a mean of 2.9 ± 2.0 children (ranging from 1 to 10). The number of years of formal schooling ranged from 0 to 12, with a mean of 6 ± 3 years. Missing data were few (<7.5%).
Table 1.
Child and maternal characteristics of 293 infants and young children in 14 communities in the Ecuadorian Andes, March to April, 2009 (N = 293)
| Characteristic | n (%) or mean ± SD |
|---|---|
|
Child age (months) <6 months of age Between 6 and 9 months of age Between 9 and 12 months of age Between 12 and 24 months of age |
11.6 ± 6.7 71 (24) 47(16) 33 (11) 142 (49) |
| Child sex (female) | 141(48) |
| Child height‐for‐age z‐score (HAZ) | −2.18 ± 1.33 |
| Child stunting (HAZ < −2) | 165 (56) |
| Maternal age (years) | 27.4 ± 7.2 |
| Maternal education (years) | 6.3 ± 2.8 |
| Socio‐economic status score* | 5.3 ± 1.7 |
|
Province of residence Chimborazo Tungurahua |
120 (41) 173 (59) |
The socioeconomic status score reflects housing materials (wall, roof, floor), water access and energy source. It ranges from 3 to 11 points.
Anthropometry and health
The growth curve for HAZ is presented in Fig. 1. The overall mean HAZ was −2.14 ± 1.40. For infants under six months, the mean HAZ was −1.44 ± 1.64; for infants 6.0 to 11.9 months of age, it was −1.82 ± 1.37; and for children 12.0 to 23.9 months of age, it was −2.68 ± 1.04. The overall prevalence of stunting was 56.2%, made up of 29.3% who were classified as moderately stunted and 26.9% were classified as severely stunted. The remaining 23.8% of children were classified as mildly stunted and 20.1% were in the normal range. There were sex differences in stunting with a prevalence for boys of 63% and 49% for girls (p = 0.014). Thirty‐nine percent of mothers reported that their child had suffered symptoms of acute respiratory infection and 21.3% diarrhoea in the previous two weeks (Tables 2, 3).
Figure 1.
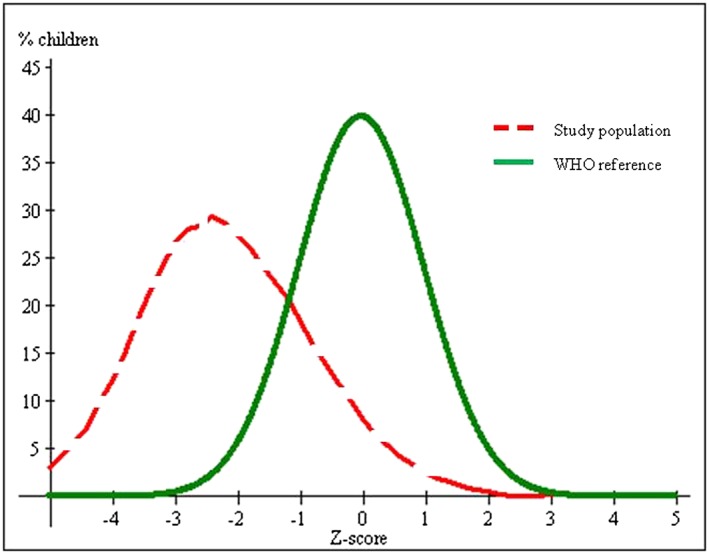
Height‐for‐age z‐score distribution for infants and young children (n = 293) in the Ecuadorian highlands compared with the standard curve.
Table 2.
Infant and young child feeding (IYCF) practices in 14 communities in the Ecuadorian Andes, using the WHO IYCF indicatorsa
| IYCF indicator | n | % meeting indicator | Definition of indicator |
|---|---|---|---|
| 1. Early initiation of breastfeeding | 271 | 41.3% | % of children born within the last 24 months who were put to breast within 1 h of birth |
| 2. Exclusive breastfeeding | 71 | 79.5% | % of infants between 0 and 6 months of age, fed exclusively with breast milk |
| 3. Continued breastfeeding at 1 year | 50 | 94.0% | % of children between 12 and 15 months of age, fed breast milk |
| 4. Introduction of solid, semi‐solid foods or s oft foods | 47 | 74.5% | % of infants between 6 and 9 months of age who received solid, semi‐solid or soft foods |
| 5. Minimum dietary diversity | 200 | 77.7% | % of children between 6 and 24 months of age who received foods from ≥4 food groups (see food groups in Table 3) |
| 6. Minimum meal frequency | 200 | 86.4% | % of breastfed and non‐breastfed children between 6 and 24 months of age who received solid, semi‐solid or soft foods the minimum number of times or more* |
| 7. Minimum acceptable diet | 200 | 71.4% | % of children between 6 and 24 months of age who received minimum acceptable diet (apart from breast milk)** |
| 8. Consumption of iron‐rich or iron‐fortified foods | 200 | 57.8% | % of children between 6 and 24 months of age who received an iron‐rich food or iron‐fortified food that was especially designed for infants and young children, or was fortified at home |
(World Health Organization, WHO 2008).
Minimum number of frequency of feeding is two feeding episodes for breastfed infants between 6 and 9 months of age, three feeding episodes for breastfed children between 9 and 24 months of age and four feeding episodes for non‐breastfed children between 6 and 24 months of age.
These are the children who had both adequate diversity and meal frequency.
Table 3.
Consumption of food groups by 200 infants and young children between 6 and 24 months of age, in 14 communities in the Ecuadorian Andes, using the 24‐h recall method, n (%)
| Food groups | |||||||
|---|---|---|---|---|---|---|---|
| Grains roots and tubers | Legumes and nuts | Dairy | Flesh food | Eggs | Vitamin A‐rich fruits and vegetables | Other fruits and vegetables | |
| Children consuming food group | 198(99) | 100(50) | 107(54) | 102(51) | 48(24) | 152(76) | 183(92) |
Dietary recalls
Mean nutrient intakes suggested that protein intakes were adequate for breastfed and non‐breastfed children (Table 4). There were two children 6.0–8.9 months of age and two children 9.0–11.9 months of age who were not consuming breast milk. Because of small sample sizes, analyses for these groups were not done. Mean vitamin A intakes were above the recommendations for all breastfed children; however, intakes fell short for non‐breastfed children in the 12.0–23.9 months age group. The diet was above the vitamin C recommendation for all age groups for breastfed and non‐breasted children. The only group to have a mean calcium intake above the recommendation was the 12.0–23.9 month breastfed children. All groups had iron intakes below the recommendation, with the exception of the 12.0–23.9 month‐old breastfed children. Infants 6.0–8.9 months of age were the only group that had mean intakes below the recommended levels for zinc. For the breastfed children, the mean energy intake was significantly below the recommendation for children 6.9–8.9 months of age, while those 9.0–11.9 months and 12.0–23.9 months of age had intakes that suggested adequate energy intake. Non‐breastfed children had mean energy intakes significantly below the recommendations.
Table 4.
Protein, nutrient and energy intake from complementary foods of breastfed children between 6 and 24 months of age, and non‐breastfed children 12 to 24 months of age, in 14 communities in the Ecuadorian Andes, in comparison with recommendations (based on the 24‐h recall method)
| Age | 6.0–8.9 months breastfed | 9.0–11.9 months breastfed | 12.0–23.9 months breastfed | 12.0–23.9 months non‐breastfed | ||||
|---|---|---|---|---|---|---|---|---|
| n =34 mean ± SD | WHOa | n = 25 mean ± SD | WHOa | n = 93 mean ± SD | WHOa | n = 44 mean ± SD | WHOa | |
| Protein (g/day) | 8.7 ± 8.8e ** | 2.0 | 18.4 ± 13.1e ** | 3.1 | 29.5 ± 18.0e ** | 5.0 | 30.2 ± 17.7e ** | 10.9 |
| Vitamin A (µg RE/day) | 130 ± 126e ** | 13 | 232 ± 223e ** | 42 | 297 ± 185e ** | 126 | 274 ± 175g ** | 400 |
| Vitamin C (mg/day) | 20.0 ± 29.7e ** | 0 | 32.1 ± 39.2e ** | 0 | 49.8 ± 32.2e ** | 8.0 | 60 ± 37e ** | 30 |
| Calcium (mg/day) | 74 ± 108g ** | 336 | 96 ± 73g ** | 353 | 223 ± 174f | 196 | 233 ± 243g ** | 500 |
| Ironc (mg/day) | 1.2 ± 0.9g ** | 6.8 | 2.2 ± 1.3g ** | 6.8 | 3.8 ± 2.0f | 3.8 | 3.8 ± 1.7g ** | 5.8 |
| Zincd (mg/day) | 1.2 ± 1.1g ** | 2.2 | 2.3 ± 1.6f | 2.3 | 4.0 ± 2.4e ** | 2.4 | 3.8 ± 2.3f | 4.1 |
| Energyb (kcal/day) | 227 ± 238g ** | 356 | 482 ± 335f | 479 | 886 ± 534e * | 772 | 913 ± 512g * | 1118 |
Protein, vitamin and mineral requirements (Food and Agriculture Organization/World Health Organization, FAO/WHO 2002).
Total energy requirement + 2 standard deviations − breast milk energy (Dewey & Brown 2003).
Assumes high bioavailability.
Based on moderate bioavailability (Food and Agriculture Organization/World Health Organization, FAO/WHO 2002); using one‐sample t‐test.
Mean intake above recommendation (*p < 0.05;**p < 0.01).
Mean intake not significantly different from recommendation(p > 0.05).
Mean intake significantly lower than recommendation (*p < 0.05;**p < 0.01).
Nutrient and energy of complementary foods
Protein, vitamin A and vitamin C densities were above the recommended densities for complementary foods for all age groups, while mean calcium, iron and zinc densities were below the recommendation for all age groups. Energy densities were not significantly different from recommended densities for infants 6.0–8.9 months and 9.0–11.9 months of age, but were higher for children 12.0–23.9 months of age (Table 5). Those no longer receiving breast milk tended to have lower densities for calcium (p = 0.09). There was no difference in energy density from foods between breastfed and non‐breastfed children 12.0–23.9 months (p = 0.53).
Table 5.
Protein, nutrient and energy densities of complementary foods of children between 6 and 24 months of age, in 14 communities in the Ecuadorian Andes, in comparison with recommended values (based on the 24‐h recall method)
| Age | 6.0–8.9 months | 9.0–11.9 months | 12.0–23.9 months | |||
|---|---|---|---|---|---|---|
| n = 36 mean ± SD | WHOa | n = 27 mean ± SD | WHOa | n = 137 mean ± SD | WHOa | |
| Protein (g/100 kcal) | 4.1 ± 1.4e ** | 1.0 | 3.8 ± 1.0e ** | 1.0 | 3.4 ± 0.8e ** | 0.9 |
| Vitamin A (µg RE/100 kcal) | 88 ± 93e * | 31 | 61 ± 66e * | 30 | 39 ± 27e ** | 23 |
| Vitamin C (mg/100 kcal) | 10.1 ± 11.8e ** | 1.5 | 6.5 ± 5.5e ** | 1.7 | 6.8 ± 4.3e ** | 1.5 |
| Calcium (mg/100 kcal) | 32 ± 33g ** | 105 | 25 ± 18g ** | 74 | 27 ± 20g ** | 63 |
| Ironb (mg/100 kcal) | 0.6 ± 0.3g ** | 4.5 | 0.5 ± 0.1g ** | 3.0 | 0.5 ± 0.2g ** | 1.0 |
| Zinc (mg/100 kcal) | 0.5 ± 0.2g ** | 1.6 | 0.5 ± 0.1g ** | 1.1 | 0.4 ± 0.1g ** | 0.6 |
| Energy (kcal/g) | 0.78 ± 0.44f | 0.71c | 0.94 ± 0.30f | 0.84c | 1.02 ± 0.31e ** | 0.75d |
Protein, vitamin and mineral density recommendation based on average breast milk intake (Food and Agriculture Organization/World Health Organization, FAO/WHO 2002).
Assumes high bioavailability.
Recommendation based on two meals and average breast milk intake (Dewey & Brown 2003).
Based on three meals a day and average breast milk intake (Dewey & Brown 2003); using one‐sample t‐test.
Mean density above recommendation (*p < 0.05;**p < 0.01).
Mean density not significantly different from recommendation (p > 0.05).
Mean density significantly lower than recommended (*p < 0.05;**p < 0.01).
Food frequency questionnaire
The most commonly consumed foods were banana, chicken, carrot, potato, beef, rice and cookies/crackers (Table 6). The most common preparations were cauca (warm corn flour beverage), machica (warm roasted barley flour beverage) and soup. The first items introduced were soup, cauca, machica, banana, papaya and carrot. Foods which were generally introduced later included guinea pig, tuna (canned), rice, cheese, habas/large fava beans (Vicia faba), chocho/lupin seeds (Lupinus mutabilis) and beans. Of animal‐source foods, eggs were the most frequently consumed and the earliest introduced. The most frequently consumed and first meats introduced were chicken and beef, followed by canned tuna, while guinea pig and liver (chicken and beef) were less frequently and less commonly consumed. Carrot was the most frequently consumed vegetable; while blackberry (Rubus spp.) was the only locally grown fruit consumed regularly. The mothers explained that most meats, vegetables, legumes, grains and tubers were generally boiled or included in soup. Fruits were often eaten raw or prepared as a juice. Canned tuna was generally eaten cold in a salad. Foods that were prepared by some mothers in a puree, specifically for the child, included: potato, habas, chocho, beans, cookies, broccoli, carrot, banana, papaya, guinea pig, beef and liver.
Table 6.
Average age of introduction and frequency of consumption of foods for infants and young children between 6 and 24 months of age, in 14 communities in the Ecuadorian Andes
| Food | n | Age of introduction mean ± SD* months | Frequency mean ± SD times/week | Most common preparation |
|---|---|---|---|---|
| Potato | 160 | 8.9 ± 3.0 | 5.3 ± 2.1 | 60% boiled, 20% puree, 18% soup |
| Rice | 153 | 9.8 ± 3.2 | 3.8 ± 2.1 | 95% boiled, 4% soup |
| Quinoa | 128 | 9.0 ± 3.6 | 2.2 ± 1.6 | 36% boiled, 58% soup, 7% colada (warm beverage) |
| Soup broth | 192 | 7.3 ± 2.6 | 6.3 ± 1.6 | 100% (boiled) |
| Machica (warm barley‐flour beverage) | 168 | 8.2 ± 3.3 | 3.9 ± 2.4 | 68% colada, 25% boiled |
| Cauca (warm corn‐flour beverage) | 170 | 8.2 ± 2.7 | 2.5 ± 1.7 | 67% soup, 32% colada |
| Habas (large fava beans) | 132 | 10.0 ± 3.3 | 1.9 ± 1.5 | 69% boiled, 21% soup, 7% puree |
| Chocho (lupin seeds) | 75 | 11.6 ± 3.9 | 1.5 ± 1.0 | 59% boiled, 18% cold, 12% salad, 5% soup, |
| Beans (various kinds) | 66 | 11.1 ± 3.9 | 1.5 ± 1.0 | 69% boiled, 16% soup, 9% salad, 5% puree |
| Nettle | 46 | 9.1 ± 3.6 | 1.8 ± 1.5 | 28% boiled, 45% soup, 13% juice, 7% salad |
| Carrot | 165 | 8.4 ± 3.1 | 5.1 ± 2.4 | 46% soup, 40% boiled, 5% juice, 4% puree |
| Banana | 180 | 8.2 ± 2.9 | 3.6 ± 2.3 | 57% raw, 18% puree, 12%boiled, 12% juice |
| Papaya | 144 | 8.3 ± 3.1 | 2.2 ± 1.6 | 57% raw, 37% juice, 6% puree |
| Blackberry | 146 | 9.0 ± 3.4 | 2.0 ± 1.5 | 77% juice, 20% raw |
| Cheese | 109 | 9.8 ± 3.3 | 1.6 ± 1.1 | 50% raw,37% soup, 11% boiled |
| Egg | 149 | 8.7 ± 3.1 | 2.8 ± 2.0 | 93% boiled, 6% fried |
| Guinea pig | 139 | 9.6 ± 3.8 | 0.8 ± 0.6 | 55% boiled, 21% soup, 20% roasted, 3%puree |
| Chicken | 171 | 9.0 ± 3.6 | 1.8 ± 1.2 | 55% boiled, 37% soup, 5% fried |
| Beef | 159 | 9.2 ± 3.3 | 1.7 ± 1.3 | 52% boiled, 33% soup, 10% fried, 3% puree |
| Liver (chicken and beef) | 58 | 9.2 ± 3.7 | 1.2 ± 0.6 | 53% boiled, 27% soup, 15% fried, 3% puree |
| Tuna (canned) | 134 | 9.7 ± 3.5 | 1.3 ± 0.7 | 67% salad, 23% plain |
| Cookies/crackers | 152 | 8.7 ± 3.3 | 2.0 ± 1.7 | 88% plain, 10% puree |
Mean age of introduction is for only those children who consumed that item, as shown by the sample size (n) for that item.
Breastfeeding practices
Forty (14.8%) of the 271 infants and young children with complete dietary recalls were no longer receiving breast milk. For these 40 children, the mean reported age for cessation of breastfeeding was 14.6 ± 5.0 months. The age of introducing other liquids started as early as 1 day after birth, with a mean age of 6.1 ± 3.0 months. The other 231 mothers were still breastfeeding at the time of the interview and reported an intention to continue breastfeeding until 19.4 ± 4.9 months of age (range 6 to 36 months).
Infant and young child feeding indicators
Mothers, on average, reported initiating breastfeeding 7 ± 14 h after birth. Some mothers reported breastfeeding within minutes of the birth while other mothers did not breastfeed until 3 days; only 41.3% of mothers breastfed within the first hour after birth (Table 2). Exclusive breastfeeding was 79.5% as reported by 24‐h recalls; however, the mean age of those consuming other foods was 4.6 ± 0.5 months, in comparison with a mean age of 2.9 ± 1.7 months among the exclusively breastfed, suggesting complementary foods are commonly introduced before the recommended age of 6 months.
The continued breastfeeding among children 12.0 to 15.9 months of age was high at 94.0%. Among children 6.0 to 8.9 months of age, 74.5% were receiving complementary foods (semi‐solid or solid). When comparing infants 6.0 to 11.9 months of age with those 12.0 to 23.9 months of age, a higher proportion of the older children was found to have met their age‐specific dietary diversity (89%), compared with the younger group (54%) (p < 0.001). Feeding frequency was considered adequate for 86.4% of all children, with no significant differences among age groups (p = 0.270). In considering a combined indicator of frequency and diversity, 71.4% of children were found to have met a minimum acceptable diet; however, there were significant differences among age groups (p ≤ 0.01; Tables 2 and 3). There was 50% adequacy in infants 6.0 to 11.9 months of age and 81% in children 12.0 to 23.9 months of age. Of the 55.8% of infants and young children who consumed iron‐rich foods the previous day, 2.5% consumed an iron‐fortified product, 49.7% consumed a flesh food and 3.6% consumed both types (Table 2).
Influences on nutritional status as measured by height‐for‐age z‐score (HAZ)
Having a respiratory infection, increasing age, a lower SES, living at a higher altitude, and if the mother had lower education were all predictors of having lower HAZ (Table 7a). Additionally, for children older than six months of age, dietary protein density and consumption of an iron‐rich food were also predictors of higher HAZ. As these two dietary variables were correlated (r = 0.289; p < 0.001), only consumption of an iron‐rich food was included in the multivariate model as it allowed for modelling one of the WHO IYCF indicators (Table 7b).
Table 7.
Predictors of height‐for‐age z‐scores in infants and young children between 6 and 24 months of age, in 14 communities in the Ecuadorian Andes
| Variables | β (95 %CI) | p |
|---|---|---|
| 7a. Infants and young children 0–24 months (n = 276) | ||
| Child age (months) | −0.08 (−0.10, −0.06) | <0.001 |
| Child respiratory infection (yes) | −0.36 (−0.65, −0.06) | <0.01 |
| Child sex (female) | 0.25 (−0.03, 0.53) | 0.07 |
| SES status (composite score)** | 0.23 (0.02, 0.45) | <0.05 |
| Maternal education (years) | 0.06 (0.01, 0.11) | <0.05 |
| Altitude (100 m above sea level) | −0.04 (−0.08, −0.01) | <0.05 |
| 7b. Infants and young children 6–24 months (n = 186) | ||
| Child age (months) | −0.08 (−0.11, −0.05) | <0.001 |
| Child respiratory infection (yes) | −0.39 (−0.73, −0.04) | <0.05 |
| Child sex (female) | 0.30 (−0.02, 0.62) | 0.07 |
| SES status (composite score)* | 0.15 (−0.09, 0.40) | 0.24 |
| Maternal education (years) | 0.10 (0.04, 0.16) | <0.01 |
| Child consumption of iron‐rich food (yes) | 0.33 (0.01, 0.66) | <0.05 |
| Altitude (100 m above sea level) | −0.04 (−0.08, 0.00) | 0.06 |
The socioeconomic status score reflects housing materials (wall, roof, floor), water access and energy source; it ranges from 3 to 11 points.
Risk factors for stunting
The risk factors for stunting are presented in Table 8. Children were more likely to be stunted as they grew older, if they were male, in families with lower SES, had more siblings and lower maternal education. Interaction terms were not significant.
Table 8.
Predictors of stunting* in 271 infants and young children between 6 and 24 months of age, in two Ecuadorian Andean provinces
| Variables | OR (95 %CI) | p |
|---|---|---|
| Child age (months) | 1.13 (1.08, 1.18) | <0.001 |
| Child sex (female) | 0.66 (0.38, 1.14) | 0.14 |
| Socioeconomic status (composite score)** | 0.69 (0.45, 1.05) | 0.09 |
| Maternal education (years) | 0.93 (0.84, 1.03) | 0.15 |
| Early Initiation of breastfeedinga (yes) | 0.58 (0.33, 0.99) | <0.05 |
| Altitude (100 m above sea level) | 1.09 (1.01, 1.18) | <0.05 |
Early initiation of breastfeeding was defined as reported breastfeeding within 1 h after birth.
Stunting defined by height for age z‐score < −2.
The socioeconomic status score reflects housing materials (wall, roof, floor), water access and energy source; ranging from 3 to 11 points.
Discussion
The high rates of stunting (56%) found among infants and young children in these rural highland communities in Ecuador are much higher than those documented in the rural (37%) and urban (17%) highland province of Azuay (Ortiz et al. 2014) and confirm concern for early‐onset chronic undernutrition. Higher SES at the household level was protective of nutritional status and decreased the risk of stunting, a trend reported in Ecuador (Ortiz et al. 2014) and globally (Frongillo et al. 1997). Although the data were not collected in our study, facility based delivery was protective of stunting while preterm delivery is a risk factor in rural Ecuador (Ortiz et al. 2014), highlighting the importance of antenatal care in stunting prevention.
We found stunting to disproportionately affect male children in rural Chimborazo and Tungurahua, as reported in rural Azuay province of Ecuador (Ortiz et al. 2014). Ecuador national surveys have reported slightly higher rates of stunting among boys (ENDEMAIN, Encuesta Demográfica y de Salud Materna e Infantil 2004). Gender differences in stunting have been documented in other contexts: in sub‐Saharan Africa boys are at greater risk (Wamani et al. 2007); whereas in Asia females have been reported to be at greater risk of stunting (Khatun et al. 2004). Understanding the implications for interventions would involve understanding gender differences in feeding, caring and health seeking practices.
In our study stunting increased with age and was highest among children 12–23.9 months of age. The pattern of stunting increasing with age during infancy and early childhood has been documented in Ecuador (Ortiz et al. 2014) and other developing countries (Shrimpton et al. 2001; Victora et al. 2010). The increased stunting in this older group was contrasted with improved dietary intake. The stunting we found in the infants from 1 to 2 years of age in these communities is likely in part the result of inadequate complementary feeding practices in the early months of complementary feeding and frequent infections. Dietary data suggested that children 6.0–8.9 months of age were not able to meet energy or mineral requirements. There were still gaps for nutrient intakes in infants 9.0–11.9 months, but after one year, more breastfed children meet the requirements, partially as diet improved, but also as some nutrient requirements decrease at this stage. It is possible that we underestimated requirements as the dietary requirements for our population. The recommendations that we used in assessment were designed for healthy children (Dewey & Brown 2003), whereas the children in our study had a high rate of illness and may have had higher needs. Repeat recalls were not done with a subset of the caregivers; however the food frequency questionnaires gave additional insight into the habitual dietary practices. With an intention to look at the group level dietary intakes a single recall was acceptable (Gibson 2005). A limitation to the study is that we do not have individual usual intake data validated by repeat recalls, but rather population level data.
We calculated nutrient requirements from complementary foods using an assumption of average breast milk consumption; thus it is possible that some children had higher intake of breast milk than estimated and lower requirements from complementary foods for some of the nutrients or vice versa. Interestingly, when mothers stopped breastfeeding, they did not seem to adjust their child's diets, as their nutrient intakes were similar to those from only the complementary foods of children who continued to receive breast milk. A study in Western Kenya reported similar dietary trends among toddlers (Onyango et al. 2002). The benefits of continued breastfeeding on growth are not directly observed in many settings, as mothers of malnourished and ill children may intentionally choose to continue breastfeeding their toddlers in response to other interferences with growth (Marquis et al. 1997b). Enabling and encouraging continued breastfeeding in the rural highlands of Ecuador would be beneficial.
Vitamin, protein and energy densities of the complementary foods were acceptable, although diets were of low mineral content. Of the available animal source foods found in the community food system assessment, very few were consumed regularly by infants. Iron intakes were low, especially when complementary foods were introduced and consumption of fortified foods was uncommon. The high vitamin C content of the diet may have enhanced absorption of non‐heme iron; however, it is also possible that we even underestimated iron requirements by using an assumption of high‐bioavailability.
Both calcium and vitamin D have an integral role in bone development. Low vitamin D along with low calcium intakes could have negative implications for linear growth (Holick & Chen 2008). Vitamin D consumption was not assessed, yet endogenous production from sun exposure would be the main source. Despite living close to the Equator and at high altitude (optimal conditions for sun exposure) (Holick 1995; Engelsen et al. 2005), infants were highly clothed for the cold climate (Roche et al. 2015) and often swaddled on their mothers' backs and may not have had sufficient sun exposure for adequate endogenous production of Vitamin D. In considering other environmental factors, altitude has been shown to negatively impact linear growth in Andean children, although the mechanisms and magnitude of impact are not clear, potentially through hypoxia and cold (Greksa 2006). Here it is probable that other socio‐economic factors, such as lack of access to maternal education, poor sanitation and housing, and inadequate infant and young child feeding practices are more influential contributors of stunting.
Applying the WHO IYCF indicators, we were able to identify local positive practices in IYCF as well as areas where additional support was needed; however, some indicators did not capture the gaps identified with the detailed analysis of 24‐h recalls or infant feeding FFQ. Most mothers exclusively breastfed, although not necessarily to six months. This practice should be a priority for intervention given the implications for growth and survival (Jones et al. 2003). Continued breastfeeding at one year was commonly practiced and should be protected. Most mothers were introducing semi‐solid foods at six months, but one quarter of infants 6–8.9 months of age were not yet receiving any complementary foods. Infants and young children older than nine months of age had adequate feeding frequency and dietary diversity; however, both diversity and frequency were more problematic for infants 6–8.9 months of age in the time period when complementary feeding are first introduced. Feeding frequency is intended to be a proxy for energy intake, while dietary diversity represents diet quality and nutrient adequacy (World Health Organization, WHO 2008). The low feeding frequency was reflective of energy intakes for this study, yet we found nutrient inadequacies in all age groups when the minimum dietary adequacy indicator was met.
Early initiation of breastfeeding and consumption of iron‐rich foods were less commonly practiced. Because these were also found to be protective of stunting, it highlights an area for health promotion and intervention. Early initiation of breastfeeding has also been suggested to contribute to decreased neonatal mortality (Edmond et al. 2006), and decreased morbidity (Clemens et al. 1999). Consumption of iron‐rich foods plays a key role in diet quality, and although not clearly understood, might impact linear growth (Allen 1994; Soliman et al. 2009). As increased consumption of iron‐rich foods would also potentially reduce the risk of iron deficiency anaemia (Guldan et al. 2000), efforts to reduce anaemia and limit potential cognitive deficits (Lozoff & Georgieff 2006) should be prioritized.
The local food system offers biodiversity with animal source foods, fruits, vegetables, dairy, legumes, tubers and grains; yet not all households include these in infant diets. Food‐based approaches could focus on improving dietary diversity (Arimond & Ruel 2004), which is most needed for infants 6–11.9 months in these communities, and increasing animal‐sourced foods for all children 6–24 months of age (Marquis et al. 1997a). Complementary feeding interventions can promote locally accepted preparations of purées and thick beverages within the communities, and also improve upon recipes by adding other available nutritious local foods such as quinoa, blackberries, liver, chicken, eggs, and legumes.
A child fails to achieve optimal growth not only as a result of inadequate diet, but also because of chronic and acute infections (Martorell et al. 1975; Rowland et al. 1977; Becker et al. 1991). In this study we did not have detailed morbidity data; however, we found respiratory infection to be a predictor of lower HAZ, as has been reported previously (Cunha 2000), and often associated with underweight (Ricci & Becker 1996; Bloss et al. 2004). Although not statistically significant in our study diarrhoea has been associated with increased stunting in other rural highland communities (Ortiz et al. 2014). Improving nutritional status will be accelerated by interventions that focus on improving diet and reducing infections.
Among experts, there is an expressed opinion that children's nutrition in Ecuador has not improved in parallel with the improved economic situation in the country (World Bank 2007). Programs such as Integrated Management of Childhood Illness, which offers key messages in infant and young child feeding, hygiene, and care during illness, have attempted to reduce undernutrition in Ecuador, yet have received less promotion and investment in recent years (World Bank 2007). A targeted infant and young child feeding initiative, conducted by the Ecuador Ministerio de Salud Pública offered an iron‐fortified product (mi papilla) and training of health workers on infant and young child feeding and counselling for mothers (Lutter et al. 2008). In an evaluation of PANN, in a coastal area of the province of Pichincha, results showed intervention children had improved diet, less anaemia, and less risk of underweight (Lutter et al. 2008), but in some regions use and coverage were low because of the required medical visits and challenges for mothers to access these health visits (Lutter et al. 2005). Key program models from other settings may provide examples of targeted infant and young child feeding interventions (Caulfield et al. 1999; Dewey & Adu‐Afarwuah 2008). Nutrition education with infant feeding messages for health care staff improved child growth and diet in Peru (Penny et al. 2005), while nutrition education with mothers delivered through home visits showed benefits for child growth in India (Bhandari et al. 2004). Lessons learned from these approaches can guide development of programs for the rural highlands of Ecuador, with consideration for available health systems, current practices, and culture. Food‐based approaches which increase the use and availability of nutritious local foods may be especially appropriate for Indigenous populations as they have important ties to the land and cultural value given to the foods (Kuhnlein & Receveur 1996). Identifying which local foods warrant promotion can be explored through assessing the strengths of the local food system using both local knowledge and nutrient composition data (Kuhnlein et al. 2006).
To the best of our knowledge, this study is one of few studies to look at the dietary intake, and infant and young child feeding practices in the Ecuadorian highlands. Poverty, low maternal access to education, poor hygiene and sanitation are likely among other multiple underlying risk factors that have contributed to growth failure in indigenous highlands communities (Ortiz et al. 2014). We found poverty and low maternal education to be risks for stunting that need to be addressed as part of long term solutions. With variability in feeding practices and use of local foods, infants and young children in these highlands communities would benefit from immediate community level nutrition and health interventions. Nutrition interventions in the highlands could prioritize access and use of animal‐source food and also leverage the use of available nutritious local legumes, fruits and vegetables to improve the micronutrient content of complementary foods. Increasing exclusive breastfeeding until six months of age warrants promotion, especially with the potential benefits in preventing infections. Mothers should be encouraged in their positive practice of continued breastfeeding. Timely introduction of complementary foods and access to iron‐rich foods may need urgent attention. Healthy growth will require improved access and use of health services and improved hygiene to reduce the burden of illness. Urgent action is needed to improve child nutrition and growth in these highland communities, with opportunity for intervention from birth to two years of age.
Conflicts of interest
The authors declare that they have no conflicts of interest.
Contributions
MLR was the PI for the study, led the data collection, analyzed the data and drafted the manuscript. HVK was co‐PI for the study and contributed to the design of the study and interpretation of results. JS contributed to the conceptualization and design of the study and interpretation of the results. TWG and BB contributed to design of the study and provided expertise in statistical analyses and interpretation and writing of the manuscript. GSM contributed to the design of the study and interpretation of the results. All authors provided critical revisions to the manuscript and approved the final version of the manuscript.
Acknowledgements
We sincerely thank Lorena Ambato and Angelica Solis for study coordination with the Area Development Program staff of UNOCANT and UOCIC. The field interviewers were instrumental in data collection, and we are grateful for their contributions. We extend thanks to Rocio Caicedo Borrás and the team at FUNBASIC for their excellent work with the dietary recall data. We extend our appreciation to the mothers who participated in the study and gave their time and energy. Funding for the research was provided by International Development Research Center (IDRC) and Canadian Institutes for Health Research (CIHR) through doctoral research awards.
Roche, M. L. , Gyorkos, T. W. , Blouin, B. , Marquis, G. S. , Sarsoza, J. , and Kuhnlein, H. V. (2017) Infant and young child feeding practices and stunting in two highland provinces in Ecuador. Maternal & Child Nutrition, 13: e12324. doi: 10.1111/mcn.12324.
References
- Allen L.H. (1994) Nutritional influences on linear growth: a general review. European Journal of Clinical Nutrition 48, S75–S89. [PubMed] [Google Scholar]
- Arimond M. & Ruel M.T. (2004) Dietary diversity is associated with child nutritional status: evidence from 11 demographic health surveys. Journal of Nutrition 134, 2579–2585. [DOI] [PubMed] [Google Scholar]
- Becker S., Black R.E. & Brown K.H. (1991) Relative effects of diarrhea, fever, and dietary energy intake on weight gain in rural Bangladeshi children. American Journal of Clinical Nutrition 53, 1499–1503. [DOI] [PubMed] [Google Scholar]
- Bhandari N., Mazumder S., Bahl R., Martines J., Black R.E. & Bhan M.K. (2004) An educational intervention to promote appropriate complementary feeding practices and physical growth in infants and young children in rural Haryana, India. Journal of Nutrition 134, 2342–2348. [DOI] [PubMed] [Google Scholar]
- Black R.E., Allen L.H., Bhutta Z.A., Caulfield L.E., De Onis M., Ezzati M. et al. (2008) Maternal and child undernutrition: global and regional exposures and health consequences. Lancet 371, 243–260. [DOI] [PubMed] [Google Scholar]
- Bloss E., Wainaina F. & Bailey R.C. (2004) Prevalence and predictors of underweight, stunting, and wasting among children aged 5 and under in Western Kenya. Journal of Tropical Pediatrics 50, 260–270. [DOI] [PubMed] [Google Scholar]
- Bourges Rodríguez H., Morales de León J., Camacho Parra M.E. & Escobedo O.G. (1996) Tablas de Composicion de Alimentos: Edición de Aniversario 50th, Subdirección de Nutrición Experimental y Ciencia de los Alimentos. México D.F: Instituto Nacional de la Nutrición Salvador Zubirán. [Google Scholar]
- Brown K.H., Dewey K.G. & Allen L.H. (1998) Complementary Feeding of Young Children in Developing Countries: A Review of Current Scientific Knowledge. World Health Organization: Geneva. [Google Scholar]
- Caulfield L.E., Huffman S.L. & Piwoz E.G. (1999) Interventions to improve the complementary food intakes of 6 to 12 months of age in developing countries: impact on growth and on the prevalence of malnutrition and potential contribution to child survival. Food and Nutrition Bulletin 20, 183–200. [Google Scholar]
- Clemens J., Elyazeed R.A., Rao M., Savarino S., Morsy B.Z., Kim Y. et al. (1999) Early initiation of breastfeeding and risk of infant diarrhea in rural Egypt. Pediatrics 104, e3. [DOI] [PubMed] [Google Scholar]
- Cunha A. (2000) Relationship between acute respiratory infection and malnutrition in children under 5 years of age. Acta Paediatrica 89, 608–609. [DOI] [PubMed] [Google Scholar]
- Dewey K.G. & Adu‐Afarwuah S. (2008) Systematic review of the efficacy and effectiveness of complementary feeding interventions in developing countries. Maternal &Child Nutrition 4, 24–85. [DOI] [PMC free article] [PubMed] [Google Scholar]
- Dewey K.G. & Brown K.H. (2003) Update on technical issues concerning complementary feeding of young children in developing countries and implications for intervention programs. Food and Nutrition Bulletin 24, 15–28. [DOI] [PubMed] [Google Scholar]
- Edmond K.M., Zandoh C., Quigley M.A., Amengo‐Etego S., Owusu‐Agyei S. & Kirkwood B.R. (2006) Delayed breastfeeding initiation increases risk of neonatal mortality. Pediatrics 117, e380–e386. [DOI] [PubMed] [Google Scholar]
- ENDEMAIN (Encuesta Demográfica y de Salud Materna e Infantil) (2004) http://www.cepar.org.ec/endemain_04/nuevo05/indice.htm [accessed online July 2010]
- Engelsen O., Brustad M., Aksnes L. & Lund E. (2005) Daily duration of vitamin D synthesis in human skin with relation to latitude, total ozone, altitude, ground cover, aerosols and cloud thickness. Photochemistry and Photobiology 81, 1287–1290. [DOI] [PubMed] [Google Scholar]
- Food and Agriculture Organization/World Health Organization (FAO/WHO) (2002) Human Vitamin and Mineral Requirements: Report of a Joint FAO/WHO Expert Consultation Bangkok, Thailand. Rome: Food and Nutrition Division, FAO. [Google Scholar]
- Frongillo E.A. Jr., de Onis M. & Hanson M.P. (1997) Socioeconomic and demographic factors are associated with worldwide patterns of stunting and wasting in children. Journal of Nutrition 127, 2302–2309. [DOI] [PubMed] [Google Scholar]
- Gibson R. (2005) Principles of Nutritional Assessment, 2nd edn. New York: Oxford University Press. [Google Scholar]
- Gibson R.S. & Ferguson E.L. (1999) An interactive 24‐Hour Recall for Assessing the Adequacy of Iron and Zinc Intakes in Developing Countries. International Life Sciences Press: Washington DC. [Google Scholar]
- Greksa L.P. (2006) Growth and development of Andean high altitude residents. High Altitude Medicine & Biology 7, 116–124. [DOI] [PubMed] [Google Scholar]
- Guldan G.S., Fan H.C., Ma X., Ni Z.Z., Xiang X. & Tang M.Z. (2000) Culturally appropriate nutrition education improves infant feeding and growth in rural Sichuan, China. Journal of Nutrition 42, 306–312. [DOI] [PubMed] [Google Scholar]
- Hoddinott J., Maluccio J.A., Behrman J.R., Flores R. & Martorell R. (2008) Effect of a nutrition intervention during early childhood on economic productivity in Guatemalan adults. Lancet 371, 411–416. [DOI] [PubMed] [Google Scholar]
- Holick M.F. (1995) Environmental factors that influence the cutaneous production of vitamin D. American Journal of Clinical Nutrition 61, 638S–645S. [DOI] [PubMed] [Google Scholar]
- Holick M.F. & Chen T.C. (2008) Vitamin D deficiency: a worldwide problem with health consequences. American Journal of Clinical Nutrition 87, 1080S–1086S. [DOI] [PubMed] [Google Scholar]
- INAMHI (Instituto Nacional de Meteorología e Hidrología/Republic of Ecuador National Institute of Hydrology and Weather) (2008) Annuario Meteorologico. Quito: INAMHI. [Google Scholar]
- Instituto de Investigación Nutricional (IIN) (2004) Tabla de Composición de Alimentos. IIN: Lima: [Google Scholar]
- Instituto Nacional de Nutrición (INN) (1965) Tabla de Composición de los Alimentos Ecuatorianos. Ministerio de Previsión Social y Sanidad: Quito. [Google Scholar]
- Jones G., Steketee R.W., Black R.E., Bhutta Z.A., Morris S.S. & the Bellagio Child Survival Study Group (2003) How many child deaths can we prevent this year? Lancet 362, 65–71. [DOI] [PubMed] [Google Scholar]
- Jones A.D., Ickes S.B., Smith L.E., Mbuya M.N.N., Chasekwa B., Heidkamp R.A. et al. (2014) World Health Organization infant and young child feeding indicators and their associations with child anthropometry: a synthesis of recent findings. Maternal & Child Nutrition 10, 1–17. [DOI] [PMC free article] [PubMed] [Google Scholar]
- Khatun M., Stenlund H. & Hornell A. (2004) BRAC initiative towards promoting gender and social equity in health: a longitudinal study of child growth in Matlab, Bangladesh. Public Health Nutrition 7, 1071–1079. [DOI] [PubMed] [Google Scholar]
- Kuhnlein H.V. & Receveur O. (1996) Dietary change and traditional food systems of Indigenous Peoples. Annual Review of Nutrition 16, 417–442. [DOI] [PubMed] [Google Scholar]
- Kuhnlein H.V., Smitasiri S., Yesudas S., Bhattacharjee L., Dan L. & Ahmed S. (2006) Documenting Traditional Food Systems of Indigenous Peoples: International Case Studies Guidelines for Procedures. Centre for Indigenous Peoples' Nutrition and Environment, McGill University: Ste‐Anne‐de‐Bellevue. [Google Scholar]
- Lozoff B. & Georgieff M.K. (2006) Iron deficiency and brain development. Seminars in Pediatric Neurology 13, 158–165. [DOI] [PubMed] [Google Scholar]
- Lutter C., Sempértegui F., Rodríguez A., Fuenmayor G., Ávila L., Madero J. et al. (2005) Evaluación de impacto del Programa Nacional de Alimentación y Nutrición (PANN 2000). PAHO: Washington DC. [Google Scholar]
- Lutter C.K., Rodriquez A., Fuenmayor G., Avila L., Sempertegui F. & Escobar J. (2008) Growth and micronutrient status in children receiving a fortified complementary food. Journal of Nutrition 138, 379–388. [DOI] [PubMed] [Google Scholar]
- Macdonald B., Johns T., Gray‐Donald K. & Receveur O. (2004) Ecuadorian Andean women's nutrition varies with age and socioeconomic status. Food & Nutrition Bulletin 25, 239–247. [DOI] [PubMed] [Google Scholar]
- Marquis G.S., Habicht J.P., Lanata C.F., Black R.E. & Rasmussen K.M. (1997a) Breast milk or animal‐product foods improve linear growth of Peruvian toddlers consuming marginal diets. The American Journal of Clinical Nutrition 66, 1102–1109. [DOI] [PubMed] [Google Scholar]
- Marquis G.S., Habicht J.P., Lanata C.F., Black R.E. & Rasmussen K.M. (1997b) Association of breastfeeding and stunting in Peruvian toddlers: an example of reverse causality. International Journal of Epidemiology 26, 349–356. [DOI] [PubMed] [Google Scholar]
- Martorell R., Habicht J.P., Yarbrough C., Lechtig A., Klein R.E. & Western K.A. (1975) Acute morbidity and physical growth in rural Guatemalan children. American Journal of Diseases of Children 129, 1296–1301. [DOI] [PubMed] [Google Scholar]
- Martorell R., Kettel K.L. & Schroeder D.G. (1994) Reversibility of stunting: epidemiological findings in children from developing countries. European Journal of Clinical Nutrition 48, S45–S57. [PubMed] [Google Scholar]
- Menchú M.T., Méndez H. & Lemus J. (2000) Tabla de Composición de Alimentos de Centroamérica. Segunda Sección. Guatemala: INCAP. [Google Scholar]
- Onyango A.W., Receveur O. & Esrey S.A. (2002) The contribution of breast milk to toddler diets in western Kenya. Bulletin of the World Health Organization 80, 292–299. [PMC free article] [PubMed] [Google Scholar]
- Ortiz J., Van Camp J., Wijaya S., Donoso S. & Huybregts L. (2014) Determinants of child malnutrition in rural and urban Ecuadorian highlands. Public Health Nutrition 17, 2122–2130. [DOI] [PMC free article] [PubMed] [Google Scholar]
- Pan American Health Organization (PAHO) (2004) ProPAN: Process for the Promotion of Child Feeding. PAHO: Washington DC. [Google Scholar]
- Pan American Health Organization/World Health Organization (PAHO/WHO) (2003) Guiding Principles for Complementary Feeding of the Breastfed Child. Division of Health Promotion and Protection, PAHO/WHO: Washington DC. [Google Scholar]
- Penny M.E., Creed‐Kanashiro H.M., Robert R.C., Narro M.R., Caulfield L.E. & Black R.E. (2005) Effectiveness of an educational intervention delivered through the health services to improve nutrition in young children: a cluster‐randomized controlled trial. Lancet 365, 1863–1872. [DOI] [PubMed] [Google Scholar]
- Pollitt E., Gorman K.S., Engle P.L., Rivera J.A. & Martorell R. (1995) Nutrition in early life and the fulfillment of intellectual potential. Journal of Nutrition 125, 1111S–1118S. [DOI] [PubMed] [Google Scholar]
- Ricci J.A. & Becker S. (1996) Risk factors for wasting and stunting among children in Metro Cebu, Philippines. American Journal of Clinical Nutrition 63, 966–975. [DOI] [PubMed] [Google Scholar]
- Roche M.L., Gyorkos T.W., Sarsoza J. & Kuhnlein H.V. (2015) Adjustments for weighing clothed babies at high altitude or in cold climates. Global Public Health 10, 1227–1237. [DOI] [PubMed] [Google Scholar]
- Rowland M.G.M., Cole T.J. & Whitehead R.G. (1977) A quantitative study into the role of infection in determining nutritional status in Gambian village children. British Journal of Nutrition 37, 441–450. [DOI] [PubMed] [Google Scholar]
- Shrimpton R., Victora C.G., de Onis M., Costa L.R., Blössner M. & Clugston G. (2001) Worldwide timing of growth faltering: Implications for nutritional interventions. Pediatrics 107 (5), 1–7. [DOI] [PubMed] [Google Scholar]
- Soliman A.T., Al Dabbagh M.M., Hussein H.A., Adel A., Al H.N. & Abushahin A. (2009) Linear growth in children with iron deficiency anemia before and after treatment. Journal of Tropical Pediatrics 55 (5), 324–327. [DOI] [PubMed] [Google Scholar]
- SPSS (2006) SPSS for Windows Version 15.0. SPSS Inc: Chicago. [Google Scholar]
- UNICEF (2008) State of the World's Children 2009: Maternal and Newborn Health. UNICEF: New York. [Google Scholar]
- UNICEF , WHO & The World Bank (2014) 2013 Joint Child Malnutrition Estimates: Levels and Trends. UNICEF: New York; WHO: Geneva; The World Bank: Washington, DC. [Google Scholar]
- United States Department of Agriculture (USDA) Agricultural Research Service . (2010) USDA National Nutrient Database for Standard Reference, Release 23. http://www.ars.usda.gov/nutrientdata [accessed online October 2010]
- Victora C.G., de Onis M., Hallal P.C., Blössner M. & Shrimpton R. (2010) Worldwide timing of growth faltering: revisiting implications for interventions. Pediatrics 125, e473–80. [DOI] [PubMed] [Google Scholar]
- Wamani H., Åstrøm A.N., Peterson S., Tumwine J.K. & Tylleskär T. (2007) Boys are more stunted than girls in sub‐Saharan Africa: a meta‐analysis of 16 demographic and health surveys. BMC Pediatrics 7 (1), 17. [DOI] [PMC free article] [PubMed] [Google Scholar]
- World Bank (2007) Nutritional Failure in Ecuador: Causes, Consequences, and Solutions. International Bank for Reconstruction and Development/World Bank: Washington DC. [Google Scholar]
- World Health Organization (WHO) (1995) Physical Status: The Use and Interpretation of Anthropometry. WHO: Geneva. [Google Scholar]
- World Health Organization (WHO) (2006) WHO Anthro 2005, Beta Version Feb 17th, 2006: Software for Assessing Growth and Development of the World's Children. WHO: Geneva. [Google Scholar]
- World Health Organization (WHO) (2008) Indicators for Assessing Infant and Young Child Feeding Practi Practices—Part 1 Definitions. WHO: Geneva. [Google Scholar]
- World Health Organization (WHO) (2010) Indicators for Assessing Infant and Young Child Feeding Practices—Part 2 Measurement. WHO: Geneva. [Google Scholar]