

Abstract
This study examined the association of family and maternal characteristics with preschool children's dietary patterns. Trained interviewers evaluated subsample 3422 mothers and children enrolled in the population‐based birth cohort Generation XXI (Porto, Portugal, 2005–2006). Maternal characteristics and behaviours (exercise, smoking habits, diet and child‐feeding practices) and family characteristics were evaluated. Maternal diet was classified by a dietary score, and children's dietary patterns were identified by latent class analysis. Odds ratios (OR) and confidence intervals (95% CI) were estimated by multinomial regression models. The analysis was based on a framework with four conceptual levels: maternal socio‐economic position (SEP) at 12 years, maternal socio‐economic and demographic characteristics at child's delivery, family characteristics and maternal behaviours at child's 4 years. Three dietary patterns were identified in children: high in energy‐dense foods (EDF); low in foods typically consumed at main meals and intermediate in snacks (Snacking); higher in healthy foods; and lower in unhealthy ones (Healthier, reference). Lower maternal SEP had an overall effect on children's diet (low vs. high SEP; EDF, OR = 1.76, 95% CI: 1.42–2.18; Snacking, OR = 1.73, 95% CI: 1.27–2.35), while maternal education was directly associated with it (≤9 vs. >12 schooling years, EDF, OR = 2.19, 95% CI: 1.70–2.81; Snacking, OR = 2.22, 95% CI: 1.82–3.55). Children whose mothers had worse dietary score were significantly more likely to follow unhealthier patterns (first vs. fourth quartile; EDF, OR = 9.94, 95% CI: 7.35–13.44, P‐trend < 0.001; Snacking, OR = 4.21, 95% CI: 2.94–6.05, P‐trend < 0.001). Maternal diet was the key factor associated with children's diet, above and beyond socio‐economic and demographic characteristics, accounting for one‐third of the determination coefficient of the fully adjusted model. At preschool age, interventions should give a particular focus on maternal diet and low SEP groups.
Keywords: socio‐economic factors, demographic factors, family characteristics, maternal behaviours, preschool children, dietary habits
Introduction
Eating habits develop during the first years of life within a family context, being shaped by parental behaviours (e.g. child‐feeding practices or parental diet) and family characteristics. In turn, the family is embedded in a larger social context where characteristics such as socio‐economic position (SEP) influence children's diet through the influence exerted on parental behaviours (Davison & Birch, 2001).
Considering that early diet tracks into later ages and influences current and future health (Mikkila et al. 2005; Northstone & Emmett, 2008; Ambrosini et al. 2013), prevention of unhealthy dietary habits in early childhood might be a major step in the promotion of health. However, evidence base for interventions in preschool children is limited (Waters et al. 2011).
Research on determinants of preschool children's diet is particularly scarce (De Craemer et al. 2012; Lakshman et al. 2013), and studies based on conceptual frameworks are especially warranted (de Vet et al. 2011; Zarnowiecki et al. 2014). Also, research seems somewhat disconnected between studies assessing socio‐economic factors and those mostly focused on parental behaviours such as child‐feeding practices and/or parental diet (Savage et al. 2007; Scaglioni et al. 2008; De Craemer et al. 2012; Lakshman et al. 2013).
Childhood SEP is correlated with subsequent socio‐economic status and is strongly associated with adult health, but the behavioural pathways that link SEP to health, as well as the length needed for socio‐economic exposures to exert their influence, warrant particular attention (Cohen et al. 2010). Hence, studies examining parental determinants of children's diet should take into account both distal and proximal indicators of SEP.
Relatively few studies have examined broader ranges of potential determinants of empirically derived dietary patterns among preschool children (North & Emmett, 2000; Northstone & Emmett, 2005; Leventakou et al. 2015; Lioret et al. 2015), but parenting child‐feeding practices were not included. Also, studies examining overall measures of maternal diet are practically non‐existent (Fisk et al. 2011). Moreover, to the best of our knowledge, only one study (Moreira et al. 2014) identified patterns of maternal child‐feeding practices, and none examined their association with a posteriori dietary patterns of preschool children.
Thus, the aim of the present study was to evaluate a broad range of potential determinants of dietary patterns among children aged 4 years and – in order to better understand upstream and downstream factors, overall and ‘direct effects’, as well as factors most relevant to the child's diet – to support the analysis on a framework considering plausible pathways between the several determinants. As such, a theoretical framework (Fig. 1) based on previous models (UNICEF, 1990; Victora et al. 1997; Davison & Birch, 2001; Solar & Irwin, 2010), ensuring time precedence between blocks of variables, was defined including four conceptual levels: (i) SEP of the mother at 12 years of age; (ii) maternal socio‐economic and demographic characteristics at child's delivery; (iii) family characteristics at child's 4 years; and (iv) maternal characteristics and behaviours (physical exercise practice, smoking habits, child‐feeding patterns and diet) at child's 4 years of age.
Figure 1.
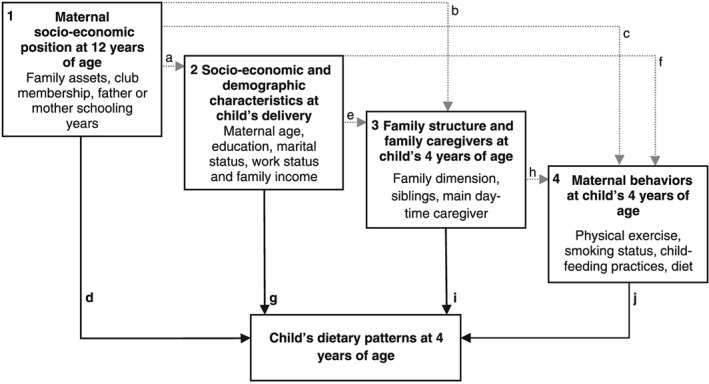
Theoretical framework of family and maternal determinants of children's diet. This figure depicts the theoretical framework defined for analysis in the present study adapted prom previously published models (UNICEF, 1990; Victora et al. 1997; Davison & Birch, 2001; Solar & Irwin, 2010). Arrows represent theoretical causal relationships between determinants of children's dietary patterns. Dashed grey lines represent possible indirect effects in the pathway between levels of determinants. Solid black lines represent the direct effects of factors, after adjustment for determinants in preceding levels that is not mediated by subsequent ones, but that may be explained by other factors (unknown or unmeasured). 1. Socio‐economic position at mothers' 12 years may exert an effect on children's diet through socio‐economic and demographic characteristics at child's delivery (a), through its influence on subsequent family characteristics (b), through maternal behaviours (c) and/or through unknown or unmeasured determinants (d). 2. Socio‐economic and demographic characteristics at child's delivery may have an effect on children's diet through subsequent family characteristics (e), through maternal behaviours (f) and/or through unknown or unmeasured factors (g). 3. Family characteristics at child's 4 years of age may have an effect on children's dietary patterns through their influence on maternal behaviours (h) and/or through unknown or unmeasured determinants (i). 4. In this conceptual framework, maternal behaviours would then influence children's dietary patterns directly and/or through other unknown or unmeasured factors (j). In the present study, we were particularly interested in the overall effects and the direct effects (highlighted in bold, d, g, i and j).
Key messages.
The prevalence of unhealthy diets in Portuguese preschool children is high: Energy‐Dense Foods dietary pattern (41%) and Snacking dietary pattern (14%).
This study clarifies that early maternal socio‐economic position is indirectly associated with 4‐year‐old children's dietary patterns and that maternal education is directly associated with these patterns.
Maternal behaviours (dietary quality and child‐feeding practices) are directly associated with children's diet, above and beyond socio‐economic and demographic factors.
Maternal diet is the most important factor associated with children's diet. Hence, interventions aimed at promoting healthy diets among preschool children should include mothers and give particular focus to the quality of their diet.
Participants and methods
Participants
Participants are part of the population‐based birth cohort Generation XXI, described elsewhere (Larsen et al. 2013). Briefly, a total of 8647 live newborns and their mothers (n = 8495) were enrolled between April 2005 and August 2006 at all five public maternity units from the metropolitan area of Porto, Portugal. At 4 years of age, the entire cohort was invited to a re‐evaluation, and 7458 subjects participated (86% participation proportion). Data were collected by face‐to‐face interviews or, for those families that were not able to be present during the face‐to‐face interview (20%), by telephone with a shorter version of the questionnaire.
Of those evaluated in person, 82% returned Child‐Feeding Questionnaires (CFQ), of which 99% were completed by mothers. After exclusion of twins, and children with congenital anomalies or diseases that might influence dietary intake (e.g. cerebral palsy or food allergy), a subsample of 4341 subjects with complete CFQ and Food Frequency Questionnaire (FFQ) was considered eligible for the present study. From these, we excluded subjects with incomplete information on variables of interest: maternal SEP at 12 years (n = 76); characteristics at child's delivery [family income (n = 481), maternal work status (n = 21), maternal education (n = 16) and maternal marital status (n = 7)]; family characteristics at child's 4 years [siblings (n = 12), daytime caregiver (n = 7)]; maternal characteristics at child's 4 years [exercise (n = 44), body mass index (BMI) (n = 124)]; and child's characteristics [screen time (n = 73), physical exercise (n = 13) and BMI (n = 45)]. A total of 3422 mothers and children remained for final analysis.
Comparison of baseline characteristics between this sample (n = 3422) and the remaining cohort (5225) showed that mothers in the present sample were slightly older (mean = 30.4, SD = 4.99 vs. mean = 29.0 years, SD = 5.86; P < 0.001) and slightly more educated (mean = 11.3, SD = 4.22 vs. mean = 10.0 complete schooling years, SD = 4.16; P < 0.001). Cohen's effect size values were not high (<0.35) (Husted et al. 2000).
All the phases of the study complied with the Ethical Principles for Medical Research Involving Human Subjects expressed in the Declaration of Helsinki (World Medical Association, 2013). The study was approved by the University of Porto Medical School/S. João Hospital Centre ethics committee, and a signed informed consent according to Helsinki was required for all participants.
Data collection
With the exception of child‐feeding practices (self‐completed by mothers), information was collected through structured questionnaires applied by trained staff during face‐to‐face interviews to the child primary caregiver (in the present sample, 100% were mothers) at baseline [maternal SEP at the age of 12 years; and family or maternal characteristics at child's birth (age, work status, marital status and family income)] and at the 4‐year follow‐up [family characteristics (size, siblings and main daytime caregiver); maternal characteristics (BMI) and behaviours (physical exercise practice, smoking status, diet and child‐feeding practices); and child's characteristics (sex, age and BMI) and behaviours (physical exercise and daily screen time)].
Family and maternal demographic and socio‐economic characteristics
As described elsewhere (Teixeira et al. 2015), latent class analysis (LCA) models were used to identify distinct categories of maternal SEP when the mother was 12 years of age (SEP‐12). Three latent classes were identified representing low, intermediate and high SEP. Maternal age was categorized into <25, 25–29 or >29 years. Maternal education corresponded to the number of completed schooling years, categorized into ≤9, 10–12 or 12 years. Maternal work status was assessed as a nominal variable, converted into not working (unemployed, retired and housewife) vs. working (part or full‐time, student and working student). Maternal marital status was defined as not married or cohabiting vs. married or cohabiting. Family income was measured as an ordinal variable, categorized as ≤1000, 1001–1500 or >1500 euros/month. Siblings' age was used to define a categorical variable (older and younger, only younger, only older or no siblings); the number of persons in the household was categorized into >4, 4 or <4 persons, and child's main daytime caregiver was defined as family (parent or other family member) vs. non‐family (kindergarten and nannies).
Maternal behaviours
Physical exercise was assessed as to type, frequency and duration, and, considering the proportion of mothers not practicing any physical exercise (80.5%), a nominal variable of practice of physical exercise was defined (no vs. yes). Maternal smoking status was categorized into smoking (1–10 or >10 cigarettes/day) vs. non‐smoker.
Maternal dietary intake was evaluated by a FFQ adapted from a previous questionnaire validated for the general adult population (Lopes et al. 2007) and for pregnant women in a subsample of this cohort (Pinto et al. 2010). This FFQ assessed consumption in the previous year and included 18 items with response options in 9‐point frequency scale, ranging from ‘never’ to ‘≥4 times per day’. Frequencies of consumption were converted into daily frequencies (e.g. 1 time/week was converted into 1/7 days = 0.14 times/day). A dietary score adapted from a previous one (González et al. 2002) was defined considering eight food items/groups: milk, fish, red meat (red and processed meat), bread, fruit, vegetables (vegetable soup and vegetables on a plate), energy‐dense micronutrient‐poor foods (EDF) consisting of cakes and salty pastry, and sugar‐sweetened beverages (carbonated and non carbonated). Each item/group was categorized into quartiles, and 1 to 4 points were assigned according to increasing quartiles of consumption (milk, fish, bread, fruit and vegetables) or decreasing quartiles of consumption (red meat, EDF and sugar‐sweetened beverages). Points assigned were summed up resulting in a dietary score ranging from 8 to 32 points, where higher scores reflect better maternal diet. This score was further converted into quartiles (fourth quartile considered as reference category in analyses).
Child‐feeding practices were assessed through a combined version of the CFQ (Birch et al. 2001) and the scales of overt and covert control (Ogden et al. 2006), self‐completed by mothers. This questionnaire was previously adapted to Portuguese and validated in a subsample of the Generation XXI cohort (Real et al. 2014). The dimensions of this questionnaire showed acceptable reliability in a previous study (Durão et al. 2015) conducted in the same sample frame. As described previously (Moreira et al. 2014), participants received mean scores for each dimension with at least 50% of answers. Scores ranged from 1 to 5, higher scores reflecting higher levels of practices. Three patterns of maternal child‐feeding practices were identified by principal component analysis; ‘perceived monitoring’, ‘restriction’ and ‘pressure to eat’. These factors' scores are in a standard deviation scale, ranging from −3 to 3. A score of 0 represents mothers' ratings close to the average of the sample, while a score of −2 corresponds to maternal ratings two standard deviations below the mean of the sample.
Child's age and physical activity
Exact age was computed in days using birthdate and the date of the 4‐year follow‐up and was further converted into years. Daily screen time was assessed by a structured question assessing average daily minutes spent in front of a screen (television, computer or game devices) at both week and weekend days. Time was converted into hours per day, and an average of daily screen time was calculated [(daily hours per day × 5 week days) + (daily hours per day × 2 weekend days)/7 days]. Physical exercise practice was also collected using a structured question assessing both type and time (minutes per week) of exercise. Time spent practicing each type of exercise was converted into hours and summed up to define weekly hours of physical exercise.
Child's dietary intake
Dietary intake was evaluated by a 35‐item FFQ, assessing food consumption in the previous 6 months. As previously described (Durão et al. 2015), nine response options were available ranging from never to ≥4 times/day further converted into daily frequencies (e.g. ≥4 times/day was converted into 4 times/day, and 1–3 times/month was considered as 2 times/month, which, divided by 30 days, corresponds to 0.07 times/day). Five items were excluded from analysis because of either low frequency of consumption (coffee, tea and herbal tea) or low between‐subject variability (crackers and butter). Hence, 30 items were considered for identification of dietary patterns. A total of 16 foods items/groups were defined: five groups based on similarity of food type and nutritional composition [milk (whole, semi or skimmed), yoghurt (sugared and non‐sugared), meat and eggs (red meat, white meat and eggs), sweets (cakes, biscuits, chocolate, sugar, candies and ice cream) and sugar‐sweetened beverages (colas, other carbonated beverages, iced tea, fruit drinks and other non‐carbonated beverages)] and 11 isolated items (fruit, vegetable soup, vegetables on a plate, cheese, fish, processed meat, rice–pasta–potatoes, bread, crisps, pizza–burger and salty pastry).
In a subsample of 2493 children with complete 3‐day food diaries, the validity and reliability of the FFQ were assessed by calculation of Pearson's correlation coefficients and intraclass correlation coefficients for key food groups as measured by both methods. For food groups most frequently consumed, weak‐to‐moderate correlations and fair‐to‐moderate agreement were observed. Significant positive moderate Pearson's correlations were found for vegetable soup (r = 0.54, P < 0.001), fruit (r = 0.42, P < 0.001), milk (r = 0.46, P < 0.001) and yoghurts (r = 0.48, P < 0.001). Intraclass correlation coefficients varied from 0.54 [95% confidence interval (95% CI) 0.51–0.56] for vegetable soup to 0.17 (95% CI 0.11–0.32) for juices.
Anthropometric measures
Mothers' and children's height and weight were measured by trained professionals; body weight was measured to the nearest 0.1 kg with a digital scale (Tanita®, Arlington Heights, IL, USA), and height was measured to the nearest 0.1 cm with a wall stadiometer (SECA®, Hamburg, Germany). Maternal and child BMI were computed as weight in kilograms divided by height in squared metres. Maternal BMI was used as a continuous variable. Children's BMI was further converted into age and sex‐specific standard deviation scores (BMI z‐scores) according to the standards of the World Health Organization (WHO, 2006), also used as continuous.
Statistical analysis
Considering the categorical nature of the response items in the FFQ and their asymmetric distribution, children's dietary patterns were identified by LCA. This methodology focuses on relationships among individuals (person‐centred approach) rather than relationships among variables and describes how the probabilities of a set of observed categorical variables (e.g. FFQ's items) vary across groups of individuals (distinguishing clusters of individuals homogeneous within groups) in order to find the smallest number of latent classes (e.g. dietary patterns) by adding classes stepwise until the model fits the data well (Muthén & Muthén, 2000). Probabilities of choosing each item response, conditionally on class membership, can be interpreted based on item profiles in each class (Vermunt & Magidson, 2002; Severo et al. 2012). In the present study, the number of dietary patterns was defined according to the Bayesian information criteria (BIC). The analysis used the 16 food items/groups, categorized into: first quintile, second to fourth quintiles combined, and fifth quintile. For foods eaten only once or twice a day (vegetable soup and rice–pasta–potatoes), two categories were defined: once a day, and twice a day. Children were assigned to each pattern according to the highest probability of class membership, and profiles of probabilities in each item category, conditionally on pattern membership, were used to interpret dietary patterns.
Chi‐square tests or one‐way analysis of variance with Bonferroni's correction for post hoc multiple comparisons were used, as appropriate, to test for differences across dietary patterns. Associations between exposures (family and maternal characteristics) and the outcome (children's diet) were estimated by crude and adjusted odds ratios (OR) and respective 95% CI, using multinomial logistic regression models. The main aim was to assess overall and ‘direct effects’ between exposures and the outcome. A step‐by‐step approach was used: first, univariate models were fitted; second, conceptually predefined blocks of variables were fitted separately (variables within each block mutually adjusted); and third, blocks including significant variables were introduced cumulatively into the analysis, with a fixed order based on a predefined theoretical framework (Fig. 1): (i) SEP of the mother at 12 years of age; (ii) maternal socio‐economic and demographic characteristics at child's delivery; (iii) family characteristics at child's 4 years; and (iv) maternal characteristics and behaviours at child's 4 years of age. Models were adjusted for child's characteristics (sex, daily screen time, weekly time spent practicing physical exercise and exact age) and were compared by likelihood ratio test (LRT) for nested models. The coefficient of determination proposed for logistic regression (Nagelkerke, 1991), Nagelkerke's R 2, was used to assess which factors were most relevant to the child diet.
Latent class analysis for dietary patterns identification was conducted using mplus (V5.2; Muthén & Muthén, Los Angeles, CA, USA), and the remaining statistical analysis were conducted using spss statistical software package version 21 (SPSS Inc., Chicago, IL, USA). A significance level of 5% was adopted in all analyses.
Results
At child's 4 years of age, three dietary patterns were identified (two patterns, BIC = 147 384; three patterns, BIC = 146 698; four patterns, BIC = 146 656). Comparison between patterns (Table 1) showed that class 1 (41% children) had higher percentage of children within the fifth quintile of sweets, sugar‐sweetened beverages, pizza‐burguer and processed meat, being named ‘EDF dietary pattern’. Class 2 (14% children) showed high proportion of children in the first quintile (or once a day) of foods typically eaten at main meals (vegetables on a plate, fish, meat and eggs, rice–pasta–potatoes and fruit) and intermediate/high proportions of children within the fifth quintile of foods usually eaten as snacks (bread, milk, yoghurt, crisps, pizza–burger, salty pastry and sugar‐sweetened beverages) and was named ‘Snacking dietary pattern’. Class 3 (45% children), named ‘Healthier dietary pattern’ (reference category in multinomial logistic regression models), was characterized by higher proportion of children within the fifth quintile (or twice a day) of healthy foods (vegetable soup, vegetables on the plate and fish), as well as lower proportion of children in the fifth quintile of unhealthy foods (processed meat, crisps, pizza–burger, salty pastry, sweets and sugar‐sweetened beverages).
Table 1.
Proportion of subjects within consumption categories in each latent class (dietary pattern), n = 3422*
| Latent class (dietary pattern) | ||||
|---|---|---|---|---|
| Total sample | Class 1 (EDF) | Class 2 (Snacking) | Class 3 (Healthier) | |
| n = 3422 | n = 1400 (41%) | n = 484 (14%) | n = 1538 (45%) | |
| Fruit | ||||
| 1st quintile, % | 38.3 | 51.9a | 62.6b | 18.4c |
| 5th quintile, % | 2.4 | 2.6a | 1.0a | 2.6a |
| Vegetable soup | ||||
| Once a day, % | 23.3 | 34.1a | 27.5b | 12.2c |
| Twice a day, % | 76.7 | 65.9a | 72.5b | 87.8c |
| Vegetables on a plate | ||||
| 1st quintile, % | 30.1 | 29.2a | 79.5b | 15.4c |
| 5th quintile, % | 20.8 | 16.6a | 3.3b | 30.1c |
| Milk | ||||
| 1st quintile, % | 19.8 | 19.4a | 20.9a | 19.8a |
| 5th quintile, % | 9.3 | 9.6a | 14.3b | 7.4a |
| Yoghurt | ||||
| 1st quintile, % | 55.2 | 47.1a | 45.0a | 65.9b |
| 5th quintile, % | 4.5 | 5.0a | 6.0a | 3.6a |
| Cheese | ||||
| 1st quintile, % | 24.4 | 17.0a | 56.2b | 21.1c |
| 5th quintile, % | 7.4 | 10.4a | 6.8b | 4.8b |
| Fish | ||||
| 1st quintile, % | 65.4 | 77.2a | 84.3b | 48.6c |
| 5th quintile, % | 9.4 | 4.1a | 6.2a | 15.1b |
| Meat and eggs | ||||
| 1st quintile, % | 39.0 | 37.2a | 50.8b | 37.0a |
| 5th quintile, % | 17.3 | 21.1a | 8.7b | 16.4c |
| Processed meat | ||||
| 1st quintile, % | 20.8 | 6.1a | 49.2b | 25.3c |
| 5th quintile, % | 18.8 | 28.8a | 13.6b | 11.2b |
| Rice–pasta–potatoes | ||||
| Once a day, % | 8.1 | 6.9a | 18.6b | 5.9a |
| Twice a day, % | 91.9 | 93.1a | 81.4b | 94.1a |
| Bread | ||||
| 1st quintile, % | 50.9 | 46.4a | 55.6b | 53.4b |
| 5th quintile, % | 1.5 | 2.1a | 1.7a | 1.0a |
| Crisps | ||||
| 1st quintile, % | 23.7 | 7.4a | 24.0b | 38.4c |
| 5th quintile, % | 8.3 | 15.6a | 12.8a | 0.3b |
| Pizza–burger | ||||
| 1st quintile, % | 24.5 | 7.6a | 59.7b | 28.9c |
| 5th quintile, % | 16.0 | 29.4a | 9.3b | 6.0c |
| Salty pastry | ||||
| 1st quintile, % | 19.2 | 9.3a | 47.7b | 19.3c |
| 5th quintile, % | 3.2 | 5.5a | 4.8a | 0.7b |
| Sweets | ||||
| 1st quintile, % | 20.8 | 5.4a | 20.5b | 34.9c |
| 5th quintile, % | 18.7 | 31.8a | 24.6b | 4.9c |
| Sugar‐sweetened beverages | ||||
| 1st quintile, % | 20.8 | 2.7a | 27.9b | 35.0c |
| 5th quintile, % | 18.1 | 39.4a | 20.7b | 2.6c |
EDF, energy‐dense foods dietary pattern.
Intermediate category (2nd, 3rd and 4th quintiles combined) is not shown in order to avoid redundancy.
Proportions were compared by chi‐square test considering Bonferroni's correction for post hoc multiple comparisons. Different superscript letters indicate significant differences between dietary patterns at a significance level of 5%.
As presented in Table 2, children following the ‘Healthier’ dietary pattern had mothers with higher SEP‐12, higher education, older age, married or cohabiting, working and from higher income families. At 4 years, these children belonged to less‐crowded families, had younger siblings more often and attended kindergartens. Also, they had more mothers practicing physical exercise, not smoking, with better dietary scores, higher scores of monitoring and restriction, and lower scores of ‘pressure to eat’.
Table 2.
Maternal, family and child's characteristics according to children's dietary patterns, n = 3422
| EDF | Snacking | Healthier | P‐value* | |
|---|---|---|---|---|
| n = 1400 | n = 484 | n = 1538 | ||
| Socio‐economic position at mothers' 12 years† | ||||
| Low | 364 (26.0)a | 122 (25.2)a | 307 (20.0)b | |
| Intermediate | 742 (52.0)a | 260 (53.7)a,b | 733 (47.7)b | |
| High | 294 (21.0)a | 102 (21.1)a | 498 (32.4)b | <0.001 |
| Socio‐economic and demographic characteristics at child's delivery | ||||
| Maternal age† | ||||
| <25 years | 259 (18.5)a | 68 (14.0)a | 105 (6.8)b | |
| 25–29 years | 424 (30.3)a | 152 (31.4)a | 417 (27.1)a | |
| >29 years | 717 (51.2)a | 264 (54.5)a | 1016 (66.1)b | <0.001 |
| Maternal education† | ||||
| ≤9 years | 704 (50.3)a | 242 (50.0)a | 436 (28.3)b | |
| 10–12 years | 424 (30.3)a | 136 (28.1)a | 430 (28.0)a | |
| >12 years | 272 (19.4)a | 106 (21.9)a | 672 (43.7)b | <0.001 |
| Maternal marital status† | ||||
| Married or cohabiting | 1329 (94.9)a | 465 (96.1)a,b | 1489 (96.8)b | |
| Not married or cohabiting | 71 (5.1)a | 19 (3.9)a,b | 49 (3.2)b | 0.035 |
| Maternal work status† | ||||
| Working | 1067 (76.2)a | 380 (78.5)a | 1295 (84.2)b | |
| Not working | 333 (23.8)a | 104 (21.5)a | 243 (15.8)b | <0.001 |
| Family income† | ||||
| Lower (≤1000 euros/month) | 582 (41.6)a | 188 (38.8)a | 416 (27.0)b | |
| Intermediate (1001–1500 euros/month) | 445 (31.8)a | 150 (31.0)a,b | 425 (27.6)b | |
| Higher (>1500 euros/month) | 373 (26.6)a | 146 (30.2)a | 697 (45.3)b | <0.001 |
| Family at child's 4 years | ||||
| Family dimension† | ||||
| >4 persons | 235 (16.8)a | 70 (14.5)a | 227 (14.8)a | |
| 4 persons | 615 (43.9)a | 176 (36.4)b | 665 (43.2)a | |
| <4 persons | 550 (39.3)a | 238 (49.2)b | 646 (42.0)a | 0.003 |
| Child's siblings† | ||||
| Older and younger | 34 (2.4)a | 9 (1.9)a | 41 (2.7)a | |
| Only younger | 154 (11.0)a | 63 (13.0)a | 202 (13.1)a | |
| Only older | 582 (41.6)a | 149 (30.8)b | 575 (37.4)a | |
| No siblings | 630 (45.0)a | 263 (54.3)b | 720 (46.8)a | 0.001 |
| Main daytime caregiver† | ||||
| Parent (95% mothers) | 66 (4.7)a | 34 (7.0)a | 40 (2.6)b | |
| Other family member (96% grandparents) | 151 (10.8)a | 60 (12.4)a | 120 (7.8)b | |
| Not family (kindergarten, nannies) | 1183 (84.5)a | 390 (80.6)a | 1378 (89.6)b | <0.001 |
| Maternal characteristics at child's 4 years | ||||
| Physical exercise practice† | ||||
| Practitioners | 217 (15.5)a | 74 (15.3)a | 376 (24.4)b | |
| Non‐practitioners | 1183 (84.5)a | 410 (84.7)a | 1162 (75.6)b | <0.001 |
| Smoking status† | ||||
| Non‐smoker | 1046 (74.7)a | 382 (78.9)a,b | 1277 (83.0)b | |
| 1–10 cigarettes/day | 221 (15.8)a | 69 (14.3)a,b | 169 (11.0)b | |
| >10 cigarettes/day | 133 (9.5)a | 33 (6.8)a,b | 92 (6.0)b | <0.001 |
| Dietary score† | ||||
| 1st quartile (<16 points) | 551 (39.4)a | 165 (34.1)a | 208 (13.5)b | |
| 2nd quartile (17–19 points) | 485 (34.6)a | 142 (29.3)a | 365 (23.7)b | |
| 3rd quartile (20–22 points) | 280 (20.0)a | 116 (24.0)a | 503 (32.7)b | |
| 4th quartile (>22 points) | 84 (6.0)a | 61 (12.6)b | 462 (30.0)c | <0.001 |
| BMI† | ||||
| <25.0 kg/m2 | 627 (44.8)a | 237 (49.0)a,b | 786 (51.1)b | |
| ≥25.0 kg/m2 | 773 (55.2)a | 247 (51.0)a,b | 752 (48.9)b | 0.003 |
| Patterns of child‐feeding practices‡ | ||||
| Perceived monitoring | −0.1 (1.04)a | 0.0 (1.04)a,b | 0.1 (0.92)b | <0.001 |
| Restriction | −0.1 (0.97)a | 0.0 (1.03)a,b | 0.1 (0.97)b | <0.001 |
| Pressure to eat | 0.0 (1.00)a | 0.1 (1.01)a,b | −0.1 (1.00)a | 0.003 |
| Child's characteristics | ||||
| Sex† | ||||
| Girls | 662 (47.3)a | 228 (47.1)a | 783 (50.9)a | |
| Boys | 738 (52.7)a | 256 (52.9)a | 755 (49.1)a | 0.102 |
| Screen time, h/day‡ | 1.9 (1.17)a | 1.9 (1.19)a | 1.5 (0.90)b | <0.001 |
| Time practicing physical exercise, h/week‡ | 1.1 (1.18)a | 1.0 (1.07)a | 1.3 (1.18)b | <0.001 |
| BMI z‐score‡ | 0.6 (1.11)a | 0.6 (1.16)a | 0.6 (1.05)a | 0.276 |
| Exact age, years‡ | 4.4 (0.41)a | 4.3 (0.35)b | 4.3 (0.35)b | <0.001 |
BMI, body mass index; BMI z‐score, age and sex‐specific BMI standard deviation scores according to the World Health Organization (WHO, 2006); EDF, energy‐dense foods dietary pattern.
For categorical variables, comparison between dietary patterns was performed by the chi‐square test. For continuous variables, comparison was performed by one‐way analysis of variance. For both tests, Bonferroni's correction for post hoc multiple comparisons was considered. Different superscript letters indicate significant differences between dietary patterns at a significance level of 5%.
n (%).
Mean (standard deviation).
In the analysis of separate blocks (not shown), with variables mutually adjusted within each block, maternal age, education and work status remained significant, while family income and marital status did not, being therefore excluded from posterior analysis. Other variables retained statistical significance.
In multivariate analysis (Table 3), the predefined theoretical framework depicted in Fig. 1 was followed by consecutive addition of blocks into the model. When compared with children following the Healthier dietary pattern, lower maternal SEP‐12 (Model 1) had the overall significant effect of increasing the odds of children following both unhealthier dietary patterns. When maternal socio‐economic and demographic characteristics at child's delivery were added (Model 2), maternal SEP‐12 ceased to be significantly associated with children's dietary patterns, and both maternal age and education were significantly associated with children's dietary patterns. After accounting for maternal socio‐economic and demographic characteristics, having only older siblings significantly increased the odds of children following the EDF dietary pattern, while children with only younger siblings were significantly more likely to follow the Snacking pattern.
Table 3.
Multivariate analysis of the associations of maternal and family characteristics with dietary patterns of 4‐year‐old children, n = 3422*
| n | Model 1† | Model 2† | Model 3† | Model 4† | |||||
|---|---|---|---|---|---|---|---|---|---|
| EDF‡ | Snacking‡ | EDF‡ | Snacking‡ | EDF‡ | Snacking‡ | EDF‡ | Snacking‡ | ||
| n = 1400 | n = 484 | n = 1400 | n = 484 | n = 1400 | n = 484 | n = 1400 | n = 484 | ||
| Socio‐economic position at mothers' 12 years | |||||||||
| High | 894 | 1 | 1 | 1 | 1 | 1 | 1 | 1 | 1 |
| Intermediate | 1735 | 1.52 (1.27–1.83) | 1.56 (1.20–2.02) | 1.04 (0.85–1.26) | 1.09 (0.82–1.44) | 1.04 (0.86–1.26) | 1.09 (0.82–1.44) | 1.03 (0.83–1.27) | 1.08 (0.81–1.45) |
| Low | 793 | 1.76 (1.42–2.18) | 1.73 (1.27–2.35) | 1.10 (0.86–1.41) | 1.06 (0.82–1.49) | 1.10 (0.86–1.41) | 1.07 (0.75–1.51) | 1.19 (0.91–1.55) | 1.12 (0.79–1.60) |
| Socio‐economic and demographic characteristics at child's delivery | |||||||||
| Maternal age | |||||||||
| >29 years | 1997 | 1 | 1 | 1 | 1 | 1 | 1 | ||
| 25–29 years | 993 | 1.28 (1.07–1.52) | 1.26 (0.99–1.60) | 1.38 (1.15–1.66) | 1.14 (0.88–1.46) | 1.14 (0.93–1.39) | 0.97 (0.75–1.25) | ||
| <25 years | 432 | 2.17 (1.67–2.84) | 1.63 (1.14–2.33) | 2.47 (1.87–3.28) | 1.40 (0.96–2.04) | 1.80 (1.34–2.44) | 1.07 (0.73–1.58) | ||
| Maternal education | |||||||||
| >12 years | 1050 | 1 | 1 | 1 | 1 | 1 | 1 | ||
| 10–12 years | 990 | 1.91 (1.54–2.35) | 1.61 (1.19–2.18) | 1.87 (1.51–2.31) | 1.67 (1.23–2.27) | 1.51 (1.20–1.90) | 1.44 (1.05–1.98) | ||
| ≤9 years | 1382 | 2.87 (2.29–3.59) | 2.81 (2.06–3.83) | 2.76 (2.19–3.47) | 3.02 (2.20–4.15) | 2.19 (1.70–2.81) | 2.55 (1.82–3.55) | ||
| Maternal work status | |||||||||
| Working | 2742 | 1 | 1 | 1 | 1 | 1 | 1 | ||
| Not working | 680 | 1.07 (0.87–1.30) | 0.99 (0.76–1.30) | 1.06 (0.86–1.29) | 1.03 (0.78–1.35) | 1.00 (0.80–1.24) | 0.99 (0.74–1.31) | ||
| Family at child's 4 years | |||||||||
| Family dimension | |||||||||
| <4 persons | 1434 | 1 | 1 | 1 | 1 | ||||
| 4 persons | 1456 | 0.96 (0.71–1.29) | 0.74 (0.49–1.13) | 0.91 (0.66–1.25) | 0.71 (0.46–1.09) | ||||
| >4 persons | 532 | 0.83 (0.59–1.15) | 0.74 (0.47–1.17) | 0.80 (0.56–1.15) | 0.72 (0.45–1.16) | ||||
| Child's siblings | |||||||||
| No siblings | 1613 | 1 | 1 | 1 | 1 | ||||
| Older and younger | 84 | 1.09 (0.61–1.95) | 0.77 (0.32–1.81) | 1.40 (0.75–2.61) | 0.92 (0.38–2.21) | ||||
| Only younger | 419 | 1.10 (0.77–1.57) | 1.43 (0.88–2.32) | 1.38 (0.95–2.03) | 1.67 (1.01–2.73) | ||||
| Only older | 1306 | 1.40 (1.04–1.89) | 0.91 (0.60–1.38) | 1.67 (1.21–2.30) | 1.02 (0.66–1.58) | ||||
| Main daytime caregiver | |||||||||
| Not family§ | 2951 | 1 | 1 | 1 | 1 | ||||
| Parent§ | 140 | 1.12 (0.73–1.73) | 1.63 (0.98–2.72) | 1.36 (0.86–2.16) | 1.84 (1.09–3.10) | ||||
| Other family member§ | 331 | 1.23 (0.93–1.62) | 1.29 (0.91–1.84) | 1.14 (0.85–1.53) | 1.23 (0.86–1.77) | ||||
| Maternal characteristics at child's 4 years | |||||||||
| Physical exercise | |||||||||
| Practitioners | 667 | 1 | 1 | ||||||
| Non‐practitioners | 2755 | 1.10 (0.89–1.36) | 1.21 (0.91–1.62) | ||||||
| Smoking status | |||||||||
| Non‐smokers | 2705 | 1 | 1 | ||||||
| 1–10 cigarettes/day | 459 | 1.22 (0.95–1.56) | 1.11 (0.80–1.54) | ||||||
| >10 cigarettes/day | 258 | 1.09 (0.79–1.50) | 0.86 (0.55–1.34) | ||||||
| Dietary score | |||||||||
| 4th quartile (>22 Pt) | 607 | 1 | 1 | ||||||
| 3rd quartile (20–22 Pt) | 899 | 2.69 (2.02–3.58) | 1.59 (1.13–2.25) | ||||||
| 2nd quartile (17–19 Pt) | 992 | 6.13 (4.62–8.12) | 2.41 (1.71–3.40) | ||||||
| 1st quartile (<16 Pt) | 924 | 9.94 (7.35–13.44) | 4.21 (2.94–6.05) | ||||||
| BMI | |||||||||
| <25.0 kg/m2 | 1650 | 1 | 1 | ||||||
| ≥25.0 kg/m2 | 1772 | 1.16 (0.98–1.38) | 0.95 (0.76–1.19) | ||||||
| Child‐feeding patterns | |||||||||
| Perceived monitoring | 3422 | 0.84 (0.77–0.91) | 0.89 (0.80–0.99) | ||||||
| Restriction | 3422 | 0.85 (0.78–0.93) | 0.88 (0.78–0.98) | ||||||
| Pressure to eat | 3422 | 0.95 (0.87–1.04) | 1.07 (0.95–1.20) | ||||||
| Nagelkerke's R 2 | 0.08 | 0.14 | 0.15 | 0.27 | |||||
| LRT P‐value | <0.001 | <0.001 | <0.001 | <0.001 | |||||
BMI, body mass index; EDF, energy‐dense foods dietary pattern; Nagelkerke's R 2, Nagelkerke's R‐squared (Nagelkerke, 1991); Pt, points; LRT, likelihood ratio test.
Statistically significant associations are highlighted in bold.
Blocks of variables (socio‐economic position at mothers' 12 years of age; maternal socio‐economic and demographic characteristics at child's delivery; family characteristics at child's 4 years; and maternal characteristics at child's 4 years) were added sequentially into the analysis. Models are adjusted for child's characteristics (sex; daily screen time; weekly time spent practicing physical exercise; and exact age).
Reference category is the Healthier dietary pattern (n = 1538), not shown to avoid redundancy.
Not family, kindergarten and nannies; parent, mostly mothers (95%); other family member, mostly grandparents (96%).
Maternal behaviours were added in Model 4, resulting in a significant increase in Nagelkerke's R 2 (from 0.15 to 0.27, P < 0.001). In this final model, several maternal characteristics were directly associated with both unhealthier dietary patterns (education, diet and child‐feeding practices). Lower maternal education increased the odds of children following both the EDF and Snacking dietary patterns (≤9 vs. >12 years, OR = 2.19, 95% CI: 1.70–2.81; OR = 2.55, 95% CI: 1.82–3.55, respectively). Also, the worse the maternal dietary score, the higher the odds of children following unhealthier patterns (first vs. fourth quartile; EDF, OR = 9.94, 95% CI: 7.35–13.44, P‐trend < 0.001; Snacking, OR = 4.21, 95% CI: 2.94–6.05, P‐trend < 0.001). Higher levels of maternal perceived monitoring and restriction were inversely associated with children's practice of unhealthier dietary patterns.
Some factors were significantly directly associated with only one of the unhealthier dietary patterns. Younger age of the mother at child's delivery was positively associated with the EDF (<25 vs. >29 years, OR = 1.80, 95% CI: 1.34–2.44) but not with the Snacking dietary pattern. Likewise, children with only older siblings were more likely to follow the EDF pattern (only older vs. no siblings, OR = 1.67, 95% CI: 1.21–2.30). In contrast, having only younger siblings and being mainly cared by a parent (95% were mothers) were both associated only with the Snacking dietary pattern (OR = 1.67, 95% CI: 1.01–2.73 and OR = 1.84, 95% CI: 1.09–3.10, respectively).
In order to assess which factor was key to children's diet, variables significantly associated with both unhealthier patterns were removed one by one from the final model (Model 4). Comparison between models was performed by both comparison of Nagelkerke's R 2 and LRT for nested models. Removal of maternal child‐feeding practices did not produce a substantial reduction in Nagelkerke's R 2 (full vs. reduced model; R 2 = 0.27 vs. R 2 = 0.26, = 35.4, P < 0.001), and the same was observed after removal of maternal education (full vs. reduced model; R 2 = 0.27 vs. R 2 = 0.25, = 52.0, P < 0.001). Maternal dietary score was the key factor associated with children's dietary patterns as its removal from the final model produced a drop of 9% in Nagelkerke's R 2 (full vs. reduced model; R 2 = 0.27 vs. R 2 = 0.18, = 323.2, P < 0.001).
Discussion
The present study showed that several maternal and family characteristics were associated with preschool children's dietary patterns and that maternal diet was the factor most strongly associated with them, above and beyond socio‐economic and demographic characteristics, accounting for one‐third of the determination coefficient in the fully adjusted model.
Using LCA to identify dietary patterns is an advantage as it is especially well suited for categorical variables asymmetrically distributed, common in data from FFQ, resulting in attenuation of correlations between items. LCA uses Pearson's correlation coefficients and de‐attenuates these correlations. Additionally, as highlighted by Muthén & Muthén (2000), this methodology avoids subjective choice of cut‐points on underlying dimensions, because the classification is provided directly by the model. Finally, it can be compared with factor analysis (Muthén & Muthén, 2000), enabling comparison with studies that use principal component analysis.
Two studies conducted in the UK identified three dietary patterns practised at both 3 (North & Emmett, 2000) and 4 years of age (Northstone & Emmett, 2005): a ‘traditional’ pattern characterized by meat and vegetables; a ‘junk’ pattern characterized by high‐fat processed foods and snacks (comparable with the present EDF pattern); and a ‘health‐conscious’ pattern rich in vegetarian style foods, rice, pasta, fruit, cheese and fish (comparable with the current Healthier pattern). Additionally, in the study examining 3‐year‐olds (North & Emmett, 2000), a ‘snack’ dietary pattern – partly comparable with the current Snacking pattern – was identified. Two other studies identified dietary patterns comparable with the current EDF pattern: a ‘Processed and fast foods’ pattern identified in multi‐time points (2, 3 and 5 years) in French children (Lioret et al. 2015) and a ‘Snacky’ pattern identified in Greek 4‐year‐olds (Leventakou et al. 2015). Similar associations with maternal age and education were found in all samples. In contrast, maternal work status was significantly associated with children's dietary patterns in the UK sample but not in the Portuguese or Greek samples. As for maternal smoking status, present results are consistent with both the UK and Greek samples.
We only found one study including an overall measure of maternal diet (Fisk et al. 2011). In 1640 3‐year‐olds from the UK, results were consistent with present findings, with maternal diet being shown as the most important factor associated with children's diet. Despite not assessing children's or mothers' dietary patterns, other studies support these findings with consistent positive associations between children's and parents' consumption of specific foods (Fisher et al. 2000; Fisher et al. 2002; Cooke et al. 2003; Vereecken et al. 2004; Wyse et al. 2011; McGowan et al. 2012).
Finding that different factors within the family context were associated with distinct dietary patterns deserves to be discussed. The EDF pattern was more likely among children with only older siblings. In a previous study conducted in a subsample of 2‐year‐olds enrolled in this cohort (Vilela et al. 2014), a similar association was found, consistent with findings from both the UK and French samples (Northstone & Emmett, 2005; Lioret et al. 2015). Older children have been reported to be more exposed to energy‐dense micronutrient‐poor foods and beverages (Rangan et al. 2008), and it is possible that older children influence younger siblings. In contrast, children mainly cared by a parent during daytime, as well as those with only younger siblings, were significantly more likely to follow the Snacking pattern. Regarding parents as main daytime caregivers and keeping in mind that children model behaviours from their peers (Schunk, 1987), lower exposure to other children at the kindergarten may explain this finding. Concerning siblings, it is possible that mothers having to attend to younger children are overburdened and may have less time to prepare healthy meals.
In respect to maternal control over the child's diet, we did not find studies examining patterns of both child‐feeding practices and children's diet. However, comparable findings have been reported. Monitoring was negatively associated with unhealthier eating (Arredondo et al. 2006), and restriction (Ystrom et al. 2012) was positively associated with a wholesome dietary pattern.
Possible limitations inherent to the use of FFQ to assess maternal and children's diet deserve discussion. Estimation of dietary intake using frequency and not quantities could be considered a limitation, but inclusion of additional questions on portion sizes may reduce validity (Willett, 1998). Taking into account that at 4 years of age a 3‐day food diary may not be the ideal method to represent consumption of foods eaten less frequently, the week‐to‐moderate correlations and fair‐to‐moderate agreement found for foods most frequently consumed support an acceptable validity and reliability of the FFQ. Also, comparison of the dietary patterns with 3‐day food diaries showed that the EDF pattern was significantly higher in energy when compared with the other two patterns and that the Snacking pattern was significantly lower in fibre, supporting the methodology used to asses children's diet. Using an adapted FFQ for assessment of maternal diet could be regarded as a limitation, but, as it was adapted from a previously validated questionnaire (Lopes et al. 2007; Pinto et al. 2010), its use was considered acceptable.
Inclusion of a subsample and exclusion of participants owing to missing data could introduce some bias into the analysis. We conducted sensitivity‐analyses fitting models with the highest possible number of subjects for each variable and compared them with models considering complete‐subject analysis (not shown), and results were very similar. A previous study (Teixeira et al. 2015) managed missing data using full‐information maximum likelihood estimation, and comparison of this model with the model excluding missing values suggested that substantial bias was not expected (Cohen's κ = 0.85). Considering that this analysis was performed in the same sample frame, we do not expect that alternative methods to manage missing data would result in different conclusions. In addition, given that Cohen's effect size values were not high, the slight differences between this sample and the remaining cohort are likely due to large sample size, rather than to large differences between participants (Husted et al. 2000). As such, assuming ‘missing completely at random’, the complete‐subject analysis was considered valid within the limits of this study (Greenland & Rothman, 2008).
In order to assess social desirability bias, we stratified the analysis by maternal weight status. As overweight mothers reported higher consumption of crisps and soft drinks and lower consumption of fruit and vegetables, this bias seems unlikely. Still, mothers may have incorrectly reported foods eaten out of home. Considering that a previous study (Moreira et al. 2015) conducted in this cohort at child's 4 years of age showed that most meals were taken at home, we do not expect that out‐of‐home consumption would result in different findings. However, associations between maternal and child's diet may have been overestimated, because assessment was performed at the same time by the same individual. Considering that limitations in general cognitive competencies are an obstacle to self‐reporting among young children (Bevans et al. 2010) and that information was collected by trained interviewers, the approach used was deemed adequate.
Not including paternal characteristics in the present study must be discussed. Fathers from different SEP appear to be increasingly involved in child feeding (Mallan et al. 2013), and two‐parent families have shown to be associated with some dietary behaviours (Patrick & Nicklas, 2005; de Vet et al. 2011) in children. Maternal marital status was considered in order to clarify possible differences between two‐parent and one‐parent families, but no differences were observed. Given this, and taking into account that mothers spend more time caring and feeding young children (Scaglioni et al. 2008; Bauer et al. 2012), not including the father was considered acceptable.
A major strength of the current study was basing the analysis on a predefined theoretical framework. Besides sample size and measurement of several potential determinants, as participants were part of a population‐based birth cohort regularly followed up, we were able to ensure temporal sequence between blocks of variables, allowing for better interpretation of the associations. Additionally, the use of composite measures to assess early maternal SEP, maternal child‐feeding practices, maternal diet and children's diet was also an advantage as it enabled us to better capture their inherent complexity.
In conclusion, early maternal lower SEP indirectly increases the odds of exposing their children to unhealthier dietary patterns, while lower maternal education at child's delivery directly increases these odds. These findings may reflect a transgenerational influence of less‐favourable socio‐economic conditions on children's diet. Specific maternal behaviours are associated with children's dietary patterns, above and beyond socio‐economic and demographic factors, and maternal diet is a key factor to the child's diet.
Future research should further study the mechanisms by which SEP influences children's diet, including the effect of life‐course changes in SEP. Also, special attention must be given to the identification of those determinants with higher impact on preschool children's diet, because this period of life may be a window of opportunity for action. Finally, interventions developed with the aim of preventing unhealthy dietary behaviours among preschool children should involve mothers with particular focus on their diet and pay special attention to lower socio‐economic status groups.
Source of funding
Generation XXI was funded by Programa Operacional de Saúde (Regional Department of Ministry of Health). It has support from the Portuguese Foundation for Science and Technology (FCT) and from the Calouste Gulbenkian Foundation. This study was supported through FEDER from the Operational Programme Factors of Competitiveness – COMPETE and through national funding from the FCT (Portuguese Ministry of Education and Science) within the project PTDC/SAU‐EPI/121532/2010 (FCOMP‐01‐0124‐FEDER‐021177). The work of CD was supported by the FCT (SFRH/BD/81788/2011).
Conflicts of interest
The authors declare that they have no conflict of interest.
Contributions
CD contributed to the design of the study, performed statistical analyses, drafted the initial manuscript and contributed to the interpretation of data. MS carried out statistical analysis, contributed to the interpretation of data and critically revised the manuscript. AO contributed to the design of data collection instruments, contributed to the interpretation of data and critically reviewed the manuscript. PM contributed to the interpretation of data and critically reviewed the manuscript. AG contributed to the interpretation of data and discussion of the results and critically reviewed the manuscript. HB conceptualized and designed the study, coordinated and supervised data collection, contributed to the discussion of results and critically reviewed the manuscript. CL contributed to the design of study, contributed to the design of data collection instruments, contributed to the discussion of results and critically reviewed the manuscript. All authors approved the final manuscript as submitted.
Acknowledgements
The authors gratefully acknowledge the families enrolled in Generation XXI for their kindness, all members of the research team for their enthusiasm and perseverance, and the participating hospitals and their staff for their help and support
Durão, C. , Severo, M. , Oliveira, A. , Moreira, P. , Guerra, A. , Barros, H. , and Lopes, C. (2017) Association of maternal characteristics and behaviours with 4‐year‐old children's dietary patterns. Maternal & Child Nutrition, 13: e12278. doi: 10.1111/mcn.12278.
References
- Ambrosini G.L., Emmett P.M., Northstone K. & Jebb S.A. (2013) Tracking a dietary pattern associated with increased adiposity in childhood and adolescence. Obesity (Silver Spring) 22, 458–465. [DOI] [PMC free article] [PubMed] [Google Scholar]
- Arredondo E., Elder J., Ayala G., Campbell N., Baquero B. & Duerksen S. (2006) Is parenting style related to children's healthy eating and physical activity in Latino families? Health Education Research 21, 862–71. [DOI] [PubMed] [Google Scholar]
- Bauer K.W., Hearst M.O., Escoto K., Berge J.M. & Neumark‐Sztainer D. (2012) Parental employment and work–family stress: associations with family food environments. Social Science & Medicine 75, 496–504. [DOI] [PMC free article] [PubMed] [Google Scholar]
- Bevans K., Riley A., Moon J. & Forrest C. (2010) Conceptual and methodological advances in child‐reported outcomes measurement. Expert Review of Pharmacoeconomics & Outcomes Research 10, 385–396. [DOI] [PMC free article] [PubMed] [Google Scholar]
- Birch L.L., Fisher J., Grimm‐Thomas K., Markey C., Sawyer R. & Johnson S. (2001) Confirmatory factor analysis of the Child Feeding Questionnaire: a measure of parental attitudes, beliefs and practices about child feeding and obesity proneness. Appetite 36, 201–210. [DOI] [PubMed] [Google Scholar]
- Cohen S., Janicki‐Deverts D., Chen E. & Matthews K.A. (2010) Childhood socioeconomic status and adult health. Annals of the New York Academy of Sciences 1186, 37–55. [DOI] [PubMed] [Google Scholar]
- Cooke L.J., Wardle J., Gibson E.L., Sapochnik M., Sheiham A. & Lawson M. (2003) Demographic, familial and trait predictors of fruit and vegetable consumption by pre‐school children. Public Health Nutrition 7, 295–302. [DOI] [PubMed] [Google Scholar]
- Davison K.K. & Birch L.L. (2001) Childhood overweight: a contextual model and recommendations for future research. Obesity Reviews 2, 159–171. [DOI] [PMC free article] [PubMed] [Google Scholar]
- De Craemer M., De Decker E., De Bourdeaudhuij I., Vereecken C., Deforche B., Manios Y. et al. (2012) Correlates of energy balanced‐related behaviors in preschool children: a systematic review. Obesity Reviews 13, s13–s28. [DOI] [PubMed] [Google Scholar]
- De Vet E., De Ridder D.T.D. & De Wit J.B.F. (2011) Environmental correlates of physical activity and dietary behaviours among young people: a systematic review of reviews. Obesity Reviews 12, e130–e142. [DOI] [PubMed] [Google Scholar]
- Durão C., Andreozzi V., Oliveira A., Moreira P., Guerra A., Barros H. et al. (2015) Maternal child‐feeding practices and dietary inadequacy of 4‐year‐old children. Appetite 92, 15–23. [DOI] [PubMed] [Google Scholar]
- Fisher J.O., Mitchell D.C., Smiciklas‐Wright H. & Birch L.L. (2000) Maternal milk consumption predicts the tradeoff between milk and soft drinks in young girls' diets. The Journal of Nutrition 131, 246–250. [DOI] [PMC free article] [PubMed] [Google Scholar]
- Fisher J.O., Mitchell D.C., Smiciklas‐Wright H. & Birch L.L. (2002) Parental influences on young girls' fruit and vegetable, micronutrient, and fat intakes. Journal of the American Dietetic Association 102, 58–64. [DOI] [PMC free article] [PubMed] [Google Scholar]
- Fisk C.M., Crozier S.R., Inskip H.M., Godfrey K.M., Cooper C. & Robinson S.M. (2011) Influences on the quality of young children's diets: the importance of maternal food choices. British Journal of Nutrition 105, 287–296. [DOI] [PubMed] [Google Scholar]
- González C.A., Argilaga S., Amiano P., Barricarte A., Beguiristain J.M., Chirlaque M.D. et al. (2002) Diferencias sociodemográficas en la adhesión al patrón de dieta mediterránea en poblaciones de España. Gaceta Sanitaria 16, 214–221. [DOI] [PubMed] [Google Scholar]
- Greenland S. & Rothman K. (2008) Fundamentals of epidemiologic data analysis In: Modern Epidemiology (eds Rothman K., Greenland S. & Lash T.), pp 219 Lippincot Williams & Wilkins: Philadelphia. [Google Scholar]
- Husted J.A., Cook R.J., Farewell V.T. & Gladman D.D. (2000) Methods for assessing responsiveness: a critical review and recommendations. Journal of Clinical Epidemiology 53, 459–468. [DOI] [PubMed] [Google Scholar]
- Lakshman R., Paes V.M., Hesketh K., O'Malley C., Moore H., Ong K. et al. (2013) Protocol for systematic reviews of determinants/correlates of obesity‐related dietary and physical activity behaviors in young children (preschool 0 to 6 years): evidence mapping and syntheses. Systematic Reviews 2, 28. [DOI] [PMC free article] [PubMed] [Google Scholar]
- Larsen P., Kamper‐Jørgensen M., Adamson A., Barros H., Bonde J., Brescianini S. et al. (2013) Pregnancy and birth cohort resources in Europe: a large opportunity for aetiological child health research. Paediatric and Perinatal Epidemiology 27, 393–414. [DOI] [PubMed] [Google Scholar]
- Leventakou V., Sarri K., Georgiou V., Chatzea V., Frouzi E., Kastelianou A. et al. (2015) Early life determinants of dietary patterns in preschool children: Rhea mother–child cohort, Crete, Greece. European Journal of Clinical Nutrition. DOI: 10.1038/ejcn.2015.93[Epub ahead of print]. [DOI] [PubMed] [Google Scholar]
- Lioret S., Betoko A., Forhan A., Charles M., Heude B. & De Lauzon‐Guillain B. (2015) Dietary patterns track from infancy to preschool age: cross‐sectional and longitudinal perspectives. Journal of Nutrition 145, 775–782. [DOI] [PubMed] [Google Scholar]
- Lopes C., Aro A., Azevedo A., Ramos E. & Barros H. (2007) Intake and adipose tissue composition of fatty acids and risk of myocardial infarction in a male Portuguese community sample. Journal of the American Dietetic Association 107, 276–286. [DOI] [PubMed] [Google Scholar]
- Mallan K.M., Nothard M., Thorpe K., Nicholson J.M., Wilson A., Scuffham P.A. et al. (2013) The role of fathers in child feeding: perceived responsibility and predictors of participation. Child: Care, Health and Development 4, 715–722. [DOI] [PubMed] [Google Scholar]
- McGowan L., Croker H., Wardle J. & Cooke L.J. (2012) Environmental and individual determinants of core and non‐core food and drink intake in preschool aged children in the United Kingdom. European Journal of Clinical Nutrition 66, 322–328. [DOI] [PMC free article] [PubMed] [Google Scholar]
- Mikkila V., Rasanen L., Raitakari O.T., Pietinen P. & Viikari J. (2005) Consistent dietary patterns identified from childhood to adulthood: the cardiovascular risk in Young Finns Study. British Journal of Nutrition 93, 923–931. [DOI] [PubMed] [Google Scholar]
- Moreira I., Severo M., Oliveira A., Durão C., Moreira P., Barros H. et al. (2014) Social and health behavioural determinants of maternal child‐feeding patterns in preschool‐aged children. Maternal & Child Nutrition. DOI: 10.1111/mcn.12132[Epub ahead of print]. [DOI] [PMC free article] [PubMed] [Google Scholar]
- Moreira T., Severo M., Oliveira A., Ramos E., Rodrigues S. & Lopes, C. 2015. Eating out of home and dietary adequacy in preschool children. British Journal of Nutrition. DOI: 10.1017/S0007114515001713. (Epub ahead of print). [DOI] [PubMed] [Google Scholar]
- Muthén B. & Muthén L. (2000) Integrating person‐centered and variable‐centered analyses: growth mixture modeling with latent trajectory classes. Alcoholism: Clinical and Experimental Research 24, 882–891. [PubMed] [Google Scholar]
- Nagelkerke N.J.D. (1991) A note on a general definition of the coefficient of determination. Biometrika 78, 691–692. [Google Scholar]
- North K. & Emmett P. (2000) Multivariate analysis of diet among three‐year‐old children and associations with socio‐demographic characteristics. European Journal of Clinical Nutrition 54, 73–80. [DOI] [PubMed] [Google Scholar]
- Northstone K. & Emmett P. (2005) Multivariate analysis of diet in children at four and seven years of age and associations with socio‐demographic characteristics. European Journal of Clinical Nutrition 59, 751–760. [DOI] [PubMed] [Google Scholar]
- Northstone K. & Emmett P. (2008) Are dietary patterns stable throughout early and mid‐childhood? A birth cohort study. British Journal of Nutrition 100, 1069–1076. [DOI] [PMC free article] [PubMed] [Google Scholar]
- Ogden J., Reynolds R. & Smith A. (2006) Expanding the concept of parental control: a role for overt and covert control in children's snacking behaviour? Appetite 47, 100–106. [DOI] [PubMed] [Google Scholar]
- Patrick H. & Nicklas T. (2005) A review of family and social determinants of children's eating patterns and diet quality. The Journal of the American College of Nutrition 24, 83–92. [DOI] [PubMed] [Google Scholar]
- Pinto E., Severo M., Correia S., Dos Santos Silva I., Lopes C. & Barros H. (2010) Validity and reproducibility of a semi‐quantitative Food Frequency Questionnaire for use among Portuguese pregnant women. Maternal & Child Nutrition 6, 105–119. [DOI] [PMC free article] [PubMed] [Google Scholar]
- Rangan A.M., Randall D., Hector D.J., Gill T.P. & Webb K.L. (2008) Consumption of ‘extra’ foods by Australian children: types, quantities and contribution to energy and nutrient intakes. European Journal of Clinical Nutrition 62, 356–364. [DOI] [PubMed] [Google Scholar]
- Real H., Oliveira A., Severo M., Moreira P. & Lopes C. (2014) Combination and adaptation of two tools to assess parental feeding practices in pre‐school children. Eating Behaviors 15, 383–387. [DOI] [PubMed] [Google Scholar]
- Savage J., Fisher J. & Birch L. (2007) Parental influence on eating behaviour: conception to adolescence. The Journal of Law, Medicine & Ethics 35, 22–34. [DOI] [PMC free article] [PubMed] [Google Scholar]
- Scaglioni S., Salvioni M. & Galimberti C. (2008) Influence of parental attitudes in development of children eating behaviour. British Journal of Nutrition 99, s22–s25. [DOI] [PubMed] [Google Scholar]
- Schunk D.H. (1987) Peer models and children's behavioral change. Review of Educational Research 57, 149–174. [Google Scholar]
- Severo M., Gaio A.R., Lourenço P., Alvelos M., Gonçalves A., Lunet N. et al. (2012) Diagnostic value of patterns of symptoms and signs of heart failure: application of latent class analysis with concomitant variables in a cross‐sectional study. British Medical Journal Open 2 pii:e001510. DOI: 10.1136/bmjopen-2012-001510. [DOI] [PMC free article] [PubMed] [Google Scholar]
- Solar O. & Irwin A. 2010. A conceptual framework for action on the social determinants of health. Social Determinants of Health Discussion Paper 2 (Policy and Practice). Discussion Paper Series on Social Determinants of Health. WHO: Geneva.
- Teixeira C., Silva S., Severo M. & Barros H. (2015) Socioeconomic position early in adolescence and mode of delivery later in life: findings from a Portuguese birth cohort. PLoS One 10, e0119517. [DOI] [PMC free article] [PubMed] [Google Scholar]
- UNICEF (1990) Strategy for Improved Nutrition of Children and Women in Developing Countries. A UNICEF Policy Review. UNICEF: New York. [Google Scholar]
- Vereecken C.A., Keukelier E. & Maes L. (2004) Influence of mother's educational level on food parenting practices and food habits of young children. Appetite 43, 93–103. [DOI] [PubMed] [Google Scholar]
- Vermunt J.K. & Magidson J. 2002. Latent class cluster analysis. In: Applied Latent Class Models (eds J. Hagenaars & A. Mccutcheon) Cambridge University Press: Cambridge.
- Victora C.G., Huttly S.R., Fuchs S.C. & Olinto M.T. (1997) The role of conceptual frameworks in epidemiological analysis: a hierarchical approach. International Journal of Epidemiology 26, 224–227. [DOI] [PubMed] [Google Scholar]
- Vilela S., Oliveira A., Pinto E., Moreira P., Barros H. & Lopes C. (2014) The influence of socioeconomic factors and family context on energy‐dense food consumption among 2‐year‐old children. European Journal of Clinical Nutrition 69, 47–54. [DOI] [PubMed] [Google Scholar]
- Waters E., De Silva‐Sanigorski A., Burford B., Brown T., Campbell K., Gao Y. et al. (2011) Interventions for preventing obesity in children. Cochrane Database of Systematic Reviews 12, 1–191. [DOI] [PubMed] [Google Scholar]
- WHO (2006) WHO Child Growth Standards: Length/height‐for‐age, Weight‐for‐age, Weight‐for‐length, Weight‐for‐height and Body Mass Index‐for‐age: Methods and Development [Online]. WHO: Geneva. [Google Scholar]
- Willett W.C. (1998) Food‐frequency methods In: Nutritional Epidemiology (ed. Willett W.C.), 2nd edn, pp 83–87. Oxford University Press: New York. [Google Scholar]
- World Medical Association (2013) World Medical Association Declaration of Helsinki: ethical principles for medical research involving human subjects. Journal of the American Medical Association 310, 2191–2194. [DOI] [PubMed] [Google Scholar]
- Wyse R., Campbell E., Nathan N. & Wolfenden L. (2011) Associations between characteristics of the home food environment and fruit and vegetable intake in preschool children: a cross‐sectional study. BioMed Central Public Health 11, 938. [DOI] [PMC free article] [PubMed] [Google Scholar]
- Ystrom E., Barker M. & Vollrath M.E. (2012) Impact of mothers' negative affectivity, parental locus of control and child‐feeding practices on dietary patterns of 3‐year‐old children: the MoBa Cohort Study. Maternal & Child Nutrition 8, 103–114. [DOI] [PMC free article] [PubMed] [Google Scholar]
- Zarnowiecki D.M., Dollman J. & Parletta N. (2014) Associations between predictors of children's dietary intake and socioeconomic position: a systematic review of the literature. Obesity Reviews 15, 375–391. [DOI] [PubMed] [Google Scholar]