Abstract
Although imbalanced functional integration has been increasingly reported in major depressive disorder (MDD), there still lacks a general framework to characterize common characteristic and origin shared by the integrative disturbances. Here we examined spatial selectivity, temporal uniqueness, metabolic basis, and therapeutic response of altered functional connectivity (FC) in MDD by analyzing both cross‐sectional and longitudinal multimodal functional magnetic resonance imaging data from 35 patients and 34 demographically matched healthy controls. First, based on a voxel‐wise, data‐driven, graph‐based degree centrality approach, the bilateral anterior cingulate gyri, middle frontal gyri and superior frontal gyri, and the right parahippocampal gyrus were robustly identified to show decreased FC in MDD. Further spatiotemporal analyses revealed that these regions exhibited hub‐like features and were selectively located in limbic and default mode networks spatially and, relative to other areas in the brain, exhibited unique, frequency‐dependent oscillation power (stronger within 0.01–0.027 Hz and weaker within 0.027–0.073 Hz) and less dynamical variability of whole‐brain FC profiles temporally. Moreover, a cross‐modality fusion analysis showed that all MDD‐related FC impairments were associated with reduced cerebral blood flow (CBF); however, there existed multiple regions that showed reduced CBF but had intact FC in the patients, which resulted in a decreased FC‐CBF coupling and implied an earlier emergence of reduced CBF than impaired FC in MDD. Finally, the disrupted FC in MDD gradually recovered over the course of drug treatment (2 and 12 weeks). Altogether, these findings could help establish a general framework to provide mechanistic insights into integrative dysfunctions in MDD.
Keywords: brain hub, cerebral blood flow, default mode network, functional connectivity, limbic system, major depressive disorder
1. INTRODUCTION
Major depressive disorder (MDD) is a prevalent psychiatric disorder worldwide (Kessler et al., 2007) and is accompanied by cognitive impairments in multiple domains, including executive function, memory, and emotional processing (Gotlib & Joormann, 2010). Neuroimaging studies, particularly those based on resting‐state blood oxygenation level‐dependent functional magnetic resonance imaging (BOLD fMRI), show that MDD is associated with imbalanced interregional functional integration of distributed large‐scale brain networks (Gong & He, 2015; Kaiser, Andrews‐Hanna, Wager, & Pizzagalli, 2015), thus leading to conceptual views of MDD as a brain network dysfunctional syndrome. However, despite the well‐documented patterns in previous literature, MDD‐related integrative dysfunctions are not yet completely understood, mainly due to the lack of a general framework to characterize their common characteristic and origin.
Functional connectivity (FC), which is defined as statistical interdependence of neural activity among anatomically separated brain regions, is extensively used to characterize integrative architecture of the human brain (Van Dijk et al., 2010). With FC methods, researchers have consistently observed many nontrivial features of healthy brains. One of the most fascinating findings is that instead of a random and uniform distribution over the entire brain, FC is largely shaped by underlying structural pathways (thus forming functionally coherent subnetworks or modules) and disproportionately converges on a specific set of association cortex regions (i.e., brain hubs) (van den Heuvel & Sporns, 2013; Sporns & Betzel, 2016). In addition to topographic characteristics, recent studies further find that FC is associated with the temporal oscillation power of the involved region (Zhang et al., 2016) and dynamically varies over time (Liao, Cao, Xia, & He, 2017; Zhang et al., 2016). Moreover, FC is demonstrated to be coupled with regional cerebral blood flow (CBF) and rates of metabolism such that highly connected hubs have more CBF and higher rates of metabolism (Liang, Zou, He, & Yang, 2013; Tomasia, Wang, & Volkow, 2013). Finally, FC can be significantly modulated by various endogenous processes and external interventions. For instance, drugs are consistently found to be capable of regulating strength of interregional FC (McCabe & Mishor, 2011) and whole‐brain network efficiency (Achard & Bullmore, 2007). All these findings from healthy subjects indicate that FC possesses structured spatial patterns and temporal organization, has a physiological basis, and can serve as potential biomarkers for therapeutic evaluation. However, to date, there has been no comprehensive examination of unique spatiotemporal characteristics, metabolic substrate, and therapeutic response of altered FC in MDD.
Aiming at addressing the aforementioned issues, here we conducted a series of analyses of both cross‐sectional and longitudinal multimodal fMRI data from 35 patients with MDD and 34 matched healthy controls (HCs). First, we employed resting‐state BOLD fMRI to identify regions that exhibited MDD‐related FC alterations using a voxel‐wise, data‐driven, graph‐based degree centrality (DC) approach. Then, for the identified regions, we examined their spatial selectivity in the context of brain hub topography and functional module architecture and their unique temporal organization in terms of low‐frequency oscillation power [indexed by amplitude of low frequency fluctuations, ALFF (Zang et al., 2007), and fractional ALFF, fALFF (Zou et al., 2008)] and temporal variability of whole‐brain FC profile [indexed by temporal variability, TV (Zhang et al., 2016)]. Furthermore, we performed a cross‐modality fusion analysis to determine whether the observed FC alterations in MDD have a metabolic basis by linking them with regional CBF derived from resting‐state arterial spin labeling fMRI (ASL fMRI). Additionally, we examined the concordance and dissociation of FC and CBF in revealing MDD‐related functional alterations. Finally, we utilized a longitudinal design to explore whether the observed MDD‐related FC abnormalities could be normalized via sustained drug treatment (2 weeks and 12 weeks). We believe that integrating these analyses on the same cohort of patients will help establish a general model for understanding network disorganization in MDD.
2. MATERIALS AND METHODS
2.1. Participants
All participants included in this study were screened from an ongoing follow‐up project that aims to explore the relationships between baseline brain architecture and clinical outcomes of patients with MDD after antidepressant treatment by using multimodal MRI data. Specifically, a total of 69 right‐handed participants were included in this study for baseline analysis, including 35 patients with MDD who were recruited from outpatients and inpatients of the Sir Run Run Shaw Hospital, School of Medicine, Zhejiang University, Hangzhou, China, and 34 HCs who were recruited from the local community via advertisement. MDD was diagnosed according to the DSM‐IV‐TR criteria, using the Structured Clinical Interview for DSM‐IV (SCID)‐I. Exclusion criteria included (a) severe suicidal tendency; (b) pregnant or lactating women; (c) any physical diseases as assessed by personal history; (d) a history of organic brain disorders, neurological disorders, other psychiatric disorders, or cardiovascular diseases; and (e) a history of substance abuse including tobacco, alcohol, or other psychoactive substances. All the patients had a 17‐item Hamilton Rating Scale for Depression (HAMD) score ≥ 18 and a Mood Disorder Questionnaire (MDQ) score < 7 at baseline, and were free of psychotropic medications for at least 4 weeks before the baseline MRI scan. Out of the 35 patients with MDD, 21 were first episode and drug naive. To assess the therapeutic response of FC, 28 and 18 patients with MDD were successfully followed up after 2‐week and 12‐week antidepressant drug treatment, respectively. In addition, out of the 34 HCs, 31 and 30 separately completed 2‐week and 12‐week follow‐up. This study was approved by the Ethics Committee of the Sir Run Run Shaw Hospital, School of Medicine, Zhejiang University, and the Affiliated Hospital of Hangzhou Normal University. All participants gave written informed consent.
2.2. Multimodal MRI acquisition
All MRI data were acquired using a 3.0 T MR scanner (GE Discovery MR750, GE Medical Systems, Milwaukee, WI) equipped with an eight‐channel head coil array.
2.2.1. BOLD fMRI data
The resting‐state BOLD fMRI data were obtained axially using a single‐shot, gradient‐recalled echo‐planar imaging sequence parallel to the line of the anterior–posterior commissure. The acquisition parameters were as follows: 37 slices, repetition time (TR) = 2,000 ms, echo time (TE) = 30 ms, flip angle (FA) = 90°, field of view (FOV) = 220 × 220 mm2, matrix = 128 × 128, slice thickness = 3.2 mm, and no gap. A total of 184 volumes were acquired for each participant.
2.2.2. ASL fMRI data
The resting‐state ASL fMRI data were acquired with a 3D pseudo‐continuous arterial spin labeling sequence: 72 axial slices, TR = 4632 ms, TE = 10.5 ms, FOV = 240 × 240 mm2, matrix = 128 × 128, slice thickness = 4 mm, no gap, number of excitation = 3, and postlabeling delay = 1525 ms.
2.2.3. Structural MRI data
High‐resolution T1‐weighted images were also acquired for each participant with a three‐dimensional spoiled gradient‐recalled sequence: 176 axial slices, TR = 8.1 ms, TE = 3.1 ms, FA = 8°, FOV = 250 × 250 mm2, matrix = 256 × 256, slice thickness = 1.0 mm, and no gap.
2.3. Multimodal fMRI Data Processing
All the MRI data were processed using the SPM12 (http://www.fil.ion.ucl.ac.uk/spm/software/spm12/) and GRETNA (Wang et al., 2015a) toolboxes and custom Matlab codes unless stated otherwise.
2.3.1. BOLD fMRI data
For individual BOLD fMRI data, the first five volumes were removed to allow for T1 equilibration effects. The remaining images were then corrected for intra‐volume temporal offsets (Sinc interpolation) and intervolume head motion (six‐parameter rigid‐body transformation). The mean frame‐wise displacement was <0.06 for all participants and did not differ significantly between the two groups (HCs: 0.019 ± 0.009, MDD: 0.017 ± 0.010; p = .528). Subsequently, the corrected images were spatially normalized into the standard Montreal Neurological Institute (MNI) space using the transformation fields derived from tissue segmentation of individual structural images and resampled to 3‐mm isotropic voxels. The normalized images further underwent removal of linear drifts and temporal band‐pass filtering (0.01–0.1 Hz). Finally, several nuisance signals—including 24‐parameter head motion profiles (Friston, Williams, Howard, Frackowiak, & Turner, 1996), white matter, and cerebrospinal fluid signals—were regressed out from each voxel's time series to exclude non‐neuronal sources. We did not perform spatial smoothing to avoid introducing artificial local FC.
After these data preprocessing steps, we first calculated voxel‐wise DC, which was used to identify regions that exhibit MDD‐related FC alterations. DC, also referred to as FC density in brain network studies, is a graph‐based metric that quantifies the overall connectivity of a node to all other nodes in a network. Briefly, for a given voxel, its time series was extracted and correlated with the time series of all other voxels in the brain. The summation of the resultant correlation coefficients (i.e., DC) was then calculated and assigned to the given voxel. To exclude the confounding effects of spurious correlations, correlation coefficients with values <0.25 were excluded prior to the summation (Buckner et al., 2009). Negative correlations were also excluded due to their ambiguous interpretation (Fox, Zhang, Snyder, & Raichle, 2009; Murphy, Birn, Handwerker, Jones, & Bandettini, 2009). These procedures were iteratively conducted for each voxel to derive a DC map for each participant. The resultant DC maps were further spatially smoothed with a Gaussian kernel [full‐width at half‐maximum (FWHM) = 6 mm]. In this study, we performed a series of validation analyses to examine the effects of several factors on between‐group DC comparison. Specifically, four factors were studied: (a) Network type: In addition to the weighted DC mentioned above (i.e., the summation of suprathreshold correlation coefficients), we computed binary DC as the number of suprathreshold correlation coefficients. (b) Anatomical distance: Before the DC calculation, all suprathreshold correlations were divided into two subsets according to the anatomical distance between two voxels (cutoff value = 75 mm), where anatomical distance was defined as the Euclidean distance between stereotaxic coordinates of two voxels. (c) Correlation threshold: Besides 0.25, several other correlation thresholds were used to calculate the DC, including 0.1, 0.15, 0.2, 0.3, 0.35, and 0.4. and (d) Episode and medication: We restricted between‐group DC comparison between 21 first‐episode and drug‐naïve patients and the HCs.
To characterize the unique temporal features of regions showing MDD‐related DC alterations, we further calculated three other voxel‐wise measures: ALFF (Zang et al., 2007), fALFF (Zou et al., 2008), and TV (Zhang et al., 2016). For a given voxel, the ALFF and fALFF separately measure the absolute and relative oscillation power or energy of its time series, and the TV reflects the extent to which its whole‐brain FC pattern varies over time. Briefly, for a time series x(t), the ALFF was calculated as the sum of the square roots of its power spectrum within a predefined frequency range, and the fALFF was calculated as the ALFF within a given frequency range divided by the ALFF over the entire frequency range detectable in x(t). In this study, the ALFF/fALFF was computed within the low‐frequency range of 0.01–0.1 Hz that was commonly used in previous resting‐state brain network studies and within two subfrequency bands of slow‐5 (0.01–0.027 Hz) and slow‐4 (0.027–0.073 Hz). Notably, the BOLD fMRI data used for the ALFF/fALFF calculation did not undergo temporal band‐pass filtering but instead were spatially smoothed (Gaussian kernel, FWHM = 6 mm). With regard to the TV, we first segmented the whole time series of each voxel into a series of nonoverlapping windows with a fixed length (10, 15, and 20 TR, respectively). Within each of the resultant time windows, we then calculated the whole‐brain FC (Pearson correlation) for each voxel in the brain, therefore generating n×m FC maps for each participant (where n is the number of time windows and m is the number of voxels in the brain). Finally, for a given voxel, the TV was defined as the mean spatial correlation among all pairs of the n FC maps, followed by a subtraction from 1. For more details for computing the ALFF, fALFF, and TV, please refer to Zang et al. (2007), Zhang et al. (2016), and Zou et al. (2008).
Notably, all the DC, ALFF, fALFF, and TV calculations were restricted within a study‐specific brain mask that was derived according to the following two criteria: (a) nonzero variance of BOLD signals for all the participants and (b) > 20% gray matter tissue probability in terms of the prior tissue probability map released in the SPM12 package.
2.3.2. ASL fMRI data
For the ASL fMRI data, individual CBF images were first obtained using Functool (version 12.2.01), an automated image postprocessing tool embedded in the GE healthcare MR‐750 system. Subsequently, the CBF images were spatially normalized to the standard MNI space (using the transformation fields derived from tissue segmentation of structural images), resampled to 3‐mm isotropic voxels, and spatially smoothed (Gaussian kernel with FWHM = 6 mm). Again, the CBF analysis was restricted within a study‐specific brain mask that was derived according to the following criteria: (a) nonzero variance of CBF across all participants; (b) non‐negative CBF for all participants; and (c) >20% gray matter tissue probability in terms of the prior map provided in the SPM12 package.
2.4. Statistical analysis
2.4.1. MDD‐related FC alterations
A voxel‐wise two‐sample t test was used to examine between‐group differences in baseline DC maps with age, gender, education, and mean frame‐wise displacement as covariates. To correct for the multiple comparisons, the 3dClustSim procedure was used with a height threshold of p < .001 (Woo, Krishnan, & Wager, 2014) and an extent threshold of p < .05, which corresponded to a corrected p < .05. Specifically, a mixed spatial autocorrelation function model was used in the 3dClustSim procedure, which efficiently controlled for false positive rates (Cox, Chen, Glen, Reynolds, & Taylor, 2017).
2.4.2. Spatial selectivity of MDD‐related FC alterations
To characterize MDD‐related FC alterations spatially, we examined their spatial distribution in the context of hub topography and modular architecture to test whether MDD‐related FC alterations are selectively located in hubs (i.e., hub susceptibility) and preferentially involved in specific modules (i.e., module specificity). Specifically, two methods were used to test the hub susceptibility. First, we compared the DC between regions with and without MDD‐related FC alterations for the baseline HCs at both the group and individual levels. For the group‐level comparison, the average DC map over all baseline HCs was obtained and fed into an across‐voxel two‐tailed two‐sample t test (independent). Given the huge difference in spatial sizes between regions with and without MDD‐related FC alterations (368 voxels vs 38,481 voxels), we further performed the following simulation‐based analysis. First, we randomly selected 368 voxels from the average DC map of the baseline HCs and calculated their mean. This procedure was implemented 10,000 times to generate an empirical null distribution, which was then used to determine a p value, indicating the deviation of the real observation (i.e., the mean DC across the 368 voxels that exhibited MDD‐related alterations) from chance operations. For individual‐level comparison, the mean DC was separately calculated within regions with and without MDD‐related FC alterations for each baseline HCs and fed into an across‐subject two‐tailed two‐sample t test (paired). Second, for the baseline HCs, we identified the brain hubs, DC of which was significantly larger than the group average (voxel‐wise one‐tailed one‐sample t test, p < .05, corrected by the 3dClustSim procedure). In terms of whether a given voxel exhibited MDD‐related FC alterations and whether it belonged to hubs, a 2 × 2 crosstab was subsequently constructed with elements representing the frequency distribution of voxels in each category. Finally, a chi‐square test was implemented. With regard to the module specificity, we employed a publicly available brain parcellation atlas that contours seven functional modules of the brain: the default mode network (DMN), the fronto‐parietal network (FPN), the dorsal attention network (DAN), the ventral attention network (VAN), the limbic network (LIN), the visual network (VIN), and the somato‐motor network (SMN) (Yeo et al., 2011). We calculated two measures to quantify the extent of vulnerability of each module to MDD‐related FC alterations: dice coefficient and goodness‐of‐fit. For a given module, the dice coefficient was calculated as 2× the number of voxels within the module that exhibited MDD‐related FC alterations divided by the sum of number of voxels that exhibited MDD‐related FC alterations and number of voxels that belonged to the module, and the goodness‐of‐fit was computed as the difference of the mean value between voxels within and outside the module with respect to the absolute t map derived from between‐group DC comparison. The higher the dice coefficient and goodness‐of‐fit values for a module, the more susceptible the module was to MDD. For each module, we also determined the statistical significance of the resultant goodness‐of‐fit value by constructing a corresponding null distribution formed by 10,000 artificial modules with the same size as the real module.
2.4.3. Temporal characteristics of MDD‐related FC alterations
To characterize MDD‐related FC alterations temporally, we used the same methods as those for analyzing hub susceptibility (i.e., group level: independent t‐ and simulation‐based tests; individual level: paired t test) to examine ALFF, fALFF, and TV differences between regions with and without MDD‐related FC alterations for the baseline HCs.
2.4.4. Metabolic basis of MDD‐related FC alterations
For each region that exhibited MDD‐related FC alterations, we first examined between‐group differences of regional CBF with an independent two‐tailed two‐sample t test. Furthermore, we calculated cross‐modality (i.e., DC vs CBF) Pearson correlation coefficients within each region (across voxels) on the basis of both group‐average and individual DC/CBF maps. Given that neighboring voxels were spatially dependent because of physiological correlations and spatial smoothing, the effective degree of freedom was corrected to estimate the p values for the correlation analyses (Liang et al., 2013). Notably, prior to the correlation analysis, individual DC and CBF maps were separately converted to z‐score maps (subtraction of mean followed by division by standard deviation) to facilitate cross‐modality fusion given different orders of magnitude between the two measures (Liang et al., 2013). Finally, we utilized a non‐parametric approach for a co‐analysis of multimodal brain imaging data (Hayasaka et al., 2006) to determine concordance and dissociation regions where DC and CBF increase or decrease together and do not increase or decrease together, respectively. Specifically, based on the t maps of between‐group differences in DC and CBF (S 1 and S 2), we calculated the concordance combining function U(v) and the dissociation combining functions V(v) and W(v) with the following formulas:
| (1) |
| (2) |
| (3) |
where S 1(v) and S 2(v) are the t values at voxel v in S 1 and S 2, respectively. The width parameter , a positive number, controls the width of the critical region (here, = 0.5), whereas the shape parameter , a positive integer, controls the shape of the critical region (here, = 2) (Hayasaka et al., 2006). The concordance combining function U(v) allows the identification of areas of concordance, where both DC and CBF increase or decrease together, whereas the dissociation combining functions V(v) and W(v) allow the identification of regions of dissociation, where DC and CBF do not increase or decrease together. The resultant combining functions or maps were then thresholded with data‐specific cluster‐defining thresholds. For each of the surviving clusters, a test statistic (i.e., cluster mass) was further calculated as the integration of the image intensity within it. For statistical inference, a permutation test was employed by constructing the empirical distribution of the test statistic based on a random reassignment or permutation procedure of data labels. First, all the DC/CBF maps were mixed and randomly reallocated to two groups. The DC/CBF differences between the two randomized groups were then calculated to generate two artificial t maps. Based on the two artificial t maps, the combining functions U(v), V(v), and W(v) were calculated and thresholded with the same parameters that were used when the data labels were correctly assigned. Finally, the largest cluster mass was recorded among all the surviving clusters to control the family‐wise error rate to correct for multiple comparisons. The permutation procedure was conducted 5,000 times in total to generate a sufficiently reliable empirical distribution of cluster mass. Based on the empirical distribution of cluster mass, corrected p values were assessed for each surviving cluster derived from data with the correct group labels by comparing their cluster mass values to the empirical distribution.
2.4.5. Therapeutic response of MDD‐related FC alterations
To examine whether MDD‐related FC alterations recover following antidepressant treatment, we examined between‐group differences of DC for regions showing MDD‐related FC alterations at baseline after 2‐week and 12‐week follow‐up (two‐sample independent t test; age, gender, education, and mean frame‐wise displacement as covariates). This maximizes the use of samples during the follow‐up. Similar comparisons were also performed for regional CBF.
2.4.6. Clinical relevance of MDD‐related DC alterations
For each region showing MDD‐related FC alterations, a Spearman correlation analysis was used to investigate its relationship with clinical variables (HAMD score, age of onset, duration of current episode, number of episodes, and disease duration) in the patients. In addition, the Spearman correlation was used to examine the relationship between changes in the DC and HAMD scores following antidepressant treatment in the patients.
3. RESULTS
3.1. Demographics and clinical characteristics
There were no significant differences in age, gender or education between the MDD and HCs groups either at baseline or after 2‐week or 12‐week follow‐up (all p > .05; Table 1). The HAMD scores gradually and significantly decreased for the MDD patients after antidepressant treatment (p < .001 for both baseline versus 2‐week follow‐up and 2‐week follow‐up versus 12‐week follow‐up; paired t tests).
Table 1.
Demographics and clinical characteristics
| HCs | MDD | P value | |
|---|---|---|---|
| Baseline | |||
| N (F/M) | 34 (22/12) | 35 (23/12) | 0.929a |
| Age (years) | 42.03 ± 13.66 | 43.37 ± 13.87 | 0.687b |
| Education level (years) | 11.71 ± 4.95 | 9.66 ± 5.25 | 0.103b |
| Handedness (R/L) | 34/0 | 35/0 | >0.999a |
| Age of onset | ‐ | 39.90 ± 13.51 | ‐ |
| Disease duration (years) | ‐ | 3.52 ± 3.78 | ‐ |
| Duration of current episode (years) | ‐ | 1.61 ± 1.91 | ‐ |
| Number of episodes | ‐ | 1.51 ± 0.98 | ‐ |
| HAMD | ‐ | 22.71 ± 3.91 | ‐ |
| Follow‐up (2 weeks) | |||
| N (F/M) | 31 (21/10) | 28 (17/11) | 0.573a |
| Age (years) | 41.26 ± 13.54 | 43.14 ± 13.56 | 0.596b |
| Education level (years) | 11.90 ± 4.93 | 9.61 ± 5.30 | 0.090b |
| Handedness (R/L) | 31/0 | 28/0 | >0.999a |
| HAMD | ‐ | 13.07 ± 5.61 | ‐ |
| Medication (N, average dosage) | |||
| Escitalopram | ‐ | 18 (10.6 mg/d) | ‐ |
| Agomelatine | ‐ | 7 (25 mg/d) | ‐ |
| Venlafaxine | ‐ | 2 (150 mg/d) | ‐ |
| Mirtazapine | ‐ | 1 (45 mg/d) | ‐ |
| Follow‐up (12 weeks) | |||
| N (F/M) | 30 (20/10) | 18 (12/6) | >0.999a |
| Age (years) | 42.43 ± 13.94 | 42.67 ± 13.91 | 0.955b |
| Education level (years) | 11.87 ± 4.70 | 10.94 ± 4.96 | 0.522b |
| Handedness (R/L) | 30/0 | 18/0 | >0.999a |
| HAMD | ‐ | 9.06 ± 6.61 | ‐ |
| Medication (n, average dosage) | |||
| Escitalopram | ‐ | 14 (12.9 mg/d) | ‐ |
| Agomelatine | ‐ | 3 (33.3 mg/d) | ‐ |
| Venlafaxine | ‐ | 1 (75 mg/d) | ‐ |
Note. Abbreviations: HAMD = Hamilton Rating Scale for depression; HCs = healthy controls; F = female; M = male; R = right; L = left; MDD = major depressive disorder.
Data are presented as mean ± SD for continuous variables.
The p values were obtained by Chi‐square tests.
The p values were obtained by two‐sample t tests.
3.2. Decreased functional connectivity in MDD at baseline
Figure 1a shows the mean DC map for the HCs. The most highly connected regions were predominantly located in the prefrontal cortex, the anterior cingulate cortex (ACC), the posterior parietal and occipital cortex, the middle temporal gyrus, and the parahippocampal gyrus (PHG). For the MDD patients, a highly similar pattern was observed (across‐voxel spatial correlation: r = .960, p < .001; Figure 1b). Nevertheless, significant decreases were found in the patients in the bilateral ACC, middle frontal gyri (MFG) and superior frontal gyri (SFG) and the right PHG (p < .05, corrected; Figure 1c). These results were largely reproducible when different choices were used during the DC calculation and when patients with medication were excluded (Figure 2).
Figure 1.
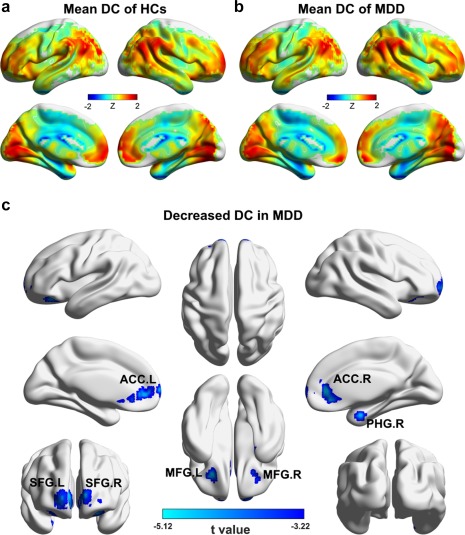
Between‐group differences in DC maps at baseline. (a) Group‐average DC map of the HCs. (b) Group‐average DC map of the patients. (c) Regions showing decreased DC in the patients compared with the HCs [Color figure can be viewed at http://wileyonlinelibrary.com]
Figure 2.
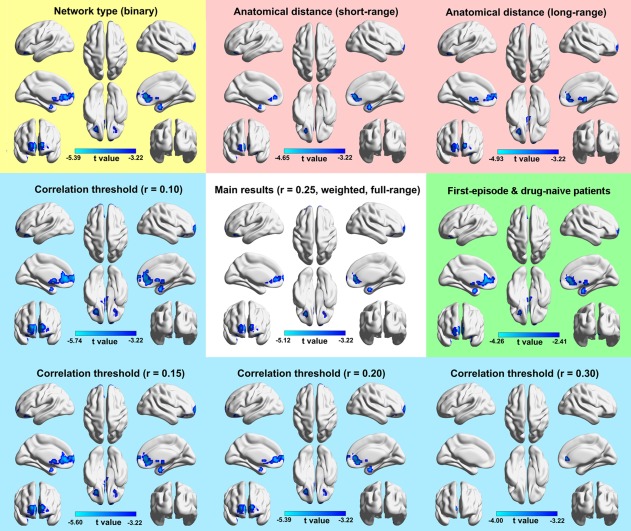
The reproducibility of decreased DC in MDD. Generally, the MDD‐related DC decreases were largely reproducible when different choices of network type, anatomical distance, or correlation threshold were used and when patients with antidepressant medication were excluded. Notably, a looser height threshold of p < .01 was used when medicated patients were excluded due to the reduced sample size [Color figure can be viewed at http://wileyonlinelibrary.com]
3.3. MDD‐related functional connectivity decreases are selectively located in regions with hub‐like features and in the limbic and default mode networks
Based on the mean DC map derived from baseline HCs (Figure 1a), the regions showing MDD‐related FC decreases had significantly higher values than those without FC alterations in the patients (p < .001 for both the t and simulation‐based tests; Figure 3a). The individual‐level across‐subject comparison generated similar results (t = 2.652, p = .012). Using the hub topography of the baseline HCs as a reference (Figure 4), the chi‐square test further revealed that the MDD‐related DC decreases were more inclined to be in hubs than in nonhubs ( = 25.992, p < .001). With regard to functional modules, we found that the regions showing MDD‐related DC decreases mainly overlapped with the LIN (dice coefficient = 0.073) and the DMN (dice coefficient = 0.046) (Figure 3b). Subsequent goodness of fit analysis also revealed the largest positive value for the LIN (goodness of fit = 0.613), followed by the DMN (goodness of fit = 0.217). Statistical analysis indicated that the goodness of fit values of the LIN and DMN were significantly higher than those of randomly generated spurious modules (both p < .001) (Figure 3c). These findings collectively suggest that functional brain hubs and the LIN and DMN regions are more vulnerable to MDD with respect to impaired functional integration.
Figure 3.
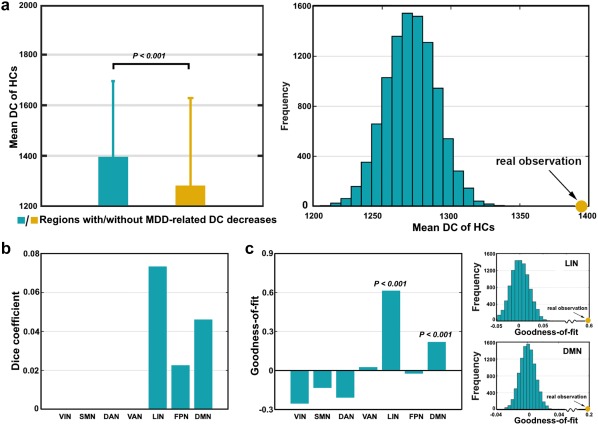
Hub susceptibility and module specificity of MDD‐related DC decreases. (a) Relative to other areas in the brain, the regions showing MDD‐related DC decreases had significantly higher FC density in terms of the mean DC map of the HCs. (b) Using a publicly available brain parcellation atlas as a reference, the MDD‐related FC decreases were mainly located in the LIN, DMN, and FPN. (c) Goodness‐of‐fit analysis revealed positive values for the LIN and DMN that were significantly higher than those derived from randomly generated spurious modules [Color figure can be viewed at http://wileyonlinelibrary.com]
Figure 4.
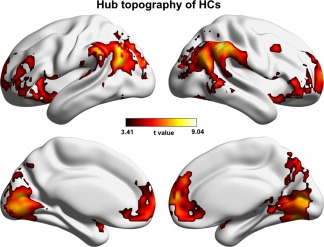
Hub topography of the HCs at baseline. Hubs were defined as regions that had significantly higher DC than the mean across all regions in the brain [Color figure can be viewed at http://wileyonlinelibrary.com]
3.4. Regions showing MDD‐related functional connectivity decreases exhibit unique temporal organization
Based on the mean fALFF maps derived from baseline HCs (Figure 5a), no significant differences were observed between regions with and without MDD‐related DC decreases within the frequency band of 0.01–0.1 Hz. However, in the subfrequency bands, the regions showing MDD‐related DC decreases had significantly higher fALFF within the slow‐5 frequency band (0.01–0.027 Hz) but lower fALFF within the slow‐4 frequency band (0.027–0.073 Hz) than other regions in the brain (all p < .01 for both the t‐ and simulation‐based tests; Figure 6a,b). Similar results were found for ALFF. For the TV, significantly lower values were observed for the regions showing MDD‐related DC decreases than those with intact DC in the patients (p < .001 for both the t‐ and simulation‐based tests; Figure 6c) in terms of the mean TV map derived from the baseline HCs (window length = 15 TR; Figure 5b). The results remained qualitatively unchanged when different window lengths (10 TR and 20 TR) were used (both p < .001). For the individual‐level across‐subject comparisons, largely consistent patterns were obtained for the ALFF, fALFF, and TV (all p < .05 except for the ALFF within the slow‐4 frequency band).
Figure 5.

The mean fALFF (a) and TV (b) maps of the HCs at baseline [Color figure can be viewed at http://wileyonlinelibrary.com]
Figure 6.
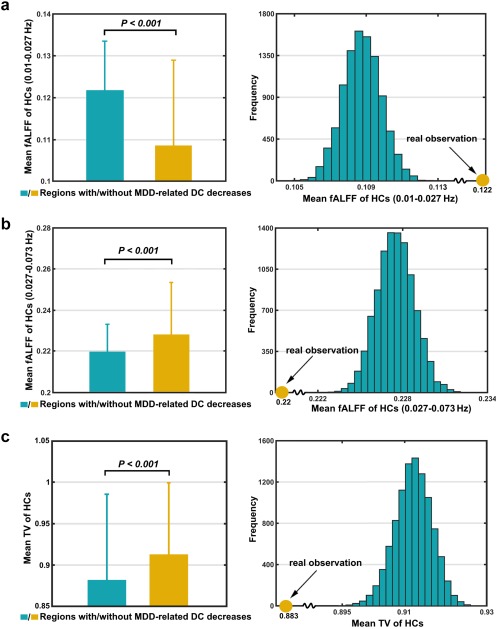
Temporal characteristics of regions showing MDD‐related DC decreases. Relative to other areas in the brain, the regions showing MDD‐related FC decreases had significantly higher fALFF within 0.01–0.027 Hz (a), lower fALFF within 0.027–0.073 Hz (b), and less TV (c) in terms of the corresponding mean maps of the HCs (Figure 5) [Color figure can be viewed at http://wileyonlinelibrary.com]
3.5. MDD‐related functional connectivity decreases are associated with reduced cerebral blood flow
For each region showing MDD‐related DC decreases, significantly lower regional CBF was observed in the MDD patients compared with the HCs (Figure 7a). Further cross‐modality correlation analysis (across voxels) revealed significantly positive correlations between the CBF and DC for all the regions at both group (HCs: r = .513–.928; MDD: r = .402–.931) (Figure 7b) and individual (all p < .001) levels. The regional cross‐modality correlations did not differ significantly between the two groups.
Figure 7.
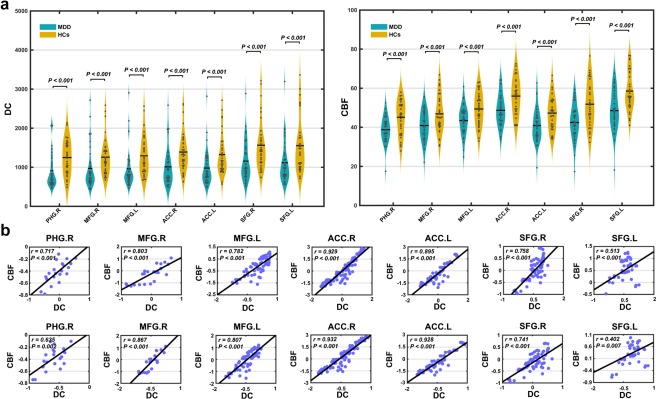
Regional cross‐modality relationship. (a) For each region showing MDD‐related DC decreases, significantly reduced CBF was observed in the MDD patients compared with the HCs. (b) Group‐level across‐voxel correlation analyses further revealed significantly positive correlations between the DC and CBF within each of the regions for both the HCs (first row) and MDD (second row) groups [Color figure can be viewed at http://wileyonlinelibrary.com]
When the above regional analyses were extended to the entire brain, positive correlations were observed again at both the group (HCs: r = .508, p < .001; MDD: r = .463, p < .001; Figure 8a) and individual (HCs: r = .137–.578; MDD: r = .060–.538) levels. Interestingly, the whole‐brain cross‐modality correlations were significantly decreased in the patients compared with the HCs (z = 7.339, p < .001 for group‐level correlations; t = 2.276, p = .026 for individual‐level correlations; Figure 8b). This implies the existence of regions that have dissociated patterns with respect to MDD‐related DC and CBF alterations, which was supported by our findings of whole‐brain between‐group comparisons of CBF (Figure 9) and a nonparametric co‐analysis of DC and CBF maps (Figures 10 and 11).
Figure 8.

Decreased whole‐brain across‐modality relationship in MDD at both (a) group and (b) individual levels [Color figure can be viewed at http://wileyonlinelibrary.com]
Figure 9.
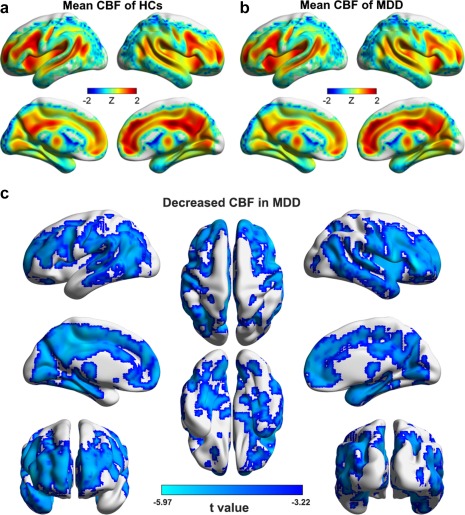
CBF maps of within‐group means (a and b) and between‐group differences (c). Widespread CBF decreases were observed in patients with MDD in both cortical and subcortical regions [Color figure can be viewed at http://wileyonlinelibrary.com]
Figure 10.
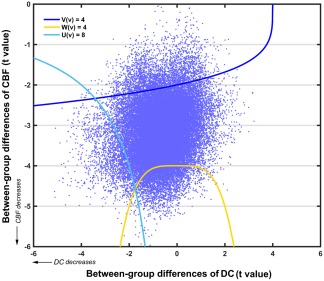
A scatter plot of the t values derived from the between‐group comparisons of whole‐brain DC and CBF. The cluster defining thresholds for the concordance and dissociation combining functions are also presented [Color figure can be viewed at http://wileyonlinelibrary.com]
Figure 11.
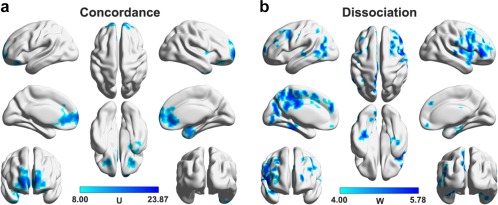
Regions that simultaneously exhibited decreased DC and CBF (i.e., concordance, a) and that only exhibited decreased CBF (i.e., dissociation, b) in MDD. Multiple regions were identified to only show decreased CBF but have intact DC in the patients that mainly included the dorsal prefrontal, posterior medial parietal, and occipital cortices [Color figure can be viewed at http://wileyonlinelibrary.com]
3.6. Antidepressant treatment normalizes MDD‐related functional connectivity decreases
Figure 12 shows the between‐group DC and CBF differences after 2‐week and 12‐week follow‐up for the regions showing MDD‐related FC decreases at baseline. After 2‐week antidepressant treatment, MDD‐related decreases were only observed in the left MFG, the right ACC, and the bilateral SFG for DC and in the bilateral SFG for CBF (p < .05, corrected by the false discovery rate procedure; Figure 12a). After 12‐week antidepressant treatment, no regions were found to show between‐group differences in either DC or CBF (all p > .05; Figure 12b).
Figure 12.
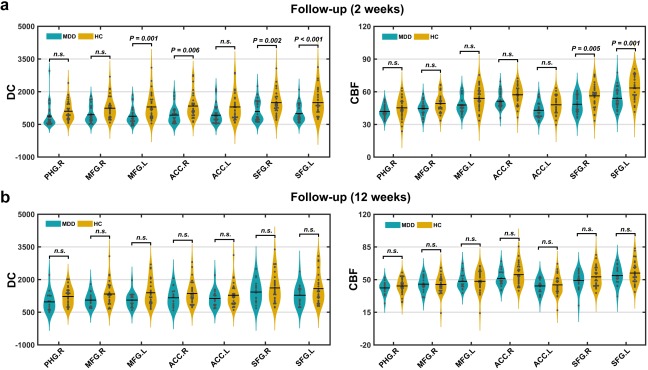
Between‐group differences in DC and CBF after follow‐up. (a) Out of the 7 regions showing MDD‐related FC decreases at baseline, 3 and 5 were normalized after 2‐week medication in terms of DC and CBF. (b) After 12‐week antidepressant treatment, no regions were found to show between‐group differences in either DC or CBF [Color figure can be viewed at http://wileyonlinelibrary.com]
3.7. Clinical relevance of MDD‐related functional connectivity decreases
Within the MDD group, no significant correlations were observed either between baseline DC and any clinical variable or between changes in the DC and HAMD scores after antidepressant treatment (p > .05, corrected by the false discovery rate procedure).
4. DISCUSSION
In this study, we examined spatiotemporal characteristics, metabolic basis and therapeutic response of integrative dysfunctions in MDD to afford general insights into our understanding of network disorganization in the disease. First, we found that MDD was associated with impaired FC in the bilateral ACC, MFG, and SFG and the right PHG. The ACC is a key node in emotional regulation (Bush, Luu, & Posner, 2000), where lesions can result in autonomic dysregulation, apathy, and emotional instability (Cardinal, Parkinson, Hall, & Everitt, 2002; Devinsky, Morrell, & Vogt, 1995). The PHG is another important site in emotional processing (Frank et al., 2014), especially in reactions involving negative emotions (Chan, Baumann, Bellgrove, & Mattingley, 2014). Regarding the SFG and MFG, they are involved in a variety of cognitive functions, such as working memory, motor control, and attentional reorientation (du Boisgueheneuc et al., 2006; Japee, Holiday, Satyshur, Mukai, & Ungerleider, 2015; Martino et al., 2011). For depressed individuals, decreased structural and FC of these sites have been frequently reported in previous studies (Korgaonkar, Fornito, Williams, & Grieve, 2014; Zhang et al., 2011). Thus, our findings are consistent with previous findings and indicate that integrative dysfunctions of these regions may contribute to disturbances in mood and cognition in MDD. Notably, using the DC approach, previous studies observe inconsistent findings (Wang et al., 2015b; Zhang et al., 2016), which may be due to differences in clinical samples or data preprocessing methods. Notably, the current findings were largely reproducible when different analytical strategies were employed and were independent of medication status of the patients.
We found that the MDD‐related FC decreases tended to be located in hub‐like regions. Recently, an increasing number of studies have demonstrated that brain hubs are selectively attacked in different diseases, such as Alzheimer's disease (Dai et al., 2015). Based on meta‐analyses of MRI data of 26 brain disorders, Crossley et al. (2014) further demonstrate the universality of hub vulnerability, suggesting that hub susceptibility may be a common network substrate of various brain disorders (Stam, 2014). Thus, our findings provide new evidence for this notion. Nevertheless, it should be noted that the hub susceptibility exhibits disorder‐specific patterns. For instance, temporal hubs were specifically implicated in Alzheimer's disease, whereas frontal and temporal hubs were specifically involved in schizophrenia (Crossley et al., 2014). Here, we demonstrated that MDD‐related integrative disturbances were most commonly located in the LIN and DMN. The LIN is a group of interconnected cortical and subcortical structures (Mesulam, 2000) that are mainly involved in memory and emotion (Rolls, 2015). The DMN is engaged in a diverse array of functions, such as episodic memory, self‐relevant mental processing, and monitoring the external environment (Raichle, 2015). Numerous studies have reported the wide involvement of the LIN and DMN in the physiopathology of depression (Price & Drevets, 2012; Zhong, Pu, & Yao, 2016). In the future, mechanistic insights into the preferential involvement of hubs and the LIN/DMN in MDD could benefit from longitudinal experimental and computational modeling studies by developing models to characterize the emergence and propagation of network alterations in the disease.
Apart from the spatial selectivity, we found that the regions showing MDD‐related FC decreases exhibited unique temporal organization. Specifically, the regions had stronger low‐frequency oscillations in the slow‐5 frequency band and weaker oscillations in the slow‐4 frequency band. Previous studies have shown that neural oscillations of the brain span a wide range of frequencies, and oscillations within specific frequency bands are related to different neural processes and cognitive functions (Buzsáki & Draguhn, 2004; Knyazev, 2007). Consistent with this notion, spontaneous neural activity within the slow‐4 and slow‐5 frequency bands show different patterns of low‐frequency oscillation power, interregional FC and whole‐brain network topology in healthy brain (Xue, Li, Weng, Northoff, & Li, 2014) and exhibit unique alterations in depressed individuals (He et al., 2016). Moreover, it is suggested that several rhythms can temporally coexist in the same structures (Steriade, 2001), and neighboring bands are typically associated with different brain states and compete with each other (Watrous, Tandon, Conner, Pieters, & Ekstrom, 2013). This is consistent with the observed opposite pattern of temporal uniqueness in regional oscillation power between the slow‐4 and slow‐5 frequency bands. A deeper understanding of physiological and psychological functions of brain oscillations within different frequency bands could benefit from establishing spectral correspondence between BOLD fMRI signals and electrophysiological recordings. Additionally, the regions showing MDD‐related FC alterations exhibited less temporal variability of whole‐brain FC profiles. Temporal variability quantifies the extent to which the time series of a given region is synchronized with all other regions in the brain over time. Zhang et al. (2016) found that heteromodal association areas and the limbic system had high variability and primary and unimodal sensory‐motor cortices had low variability in healthy brain. The nonuniform distribution may reflect different abilities of regions to dynamically reconfigure themselves into different functional modules (Liao et al., 2017; Zhang et al., 2016). Thus, our results imply that MDD tends to disrupt FC of regions that are temporally stable or inactive in dynamic module affiliations. Notably, in contrast with regional analysis of temporal variability in previous studies (Liao et al., 2017; Zhang et al., 2016), this study was performed at a voxel level. This discrepancy makes a direct comparison of our results with previous findings unreasonable (de Reus & van den Heuvel, 2013).
We found that the regions exhibiting MDD‐related FC decreases had reduced CBF in the patients compared with the HCs. Further correlation analyses revealed positive correlations between CBF and DC at both the regional and whole‐brain levels for both the groups. These findings are consistent with previous studies demonstrating that FC has a metabolic and physiological basis (Liang et al., 2013; Tomasia et al., 2013). Nevertheless, we noted that there existed multiple regions that showed reduced CBF but had intact FC in the patients. Indeed, a similar phenomenon was also found for the response of FC and CBF to antidepressant treatment. That is, some regions showed therapeutic effects on both FC and CBF while others were normalized only in CBF. We speculate that both the FC disruptions and their recovery may reflect a result of accumulative effects of MDD‐induced CBF alterations over a period of time. The speculation sounds reasonable because if a region suffers from long‐term hypometabolism, it would lack sufficient energy to retain its interregional neural synchronization and eventually represents FC disruptions, and vice versa. Moreover, the time lag between CBF alterations and FC manifestations may vary across different regions in the brain. This is consistent with previous findings that the FC‐CBF coupling is dependent on module affiliation and connection distance of a region (Liang et al., 2013). Although the FC‐CBF relationship is not fully understood currently, our preliminary results suggest that CBF manifests MDD‐related alterations and therapeutic effects ahead of FC and thus could serve as a clinically more meaningful biomarker for the disease. Future longitudinal studies that cover different stages, particularly the early phase of depression, will be helpful for clarifying the causal relationships or sequential alterations of FC and CBF under diseased conditions.
We found that the HAMD scores gradually declined and the decreased FC gradually recovered when the patients followed antidepressant treatment. This suggests that the remission of MDD is associated with a normalization of abnormal FC in the disease. This is also in line with previous studies from both healthy subjects (McCabe & Mishor, 2011) and MDD patients (Abdallah et al., 2017; Wang et al., 2015b) showing that antidepressant drugs could significantly regulate or normalize interregional FC of the brain. Specifically, as a critical hub for depression, the ACC has been previously reported to show increased FC after medication (Anand et al., 2005). In particular, efficacy of transcranial magnetic stimulation targets for depression is closely related to the FC of the subgenual cingulate (Fox, Buckner, White, Greicius, & Pascual‐Leone, 2012). These findings collectively suggest that the ACC may act as a convergent mediator via which different therapeutic programs generate antidepressant efficacy.
This study has several limitations that warrant discussion. First, the sample size is relatively small, which may limit the statistical power in detecting subtle network alterations and potential brain–clinical relationships. This limitation was further aggravated by clinical heterogeneity of the patients, such as the medication status and number of episodes. It is not clear to what extent the current findings are contaminated by the clinical heterogeneity although largely comparable results were obtained when our main analyses were restricted in the first‐episode and drug‐naïve patients, and no significant correlations were found between the FC alterations and numbers of episodes among all the patients. Accordingly, it is important for future studies to examine the reproducibility of our findings by using a large cohort of MDD patients that are clinically more homogeneous (e.g., first‐episode and drug‐naïve). Second, we did not collect behavioral and cognitive data for the participants. An interesting future topic is to explore the relationship between FC recovery and cognitive improvements following antidepressant treatment in MDD. Third, we employed CBF, an adequate surrogate for cerebral oxygen and glucose metabolism (Liang et al., 2013), to study the metabolic substrate of MDD‐related FC alterations because of its non‐invasiveness and ease of access. Future studies could help clarify potential bias in the estimated cross‐modality coupling by using positron emission tomography. Additionally, previous studies have shown that spontaneous fMRI signal oscillations exhibit reliably positive correlations with regional CBF and metabolism in healthy subjects (Aiello et al., 2015; Li, Zhu, Childress, Detre, & Wang, 2012). It is interesting in future studies to systematically examine the mutual relationships among different fMRI‐based measures (e.g., FC, ALFF, and CBF) in MDD. Finally, we used different antidepressant drugs for the patients during the follow‐up period to make our findings as clinically relevant as possible. Although this is a widely used design in MDD (Korgaonkar et al., 2015; Li et al., 2013), the heterogeneity of antidepressant drugs may lower the power of the study in observing subtle and drug‐specific brain network changes because different drugs may trigger antidepressant responses in different ways (Gideons, Kavalali, & Monteggia, 2014). Future studies can help classify how FC differentially responds to different antidepressant drugs in patients with MDD.
In summary, our findings suggest that MDD preferentially disrupts FC of regions that have characteristic spatial topography and unique temporal organization. Moreover, the MDD‐related FC disruptions have metabolic or physiological substrate and could recover via antidepressant treatment. These findings have important implications for understanding the origin, characteristic and clinical relevance of integrative dysfunctions in MDD. Intriguingly, CBF may serve as potential diagnostic and therapeutic biomarkers to detect functional alterations in MDD ahead of FC.
DECLARATION OF INTEREST
None.
ACKNOWLEDGMENTS
This work was supported by the National Natural Science Foundation of China (Nos. 81671764, 81671350 and 81371490), the National Key Technology R&D Program of China (No. 2015BAI13B01), and the Key Project of Science and Technology Programme of Hangzhou Municipality (No. 20142013A59).
Sheng J, Shen Y, Qin Y, et al. Spatiotemporal, metabolic, and therapeutic characterization of altered functional connectivity in major depressive disorder. Hum Brain Mapp. 2018;39:1957–1971. 10.1002/hbm.23976
Funding information National Natural Science Foundation of China, Grant/Award Numbers: 81671764, 81671350, 81371490; National Key Technology R&D Program of China, Grant/Award Number: 2015BAI13B01; Key Project of Science and Technology Programme of Hangzhou Municipality, Grant/Award Number: 20142013A59
Jintao Sheng and Shen Yuedi contributed equally to this work.
REFERENCES
- Abdallah, C. G. , Averill, L. A. , Collins, K. A. , Geha, P. , Schwartz, J. , Averill, C. , … Murrough, J. W. (2017). Ketamine treatment and global brain connectivity in major depression. Neuropsychopharmacology, 42, 1210–1219. [DOI] [PMC free article] [PubMed] [Google Scholar]
- Achard, S. , & Bullmore, E. (2007). Efficiency and cost of economical brain functional networks. PLoS Computational Biology, 3, e17. [DOI] [PMC free article] [PubMed] [Google Scholar]
- Aiello, M. , Salvatore, E. , Cachia, A. , Pappata, S. , Cavaliere, C. , Prinster, A. , … Quarantelli, M. (2015). Relationship between simultaneously acquired resting‐state regional cerebral glucose metabolism and functional MRI: A PET/MR hybrid scanner study. NeuroImage, 113, 111–121. [DOI] [PubMed] [Google Scholar]
- Anand, A. , Li, Y. , Wang, Y. , Wu, J. , Gao, S. , Bukhari, L. , … Lowe, M. J. (2005). Antidepressant effect on connectivity of the mood‐regulating circuit: An FMRI study. Neuropsychopharmacology, 30, 1334–1344. [DOI] [PubMed] [Google Scholar]
- Buckner, R. L. , Sepulcre, J. , Talukdar, T. , Krienen, F. M. , Liu, H. , Hedden, T. , … Johnson, K. A. (2009). Cortical hubs revealed by intrinsic functional connectivity: Mapping, assessment of stability, and relation to Alzheimer's disease. The Journal of Neuroscience, 29, 1860–1873. [DOI] [PMC free article] [PubMed] [Google Scholar]
- Bush, G. , Luu, P. , & Posner, M. I. (2000). Cognitive and emotional influences in anterior cingulate cortex. Trends in Cognitive Sciences, 4, 215–222. [DOI] [PubMed] [Google Scholar]
- Buzsáki, G. , & Draguhn, A. (2004). Neuronal oscillations in cortical networks. Science (New York, N.Y.), 304, 1926–1929. [DOI] [PubMed] [Google Scholar]
- Cardinal, R. N. , Parkinson, J. A. , Hall, J. , & Everitt, B. J. (2002). Emotion and motivation: The role of the amygdala, ventral striatum, and prefrontal cortex. Neuroscience and Biobehavioral Reviews, 26, 321–352. [DOI] [PubMed] [Google Scholar]
- Chan, E. , Baumann, O. , Bellgrove, M. A. , & Mattingley, J. B. (2014). Negative emotional experiences during navigation enhance parahippocampal activity during recall of place information. Journal of Cognitive Neuroscience, 26, 154–164. [DOI] [PubMed] [Google Scholar]
- Cox, R. W. , Chen, G. , Glen, D. R. , Reynolds, R. C. , & Taylor, P. A. (2017). FMRI clustering in AFNI: False positive rates redux. Brain Connectivity, 7, 152–171. [DOI] [PMC free article] [PubMed] [Google Scholar]
- Crossley, N. A. , Mechelli, A. , Scott, J. , Carletti, F. , Fox, P. T. , McGuire, P. , & Bullmore, E. T. (2014). The hubs of the human connectome are generally implicated in the anatomy of brain disorders. Brain: A Journal of Neurology, 137, 2382–2395. [DOI] [PMC free article] [PubMed] [Google Scholar]
- Dai, Z. , Yan, C. , Li, K. , Wang, Z. , Wang, J. , Cao, M. , … He, Y. (2015). Identifying and mapping connectivity patterns of brain network hubs in Alzheimer's disease. Cerebral Cortex (New York, N.Y.: 1991), 25, 3723–3742. [DOI] [PubMed] [Google Scholar]
- de Reus, M. A. , & van den Heuvel, M. P. (2013). The parcellation‐based connectome: Limitations and extensions. NeuroImage, 80, 397–404. [DOI] [PubMed] [Google Scholar]
- Devinsky, O. , Morrell, M. J. , & Vogt, B. A. (1995). Contributions of anterior cingulate cortex to behaviour. Brain, 118, 279–306. [DOI] [PubMed] [Google Scholar]
- Du Boisgueheneuc, F. , Levy, R. , Volle, E. , Seassau, M. , Duffau, H. , Kinkingnehun, S. , … Dubois, B. (2006). Functions of the left superior frontal gyrus in humans: A lesion study. Brain: A Journal of Neurology, 129, 3315–3328. [DOI] [PubMed] [Google Scholar]
- Fox, M. D. , Buckner, R. L. , White, M. P. , Greicius, M. D. , & Pascual‐Leone, A. (2012). Efficacy of transcranial magnetic stimulation targets for depression is related to intrinsic functional connectivity with the subgenual cingulate. Biological Psychiatry, 72, 595–603. [DOI] [PMC free article] [PubMed] [Google Scholar]
- Fox, M. D. , Zhang, D. , Snyder, A. Z. , & Raichle, M. E. (2009). The global signal and observed anticorrelated resting state brain networks. Journal of Neurophysiology, 101, 3270–3283. [DOI] [PMC free article] [PubMed] [Google Scholar]
- Frank, D. W. , Dewitt, M. , Hudgens‐Haney, M. , Schaeffer, D. J. , Ball, B. H. , Schwarz, N. F. , … Sabatinelli, D. (2014). Emotion regulation: Quantitative meta‐analysis of functional activation and deactivation. Neuroscience and Biobehavioral Reviews, 45, 202–211. [DOI] [PubMed] [Google Scholar]
- Friston, K. J. , Williams, S. , Howard, R. , Frackowiak, R. S. J. , & Turner, R. (1996). Movement‐related effects in fMRI time‐series. Magnetic Resonance in Medicine, 35, 346–355. [DOI] [PubMed] [Google Scholar]
- Gideons, E. S. , Kavalali, E. T. , & Monteggia, L. M. (2014). Mechanisms underlying differential effectiveness of memantine and ketamine in rapid antidepressant responses. Proceedings of the National Academy of Sciences of the United States of America, 111, 8649–8654. [DOI] [PMC free article] [PubMed] [Google Scholar]
- Gong, Q. , & He, Y. (2015). Depression, neuroimaging and connectomics: A selective overview. Biological Psychiatry, 77, 223–235. [DOI] [PubMed] [Google Scholar]
- Gotlib, I. H. , & Joormann, J. (2010). Cognition and depression: Current status and future directions. Annual Review of Clinical Psychology, 6, 285–312. [DOI] [PMC free article] [PubMed] [Google Scholar]
- Hayasaka, S. , Du, A. T. , Duarte, A. , Kornak, J. , Jahng, G. H. , Weiner, M. W. , & Schuff, N. (2006). A non‐parametric approach for co‐analysis of multi‐modal brain imaging data: Application to Alzheimer's disease. NeuroImage, 30, 768–779. [DOI] [PMC free article] [PubMed] [Google Scholar]
- He, Z. , Cui, Q. , Zheng, J. , Duan, X. , Pang, Y. , Gao, Q. , … Chen, H. (2016). Frequency‐specific alterations in functional connectivity in treatment‐resistant and ‐sensitive major depressive disorder. Journal of Psychiatric Research, 82, 30–39. [DOI] [PubMed] [Google Scholar]
- Japee, S. , Holiday, K. , Satyshur, M. D. , Mukai, I. , & Ungerleider, L. G. (2015). A role of right middle frontal gyrus in reorienting of attention: A case study. Frontiers in Systems Neuroscience, 9, 23. [DOI] [PMC free article] [PubMed] [Google Scholar]
- Kaiser, R. H. , Andrews‐Hanna, J. R. , Wager, T. D. , & Pizzagalli, D. A. (2015). Large‐scale network dysfunction in major depressive disorder: A meta‐analysis of resting‐state functional connectivity. JAMA Psychiatry, 72, 603–611. [DOI] [PMC free article] [PubMed] [Google Scholar]
- Kessler, R. C. , Angermeyer, M. , Anthony, J. C. , DE Graaf, R. , Demyttenaere, K. , Gasquet, I. , … Ustün, T. B. (2007). Lifetime prevalence and age‐of‐onset distributions of mental disorders in the World Health Organization's World Mental Health Survey Initiative. World Psychiatry, 6, 168. [PMC free article] [PubMed] [Google Scholar]
- Knyazev, G. G. (2007). Motivation, emotion, and their inhibitory control mirrored in brain oscillations. Neuroscience and Biobehavioral Reviews, 31, 377–395. [DOI] [PubMed] [Google Scholar]
- Korgaonkar, M. S. , Fornito, A. , Williams, L. M. , & Grieve, S. M. (2014). Abnormal structural networks characterize major depressive disorder: A connectome analysis. Biological Psychiatry, 76, 567–574. [DOI] [PubMed] [Google Scholar]
- Korgaonkar, M. S. , Rekshan, W. , Gordon, E. , Rush, A. J. , Williams, L. M. , Blasey, C. , & Grieve, S. M. (2015). Magnetic resonance imaging measures of brain structure to predict antidepressant treatment outcome in major depressive disorder. EBioMedicine, 2, 37–45. [DOI] [PMC free article] [PubMed] [Google Scholar]
- Li, B. , Liu, L. , Friston, K. J. , Shen, H. , Wang, L. , Zeng, L. L. , & Hu, D. (2013). A treatment‐resistant default mode subnetwork in major depression. Biological Psychiatry, 74, 48–54. [DOI] [PubMed] [Google Scholar]
- Li, Z. , Zhu, Y. , Childress, A. R. , Detre, J. A. , & Wang, Z. (2012). Relations between BOLD fMRI‐derived resting brain activity and cerebral blood flow. PLoS One, 7, e44556. [DOI] [PMC free article] [PubMed] [Google Scholar]
- Liang, X. , Zou, Q. , He, Y. , & Yang, Y. (2013). Coupling of functional connectivity and regional cerebral blood flow reveals a physiological basis for network hubs of the human brain. Proceedings of the National Academy of Sciences of the United States of America, 110, 1929–1934. [DOI] [PMC free article] [PubMed] [Google Scholar]
- Liao, X. , Cao, M. , Xia, M. , & He, Y. (2017). Individual differences and time‐varying features of modular brain architecture. NeuroImage, 152, 94–107. [DOI] [PubMed] [Google Scholar]
- Martino, J. , Gabarros, A. , Deus, J. , Juncadella, M. , Acebes, J. J. , Torres, A. , & Pujol, J. (2011). Intrasurgical mapping of complex motor function in the superior frontal gyrus. Neuroscience, 179, 131–142. [DOI] [PubMed] [Google Scholar]
- McCabe, C. , & Mishor, Z. (2011). Antidepressant medications reduce subcortical‐cortical resting‐state functional connectivity in healthy volunteers. NeuroImage, 57, 1317–1323. [DOI] [PMC free article] [PubMed] [Google Scholar]
- Mesulam, M.‐M. (2000). Behavioral neuroanatomy: Large‐scale networks, association cortex, frontal syndromes, the limbic system, and the hemispheric specializations. Principles of Behavioral and Cognitive Neurology, 2, 1–120. [Google Scholar]
- Murphy, K. , Birn, R. M. , Handwerker, D. A. , Jones, T. B. , & Bandettini, P. A. (2009). The impact of global signal regression on resting state correlations: Are anti‐correlated networks introduced? NeuroImage, 44, 893–905. [DOI] [PMC free article] [PubMed] [Google Scholar]
- Price, J. L. , & Drevets, W. C. (2012). Neural circuits underlying the pathophysiology of mood disorders. Trends in Cognitive Sciences, 16, 61–71. [DOI] [PubMed] [Google Scholar]
- Raichle, M. E. (2015). The brain's default mode network. Annual Review of Neuroscience, 38, 433–447. [DOI] [PubMed] [Google Scholar]
- Rolls, E. T. (2015). Limbic systems for emotion and for memory, but no single limbic system. Cortex, 62, 119–157. [DOI] [PubMed] [Google Scholar]
- Sporns, O. , & Betzel, R. F. (2016). Modular brain networks. Annual Review of Psychology, 67, 613–640. [DOI] [PMC free article] [PubMed] [Google Scholar]
- Stam, C. J. (2014). Modern network science of neurological disorders. Nature Reviews. Neuroscience, 15, 683–695. [DOI] [PubMed] [Google Scholar]
- Steriade, M. (2001). Impact of network activities on neuronal properties in corticothalamic systems. Journal of Neurophysiology, 86, 1–39. [DOI] [PubMed] [Google Scholar]
- Tomasia, D. , Wang, G.‐J. , & Volkow, N. D. (2013). Energetic cost of brain functional connectivity. Proceedings of the National Academy of Sciences of the United States of America, 110, 13642–13647. [DOI] [PMC free article] [PubMed] [Google Scholar]
- van den Heuvel, M. P. , & Sporns, O. (2013). Network hubs in the human brain. Trends in Cognitive Sciences, 17, 683–696. [DOI] [PubMed] [Google Scholar]
- Van Dijk, K. R. , Hedden, T. , Venkataraman, A. , Evans, K. C. , Lazar, S. W. , & Buckner, R. L. (2010). Intrinsic functional connectivity as a tool for human connectomics: Theory, properties, and optimization. Journal of Neurophysiology, 103, 297–321. [DOI] [PMC free article] [PubMed] [Google Scholar]
- Wang, J. , Wang, X. , Xia, M. , Liao, X. , Evans, A. , & He, Y. (2015a). GRETNA: A graph theoretical network analysis toolbox for imaging connectomics. Frontiers in Human Neuroscience, 9, 386. [DOI] [PMC free article] [PubMed] [Google Scholar]
- Wang, L. , Xia, M. , Li, K. , Zeng, Y. , Su, Y. , Dai, W. , … Si, T. (2015b). The effects of antidepressant treatment on resting‐state functional brain networks in patients with major depressive disorder. Human Brain Mapping, 36, 768–778. [DOI] [PMC free article] [PubMed] [Google Scholar]
- Watrous, A. J. , Tandon, N. , Conner, C. R. , Pieters, T. , & Ekstrom, A. D. (2013). Frequency‐specific network connectivity increases underlie accurate spatiotemporal memory retrieval. Nature Neuroscience, 16, 349–356. [DOI] [PMC free article] [PubMed] [Google Scholar]
- Woo, C. W. , Krishnan, A. , & Wager, T. D. (2014). Cluster‐extent based thresholding in fMRI analyses: Pitfalls and recommendations. NeuroImage, 91, 412–419. [DOI] [PMC free article] [PubMed] [Google Scholar]
- Xue, S. W. , Li, D. , Weng, X. C. , Northoff, G. , & Li, D. W. (2014). Different neural manifestations of two slow frequency bands in resting functional magnetic resonance imaging: A systemic survey at regional, interregional, and network levels. Brain Connectivity, 4, 242–255. [DOI] [PubMed] [Google Scholar]
- Yeo, B. T. , Krienen, F. M. , Sepulcre, J. , Sabuncu, M. R. , Lashkari, D. , Hollinshead, M. , … Buckner, R. L. (2011). The organization of the human cerebral cortex estimated by intrinsic functional connectivity. Journal of Neurophysiology, 106, 1125–1165. [DOI] [PMC free article] [PubMed] [Google Scholar]
- Zang, Y. F. , He, Y. , Zhu, C. Z. , Cao, Q. J. , Sui, M. Q. , Liang, M. , … Wang, Y. F. (2007). Altered baseline brain activity in children with ADHD revealed by resting‐state functional MRI. Brain &Amp; Development, 29, 83–91. [DOI] [PubMed] [Google Scholar]
- Zhang, J. , Cheng, W. , Liu, Z. , Zhang, K. , Lei, X. , Yao, Y. , … Feng, J. (2016). Neural, electrophysiological and anatomical basis of brain‐network variability and its characteristic changes in mental disorders. Brain: A Journal of Neurology, 139, 2307–2321. [DOI] [PubMed] [Google Scholar]
- Zhang, J. , Wang, J. , Wu, Q. , Kuang, W. , Huang, X. , He, Y. , & Gong, Q. (2011). Disrupted brain connectivity networks in drug‐naive, first‐episode major depressive disorder. Biological Psychiatry, 70, 334–342. [DOI] [PubMed] [Google Scholar]
- Zhong, X. , Pu, W. , & Yao, S. (2016). Functional alterations of fronto‐limbic circuit and default mode network systems in first‐episode, drug‐naive patients with major depressive disorder: A meta‐analysis of resting‐state fMRI data. Journal of Affective Disorders, 206, 280–286. [DOI] [PubMed] [Google Scholar]
- Zou, Q. H. , Zhu, C. Z. , Yang, Y. , Zuo, X. N. , Long, X. Y. , Cao, Q. J. , … Zang, Y. F. (2008). An improved approach to detection of amplitude of low‐frequency fluctuation (ALFF) for resting‐state fMRI: Fractional ALFF. Journal of Neuroscience Methods, 172, 137–141. [DOI] [PMC free article] [PubMed] [Google Scholar]


