

Abstract
Prenatal alcohol exposure (PAE) is associated with reduced overall brain volume. Although this has been reported consistently across studies, the status of cortical thickness after PAE is more variable. The cortex is asymmetric in typical controls, but it is unclear whether the left and right counter parts of the cortical gray matter are unevenly influenced in postpartum brain development after PAE. Brain MRI was acquired in a newly recruited sample of 157 participants (PAE: N = 78, 5.5–18.9 years, 40 females and controls: N = 79, 5.8–18.5 years, 44 females) across four Canadian sites in the NeuroDevNet project. The PAE group had other confounds such as psychiatric co‐morbidity, different living environment, and so on, not present in the control group. In agreement with previous studies, the volumes of all brain structures were reduced in PAE compared to controls, including gray and white matter of cerebrum and cerebellum, and all deep gray matter including the hippocampus, amygdala, thalamus, caudate, putamen, and pallidum. The PAE group showed reductions in global and regional cortical thickness, while the pattern and degree of cortical thickness asymmetry were preserved in PAE participants with the greatest rightward asymmetry in the lateral parietal lobe and the greatest leftward asymmetry in the lateral frontal cortex. This persistent asymmetry reflects that the homologous left and right cortical regions followed typical relative developmental patterns in the PAE group despite being thinner bilaterally than controls. Hum Brain Mapp 39:72–88, 2018. © 2017 Wiley Periodicals, Inc.
Keywords: prenatal alcohol exposure (PAE), fetal alcohol spectrum disorders (FASD), cortical thickness, brain volume, cortical asymmetry, development
INTRODUCTION
Individuals with prenatal alcohol exposure (PAE) often exhibit a range of physical, cognitive, and neurological deficits that are collectively referred to as fetal alcohol spectrum disorders (FASD) [Astley, 2013; Chudley et al., 2005]. Abnormalities of brain morphology in PAE have been identified in autopsy [Clarren and Smith, 1978; Jones and Smith, 1975] and by a variety of in vivo quantitative neuroimaging techniques (for a review, see Norman et al. [2009]). Overall brain volume is commonly reduced in PAE and is widespread including gray matter (cortical and subcortical) and white matter [Gautam et al., 2015a; for a review, see Lebel et al., 2011]. Alterations of regional cortical thickness in PAE relative to controls has been more variable with reductions [Robertson et al., 2015; Treit et al., 2014; Zhou et al., 2011], increases [Fernández‐Jaén et al., 2011; Sowell et al., 2008; Yang et al., 2012], or no differences [Rajaprakash et al., 2014; Wozniak et al., 2013]. Previous studies showed that lower regional cortical thickness was associated with higher degrees of PAE [Gautam et al., 2015b; Robertson et al., 2015]. In addition to alcohol, prenatal exposure to other substances such as opiates [Walhovd et al., 2007] and cigarette smoking [Ekblad et al., 2015] can also cause regional cortical thinning in developmental populations. In addition to these confounds, the PAE population is often accompanied with other critical factors such as poverty, lack of nutrition, or psychiatric issues [May et al. 2016].
Cortical thickness, which is measured on MRI as the distance between pial–cortical surface and gray–white interface usually on three‐dimensional isotropic T1‐weighted images [Fischl and Dale, 2000; MacDonald et al., 2000], undergoes decrease with age that differ between left and right counterpart regions and results in alterations of cortex asymmetry with typical development [Shaw et al., 2009; Zhou et al., 2013]. Hemispheric asymmetry of cortical gray matter in human brain has long been investigated and the asymmetry patterns may be associated with language, motor and cognitive functions (for a review, see Toga and Thompson [2003]). The asymmetry in gray matter has been shown to be related to cognitive performance in development over the life span from 7 to 59 years [Plessen et al., 2014]. Young individuals with psychiatric or neurological disorders have shown altered asymmetry of cortical thickness, with examples such as more regional asymmetry in first‐episode psychosis with a mean age of 25 years [Haller et al., 2009], more asymmetry in five sex‐chromosome aneuploidies over 5–25 years [Lin et al., 2015] and diverted developmental asymmetry trajectories in attention‐deficit hyperactivity disorder (ADHD) over 3–22 years [Shaw et al., 2009]. PAE is deleterious to brain development, as mentioned earlier, but its effect on the presence and emergence of asymmetry of cortical thickness is unknown. In other words, does the PAE‐exposed brain maintain its structural hemispheric specialization that appears important for cognitive function in nonexposed individuals? An earlier study showed reduced gray‐matter density asymmetry in 21 adolescents with heavy PAE in the lateral posterior temporal lobe, but it did not examine cortical thickness [Sowell et al., 2002].
With a newly recruited large sample of 5–18 year olds (78 PAE participants and 79 controls) from 4 sites across Canada in the NeuroDevNet study [Reynolds et al., 2011], this study had three main goals: (1) to confirm the observation of brain volume reductions in PAE seen in previous studies; (2) to verify whether there is reduced cortical thickness in PAE given inconsistent findings in the literature; and (3) to investigate whether the regional cortical thickness asymmetry is altered by PAE and associated conditions in children and adolescents.
MATERIALS AND METHODS
Participant Recruitment and MRI Scans
Two hundred and thirty‐nine participants were recruited into the NeuroDevNet FASD project [Reynolds et al., 2011], but not all received MRI as outlined below. Children with PAE (N = 124) were recruited through diagnostic clinics across Canada in Kingston, ON; Ottawa, ON; Edmonton, AB; Cold Lake, AB; Winnipeg, MB; and Vancouver, BC. Typically developing control children (N = 115, 89 underwent brain MRI and 79 were analyzed after imaging quality control) were recruited from the same geographic regions, matched as closely as possible for age and sex. Health of participants was verified by asking a series of questions, and the participants were excluded if they had any neurological or psychiatric disorder. The diagnosis of FASD was made by experienced multidisciplinary teams using the Canadian Guidelines from 2005 with 4‐digit code that incorporates an objective method of evaluating core fields of growth deficiency, facial dysmorphology, brain impairment, alcohol exposure, and other pre and postnatal adverse factors [Chudley et al., 2005]. The FASD diagnostic teams participating in this research have a long history of collaboration and consistency as members of the Canada FASD Research Network. The alcohol history is confirmed from reliable sources such as birth records, child welfare reports, legal documents, and direct interview with the birth mother if available. In most cases, the exact amount and pattern of alcohol use in that pregnancy is not reported or recalled. If there is another reason for the child's brain impairment such as complications from birth, traumatic acquired brain injury, or medical complications, those are considered the primary cause and FASD would not be diagnosed. The facial dysmorphology is determined using standardized methodology from the University of Washington by the clinic Pediatrician. The Pediatricians in all sites have received the same training from the University of Washington. All children must be in a stable placement for at least 6 months before participating in the clinic process and must be accompanied to the assessment by a caregiver who knows them and is supportive.
The comorbid diagnoses were from two sources. As mental health conditions are commonly found in FASD, 90% in a review by Pei et al. [2011], many children are already involved with the mental health system and see a consulting Psychiatrist for diagnosis and management before the FASD clinic assessment. The Pediatricians in all the FASD clinics are trained in developmental and behavioral disabilities and can also make mental health diagnoses based on Diagnostic and Statistical Manual of Mental Disorders (DSM) criteria and provide medication management if indicated. The clinic Psychologist provides additional assessment with standardized questionnaires, clinical observations and participated in the DSM diagnosis for mental health conditions. If the caregiver reported a mental health condition, the professional documentation for it was obtained and the clinic team provided further assessment. If the team disagreed with the diagnosis, it was removed from the comorbidity list. Socioeconomic status (SES) of the current home placement at time of scanning was calculated using Hollingshead's Four‐Factor Index of Social Status [Hollingshead 2011]. Higher score means better situation of the family.
One hundred and seventy‐seven participants underwent brain MRI including 3D T1‐weighted MPRAGE (1 × 1 × 1 mm3 in ∼5–6 min) at 4 sites in Canada (University of British Columbia, UBC, 3T Philips Intera, TE = 3.6 ms, TR = 1,858 ms, TI = 1,100 ms, flip angle = 15°, 6:23 min; University of Alberta, UofA, 1.5T Siemens Sonata, TE = 4.38 ms, TR = 2,180 ms, TI = 1,100 ms, flip angle = 15°, 5:41 min; University of Manitoba, UofM, 3T Siemens Trio, TE = 3.45 ms, TR = 2,180 ms, TI = 1,100 ms, flip angle = 15°, 5:15 min; and Queen's University, 3T Siemens Trio, TE = 3.45 ms, TR = 2,180 ms, TI = 1,100 ms, flip angle = 15°, 5:15 min). After visual inspection for motion artifacts and quality control from the cortical thickness software (CIVET QC) for segmentation and surface extraction, 20 participants were excluded from the study (8 controls and 9 PAE from motion artifacts; 2 controls and 1 PAE from segmentation errors in local areas). One hundred and fifty‐seven participants with good‐quality images were analyzed (Table 1) including 79 controls (5.8–18.5 years, 44 females, 69 right, 5 left, and 5 unspecified handedness) and 78 PAE (5.5–18.9 years, 40 females, 64 right, 7 left, and 7 unspecified handedness). Most PAE (56, 72%) were diagnosed as FASD under the Canadian Guidelines (Table 1, fetal alcohol syndrome, FAS, N = 7; partial FAS, pFAS, N = 12; alcohol‐related neurodevelopmental disorder, ARND, N = 37) while 22 had confirmed prenatal alcohol exposure but did not meet criteria for formal diagnosis or were deferred for re‐evaluation.
Table 1.
Demographic information for control and prenatal alcohol exposure (PAE) groups
| PAE subtype | ||||||||
|---|---|---|---|---|---|---|---|---|
| Controls | PAE | Difference | FAS | pFAS | ARND | PAE undiaga | FASD | |
| Site (all, n) | 79 | 78 | 7 | 12 | 37 | 22 | 56 | |
| University of British Columbia | 16 | 13 | 2 | 2 | 4 | 5 | 8 | |
| University of Alberta | 40 | 32 | 1 | 2 | 16 | 13 | 19 | |
| University of Manitoba | 8 | 9 | 0 | 2 | 7 | 0 | 9 | |
| Queens University | 15 | 24 | 4 | 6 | 10 | 4 | 20 | |
| Age (years) | ||||||||
| Mean ± SD | 12.1 ± 3.3 | 12.8 ± 3.3 | P = 0.2b | 13.6 ± 3.4 | 12.4 ± 3.0 | 13.5 ± 3.2 | 11.5 ± 3.4 | 13.2 ± 3.2 |
| Range | 5.8–18.5 | 5.5–18.9 | 9.7–18.5 | 7.9–17.3 | 7.7–18.9 | 5.5–17.5 | 7.7–18.9 | |
| Sex (n, females/males) | 44/35 | 40/38 | P = 0.6c | 3/4 | 6/6 | 20/17 | 11/11 | 29/27 |
| Handedness (n, left/right/unknown) | 5/69/5 | 7/64/7 | P = 0.7c | 0/6/1 | 2/10/0 | 3/32/2 | 2/16/4 | 5/48/3 |
| Socioeconomic status (standard score) | 46.6 ± 8.6 (n = 79) | 42.9 ± 14.6 (n = 76) | P = 0.06b | 41.9 ± 13.5 (n = 7) | 45.8 ± 17.3 (n = 12) | 41.2 ± 14.5 (n = 36) | 44.5 ± 14.0 (n = 21) | 42.3 ± 14.9 (n = 55) |
| Live with birth parents (n) | 72 | 7 | P = 10−15 c | 0 | 2 | 3 | 2 | 5 |
| Ethnicity (n) | P = 2 × 10⁻⁸ b | |||||||
| Caucasian | 70 | 24 | 4 | 6 | 9 | 5 | 19 | |
| Aboriginals (First Nations, Metis, Inuit) | 2 | 36 | 2 | 3 | 19 | 12 | 24 | |
| Other ethnicity (Mixed etc.) | 7 | 18 | 1 | 3 | 9 | 5 | 13 | |
| Comorbidities (n) | ||||||||
| ADHD | ‐ | 22 | 4 | 5 | 7 | 6 | 16 | |
| Anxiety disorder | ‐ | 11 | 2 | 0 | 6 | 3 | 8 | |
| ODD | ‐ | 6 | 0 | 1 | 3 | 2 | 4 | |
| Depression | ‐ | 5 | 1 | 0 | 3 | 1 | 4 | |
| Bipolar disorder | ‐ | 2 | 0 | 1 | 0 | 1 | 1 | |
| Psychosis disorder | ‐ | 1 | 0 | 0 | 0 | 1 | 0 | |
| Conduct disorder | ‐ | 2 | 0 | 0 | 1 | 1 | 1 | |
| Autism | ‐ | 1 | 1 | 0 | 0 | 0 | 1 | |
| Other (Language disorder, learning and math disability, or sleep disorder, etc.) | ‐ | 22 | 3 | 3 | 11 | 5 | 17 | |
| Medication | ||||||||
| Stimulant | ‐ | 32 | 3 | 3 | 16 | 10 | 12 | |
| Atypical antipsychotic | ‐ | 9 | 1 | 0 | 7 | 1 | 3 | |
| Selective norepinephrine reuptake inhibitor | ‐ | 5 | 1 | 0 | 4 | 0 | 1 | |
| Anticonvulsant | ‐ | 1 | 0 | 0 | 0 | 1 | 0 | |
PAE undiagnosed: confirmed PAE exposure but not formally diagnosed by a physician at the time of experiment.
T‐test.
Chi‐square test.
All experimental procedures were reviewed and approved by the Human Research Ethics Boards at Queen's University, University of Alberta, Children's Hospital of Eastern Ontario, University of Manitoba, and the University of British Columbia. Written informed consent was obtained from a parent or legal guardian and assent was obtained from each child before study participation.
Psychometric Measurements
Psychometric data were collected by individuals trained by co‐author JP for consistency across the four sites. The test battery included five major evaluations of core functions affected in PAE such as math, reading, executive function, memory, and inhibition as follows.
Woodcock Johnson III Tests of Achievement (WJ‐III ACH). The WJ‐III ACH assesses academic achievement in children and adolescents aged 5–18 years [Woodcock et al., 2001]. Participants completed Quantitative Concepts 18A&B, which measures quantitative reasoning and mathematics knowledge, scored using age‐referenced standard scores (M = 100, SD = 15) where higher scores indicate better performance.
Woodcock Reading Mastery Tests‐ Revised (WRMT‐R). The WRMT‐R provides a comprehensive individual assessment of reading ability across the lifespan [Woodcock, 1998]. The Word Identification (Word ID) subtest was used as a measure of reading ability and analyzed using age‐referenced standard scores (M = 100, SD = 15) where higher scores indicate better performance.
Behavior Rating Inventory of Executive Function (BRIEF). The BRIEF is an assessment of everyday executive function behaviors for children and adolescents aged 5–18 years. Parents respond regarding whether their child exhibits problems with specific behaviors. T scores (M = 50, SD = 10) are used to interpret the child's level of behavioral regulation, cognitive, and executive functioning, as linearly transformed from the raw scale scores. The higher scores indicate worse performance.
Working Memory Test Battery for Children (WMTB‐C). The WMTB‐C is a standardized test battery designed to assess working memory in children aged 5–15 years [Pickering and Gathercole, 2001]. The two subtests were Digit Recall, which measures verbal/phonological working memory, and Block Recall, which assesses visuospatial working memory. Age‐referenced scaled scores (M = 100, SD = 15) were analyzed where higher scores indicate better performance.
NEPSY‐II. The NEPSY‐II [Korkman et al., 2007] is a standardized neuropsychological test battery for children aged 3–16 years. Seven subtests were administered. Animal sorting (ages 7–16 years) assesses basic concept formation and the ability to transfer concepts in a card‐sorting paradigm. Auditory Attention (ages 5–16 years) assesses selective and sustained attention. Response Set (ages 7–16 years) assesses the ability to shift and maintain information while inhibiting previously learned responses. Inhibition (ages 5–16 years) measures the ability to inhibit automatic responses in favor of novel responses, and the ability to switch between response types (Naming, Inhibition, and Switching). Memory for Names (ages 5–16 years) assesses short‐term verbal learning (children's names), and Memory for Names Delayed (MND) assesses long‐term retention of verbal information. Age‐referenced scaled scores (M = 10, SD = 3) were analyzed and the higher scores indicate better performance.
Image Processing
Cortical thickness was calculated with the CIVET 1.1.11 pipeline in CBrain (http://cbrain.mcgill.ca/) at the Montreal Neurological Institute (MNI) with normalization to the ICBM‐152 symmetric template [Lyttelton et al., 2007]. Cortical thickness was measured as the distance between corresponding vertices of inner and outer surfaces of gray matter across 40,962 vertices in each hemisphere [Kim et al., 2005]. Thickness data were blurred using a surface‐based diffusion smoothing kernel of 20 mm FWHM that preserves cortical topology [Chung et al., 2003]. Absolute volumes of cerebrum, including cortical gray‐matter and white‐matter volumes, cerebellum, and deep gray‐matter volumes (hippocampus, amygdala, thalamus, caudate, putamen, and pallidum) were extracted using FreeSurfer version 5.1 (http://www.freesurfer.net/), an automated parcellation program [Fischl et al., 2002] on the CBrain platform for parallel processing. All volumes were measured separately for left and right hemispheres.
Intersite Correction
It is known that different MRI sites might yield biases in quantitative image metrics such as volumes and cortical thickness due to scanner differences (vendor, model, field strength, etc.) [Chalavi et al., 2012; Han et al., 2006; Jovicich et al., 2013; Wonderlick et al., 2009]. To reduce the variability between the four sites, the cortical thickness (per vertex) and volumes were corrected based on the consistency of these metrics from the same 8 healthy participants each scanned twice at each site, that is, 64 scans total [Treit et al., 2013]. Effects of site, scan, and site‐by‐scan interactions were tested with two‐way repeated measures analysis of variance (RM‐ANOVA). For a specific volume, for example, the total brain volume, if the site was significantly biased (P < 0.05), this volume was corrected for each site. A correction factor for each site was calculated as a Δvolume from the difference between the volume at each site and the mean volume across all the 4 sites. The corrected volume was then determined for each control and PAE participant per site. The same process was performed for each vertex for cortical thickness in all the participants. Note that the FDR correction is not needed here when the site correction was evaluated and performed individually for each vertex, or for each of the volumes. FDR was for control of false positive report, and it was not needed to control this type of error in site correction.
Statistics
Demographic differences between groups were performed by t test (Matlab R2014a, The MathWorks, Natick, MA, USA) for age and SES, and chi‐square test for sex, handedness, whether children lived with their birth parents, and their ethnicity. Statistics on brain volume and cortical thickness were performed in the SurfStat toolbox (http://www.math.mcgill.ca/keith/surfstat/) for Matlab with significance values corrected by false discovery rate (FDR) with a level of 0.05. Group comparison of cortical thickness between PAE and controls was tested at each vertex with a linear model controlling for age, sex, and handedness. Age effects on corrected cortical thickness in each group, and age‐by‐group interactions between PAE and controls, were tested with a linear model controlling for sex and handedness. The same statistics (group comparison, age effect, and age‐by‐group interactions) were applied to each of the volumes. Because the intersite corrections were determined by the traveling phantom scans and applied to the control and PAE data, we did not include site as a co‐variate in the above‐mentioned linear models. A parallel statistical analysis was also performed controlling for site on either uncorrected or corrected cortical thickness and volumes, but this did not change the results. Considering that the SES scores were near significance (P = 0.06 in Table 1), the group comparison between PAE and controls in cortical thickness and volumes was also tested with the linear model by adding SES as a covariate. The results were similar and did not change the conclusion. So the final presentations in this article were for the results controlling age, sex, and handedness.
An asymmetry index (AI) was calculated at each vertex for cortical thickness: AI = (Left − Right)/0.5 × (Left + Right). One sample t‐tests of AI were performed for each vertex pair (comparing to a test statistic of 0) in PAE and controls. Group comparisons of AI between PAE and controls were performed with a linear model controlling for age, sex, and handedness. Age effect on AI in each of the groups and age‐by‐group interaction between PAE and controls were tested with a linear model controlling for sex and handedness.
Post‐hoc analysis was performed for brain volumes and regional cortical thickness for frontal, parietal, temporal and occipital lobes for the linear models controlling for the same covariates as before. Additional comparisons were performed for various PAE subgroups versus selected subsets of best matched controls using an FDR level of 0.05 for both volumes (all structures previously assessed) and cortical thickness in the four major lobes (left and right combined) including: undiagnosed FASD (“PAE” group, N = 22) versus controls (1:3, N = 66); diagnosed FASD (FASD, N = 56) versus controls (1:1, N = 56); FAS (N = 7) versus controls (1:5, N = 35); pFAS (N = 12) versus controls (1:3, N = 36); ARND (N = 37) versus controls (1:2, N = 74); PAE participants with at least one psychiatric comorbidity (N = 47) versus controls (1:1, N = 47); PAE without comorbidity (N = 31) versus controls (1:1, N = 31), and PAE with comorbidity versus PAE without comorbidity; PAE participants with ADHD (N = 22) versus controls (1:1, N = 22); non‐ADHD PAE (N = 56) versus controls (1:1, N = 56); and ADHD PAE versus non‐ADHD PAE. In addition, the control group was mostly Caucasian whereas the PAE group was about half Aboriginals. To examine this, the Caucasian PAE (N = 24) were compared to best‐matched Caucasian controls (1:1, N = 24) and to the Aboriginal PAE (N = 36). Further, the Aboriginal PAE were compared to PAE of other ethnicities (N = 18).
RESULTS
Demographics and Psychometric Results
The demographic details are given in Table 1. The University of Alberta scanned more participants than the other sites (40 of 79 controls, 51%; 32 of 78 PAE, 41%), but there were roughly an equal number of controls and PAE at each other site (16 controls vs 13 PAE for UBC, 8 vs 9 for UofM, and 15 vs 24 for Queens). The age, sex, handedness, and SES were balanced between controls and PAE. Most of the controls were Caucasian (70, 89%) while the PAE group consisted of more Aboriginals (40, 51%) than other ethnicities (23 Caucasian, 30%; 15 other, 19%). Results for psychometric measurements for controls and PAE subtypes are given in Table 2. The combined group of PAE participants performed worse than the controls in all cognitive scores.
Table 2.
Psychometric measurement scores (mean ± SD) in controls and PAE with subtypes
| PAE subtypes | ||||||||||||
|---|---|---|---|---|---|---|---|---|---|---|---|---|
| Controls | PAE | FAS (n = 7) | pFAS (n = 12) | ARND (n = 37) | PAE Undiagd (n = 22) | |||||||
| Score name | N | Score | N | Score | N | Score | N | Score | N | Score | N | Score |
| Woodcock Johnsona | ||||||||||||
| Quantitative Concepts | 78 | 105 ± 13 | 77 | 83 ± 20** | 7 | 79 ± 27 | 12 | 80 ± 16 | 36 | 79 ± 17 | 22 | 92 ± 21 |
| Woodcock Reading Mastery Testa | ||||||||||||
| Word ID | 78 | 105 ± 13 | 77 | 91 ± 14** | 7 | 87 ± 22 | 11 | 92 ± 11 | 37 | 88 ± 11 | 22 | 97 ± 17 |
| BRIEF (parent form)b | ||||||||||||
| Behavioural Regulation Index | 75 | 48 ± 8 | 70 | 69 ± 12** | 7 | 70 ± 12 | 10 | 62 ± 10 | 32 | 70 ± 12 | 21 | 70 ± 13 |
| Metacognitive Index | 75 | 54 ± 14 | 70 | 65 ± 11** | 7 | 63 ± 12 | 10 | 68 ± 17 | 32 | 64 ± 11 | 21 | 65 ± 8 |
| Global Executive Composite | 75 | 50 ± 13 | 70 | 70 ± 11** | 7 | 74 ± 4 | 10 | 67 ± 11 | 32 | 72 ± 10 | 21 | 68 ± 12 |
| Working Memory Test Batterya | ||||||||||||
| Digit Recall | 71 | 101 ± 17 | 73 | 86 ± 13** | 6 | 92 ± 12 | 12 | 85 ± 13 | 34 | 83 ± 12 | 21 | 91 ± 13 |
| Block Recall | 70 | 103 ± 17 | 73 | 89 ± 17** | 6 | 89 ± 6.9 | 12 | 87 ± 12 | 34 | 88 ± 20 | 21 | 92 ± 15 |
| NEPSY‐IIc | ||||||||||||
| Animal Sorting | 72 | 9.7 ± 3.4 | 72 | 7.3 ± 3.0** | 6 | 7.7 ± 5.7 | 12 | 7.2 ± 3.3 | 34 | 6.7 ± 2.2 | 20 | 8.1 ± 3.1 |
| Auditory Attention | 77 | 11.1 ± 2.7 | 73 | 7.9 ± 3.9** | 6 | 9.5 ± 4.7 | 12 | 6.5 ± 4.0 | 34 | 7.5 ± 3.9 | 21 | 8.8 ± 3.5 |
| Response Set | 72 | 11.7 ± 2.5 | 72 | 10.1 ± 3.0** | 6 | 11.3 ± 2.2 | 12 | 9.8 ± 3.2 | 34 | 10.2 ± 2.9 | 20 | 9.8 ± 3.1 |
| Inhibition‐Naming | 76 | 9.8 ± 3.2 | 73 | 7.3 ± 3.8** | 6 | 9.5 ± 5.4 | 11 | 6.3 ± 3.3 | 34 | 6.9 ± 3.6 | 22 | 7.9 ± 4.0 |
| Inhibition‐Inhibition | 76 | 10.3 ± 3.7 | 71 | 6.9 ± 3.2** | 6 | 8.0 ± 3.8 | 11 | 5.9 ± 2.1 | 34 | 6.2 ± 3.0 | 20 | 8.3 ± 3.7 |
| Inhibition‐Switching | 71 | 10.7 ± 2.7 | 68 | 7.4 ± 3.6** | 6 | 10.8 ± 4.5 | 11 | 6.9 ± 1.9 | 33 | 6.5 ± 3.4 | 18 | 8.1 ± 3.7 |
| Memory for Names | 77 | 9.5 ± 3.0 | 72 | 6.9 ± 3.4** | 6 | 6.3 ± 5.2 | 12 | 5.8 ± 2.5 | 34 | 6.7 ± 2.9 | 20 | 7.9 ± 3.9 |
Standard scores, mean = 100, SD = 15; higher score indicates better performance.
T scores, mean = 50, SD = 10; higher score indicates worse performance.
Scaled scores, mean = 10, SD = 3; higher score indicates better performance.
PAE Undiagnosed: confirmed PAE exposure but not formally diagnosed by a physician at the time of experiment.
**P < 0.01 on independent sample t tests (PAE vs controls). Statistics not performed on the PAE subtypes.
Brain Volumes Reduced in PAE
All brain regions showed reductions of volume in PAE relative to controls (Table 3). Intracranial volume was reduced in PAE (−4.0%, negative value represents less in PAE compared to controls) while total cerebrum volume was reduced by 5.6%. Other structures including cerebral gray and white matter, cerebellum, and all deep gray matter had reduced volumes in PAE compared to controls bilaterally (−4% to −12%). Note that the caudate was reduced by −12.1% in PAE in left and −11.0% in right, pallidum by −10.7% in left and −8.2% in right, cerebellum white matter by −9.6% in left and −8.0% in right, and cerebellum gray matter by −7.7% in left and −7.6% in right.
Table 3.
Regional brain volumes (after intersite correction) in PAE compared to controls, and the linear age effect in each group
| Volume (cm3, mean ± SD) | Comparison (PAE vs controls) | Age effect (significant increases +/decreases −) | ||||||||
|---|---|---|---|---|---|---|---|---|---|---|
| Controls | PAE | Controls | PAE | |||||||
| Structure | (N = 79) | (N = 78) | Diff (%)a | T | P | T | P | T | P | |
| Intracranialb | 1490 ± 166 | 1430 ± 144 | −4.0 | 2.6 | 0.005 | 0.4 | 0.3 | 1.1 | 0.1 | |
| Total Cerebrumc | 1224 ± 121 | 1156 ± 118 | −5.6 | 4.3 | 0.00001 | 0.6 | 0.3 | 0.5 | 0.3 | |
| Total GMd | 753 ± 72 | 709 ± 72 | −5.7 | 4.5 | 0.000006 | 1.4 | 0.08 | 1.9 | 0.03− | |
| Subcortical GM | 201 ± 20 | 186 ± 20 | −7.7 | 6.0 | 0.00000001 | 0.1 | 0.4 | 0.1 | 0.5 | |
| Cortical GM | Left | 275 ± 31 | 261 ± 31 | −5.1 | 3.2 | 0.0007 | 1.6 | 0.06 | 2.1 | 0.02− |
| Right | 276 ± 31 | 263 ± 30 | −4.8 | 3.1 | 0.001 | 1.5 | 0.07 | 2.2 | 0.02− | |
| Cerebrum WM | Left | 235 ± 29 | 222 ± 29 | −5.6 | 3.9 | 0.00008 | 2.0 | 0.02+ | 2.7 | 0.005+ |
| Right | 236 ± 30 | 224 ± 29 | −5.2 | 3.7 | 0.0001 | 2.4 | 0.01+ | 2.5 | 0.01+ | |
| Cerebellum GM | Left | 59.1 ± 7.9 | 54.5 ± 8.0 | −7.7 | 4.2 | 0.00002 | 0.4 | 0.4 | 0.7 | 0.2 |
| Right | 60.7 ± 8.9 | 56.1 ± 8.6 | −7.6 | 4.0 | 0.00004 | 0.8 | 0.2 | 0.6 | 0.3 | |
| Cerebellum WM | Left | 14.9 ± 4.1 | 13.5 ± 3.2 | −9.6 | 2.3 | 0.01 | 0.8 | 0.3 | 0.2 | 0.4 |
| Right | 14.4 ± 4.2 | 13.2 ± 3.2 | −8.0 | 1.8 | 0.03 | 0.7 | 0.2 | 0.1 | 0.5 | |
| Hippocampus | Left | 4.4 ± 0.5 | 4.1 ± 0.7 | −6.9 | 4.0 | 0.00005 | 0.2 | 0.4 | 0.1 | 0.5 |
| Right | 4.3 ± 0.5 | 4.1 ± 0.6 | −6.6 | 3.9 | 0.00008 | 0.8 | 0.2 | 1.4 | 0.08 | |
| Amygdala | Left | 1.5 ± 0.2 | 1.4 ± 0.2 | −4.1 | 2.5 | 0.007 | 2.6 | 0.01− | 0.4 | 0.4 |
| Right | 1.6 ± 0.2 | 1.5 ± 0.2 | −4.6 | 2.8 | 0.003 | 0.9 | 0.2 | 0.3 | 0.4 | |
| Thalamus | Left | 8.1 ± 0.8 | 7.6 ± 0.9 | −7.0 | 5.3 | 0.0000002 | 2.3 | 0.01− | 1.8 | 0.04− |
| Right | 8.1 ± 0.8 | 7.6 ± 0.9 | −6.3 | 4.5 | 0.000007 | 1.1 | 0.2 | 1.5 | 0.07 | |
| Caudate | Left | 3.9 ± 0.5 | 3.4 ± 0.6 | −12.1 | 5.3 | 0.0000003 | 0.1 | 0.5 | 0.4 | 0.3 |
| Right | 4.0 ± 0.5 | 3.5 ± 0.6 | −11.0 | 5.2 | 0.0000003 | 0.4 | 0.4 | 0.5 | 0.3 | |
| Putamen | Left | 5.9 ± 0.7 | 5.5 ± 0.7 | −6.6 | 4.1 | 0.00003 | 1.7 | 0.05 | 0.6 | 0.3 |
| Right | 5.8 ± 0.7 | 5.4 ± 0.7 | −6.0 | 3.6 | 0.0002 | 2.1 | 0.02− | 0.7 | 0.2 | |
| Pallidum | Left | 1.9 ± 0.2 | 1.7 ± 0.3 | −10.7 | 5.4 | 0.0000001 | 0.4 | 0.4 | 0.3 | 0.4 |
| Right | 1.7 ± 0.2 | 1.5 ± 0.2 | −8.2 | 4.0 | 0.00005 | 0.9 | 0.2 | 0.7 | 0.2 | |
100 × ((volume in PAE) − (volume in controls))/(volume in controls).
Intracranial volume = cerebrum + cerebellum + brain stem + cerebrospinal fluid in cranial cavity.
Total cerebrum volume = total gray matter (GM) + total white matter (WM).
Total GM = subcortical GM + cortical GM.
Total gray matter volume (including subcortical and cortical gray matter), bilateral cortical gray matter, and left thalamus volume in PAE negatively correlated with age, while left amygdala, left thalamus, and right putamen volumes in controls negatively correlated with age (Table 3). Left and right white matter volume in both groups had positive correlations with age. No age‐by‐group interactions were observed for any volumes between PAE and controls (data not shown).
Cortical Thickness Reduced in PAE
The overall regional patterns of cortical thickness variation over the mantle were similar between controls and PAE (Fig. 1a,b), with greatest thickness observed in bilateral insula, temporal lobe, temporal pole and medial frontal lobe, and the thinnest cortex in the bilateral parietal and occipital lobes in both groups. The cortical thickness was lower significantly by more than 5% in PAE than controls in wide regions bilaterally including the pre and post central, inferior frontal, posterior temporal, parietal, and superior occipital regions (Fig. 1c,d). PAE did not show any vertices with a greater cortical thickness than controls.
Figure 1.
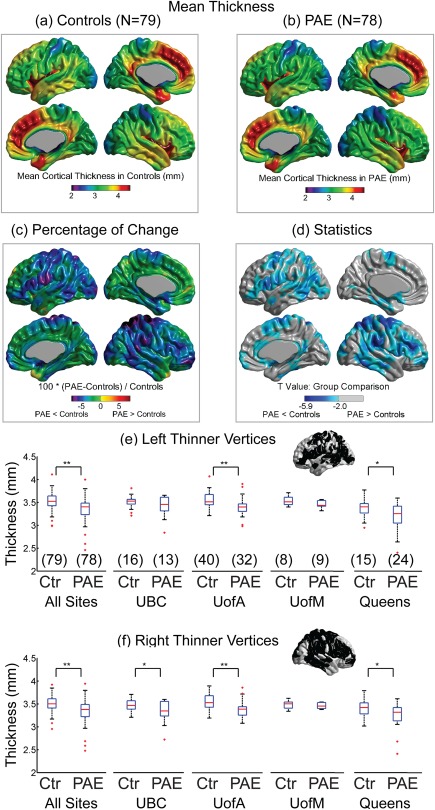
Regional cortical thickness averaged over all 79 controls (a) or all 78 PAE (b). (c,d) PAE yielded regionally thinner cortex bilaterally over widespread areas relative to the controls. Note that cortical thickness was not thicker in any vertex in PAE relative to controls. The mean cortical thickness over all the statistically significant vertices (from (d)) in the left (e) and right (f) hemispheres are shown for all sites combined and the 4 separate sites in controls (Ctr) and PAE (sample size shown in brackets). *P < 0.05; **P < 0.01. [Color figure can be viewed at http://wileyonlinelibrary.com]
The vertices that were significant over the full sample (Fig. 1d) were averaged for the left and right hemispheres separately to assess the consistency of the cortical thickness reductions across all four sites, recognizing that there are different sample sizes per site. This post‐hoc analysis showed that the mean cortical thickness was reduced significantly in PAE versus controls for two of the four sites (UofA P = 0.004 and Queens P = 0.006, Fig. 1e) for the left hemisphere and three of the four sites (UBC P = 0.04, UofA P = 0.0008, and Queens P = 0.02, Fig. 1f) for the right hemisphere. The one site (UofM) with the smallest sample size of 8 controls versus 9 PAE did not show significant differences of cortical thickness in either hemisphere.
Cortical Thickness Reduced With Age Similarly in PAE and Controls
Regional cortical thickness was negatively correlated with age from 5 to 18 years over large regions of brain in both groups: controls—bilateral posterior‐inferior frontal, paracentral gyrus, fusiform, temporal, occipital‐parietal region, medial paracentral, and right frontal regions (Fig. 2a); and PAE—bilateral posterior‐inferior frontal, paracentral gyrus, fusiform, and right inferior temporal, medial side of parietal‐paracentral‐frontal regions (Fig. 2b). There were no significant age‐by‐group effects in any of the vertices after FDR correction (data not shown), suggesting that the PAE and controls followed similar developmental linear trajectories in this cross‐sectional age range of 5–18 years. Figure 2c–f demonstrates the cortical thickness averaged over all the significant vertices in either the left or right hemispheres that get smaller with age for each group.
Figure 2.
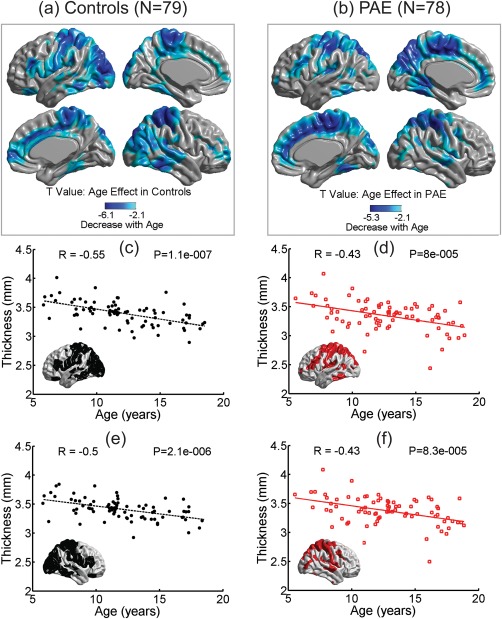
Age effect in controls (a) and PAE (b). Cool colors (lighter to darker blues) represent the vertices where cortical thickness decreased linearly with age over 5–18 years. Note that cortical thickness did not increase with age in any vertex. The mean cortical thickness versus age in significant vertices from left and right hemispheres are shown for controls (c,e: indicated by black dots for thickness and black dashed lines for linear regression) and PAE (d,f: red squares for thickness and red solid lines for regression). [Color figure can be viewed at http://wileyonlinelibrary.com]
Cortical Thickness Asymmetry Preserved in PAE
Cortical thickness asymmetry patterns were similar for both the control and PAE groups (Fig. 3a,b), specifically the lateral inferior frontal, superior temporal, and the medial occipital regions were significantly thicker in the right hemisphere and conversely, the lateral anterior frontal, parietal, and the fusiform gyri were significantly thicker in the left hemisphere in both groups (Fig. 3c,d). There was no group difference in asymmetry index (AI) between PAE and controls.
Figure 3.
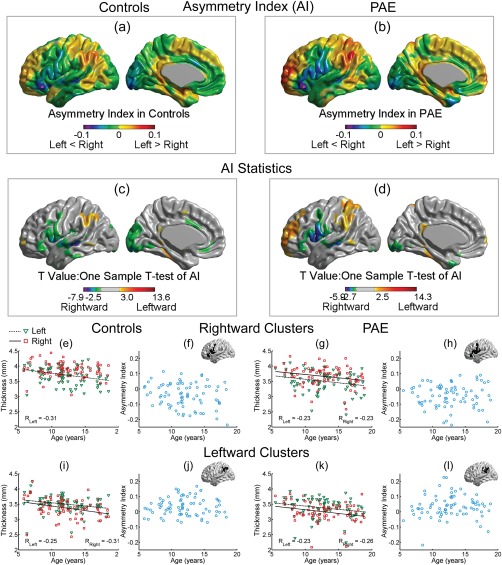
Asymmetry index (AI) for cortical thickness in controls (a) and PAE (b) is superimposed per vertex on a left hemisphere template for illustration. Cool colors (green, blue, and purple) represent rightward asymmetry (right vertices thicker than their left counterparts), while warm colors (yellow, orange, and red) represent leftward asymmetry. The appearance of the AI maps was similar between PAE and controls where (c) and (d) show one‐sample t tests of AI in controls and PAE, respectively. Mean thickness (e) of left (green triangles) and right (red squares) hemisphere, and their related asymmetry index (f), from a rightward cluster in inferior frontal gyrus in controls are shown against age, in comparison to the rightward cluster in the same region in PAE (g and h). A leftward cluster in parietal gyrus in controls (i and j) is also shown for comparison to a similar located leftward cluster in PAE (k and l). There were no significant linear changes of AI with age in either of these regions (f, h, j, l). [Color figure can be viewed at http://wileyonlinelibrary.com]
To further investigate the asymmetry, two regions were chosen, one rightward (inferior frontal gyrus, Fig. 3e,g) and one leftward (parietal, Fig. 3i,k) asymmetric, to show the mean thickness from left and right hemisphere in controls and PAE for each participant as a function of age. For the inferior frontal gyrus of both controls and PAE, the right hemisphere was thicker in most participants than the left (Fig. 3e,g), resulting in a negative asymmetry index across all ages that did not alter with age (Fig. 3f,h). Significant negative correlations of cortical thickness with age were observed in this left cluster in controls (Fig. 3e) and in both hemispheres in PAE with similar reduction slopes (Fig. 3g). For the parietal area, the left hemisphere was thicker than the right over the full age range in many participants and showed a similar bilateral negative correlation of cortical thickness with age (Fig. 3i,k), resulting in a positive AI for many subjects in both groups that did not alter with age (Fig. 3j,l).
Correlation Between Cognitive Scores and Brain Measures
Of the 14 brain volumes versus 14 cognitive scores (a large number of 196 correlations per group), there were no significant correlations with a linear model controlling for age sex, and handedness after FDR correction in PAE. There was 1 cognitive score correlation in controls, namely the NEPSY‐II Memory for Names, which positively correlated with some of the brain volumes (8 of 14, 57%), including intracranial volume (P = 0.01), total volume (P = 0.02), total gray matter volume (P = 0.01), cortex volume (P = 0.01), cerebellum gray matter volume (P = 0.04), hippocampus (P = 0.01), amygdala (P = 0.01), and caudate (P = 0.01). No significant correlations were observed for cognitive scores with vertex cortical thickness or asymmetry index either in PAE or controls after FDR correction.
Post Hoc Analysis for PAE Subgroups
Comparisons between FASD subtypes
The results for left and right hemisphere combined volume and regional (4 main lobes—not vertex based) cortical thickness differences of the PAE subtypes (FAS, pFAS, ARND, and PAE; i.e., undiagnosed FASD)—separately and combined—versus subsets of controls are listed in Table 4 and discussed below separately. These post hoc analyses should be considered preliminary given the small sample sizes in many of the groups and that each group uses a different subset of controls for comparison given the variable age ranges and sex distributions.
Table 4.
Brain volumes and regional cortical thickness (combined left and right, mean ± SD) in FASD subtypes (and a combined FASD group of the three subtypes) and undiagnosed PAE participants
| FASD subtype groups | |||||
|---|---|---|---|---|---|
| FASa | pFASb | ARNDc | PAE Undiagd | FASDe | |
| Volume (cm3) | |||||
| Intracranial | 1492 ± 173 | 1440 ± 223 | 1392 ± 167f | 1388 ± 123 | 1399 ± 175f |
| Total | 1268 ± 141* | 1191 ± 171 | 1153 ± 114* | 1155 ± 90.1* | 1157 ± 128* |
| Total GM | 774 ± 81* | 721 ± 92* | 705 ± 75* | 719 ± 61* | 706 ± 76* |
| Subcortical GM | 205 ± 19* | 189 ± 27* | 185 ± 16* | 187 ± 23* | 185 ± 19* |
| Cortex | 569 ± 72* | 532 ± 67 | 520 ± 66* | 531 ± 55 | 521 ± 64* |
| Total WM | 494 ± 67* | 470 ± 88 | 448 ± 52* | 436 ± 40* | 450 ± 63* |
| Cerebellum GM | 121 ± 15* | 112 ± 19* | 110 ± 12* | 113 ± 21* | 110 ± 14* |
| Cerebellum WM | 28.9 ± 4.8 | 26.9 ± 4.7 | 27.2 ± 7.4 | 26.2 ± 5 | 26.9 ± 6.4* |
| Hippocampus | 9.1 ± 1* | 8.5 ± 1 | 8.1 ± 1* | 8.1 ± 1* | 8.1 ± 1* |
| Amygdala | 3.3 ± 0.4* | 3 ± 0.5 | 3 ± 0.5 | 2.9 ± 0.3* | 3 ± 0.5* |
| Thalamus | 17 ± 2* | 16 ± 2 | 15 ± 1* | 15 ± 0.9* | 15 ± 2* |
| Caudate | 8 ± 1* | 7 ± 1* | 7 ± 1* | 7 ± 1* | 6.9 ± 1* |
| Putamen | 12 ± 1* | 11 ± 2 | 11 ± 1* | 11 ± 1 | 11 ± 1* |
| Globus pallidus | 3.7 ± 0.4* | 3.3 ± 0.6* | 3.2 ± 0.4* | 3.2 ± 0.4* | 3.2 ± 0.5* |
| Cortical thickness (mm) | |||||
| Overall mean | 3.4 ± 0.5 | 3.4 ± 0.2* | 3.4 ± 0.2* | 3.4 ± 0.2* | 3.4 ± 0.3* |
| Frontal area | 3.5 ± 0.6 | 3.5 ± 0.2* | 3.6 ± 0.2* | 3.6 ± 0.3* | 3.6 ± 0.3* |
| Parietal area | 3.1 ± 0.5 | 3.2 ± 0.2* | 3.2 ± 0.2* | 3.2 ± 0.2* | 3.2 ± 0.3* |
| Temporal area | 3.5 ± 0.5 | 3.5 ± 0.2* | 3.6 ± 0.2* | 3.6 ± 0.2* | 3.5 ± 0.3* |
| Occipital area | 3.1 ± 0.4 | 3.1 ± 0.2* | 3.1 ± 0.2* | 3.1 ± 0.2 | 3.1 ± 0.2* |
1 FAS (n = 7) versus 5 controls (n = 35).
1 pFAS (n = 12) versus 3 controls (n = 36).
1 ARND (n = 37) versus 2 controls (n = 74).
PAE Undiag: Undiagnosed PAE (n = 22) versus 3 controls (n = 66).
1 FASD (n = 56) versus 1 controls (n = 56).
*The current group has a significant difference compared to their best‐matched controls after FDR (P < 0.05). Note that the values for each best‐matched control group (differs per PAE subgroup) are not shown.
Statistical comparisons are relative to various control subgroups.
FAS (N = 7, 13.6 ± 3.4 years, range 9.7–18.5 years, 3 females, see Table 1) versus 1:5 controls (N = 35, 13.1 ± 2.8 years, range 9.1–18.5 years, 15 females). All brain volumes were reduced except the intracranial volume in FAS, but there were no reductions in regional cortical thickness.
pFAS (N = 12, 12.4 ± 3.0 years, range 7.9–17.3 years, 6 females) versus 1:3 controls (N = 36, 12.2 ± 2.9 years, range 7.1–17.3 years, 18 females). No brain volume was altered except the caudate that was significantly reduced and all regional cortical thickness was significantly reduced in pFAS.
ARND (N = 37, 13.5 ± 3.3 years, range 7.7–18.9 years, 20 females) versus 1:1 controls (N = 37, 12.3 ± 3.2 years, range 7.1–18.5 years, females). ARND showed reductions in all brain volumes except cerebellum white matter and amygdala, and all regional cortical thickness.
Undiagnosed PAE (N = 22, 11.5 ± 3.4 years, range 5.5–17.5 years, 11 females) versus 1:3 best matched controls (N = 66, 11.6 ± 3.1 years, range 5.8–18.5 years, 33 females). All the brain volumes were reduced except intracranial, cortex, cerebellum white matter, and putamen. The regional cortical thickness values were reduced in the frontal, parietal, and temporal lobes, but not in the occipital lobe.
Diagnosed FASD only (N = 56, 13.3 ± 3.2 years, range 7.7–18.9 years, 29 females) versus 1:1 controls (N = 56, 12.9 ± 3.0 years, range 7.1–18.5 years, 29 females). When combining FAS, pFAS, and ARND together, all regions showed reductions of volume and cortical thickness.
PAE with and without comorbidity
Forty‐seven (60%) PAE participants had at least one of various psychiatric comorbidities including ADHD, anxiety, oppositional defiant disorder (ODD), depression, bipolar disorder, psychosis disorder, conduct disorder, autism, and others. Thirty‐one had only one symptom, 9 had 2 comorbidities, 5 had 3, and 2 had 4 the maximum. PAE with at least one comorbidity had diagnoses of 6 FAS (13% of 47), 8 pFAS (17%), 23 ARND (49%), and 10 PAE not formally diagnosed yet (21%), while PAE without comorbidity were composed of 1 FAS (3%), 4 pFAS (13%), 14 ARND (45%), and 12 not diagnosed (39%). At the time of scanning, 35 PAE participants were on at least one medication. Results for psychometric measurements for PAE subgroups with and without comorbidity are given in Supporting Information, Table I. Decreased cognitive scores were observed in both PAE groups with and without comorbidities when separately compared to their best‐matched controls in all tests with the exception of NEPSY‐II Response Set subtest. No differences in behavioral measures were observed between the PAE group with comorbidities and the PAE group without comorbidities.
Wide spread cortical thickness reductions were observed in the PAE with comorbidity group (N = 47, 12.9 ± 3.5 years) compared to their best‐matched controls (N = 47, 12.7 ± 3.3 years). PAE without any comorbidity (N = 31, 12.5 ± 3.2 years) did not differ from their best matched controls (N = 31, 12.5 ± 3.4 years) on vertex cortical thickness after FDR. All volumes and mean thickness for 4 primary lobes in PAE with comorbidity were reduced compared to their best matched controls (Supporting Information, Table II). Only deep gray matter structures, except the putamen, were reduced in volume in PAE without comorbidity compared to their best controls. By comparing PAE with comorbidity and without comorbidity, some global volumes, including total volume, gray matter, subcortical gray matter, cerebellum gray matter, and putamen were reduced to a greater extent in PAE with comorbidity. Cortical thickness asymmetry did not differ between the PAE sub groups with or without comorbidities (data not shown).
The most commonly seen comorbidity was ADHD (22 of 47 who had at least one comorbidity, 47%) with 13 PAE came with ADHD only, and 9 with ADHD and other symptoms. Comparison of regional cortical thickness and brain volumes was performed between PAE with ADHD comorbidity (N = 22, 13.2 ± 2.8 years) versus their best‐matched controls (N = 22, 13.2 ± 2.7 years), non‐ADHD PAE (N = 56, 12.3 ± 3.2 years) versus their best‐matched controls (N = 56, 12.6 ± 3.6 years), and ADHD PAE versus non‐ADHD PAE. All brain volumes and cortical thickness in the four major lobes were significantly reduced by 5–13% in PAE participants with ADHD relative to controls (P < 0.05, after FDR). In contrast, non‐ADHD PAE showed 9–17% volume reductions versus controls in only a subset of structures including total subcortical gray matter, cerebellum gray and white matter, thalamus, caudate, putamen, and globus pallidus (P < 0.05, after FDR, data not shown). The cortical thickness in all four major lobes was reduced in non‐ADHD PAE versus their controls. Within the PAE group, those with ADHD had reduced brain volumes (4–7%) relative to non‐ADHD for total brain volume, total gray matter volume, cortical gray matter volume, total white matter volume, hippocampus, amygdala, thalamus, and putamen. Regional cortical thickness or cortical asymmetry (data not shown) did not differ between the PAE groups with or without ADHD.
Ethnicity
The PAE group was separated into Caucasian PAE (N = 24, 12.1 ± 3.3 years, range 6.9–18.5 years, 12 females), PAE of Aboriginals (First Nations/Metis/Inuit; N = 36, 12.8 ± 3.5 years, range 6.8–18.6 years, 21 females), and PAE of other ethnicity (N = 18, 13.6 ± 3.1 years, range 5.5–18.9 years, 7 females); see Supporting Information, Table III. Between Caucasian PAE and their Caucasian controls (N = 24, 12.1 ± 3.3 years, range 5.8–18.5 years, 11 females), all regional cortical thickness in the four major lobes and brain volumes, except the cerebellum gray and white matter, were significantly reduced (7–15%) in Caucasian PAE. These results are comparable to the full PAE and control samples (Table 3). There were no significant brain volume differences between PAE of Caucasian or Aboriginal ethnicity, but the overall and cortical thickness of the four major lobes were thinner in Caucasian PAE by 3–6% relative to Aboriginal PAE. There were no significant differences in all measures between PAE of Caucasian and PAE of other ethnicity (data not shown), nor brain volume or thickness difference between Aboriginal PAE and PAE of other ethnicity. Cortical thickness asymmetry patterns were similar and there was no difference in cortical asymmetry between ethnicity subgroups (data not shown).
DISCUSSION
One of the main novel findings in this study was the similar cortical asymmetry pattern in PAE relative to controls, with rightward clusters located in inferior frontal and medial occipital regions and leftward clusters mainly found in parietal and frontal regions (Fig. 3). Asymmetry index maps were similar with no statistical group difference between PAE and controls, and there were no age by group interactions of cortical asymmetry versus age. The overall pattern of reduced cortical thickness with age in both hemispheres was similar between PAE and controls (Fig. 2), suggesting common developmental processes that preserve the cortical asymmetry even in PAE, despite the thinner cortex (Fig. 1). The thickness of the cerebral cortex is asymmetric in humans [Luders, 2005] and the asymmetry of cortical thickness alters with development from children to adults [Shaw et al., 2009; Zhou et al., 2013]. The degree of cortical asymmetry has been linked to cognitive performance on working memory and vocabulary tasks in healthy subjects over the lifespan [Plessen et al., 2014], and psychiatric or neurological deficits, such as at‐risk mental state [Haller et al., 2009], schizophrenia [Hamilton et al., 2007], sex‐chromosome aneuploidies [Lin et al., 2015], and ADHD [Shaw et al., 2009]. The PAE cohort had difficulties in a number of cognitive domains (Table 2), yet still had intact cortical asymmetry, suggesting a greater relevance of the overall thinner cortex to cognitive function. We are not aware of any prior studies that have investigated the cortical thickness asymmetry in PAE, although one study reported reduced gray matter density asymmetry in Brodmann's areas 21, 22, and 37 (temporal area) in 21 PAE participants 8–22 years [Sowell et al., 2002].
The other goals of this study were to verify the brain volume and cortical thickness reductions in PAE. New participants were recruited from four sites across Canada to yield a much larger sample size (78 PAE) and had no subject overlap relative to our previous studies on brain volumes [Nardelli et al., 2011] and cortical thickness [Zhou et al., 2011]. The 3D T1‐weighted image analysis methods used in this study are similar to our previous studies using Freesurfer for extracting the brain volumes and CIVET/SurfStat for the cortical thickness analysis. The most consistent imaging finding in PAE was replicated here, namely widespread reductions of volume for intracranial (−4%), total cerebrum (−6%), cortical gray matter (−6%), white matter (−5%), and all six deep gray matter structures (−8%). The greatest proportional volume reductions were in the pallidum (−11% left/−8% right) and caudate (−12% left/−11% right), in agreement with our earlier study [Nardelli et al., 2011]. Other independent studies have also observed lower basal ganglia volume which includes caudate and pallidum [Cortese et al., 2006; Mattson et al., 1996], and widespread volume reductions across broad age ranges (n = 65 PAE, 8–15 years, [Astley et al., 2009]; n = 75 PAE, 7–16 years, [Gautam et al., 2015a]). Greater proportional volume alterations have been reported for the FAS/pFAS group relative to other FASD diagnostic subtypes [Astley et al., 2009]. Our previous studies did not measure the cerebellum, but here we report ∼8–10% volume reductions of cerebellum white and gray matter, which is in close agreement with previous research [Archibald et al., 2001; Astley et al., 2009; Cardenas et al., 2014; Mattson et al., 1992; Sowell et al., 1996]. The shrinkage of cerebellum may be attributed to the selective vulnerability of cerebellar Purkinje and granule cells to the neurotoxic effects of PAE [Goodlett et al., 1990; Maier et al., 1999]. Many brain volumes were still reduced in PAE after controlling for overall brain volume, including the total subcortical gray‐matter volume (P = 0.0003), cortex volume (P = 0.02), cerebellum gray matter (P = 0.01), cerebellum white matter (P = 0.02), hippocampus (P = 0.04), amygdala (P = 0.002), thalamus (P = 0.0002), and globus pallidus (P = 0.0001).
The thinner cortex in PAE replicates our previous study on 33 PAE participants [Zhou et al., 2011], with similar patterns that cover bilateral paracentral, inferior frontal, temporal, and occipital regions (Fig. 1d and Fig. 2d in Zhou et al. [2011]). Three previous studies have reported increased regional cortical thickness for PAE participants in a variety of brain regions including in bilateral temporal lobes and the right frontal lobe [Fernández‐Jaén et al., 2011], in bilateral temporal and inferior parietal and right inferior frontal regions [Sowell et al., 2008], and in frontal, temporal, and parietal regions [Yang et al., 2012]. The two latter studies were from the same research group and had partly overlapping participants. The discrepancy between studies may reflect population differences, including different compositions of subtypes of PAE. For example, the studies that found thicker cortex all included large proportions of participants with FAS in their populations with 20 of 20 participants (100%) [Fernández‐Jaén et al., 2011], 14 FAS of 21 participants (67%) [Sowell et al., 2008] and 21 of 42 participants (50%) [Yang et al., 2012]. This is compared to only 7 of 78 (9%) participants in this study and 5 of 33 participants (15%) in our previous study [Zhou et al., 2011]. Two studies reported no change of cortical thickness in PAE [Rajaprakash et al., 2014; Wozniak et al., 2013]. One study included 8% FAS plus 29% pFAS in 24 FASD participants (10–17 years) [Wozniak et al., 2013] and the other with all participants diagnosed with ARND (8–15 years) [Rajaprakash et al., 2014]. It is notable that the latter study still found reduced global and regional cortical volumes in PAE [Rajaprakash et al., 2014]. However, a recent study showed reduced regional cortical thickness in parietal, occipitotemporal, and occipital regions in 18 FAS and 10 pFAS individuals over the 9–12 years old age range, and that greater maternal alcohol consumption was related to thinner cortex in these three regions of interest [Robertson et al., 2015]. Another recent study also reported that thinner cortex in the orbitofrontal regions was associated with higher PAE of 42 participants aged 14–16 years [Gautam et al., 2015b].
In our post hoc analysis (Table 4), we analyzed the brain volumes and regional cortical thickness (overall mean across the cortical mantle, mean thickness in frontal, parietal, temporal, and occipital areas) among all current FASD subtypes (FAS, pFAS, ARND) and undiagnosed PAE. We observed consistent reductions in most of the subtypes compared to their best matched controls in most of the brain volumes and regional cortical thickness (Table 4). However, a limitation of our FASD subtype analysis was that there were only 7 FAS and 12 pFAS participants in the current cohort, and therefore the observation that the regional cortical thickness in FAS were not significantly reduced (Table 4), and only 5 of 14 volumes were less in pFAS, may simply reflect the limited sample size of these two subgroups. This subgroup analysis should be considered preliminary. However, the current study is more in line with several animal model studies that find globally cortical volumes and cortical thickness decreases in rats [Leigland et al., 2013], cortical volume reductions in mice [O'Leary‐Moore et al., 2010], fewer neurons in the frontal cortex in vervet monkeys [Burke et al., 2009], somatosensory and motor cortices in macaque [Miller, 2007], and medial prefrontal cortex in rats [Mihalick et al., 2001], and deficits in dendritic spines and synaptic ultrastructure in visual cortex in mice [Cui et al., 2010] with PAE. To investigate the discrepancy of the status of cortical thickness in PAE participants, future work should assess cortical morphology in different subtypes of PAE, although this will require larger sample sizes than in this study, and utilize the same processing methodology and statistics over different independent samples.
Mental health conditions are commonly found in FASD. In the current sample, there were 47 (60% of 78) PAE participants diagnosed with at least one comorbidity. Although this rate is lower than 90% in a review described by Pei et al. [2011], it is comparable to 63% described by [Steinhausen and Spohr, 1998]. A post‐hoc analysis of PAE participants with psychiatric comorbidity appeared to be more severely affected as shown by more widespread reductions of cortical thickness and more brain regions with reductions of volume, even though no effect of comorbidity was observed in cognitive scores (Supporting Information, Tables I and II). ADHD is the most common comorbidity in FASD [Coles et al., 1997; Kingdon et al., 2015], and in our study, 46% of the PAE participants with comorbidity (N = 47) had ADHD (PAE + ADHD, n = 22). Children and adolescents with ADHD exhibit smaller brain volume regions and thinner cortex (for a review, see Dennis and Thompson [2013]), which is in agreement with this study, that both groups of PAE participants with or without ADHD showed reduced brain volumes, including cerebellum volumes, which is also in line with a previous study [de Zeeuw et al., 2012]. Several of the psychiatric comorbidities experienced in the FASD sample here may have heritable origins and may themselves be associated with changes in brain structure. Given that only 9% of PAE participants in this study were living with their birth parents, it was not possible to determine if a family history (i.e., genetic risk) of psychopathology was present. Thus, volumetric differences of brain structure (and cognitive performance) in PAE subgroups with comorbidities may be explained by a combination of PAE, other lifetime adversity, and genetic risk that cannot be fully assessed here.
Imaging research of PAE populations are challenging given the inherent intersubject variability in this cohort, recruitment biases, and the presence of other potentially detrimental developmental insults (to the brain) beyond PAE, such as prenatal exposure to other substances such as tobacco smoke (for a review, see Ekblad et al. [2015]) and opiates [Walhovd et al., 2007]. Often the PAE accompanies factors such as poverty, lack of nutrition or psychiatric issues [May et al., 2016], and the alcohol exposure itself can also induce a series of side effects such as malabsorption of nutrients, maternal hypoxia, oxidative stress, and altered metabolism. All these factors together could deleteriously affect fetus brain development (for reviews, see Goodlett and Horn [2001] and Young et al. [2014]). In the current NeuroDevNet project, other maternal factors such as smoking, other drug/substance usage, IQ, mental psychopathology, nor the exact amount or timing of alcohol consumed during pregnancy could not be collected for the majority of participants. Much of this information was not obtainable given the age at which these volunteers are identified and recruited at the time of study. In the 76 PAE of 78 with information available, only 7 (9%) PAE were staying with their biological parents, with 45 adopted, 14 under foster care, and 10 living with custodians. Most of the demographic information was obtained from the participant's current primary caregiver (adopted/foster/custodian parents) who may or may not have accurate knowledge of the children's birth parents. It is a limitation of our study, and most other such studies that are not prospective from pregnancy onwards. Considering that an FASD diagnosis is more prevalent in some lower SES populations [May et al., 2009], the SES is also a potential confounding factor for children's brain volume. However, in Table 1 of our cohort, controls had an SES of 46.6 ± 8.6 which was similar to that of PAE at 42.9 ± 14.6 (P = 0.06). The data were also analyzed by adding SES as a covariate and reductions of cortical thickness and brain volumes (data not shown) were similar when not correcting for SES. Sorting out the individual contributions of various confounds beyond prenatal alcohol (i.e., the associated conditions) is desirable but is beyond the scope of this article.
The ethnicities were not balanced in this study (Table 1) with controls being mostly Caucasian (89%) while the PAE had a greater number of Aboriginals (51%), which is itself a very mixed group of First Nations, Metis, and Inuit. The post hoc analysis (Supporting Information, Table III) showed that the brain volumes and cortical thickness were also reduced in Caucasian PAE relative to matched Caucasian controls, and there was no difference in brain volumes between PAE participants who were Caucasian versus First Nations/Metis/Inuit; nor were there volume differences of First Nations/Metis/Inuit PAE to PAE of other ethnicities. Therefore, perhaps not surprisingly, children and adolescents with PAE have reduced brain volumes regardless of ethnicity in keeping with other MRI studies whose participant populations have diverse ethnic backgrounds (not separated out during image analysis) and that also have a better ethnic balance between the PAE and control groups [Astley et al., 2009; Lebel et al., 2012] or where both groups have one ethnic background [Meintjes et al., 2014]. In addition, a recent paper on an ethnically homogeneous group has reported cortical thinning in PAE during preadolescence [Robertson et al., 2015]. However, it should be pointed out that each “ethnicity” is often a very diverse group on its own. Many brain MRI publications of FASD/PAE do not report ethnicity at all.
CONCLUSION
In conclusion, widespread thinner cortex bilaterally and globally reduced brain volumes were observed in children and adolescents with PAE, but there was preservation of the pattern of cortical thickness asymmetry relative to healthy nonexposed controls. In addition, the cross‐sectional cohort with PAE also showed regional patterns of cortical thickness being smaller with age similar to controls. Therefore, typical developmental patterns do occur in the cortex postpartum well after the prenatal exposure to alcohol, even though the cortical thickness and brain volumes are smaller.
Conflict of Interest
None declared.
Supporting information
Supporting Information Tables.
REFERENCES
- Archibald SL, Fennema‐Notestine C, Gamst A, Riley EP, Mattson SN, Jernigan TL (2001): Brain dysmorphology in individuals with severe prenatal alcohol exposure. Dev Med Child Neurol 43:148–154. [PubMed] [Google Scholar]
- Astley SJ (2013): Validation of the fetal alcohol spectrum disorder (FASD) 4‐digit diagnostic code. J Popul Ther Clin Pharmacol 20:e416–e467. [PubMed] [Google Scholar]
- Astley SJ, Aylward EH, Olson HC, Kerns K, Brooks A, Coggins TE, Davies J, Dorn S, Gendler B, Jirikowic T, Kraegel P, Maravilla K, Richards T (2009): Magnetic resonance imaging outcomes from a comprehensive magnetic resonance study of children with fetal alcohol spectrum disorders. Alcohol Clin Exp Res 33:1671–1689. [DOI] [PMC free article] [PubMed] [Google Scholar]
- Burke MW, Palmour RM, Ervin FR, Ptito M (2009): Neuronal reduction in frontal cortex of primates after prenatal alcohol exposure. Neuroreport 20:13–17. [DOI] [PubMed] [Google Scholar]
- Cardenas V. a, Price M, Infante MA, Moore EM, Mattson SN, Riley EP, Fein G (2014): Automated cerebellar segmentation: Validation and application to detect smaller volumes in children prenatally exposed to alcohol. NeuroImage Clin 4:295–301. [DOI] [PMC free article] [PubMed] [Google Scholar]
- Chalavi S, Simmons A, Dijkstra H, Barker G, Reinders a (2012): Quantitative and qualitative assessment of structural magnetic resonance imaging data in a two‐center study. BMC Med Imaging 12:12–27. [DOI] [PMC free article] [PubMed] [Google Scholar]
- Chudley AE, Conry J, Cook JL, Loock C, Rosales T, LeBlanc N (2005): Fetal alcohol spectrum disorder: Canadian guidelines for diagnosis. CMAJ 172:S1–S21. [DOI] [PMC free article] [PubMed] [Google Scholar]
- Chung MK, Worsley KJ, Robbins S, Paus T, Taylor J, Giedd JN, Rapoport JL, Evans AC (2003): Deformation‐based surface morphometry applied to gray matter deformation. NeuroImage 18:198–213. [DOI] [PubMed] [Google Scholar]
- Clarren SK, Smith DW (1978): The fetal alcohol syndrome. N Engl J Med 298:1063–1067. [DOI] [PubMed] [Google Scholar]
- Coles CD, Platzman KA, Raskind‐Hood CL, Brown RT, Falek A, Smith IE (1997): A comparison of children affected by prenatal alcohol exposure and attention deficit, hyperactivity disorder. Alcohol Clin Exp Res 21:150–161. [PubMed] [Google Scholar]
- Cortese BM, Moore GJ, Bailey B. a, Jacobson SW, Delaney‐Black V, Hannigan JH (2006): Magnetic resonance and spectroscopic imaging in prenatal alcohol‐exposed children: Preliminary findings in the caudate nucleus. Neurotoxicol Teratol 28:597–606. [DOI] [PubMed] [Google Scholar]
- Cui Z‐J, Zhao K‐B, Zhao H‐J, Yu D‐M, Niu Y‐L, Zhang J‐S, Deng J‐B (2010): Prenatal alcohol exposure induces long‐term changes in dendritic spines and synapses in the mouse visual cortex. Alcohol 45:312–319. [DOI] [PubMed] [Google Scholar]
- Dennis EL, Thompson PM (2013): Typical and atypical brain development: A review of neuroimaging studies. Dialog Clin Neurosci 15:359–384. [DOI] [PMC free article] [PubMed] [Google Scholar]
- Ekblad M, Korkeila J, Lehtonen L (2015): Smoking during pregnancy affects foetal brain development. Acta Paediatr 104:12–18. [DOI] [PubMed] [Google Scholar]
- Fernández‐Jaén A, Fernández‐Mayoralas DM, Quiñones Tapia D, Calleja‐Pérez B, García‐Segura JM, Arribas SL, Muñoz Jareño N (2011): Cortical thickness in fetal alcohol syndrome and attention deficit disorder. Pediatr Neurol 45:387–391. [DOI] [PubMed] [Google Scholar]
- Fischl B, Dale AM (2000): Measuring the thickness of the human cerebral cortex from magnetic resonance images. Proc Natl Acad Sci USA 97:11050–11055. [DOI] [PMC free article] [PubMed] [Google Scholar]
- Fischl B, Salat DH, Busa E, Albert M, Dieterich M, Haselgrove C, van der Kouwe A, Killiany R, Kennedy D, Klaveness S, Montillo A, Makris N, Rosen B, Dale AM (2002): Whole brain segmentation: Automated labeling of neuroanatomical structures in the human brain. Neuron 33:341–355. [DOI] [PubMed] [Google Scholar]
- Gautam P, Lebel C, Narr KL, Mattson SN, May PA, Adnams CM, Riley EP, Jones KL, Kan EC, Sowell ER (2015a): Volume changes and brain‐behavior relationships in white matter and subcortical gray matter in children with prenatal alcohol exposure. Hum Brain Mapp 36:2318–2329. [DOI] [PMC free article] [PubMed] [Google Scholar]
- Gautam P, Warner TD, Kan EC, Sowell ER (2015b): Executive function and cortical thickness in youths prenatally exposed to cocaine, alcohol and tobacco. Dev Cogn Neurosci 1–11. [DOI] [PMC free article] [PubMed] [Google Scholar]
- Goodlett CR, Marcussen BL, West JR (1990): A single day of alcohol exposure during the brain growth spurt induces brain weight restriction and cerebellar Purkinje cell loss. Alcohol 7:107–114. [DOI] [PubMed] [Google Scholar]
- Goodlett CR, Horn KH (2001): Mechanisms of alcohol‐induced damage to the developing nervous system. Alcohol Res Health 25:175–184. [PMC free article] [PubMed] [Google Scholar]
- Haller S, Borgwardt SJ, Schindler C, Aston J, Radue EW, Riecher‐Rössler A (2009): Can cortical thickness asymmetry analysis contribute to detection of at‐risk mental state and first‐episode psychosis? A pilot study. Radiology 250:212–221. [DOI] [PubMed] [Google Scholar]
- Hamilton LS, Narr KL, Luders E, Szeszko PR, Thompson PM, Bilder RM, Toga AW (2007): Asymmetries of cortical thickness: Effects of handedness, sex, and schizophrenia. Neuroreport 18:1427–1431. [DOI] [PMC free article] [PubMed] [Google Scholar]
- Han X, Jovicich J, Salat D, van der Kouwe A, Quinn B, Czanner S, Busa E, Pacheco J, Albert M, Killiany R, Maguire P, Rosas D, Makris N, Dale A, Dickerson B, Fischl B (2006): Reliability of MRI‐derived measurements of human cerebral cortical thickness: The effects of field strength, scanner upgrade and manufacturer. NeuroImage 32:180–194. [DOI] [PubMed] [Google Scholar]
- Hollingshead AB (2011): Four factor index of social status. Yale J Sociol 8:21–52. [Google Scholar]
- Jones KL, Smith DW (1975): The fetal alcohol syndrome. Teratology 12:1–10. [DOI] [PubMed] [Google Scholar]
- Jovicich J, Marizzoni M, Sala‐Llonch R, Bosch B, Bartrés‐Faz D, Arnold J, Benninghoff J, Wiltfang J, Roccatagliata L, Nobili F, Hensch T, Tränkner A, Schönknecht P, Leroy M, Lopes R, Bordet R, Chanoine V, Ranjeva J, Didic M, Gros‐Dagnac H, Payoux P, Zoccatelli G, Alessandrini F, Beltramello A, Bargalló N, Blin O, Frisoni GB (2013): Brain morphometry reproducibility in multi‐center 3T MRI studies: A comparison of cross‐sectional and longitudinal segmentations. NeuroImage 83:472–484. [DOI] [PubMed] [Google Scholar]
- Kim JS, Singh V, Lee JK, Lerch J, Ad‐Dab'bagh Y, MacDonald D, Lee JM, Kim SI, Evans AC (2005): Automated 3‐D extraction and evaluation of the inner and outer cortical surfaces using a Laplacian map and partial volume effect classification. NeuroImage 27:210–221. [DOI] [PubMed] [Google Scholar]
- Kingdon D, Cardoso C, McGrath JJ (2015): Research review: Executive function deficits in fetal alcohol spectrum disorders and attention‐deficit/hyperactivity disorder ‐ A meta‐analysis. J Child Psychol Psychiatry. [DOI] [PMC free article] [PubMed] [Google Scholar]
- Korkman M, Kirk U, Kemp S (2007): NEPSY‐II. Clinical and Interpretation Manual. San Antonio, TX: Harcourt Assessment. [Google Scholar]
- Lebel C, Mattson SN, Riley EP, Jones KL, Adnams CM, May PA, Bookheimer SY, O'Connor MJ, Narr KL, Kan E, Abaryan Z, Sowell ER (2012): A longitudinal study of the long‐term consequences of drinking during pregnancy: Heavy in utero alcohol exposure disrupts the normal processes of brain development. J Neurosci 32:15243–15251. [DOI] [PMC free article] [PubMed] [Google Scholar]
- Lebel C, Roussotte F, Sowell ER (2011): Imaging the impact of prenatal alcohol exposure on the structure of the developing human brain. Neuropsychol Rev 21:102–118. [DOI] [PMC free article] [PubMed] [Google Scholar]
- Leigland LA, Ford MM, Lerch JP, Kroenke CD (2013): The influence of fetal ethanol exposure on subsequent development of the cerebral cortex as revealed by magnetic resonance imaging. Alcohol Clin Exp Res 37:924–932. [DOI] [PMC free article] [PubMed] [Google Scholar]
- Lin A, Clasen L, Lee NR, Wallace GL, Lalonde F, Blumenthal J, Giedd JN, Raznahan A (2015): Mapping the stability of human brain asymmetry across five sex‐chromosome aneuploidies. J Neurosci 35:140–145. [DOI] [PMC free article] [PubMed] [Google Scholar]
- Luders E (2005): Hemispheric asymmetries in cortical thickness. Cereb Cortex 16:1232–1238. [DOI] [PubMed] [Google Scholar]
- Lyttelton O, Boucher M, Robbins S, Evans A (2007): An unbiased iterative group registration template for cortical surface analysis. NeuroImage 34:1535–1544. [DOI] [PubMed] [Google Scholar]
- MacDonald D, Kabani N, Avis D, Evans a. C (2000): Automated 3‐D extraction of inner and outer surfaces of cerebral cortex from MRI. NeuroImage 12:340–356. [DOI] [PubMed] [Google Scholar]
- Maier SE, Miller J. a, Blackwell JM, West JR (1999): Fetal alcohol exposure and temporal vulnerability: Regional differences in cell loss as a function of the timing of binge‐like alcohol exposure during brain development. Alcohol Clin Exp Res 23:726–734. [DOI] [PubMed] [Google Scholar]
- Mattson SN, Riley EP, Jernigan TL, Ehlers CL, Delis DC, Jones KL, Stern C, Johnson K. a, Hesselink JR, Bellugi U (1992): Fetal alcohol syndrome: A case report of neuropsychological, MRI, and EEG assessment of two children. Alcohol Clin Exp Res 16:1001–1003. [DOI] [PubMed] [Google Scholar]
- Mattson SN, Riley EP, Sowell ER, Jernigan TL, Sobel DF, Jones KL (1996): A decrease in the size of the basal ganglia in children with fetal alcohol syndrome. Alcohol Clin Exp Res 20:1088–1093. [DOI] [PubMed] [Google Scholar]
- May P. a, Gossage JP, Kalberg WO, Robinson LK, Buckley D, Manning M, Hoyme HE (2009): Prevalence and epidemiologic characteristics of FASD from various research methods with an emphasis on recent in‐school studies. Dev Disabil Res Rev 15:176–192. [DOI] [PubMed] [Google Scholar]
- May PA, de Vries MM, Marais A‐S, Kalberg WO, Adnams CM, Hasken JM, Tabachnick B, Robinson LK, Manning MA, Jones KL, Hoyme D, Seedat S, Parry CDH, Hoyme HE (2016): The continuum of fetal alcohol spectrum disorders in four rural communities in South Africa: Prevalence and characteristics. Drug Alcohol Depend 159:207–218. [DOI] [PMC free article] [PubMed] [Google Scholar]
- Meintjes EM, Narr KL, Van Der Kouwe a. JW, Molteno CD, Pirnia T, Gutman B, Woods RP, Thompson PM, Jacobson JL, Jacobson SW (2014): A tensor‐based morphometry analysis of regional differences in brain volume in relation to prenatal alcohol exposure. NeuroImage Clin 5:152–160. [DOI] [PMC free article] [PubMed] [Google Scholar]
- Mihalick SM, Crandall JE, Langlois JC, Krienke JD, Dube WV (2001): Prenatal ethanol exposure, generalized learning impairment, and medial prefrontal cortical deficits in rats 23:453–462. [DOI] [PubMed] [Google Scholar]
- Miller MW (2007): Exposure to ethanol during gastrulation alters somatosensory‐motor cortices and the underlying white matter in the macaque. Cereb Cortex 17:2961–2971. [DOI] [PubMed] [Google Scholar]
- Nardelli A, Lebel C, Rasmussen C, Andrew G, Beaulieu C (2011): Extensive deep gray matter volume reductions in children and adolescents with fetal alcohol spectrum disorders. Alcohol Clin Exp Res 35:1404–1417. [DOI] [PubMed] [Google Scholar]
- Norman AL, Crocker N, Mattson SN, Riley EP (2009): Neuroimaging and fetal alcohol spectrum disorders. Dev Disabil Res Rev 15:209–217. [DOI] [PMC free article] [PubMed] [Google Scholar]
- O'Leary‐Moore SK, Parnell SE, Godin E. a, Dehart DB, Ament JJ, Khan A. a, Johnson GA, Styner M. a, Sulik KK (2010): Magnetic resonance microscopy‐based analyses of the brains of normal and ethanol‐exposed fetal mice. Birth Defects Res A Clin Mol Teratol 88:953–964. [DOI] [PMC free article] [PubMed] [Google Scholar]
- Pei J, Denys K, Hughes J, Rasmussen C (2011): Mental health issues in fetal alcohol spectrum disorder. J Ment Health 20:438–448. [DOI] [PubMed] [Google Scholar]
- Pickering S, Gathercole S (2001): Working Memory Test Battery for Children. London, England: Psychological Corporation Europe. [Google Scholar]
- Plessen KJ, Hugdahl K, Bansal R, Hao X, Peterson BS (2014): Sex, age, and cognitive correlates of asymmetries in thickness of the cortical mantle across the life span. J Neurosci 34:6294–6302. [DOI] [PMC free article] [PubMed] [Google Scholar]
- Rajaprakash M, Chakravarty MM, Lerch JP, Rovet J (2014): Cortical morphology in children with alcohol‐related neurodevelopmental disorder. Brain Behav 4:41–50. [DOI] [PMC free article] [PubMed] [Google Scholar]
- Reynolds JN, Weinberg J, Clarren S, Beaulieu C, Rasmussen C, Kobor M, Dube MP, Goldowitz D (2011): Fetal alcohol spectrum disorders: Gene‐environment interactions, predictive biomarkers, and the relationship between structural alterations in the brain and functional outcomes. Semin Pediatr Neurol 18:49–55. [DOI] [PMC free article] [PubMed] [Google Scholar]
- Robertson FC, Narr KL, Molteno CD, Jacobson JL, Jacobson SW, Meintjes EM (2015): Prenatal alcohol exposure is associated with regionally thinner cortex during the preadolescent period. Cereb Cortex 1–13. [DOI] [PMC free article] [PubMed] [Google Scholar]
- Shaw P, Lalonde F, Lepage C, Rabin C, Eckstrand K, Sharp W, Greenstein D, Evans A, Giedd JN, Rapoport J (2009): Development of cortical asymmetry in typically developing children and its disruption in attention‐deficit/hyperactivity disorder. Arch Gen Psychiatry 66:888–896. [DOI] [PMC free article] [PubMed] [Google Scholar]
- Sowell ER, Jernigan TL, Mattson SN, Riley EP, Sobel DF, Jones KL (1996): Abnormal development of the cerebellar vermis in children prenatally exposed to alcohol: Size reduction in lobules I‐V. Alcohol Clin Exp Res 20:31–34. [DOI] [PubMed] [Google Scholar]
- Sowell ER, Mattson SN, Kan E, Thompson PM, Riley EP, Toga AW (2008): Abnormal cortical thickness and brain‐behavior correlation patterns in individuals with heavy prenatal alcohol exposure. Cereb Cortex 18:136–144. [DOI] [PMC free article] [PubMed] [Google Scholar]
- Sowell ER, Thompson PM, Peterson BS, Mattson SN, Welcome SE, Henkenius AL, Riley EP, Jernigan TL, Toga AW (2002): Mapping cortical gray matter asymmetry patterns in adolescents with heavy prenatal alcohol exposure. NeuroImage 17:1807–1819. [DOI] [PubMed] [Google Scholar]
- Steinhausen HC, Spohr HL (1998): Long‐term outcome of children with fetal alcohol syndrome: Psychopathology, behavior, and intelligence. Alcohol Clin Exp Res 22:334–338. [DOI] [PubMed] [Google Scholar]
- Toga AW, Thompson PM (2003): Mapping brain asymmetry. Nat Rev Neurosci 4:37–48. [DOI] [PubMed] [Google Scholar]
- Treit S, Zhou D, Beaulieu C (2013): Within‐Subject Reliability of DTI and T1‐weighted MRI Data Across 4 Scanners in NeuroDevNet. In: NeuroDevNet Brain Development Conference. Vancouver, Canada.
- Treit S, Zhou D, Lebel C, Rasmussen C, Andrew G, Beaulieu C (2014): Longitudinal MRI reveals impaired cortical thinning in children and adolescents prenatally exposed to alcohol. Hum Brain Mapp 35:4892–4903. [DOI] [PMC free article] [PubMed] [Google Scholar]
- Walhovd KB, Moe V, Slinning K, Due‐Tønnessen P, Bjørnerud A, Dale AM, van der Kouwe A, Quinn BT, Kosofsky B, Greve D, Fischl B (2007): Volumetric cerebral characteristics of children exposed to opiates and other substances in utero. NeuroImage 36:1331–1344. [DOI] [PMC free article] [PubMed] [Google Scholar]
- Wonderlick JS, Ziegler D. a, Hosseini‐Varnamkhasti P, Locascio JJ, Bakkour a, van der Kouwe a, Triantafyllou C, Corkin S, Dickerson BC (2009): Reliability of MRI‐derived cortical and subcortical morphometric measures: Effects of pulse sequence, voxel geometry, and parallel imaging. NeuroImage 44:1324–1333. [DOI] [PMC free article] [PubMed] [Google Scholar]
- Woodcock RW (1998): Woodcock Reading Mastery Tests‐Revised/Normative Update. Circle Pines, MN: American Guidance Service. [Google Scholar]
- Woodcock R, McGrew K, Mather N (2001): Woodcock‐Johnson III Tests of Achievement. Itasca, IL: Riverside Publishing. [Google Scholar]
- Wozniak JR, Mueller B. a, Bell CJ, Muetzel RL, Hoecker HL, Boys CJ, Lim KO (2013): Global functional connectivity abnormalities in children with fetal alcohol spectrum disorders. Alcohol Clin Exp Res 37:748–756. [DOI] [PMC free article] [PubMed] [Google Scholar]
- Yang Y, Roussotte F, Kan E, Sulik KK, Mattson SN, Riley EP, Jones KL, Adnams CM, May PA, O'Connor MJ, Narr KL, Sowell ER (2012): Abnormal cortical thickness alterations in fetal alcohol spectrum disorders and their relationships with facial dysmorphology. Cereb Cortex 22:1170–1179. [DOI] [PMC free article] [PubMed] [Google Scholar]
- Young JK, Giesbrecht HE, Eskin MN, Aliani M, Suh M (2014): Nutrition implications for fetal alcohol spectrum disorder. Adv Nutr 5:675–692. [DOI] [PMC free article] [PubMed] [Google Scholar]
- de Zeeuw P, Zwart F, Schrama R, van Engeland H, Durston S (2012): Prenatal exposure to cigarette smoke or alcohol and cerebellum volume in attention‐deficit/hyperactivity disorder and typical development. Transl Psychiatry 2:e84. [DOI] [PMC free article] [PubMed] [Google Scholar]
- Zhou D, Lebel C, Evans A, Beaulieu C (2013): Cortical thickness asymmetry from childhood to older adulthood. NeuroImage 83:66–74. [DOI] [PubMed] [Google Scholar]
- Zhou D, Lebel C, Lepage C, Rasmussen C, Evans A, Wyper K, Pei J, Andrew G, Massey A, Massey D, Beaulieu C (2011): Developmental cortical thinning in fetal alcohol spectrum disorders. NeuroImage 58:16–25. [DOI] [PubMed] [Google Scholar]
Associated Data
This section collects any data citations, data availability statements, or supplementary materials included in this article.
Supplementary Materials
Supporting Information Tables.