

Abstract
Playing music requires a strong coupling of perception and action mediated by multimodal integration of brain regions, which can be described as network connections measured by anatomical and functional correlations between regions. However, the structural and functional connectivities within and between the auditory and sensorimotor networks after long‐term musical training remain largely uninvestigated. Here, we compared the structural connectivity (SC) and resting‐state functional connectivity (rs‐FC) within and between the two networks in 29 novice healthy young adults before and after musical training (piano) with those of another 27 novice participants who were evaluated longitudinally but with no intervention. In addition, a correlation analysis was performed between the changes in FC or SC with practice time in the training group. As expected, participants in the training group showed increased FC within the sensorimotor network and increased FC and SC of the auditory‐motor network after musical training. Interestingly, we further found that the changes in FC within the sensorimotor network and SC of the auditory‐motor network were positively correlated with practice time. Our results indicate that musical training could induce enhanced local interaction and global integration between musical performance‐related regions, which provides insights into the mechanism of brain plasticity in young adults.
Keywords: auditory‐motor network, brain plasticity, functional connectivity, musical training, structural connectivity
1. INTRODUCTION
Musical performance is complex requiring a strong coupling of perception and action (Schlaug, 2015) which intensive training can induce structural and functional changes in the brain (Boyke, Driemeyer, Gaser, Büchel, & May, 2008; Herdener et al., 2010; Klein, Liem, Hänggi, Elmer, & Jäncke, 2016), even in a short‐term training (Song, Skoe, Banai, & Kraus, 2012). Musical training is an excellent model to study training‐related plasticity in auditory and motor areas. Previous studies have reported that acquiring musical performance skills is associated with functional and structural changes in the auditory and motor cortices (Elmer, Hänggi, Meyer, & Jäncke, 2013; Putkinen, Tervaniemi, Saarikivi, de Vent, & Huotilainen, 2014). Morphological changes (such as grey matter volume and cortical thickness) in different parts of the auditory and motor cortices due to musical training have been reported in the whole‐brain analysis in cross‐sectional (Bermudez, Lerch, Evans, & Zatorre, 2009; Gaser & Schlaug, 2003) and longitudinal (Hyde et al., 2009) studies. In addition to morphological alterations, musical training has also been associated with functional and structural connectivity between cortices.
The human brain is organized in a form of network architecture in which local interactions (short‐range connections) are integrated by long‐range connections to support diverse brain high‐order cognitive function (Park & Friston, 2013). String players, when playing their musical instruments, require information integration between different brain regions supporting auditory, somatosensory, motor, and cognitive function. Resting‐state functional MRI usually measures the spontaneous low frequency fluctuations (<0.1 Hz) in the blood oxygen level‐dependent (BOLD) signals which reflects patterns of brain activity in the absence of an external task. The functional connectivity measured by rs‐fMRI is generally inferred by the correlations of BOLD signals which reflect the synchronization of brain activity between distant brain areas in the absence of an external task. Using independent component analysis, the resting‐state BOLD signals can be decomposed into a limited number of brain networks called intrinsic connectivity networks (ICNs). Functional communication between these networks was considered to be important in performing cognitive processes that integrate information across different brain regions (Guerra‐Carrillo, Mackey, & Bunge, 2014; Harmelech & Malach, 2013). Structural connectivity (SC) usually reflects large‐range fiber bundles inferred from diffusion tensor MRI, which can derive a structural brain network in terms of fiber bundles according to the regions in which they are connected (Basser, Mattiello, & LeBihan, 1994; Hagmann et al., 2007; Park et al., 2004). On a relatively short time scale in which the effects of neuronal growth and learning can be ignored, the structural networks constructed on the basis of anatomical architectures can be considered relatively fixed during different cognitive performances (Stam et al., 2016). However, it has been demonstrated that functional connectivity is task‐related and state‐dependent (Laird et al., 2013; Smith et al., 2009), which changes with task when comparing the functional connectivity statistics during the performance of visual attention and memory tasks (Hermundstad et al., 2013). Dynamic functional networks are intrinsically dependent on the static structural architecture of the connections that enable fast and efficient hierarchical functional integration (Park & Friston, 2013). Playing music depends on a strong coupling of perception and action mediated by multimodal integration regions distributed throughout the brain, especially the auditory and motor regions. Will SC of training‐related regions be modulated in young adults after long‐term musical training? If the FC is intrinsically constrained by the relatively static SC, how does it change after this training? In addition, does musical training have effects on the relationship between SC and FC? These are important questions that require answers to reveal the nature of training‐induced plasticity and to provide new evidence regarding brain mechanisms to explore the changes in SC and FC between those training‐related regions.
In this study, we compared the most relevant auditory and sensorimotor networks of the rs‐FC and SC in 29 novice healthy young adults before and after musical training with those of another 27 novice participants who were evaluated longitudinally but with no intervention. We hypothesized that participants after training, as opposed to the controls with no intervention, would exhibit (1) FC changes in the ICNs within the auditory and motor networks and changes in the auditory–motor interaction, (2) diffusion parameter (fractional anisotropy, (FA)) changes in the SC within the auditory and motor structural network, and changed FA of the probabilistic tract pathway between the auditory and motor areas, and (3) changes of FC would be related to FA changes in the training group.
2. MATERIALS AND METHODS
2.1. Longitudinal experiment
2.1.1. Participants
Sixty young healthy volunteers (29 males and 31 females) participated in this study. Participants with neurological or psychiatric disorders, such as schizophrenia, health problems affecting dexterity, and most importantly, any experience of musical performance, were excluded following a questionnaire. Depressed persons, which were identified by a score >14 on the Beck Depression Inventory (BDI) (Beck & Steer, 1987), were excluded. Participants who were left‐handers or mixed‐handers, as identified via a handedness questionnaire (a modified version of the Edinburgh Handedness Inventory) (Oldfield, 1971), were also excluded. All participants were native Chinese speakers who had grown up in China and provided written informed consent; in addition, the local ethics committee approved this study.
2.1.2. Assessment
The initial assessment included tests of overall cognitive and musical abilities. Measures of overall cognitive and musical abilities were presented to confirm that the training group and control group had similar cognitive and musical abilities and to compare possible training‐related changes with these abilities. All participants were given the Advanced Measures of Music Audiation (1989) which was developed by Edwin E. Gordon to measure musical aptitude or the potential to learn in the musical domain. In the measurement, a series of 30 taped melodic excerpts were played, and participants listened and distinguished potential rhythmic and melodic alterations by choosing the appropriate answer. The percentile rank scores were acquired based on Gordon's table for individuals with a minimum of 12 years of education. In addition, an IQ score containing a performance IQ (PIQ) and a verbal IQ (VIQ) for each participant was acquired by employing the Wechsler Adult Intelligence Scale‐Revised Chinese revised version (WAIS‐RC) (Gong, 1992). Moreover, the trail making tests (parts A and B) (Reitan & Wolfson, 1985) were also performed to assess the visual processing and motor abilities.
The participants, who lacked a musical background (AMMA score: 20∼80) and had normal intelligence (IQ score: 115∼140), were randomly divided into a training group, which received 24 weeks piano training, and a control group without any training. Initially, 30 (14 males) participants were enrolled in the training group and 30 (15 males) participants were enrolled in the control group. Four persons (3 males and 1 female) dropped out due to a failure to comply with the training rules or due to health problems not related to the study design, which resulted in 29 participants (13 males) in the training group and 27 participants (13 males) in the control group.
We used a within‐subject design comprising a training group in which participants received 24 weeks piano training, and a control group without any training. Participants were all tested at three time points: at the beginning (Tp1) and the end (Tp2) of 24 weeks training and at 12 weeks after training (Tp3) as shown in Figure 1a. At each time point, the participants received behavioral tests and scanning sessions. Three subtests (block design, digit symbol, and digit span) of the WAIS‐RC and trail making tests were repeated at all the three time points. These tests were chosen as repeated measures based on their potential sensitivity to piano instruction with respect to motor, spatial, visual, and sequential memory. Assessments and scans in the control group were similar to those of the training group without receiving any musical training between Tp1 and Tp2.
Figure 1.
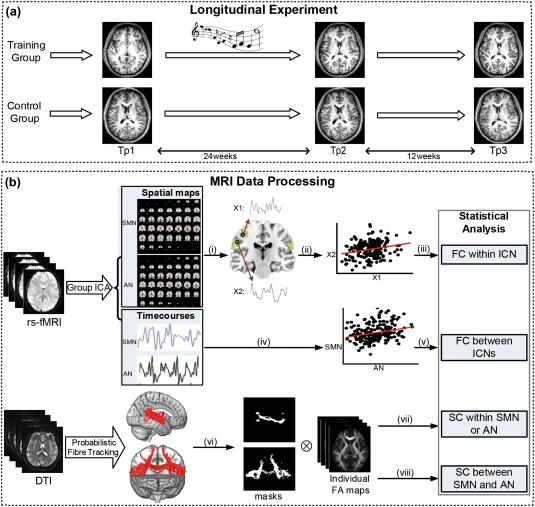
Framework for the investigation. (a) Longitudinal experiment: we used a within‐subject design comprising a training group in which participants received 24‐weeks piano training, and a control group with no intervention. Participants were all tested at 3‐time points: at the beginning (Tp1) and the end (Tp2) of 24 weeks training and at 12 weeks after training (Tp3). At each time point, the participants all received musical assessments, behavioral tests, and scanning sessions. (b) MRI data processing: group ICA was used to acquire the auditory network (AN) and sensorimotor network (SMN) and its corresponding time courses. Probabilistic fiber tracking was conducted to acquire the WM tracts within and between the auditory and sensorimotor cortices: (i) voxel‐wise ANOVA of AN and SMN; (ii) extraction of the time series from the significant clusters; (iii) correlation analysis between the time series of the significant clusters; (iv) extraction of the time courses from group ICA; (v) correlation analysis between the time series of AN and SMN; (vi) thresholded and binarized the WM tracts; (vii) calculation of the mean FA of the pathways within the auditory or sensorimotor regions; (vii) calculation of the mean FA of the pathway between the auditory and sensorimotor regions. Notes: Tp1, time point 1; Tp2, time point 2; Tp3, time point 3; ICA, independent component analysis; AN, auditory network; SMN, sensorimotor network; FC, functional connectivity; SC, structural connectivity; ANOVA, analysis of variance [Color figure can be viewed at http://wileyonlinelibrary.com]
A two‐sample t test implemented in SPSS (SPSS version 22) was used to test the demographic data and musical performance between the two groups at baseline, except for gender (Chi‐squared test). Two‐sample t tests were also used to examine whether there were any differences between the two groups of these cognitive abilities at baseline. A mixed ANOVA with a between‐subject factor group (training group and control group) and within‐subject factor time (Tp1, Tp2, and Tp3) was performed to determine the group effects on the assessments of cognitive and musical abilities, including age, gender, and education as covariates of no interest. Significant interactions were followed by a post hoc pairwise t test between the factor of time to determine which of the time points differ from each other.
2.1.3. Procedures
The musical training program was designed to include professional instruction, practice with the instruction, and a final musical performance. The program required participants to attend a one‐hour music course once a week in the form of one‐to‐two lessons by professional musicians. The professional musicians provided instructions regarding music theory, progressive difficulty in musical performance, and technical motor exercises. The music theory taught in the weekly one‐hour course took about 10 min. The time spent on the music theory learning was nearly the same for each participant and about 4 h for the whole training program. Instructions of music theory and progressive difficulty in musical performance referred to the Bastien Piano for Adults‐Book 1 (Bastien, Bastien, & Bastien, 2000), and technical motor exercises referred to as Hanon Piano Fingering Practice. A typical course began with correcting errors in the weekly music theory assignment and explaining new theoretical concepts for study. From the beginning of the 18th week, in addition to the exercises in Bastien, one Hanon exercise was assigned every week, and these often required one week to complete at a moderate tempo. Specifically, a minimum practice time of five 30‐min sessions (i.e., five days, each day at least 30‐min practice) and a maximum practice time of seven 60‐min sessions (i.e., seven days, each day at most one‐hour practice) per week in the assigned room was also required, and the practice time was logged. Exercises for participants were also presented in the Bastien Piano for Adults‐Book 1 (Bastien et al., 2000) and the Hanon Piano Fingering Practice. Finally, the participants performed selected pieces from Bastien Piano for Adults‐Book 1 and were assessed by professional musicians. In addition, everyone who finished the program could individually and skillfully perform the selected pieces, which was equivalent to being certified by the Central Conservatory of Music piano level 4.
2.2. Image acquisition
MRI scans were collected at each of the 3 measurement time points in the study. All the MRI data were obtained using a SIEMENS Trio Tim 3.0T scanner with a 12‐channel phased array head coil in the Imaging Center for Brain Research, Beijing Normal University. The 3D high‐resolution brain structural images were acquired using T1‐weighted, sagittal 3D magnetization prepared rapid gradient echo (MPRAGE) sequences. The sequence parameters had a repetition time (TR) = 2,530 ms, echo time (TE) = 3.39 ms, inversion time (TI) = 1,100 ms, flip angle = 7°, FOV = 256 mm × 256 mm, in‐plane resolution = 256 × 256, slice thickness = 1.33 mm, and 144 sagittal slices covering the whole brain. The diffusion‐weighted imaging data were acquired using a single‐shot twice‐refocused spin‐echo diffusion echo‐planar imaging (EPI) sequence. The sequence parameters were TR/TE = 8,000 ms/89 ms, 30 nonlinear diffusion directions with b = 1,000 s/mm2, and an additional volume with b = 0 s/mm2, data matrix = 128 × 128, field of view (FOV) = 282 mm × 282 mm, 2.2 mm slice thickness, isotropic voxel size (2.2 mm)3, bandwidth (BW) = 1,562 Hz/pixel, and 62 transverse slices without gaps covering the whole brain and two averages. During the resting‐state session, the participants were instructed to hold still, stay relaxed, and keep their eyes closed but not fall asleep. The functional MRI data were obtained using an echo‐planar imaging (EPI) sequence with the following parameters: 33 axial slices, thickness/gap = 3.5/0.7 mm, in‐plane resolution = 64 × 64, repeat time (TR) = 2,000 ms, echo time (TE) = 30 ms, flip angle = 90°, and a field of view (FOV) = 200 × 200 mm. None of the participants fell asleep according to a simple questionnaire after the scan.
2.3. Functional connectivity analysis
Data processing was conducted using the Data Processing Assistant for the Resting‐State Toolbox (DPARSF, http://rfmri.org/DPARSF; (Yan & Zang, 2010)). Preprocessing included the following steps: (a) slice‐timing correction for interleaved acquisitions; (b) head motion correction where the images are registered to the mean of the images after registering to the first image in the series; (c) T1 structural image coregistration to the functional image; (d) segmentation of the transformed structural image into grey matter, white matter, and cerebrospinal fluid; (e) spatial normalization for motion corrected functional images to the MNI space; and (f) spatial smoothing with a 4‐mm Gaussian Kernel.
The spontaneous brain activity measured by rs‐fMRI is typically organized in a limited number of brain networks, which are often referred to as ICNs (Beckmann, DeLuca, Devlin, & Smith, 2005; Damoiseaux et al., 2006; Shehzad et al., 2009). According to our hypotheses, the two most relevant networks were selected: auditory network (AN) and sensorimotor network (SMN). The group ICA algorithm from the fMRI toolbox (GIFT) software (http://icatb.sourceforge.net/groupica.htm) was used to extract the spatially independent but temporally coherent components (ICs). Data sets were temporally concatenated through subjects for one session and then concatenated through all sessions, and the data dimensions were reduced to the number of ICs using principal component analysis (PCA) (Calhoun, Adali, Pearlson, & Pekar, 2001). The optimal number of ICs in the dataset was 29 as estimated by the minimum length description (MLD) criteria implemented in the GIFT (Li, Adalı, & Calhoun, 2007). Accordingly, 29 ICs were acquired using the Infomax algorithm to decompose the data from all subjects (Bell & Sejnowski, 1995), which generated a spatial map and a time course for each IC. To determine the repeatability of the ICs, 50 ICA iterations were performed using ICASSO, and the best estimate for each IC was utilized (Himberg, Hyvärinen, & Esposito, 2004). Finally, the individual IC maps and time courses were computed by back reconstruction using both aggregate components and the results from the data reduction step (Calhoun et al., 2001; Erhardt et al., 2011). The ICNs were classified by visually examining the spatial pattern (by rejecting the ICs related with physiological artifacts) and the spectral frequency (<0.1 Hz) (Lowe, Mock, & Sorenson, 1998).
A mixed ANOVA (i.e., flexible factorial model in SPM12) with a between‐subject factor group (training group and control group) and a within‐subject factor time (Tp1, Tp2, and Tp3) was performed to determine the group effects on SMN and AN including age, sex, and education as covariates of no interest. Significant interactions were followed by a post hoc pairwise t test between the factors of time. In the case of a significant test, we applied the family‐wise error (FWE, p < .05) correction to the p values of the comparison of interest. Then, average time series were extracted from spherical ROIs centering on the local maxima peak of significant clusters with a radius of 8 mm. Functional connectivity within each ICN was acquired by calculating the correlation between any two of the average time series. In addition, the FC between SMN and AN was also estimated by calculating the correlation of their corresponding time courses. Statistical analyses of FC within and between SMN and AN were performed using a mixed ANOVA with post hoc tests implemented in SPSS. Finally, a correlation analysis was performed using linear regression between the changes in FC (only for those in which the post hoc pairwise t test was significant) with the practice time in the training group.
2.4. Structural connectivity analysis
All tensor calculations and probabilistic fiber tracking were conducted using FSL (https://fsl.fmrib.ox.ac.uk/fsl/fslwiki/FSL) (Smith et al., 2004). First, the raw 4D data were corrected for distortions due to eddy currents and the head motion between volumes by using an affine registration to the first b = 0 volume by means of FLIRT (Jenkinson & Smith, 2001). In addition, a brain extraction tool (BET) (Smith, 2002) was used to extract the brain and exclude dura, skull, scalp, and other nonbrain tissue. Second, the diffusion tensor model was built to obtain the FA, eigenvector, and eigenvalue maps for each subject. Then, the linear affine and nonlinear transform registrations were used to register individual FA map to an FMRIB FA template in the MNI space. The resulting warping transformations were then applied to resample the images of FA into the MNI space with a 2 × 2 × 2 mm spatial resolution. The normalized images were then smoothed with a Gaussian kernel of 6 mm to reduce image noise and misalignment between the subjects.
Probabilistic fiber tracking was conducted between 2 ROIs: sensorimotor and auditory cortices created in the AAL template, which involved the bilateral precentral/postcentral gyrus, supplementary motor area (SMA), superior temporal gyrus, and Heschl's gyrus. The fiber tracking algorithm was performed from all voxels within each seed mask and generated 5,000 streamline samples per seed voxel with a curvature threshold of 0.2, a step length of 0.5 mm, and a maximum number of 2,000 steps. One ROI was used as the seed mask and a connection distribution was calculated between the pair of masks with another ROI as the target mask, and this process was repeatedly computed with another ROI as the seed mask. Finally, the probability of a given voxel on the pathway was represented by the sum of these samples that reached a target voxel from a given seed voxel. The results of the probabilistic tractography for each subject were thresholded and binarized to create a probabilistic fiber mask within which the mean FA for each subject was computed. The threshold was the sum of the samples sent out from the 2 ROIs and multiplied by the same percentage of 0.2%. The SC between the sensorimotor and auditory cortices was estimated by the mean FA of the tracts between the two cortices. The WM tracts within the auditory or sensorimotor cortex were reconstructed by performing probabilistic fiber tracking in which the seed mask and target mask were both the auditory or sensorimotor regions in the AAL template. SC within the sensorimotor or auditory cortex was respectively calculated by the mean FA of the tracts within each of the cortex.
Statistical analyses of SCs within and between the sensorimotor and auditory networks were performed using mixed ANOVA with post hoc tests implemented in SPSS. In addition, a correlation analysis was performed using linear regression between the changes in SC (only those for which the post hoc pairwise t test was significant) with practice time in the training group.
2.5. Relationship between FC and SC
FC is intrinsically dependent on SC for fast and efficient transfer of information, but it is unknown what degree FC is constrained by or related to characteristics of SC (Fjell et al., 2017). Due to the complex relationship between SC and FC, we explored the relationship between FC change and SC change (Tp2–Tp1) induced by musical training in the training group, which was tested by regression analysis with SC change as the independent variable and FC change as the dependent variable.
3. RESULTS
3.1. Participants and demographics
Twenty‐nine participants in the training group (13 males, age 23.10 1.37) and 27 participants in the control group (13 males, age 23.33 1.39) completed the study. Moreover, the groups did not differ in terms of gender, age, education, BDI, IQ, and AMMA scores (p > .05) at baseline as shown in Table 1.
Table 1.
The participant characteristics and demographics
| Control group (n = 27) | Training group (n = 29) | p value | |
|---|---|---|---|
| Gender (M/F) | 13/14 | 13/16 | .803 |
| Age (years) | 23.33 (1.39) | 23.10 (1.37) | .536 |
| Education | 16.70 (1.26) | 16.59 (1.09) | .709 |
| BDI | 5.15 (3.87) | 4.71 (3.62) | .646 |
| IQ | 128.19 (7.33) | 129.11 (5.65) | .598 |
| AMMA tonal percentile rank | 54.26 (14.78) | 59.34 (10.78) | .145 |
| AMMA rhythm percentile rank | 46.90 (14.54) | 53.83 (11.61) | .116 |
| AMMA composite percentile rank | 51.93 (15.31) | 57.28 (11.08) | .351 |
Note. Abbreviations: AMMA = Advanced Measures of Music Audiation; BDI = Beck Depression Inventory; M/F, male/female.
Age, education, BDI, IQ, and AMMA scores of participants in both groups at baseline are expressed as the mean (SD), and p values for demographics were shown in the right column.
The mean scores and standard variances of the repeated cognitive ability assessments were shown in Table 2. No significant differences were found in any of these cognitive abilities between the two groups at baseline. A mixed ANOVA suggested that no significant interactions of the group over time were found in trail making test part A (p = .914) and part B (p = .424). In addition, no significant interactions of the group over time were found in any of the repeated WAIS‐RC subtests: digit span (p = .995), digit symbol (p = .757), and block design (p = .440). However, mixed ANOVA showed a significant main effect for time on all these cognitive tests: digit span (F = 6.695, p = .002), digit symbol (F = 7.97, p = .001), block design (F = 6.568, p = .002), trail making test part A (F = 12.19, p < .001), and part B (F = 7.807, p = .01).
Table 2.
Cognitive assessment data for training and control participants
| Control group (n = 27) | Training group (n = 29) | ||||||
|---|---|---|---|---|---|---|---|
| Tp1 | Tp2 | Tp3 | Tp1 | Tp2 | Tp3 | *p value | |
| Trail making tests | |||||||
| Part A | 23.37 (5.89) | 19.94 (4.39) | 17.95 (3.14) | 27.76 (10.27) | 24.10 (8.95) | 21.32 (8.15) | 0.057 |
| Part B | 54.75 (16.68) | 43.43 (9.25) | 47.45 (22.92) | 60.11 (35.04) | 45.18 (12.55) | 41.94 (13.72) | 0.474 |
| WAIS‐RC subtests | |||||||
| Digit span | 15.1 (2.50) | 15.7 (2.27) | 16.1 (2.30) | 14.5 (2.52) | 15.6 (2.48) | 16.3 (2.27) | 0.299 |
| Digit symbol | 17.1 (1.59) | 17.4 (1.40) | 17.6 (1.25) | 17.5 (1.57) | 18.1 (1.10) | 18.2 (1.05) | 0.338 |
| Block design | 14.1 (1.23) | 14.6 (0.97) | 14.5 (0.98) | 14.1 (1.22) | 14.5 (0.95) | 14.7 (0.75) | 0.975 |
Note. Abbreviations: Tp1 = time point 1; Tp2 = time point 2; Tp3 = time point 3; WAIS‐RC = Wechsler Adult Intelligence Scale‐Revised Chinese revised version.
Cognitive assessment data for training and control participants are expressed as mean (SD) for all the three time points and p values for these cognitive assessments at the baseline were shown in the right column (*p value).
3.2. Functional connectivity
The auditory network was formed by the bilateral middle and superior temporal gyrus and Heschl's gyrus, whereas the SMN was formed by the bilateral precentral/postcentral gyrus and the bilateral SMA, as shown in Figure 2. The results showed no significant interaction of the group over time in the auditory network. However, for SMN, a significant interaction of the group over time has been found in areas of the bilateral postcentral, left superior parietal gyrus, right inferior parietal gyrus, right precentral gyrus, and right superior frontal gyrus. The local maxima peak coordinates in the MNI space and cluster size are shown in Table 3. No significant interaction of the group over time has been found except for the FC between the right postcentral and right precentral (F = 5.410, p = .006). In addition, post hoc pairwise comparisons showed increased FC between the right postcentral and right precentral gyri when compared after (Tp2) with before musical training (Tp1) (**p < .001) and decreased FC when comparing Tp3 with Tp2 (*p = .001) in the training group, whereas there was no significant change in the control group as shown in Figure 3a.
Figure 2.
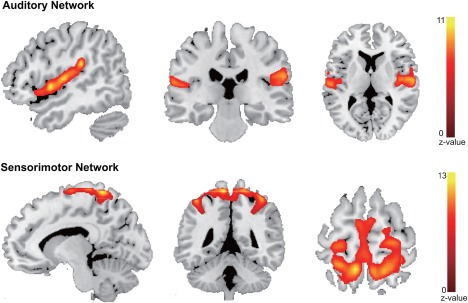
The functional auditory network and sensorimotor network. The auditory network and sensorimotor network were identified by group ICA. The AN was formed by the bilateral middle and superior temporal gyrus, and Heschl's gyrus; the SMN was formed by the bilateral precentral/postcentral gyrus and bilateral SMA. Note: AN, auditory network; SMN, sensorimotor network; SMA, supplementary motor area [Color figure can be viewed at http://wileyonlinelibrary.com]
Table 3.
Clusters with a significant interaction of group over time in sensorimotor network
| Index | Number of voxels | Peak MNI coordinate | Peak MNI coordinate region (AAL) |
|---|---|---|---|
| 1 | 73 | −63 −21 24 | Postcentral_L |
| 2 | 93 | 60 −24 27 | Postcentral_R |
| 3 | 101 | −18 −60 60 | Parietal_Sup_L |
| 4 | 52 | 36 −42 39 | Parietal_Inf_R |
| 5 | 50 | 42 −21 51 | Precentral_R |
| 6 | 24 | 21 3 54 | Frontal_Sup_R |
Note. Abbreviations: Postcentral_L = left postcentral gyrus; Postcentral_R = right postcentral gyrus; Parietal_Sup_L = left superior parietal gyrus; Parietal_Inf_R = right inferior parietal gyrus; Precentral_R = right precentral gyrus; Frontal_Sup_R = right superior frontal gyrus.
Figure 3.
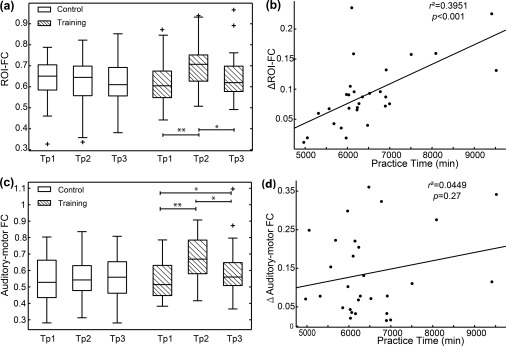
Functional connectivity comparisons and correlation analyses. (a) Comparisons showed increased functional connectivity between the right postcentral and right precentral gyri (regions within SMN) when Tp2 (at the end of training) was compared with Tp1 (at the beginning of training) (**p < .001) and decreased functional connectivity when Tp3 (at 12 weeks after training) was compared with Tp2 (*p = .001) in the training group, whereas there was no significant change in the control group. (b) The scatter plot shows that participants in the training group who practiced for longer time showed greater increased functional connectivity (Tp2–Tp1) between right postcentral and precentral gyri ( ). (c) Comparisons showed increased functional connectivity between SMN and AN when Tp2 (at the end of training) was compared with Tp1 (at the beginning of training) (**p < .001), decreased functional connectivity when Tp3 (at 12 weeks after training) was compared with Tp2 (*p = .003), and increased functional connectivity when Tp3 was compared with Tp1 (*p = .02) in the training group, whereas there was no significant change in the control group. (d) No significant correlation was found between the changes of functional connectivity (Tp2–Tp1) between the auditory and sensorimotor cortices and the practice time in the training group ( ). Note: Tp1, time point 1; Tp2, time point 2; Tp3, time point 3; FC, functional connectivity; SMN, sensorimotor network; AN, auditory network
In addition to FC within ICN, significant interaction of the group over time has been found (F = 5.588, p = .005) in FC of auditory‐motor network and post hoc pairwise comparisons showed increased FC of the auditory‐motor network when Tp2 was compared with Tp1 (**p < .001), decreased FC when Tp3 was compared with Tp2 (*p = .003) and increased FC when Tp3 was compared with Tp1 (*p = .02) in the training group, whereas there was no significant change in the control group as shown in Figure 3c.
3.3. Structural connectivity
The WM tracts within sensorimotor and auditory cortices and between the sensorimotor and auditory cortices are displayed in Figure 4a and 4b, and the two areas are mainly connected by the corticospinal tract (CST), the superior longitudinal fasciculus (SLF), and the corpus callosum (CC), of which the mean FA was calculated. A significant interaction of the group over time in the WM tracts between these two areas has been found (F = 5.643, p = .005) and post hoc pairwise comparisons showed increased mean FA of the WM tracts when Tp2 was compared with Tp1 (**p < .001) and decreased mean FA when Tp3 was compared with Tp2 (**p < .001) in the training group, whereas there was no significant change in the control group as shown in Figure 5a. However, no significant interactions of the group over time have been found in any of the four structural networks within the auditory and sensorimotor areas.
Figure 4.
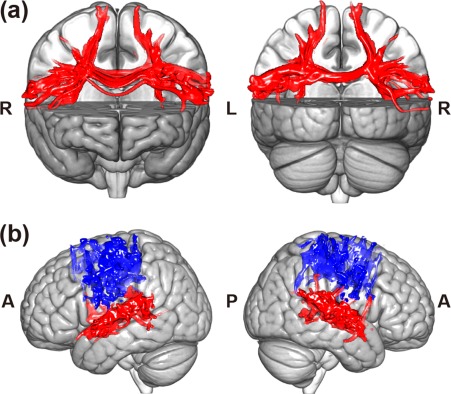
White matter fiber pathway within and between auditory and sensorimotor regions. (a) The WM tracts between auditory and sensorimotor regions were reconstructed by performing probabilistic fiber tracking between two ROI masks (auditory and sensorimotor regions). The two ROIs were connected by the corticospinal tract, superior longitudinal fasciculus, and corpus callosum. (b) The WM tracts within the auditory or sensorimotor regions were reconstructed by performing a probabilistic fiber tracking in which the seed mask and target mask were both the auditory and sensorimotor regions in the AAL template. Note: L, left side of the brain; R, right side of the brain; A, anterior side of the brain; P, posterior side of the brain [Color figure can be viewed at http://wileyonlinelibrary.com]
Figure 5.
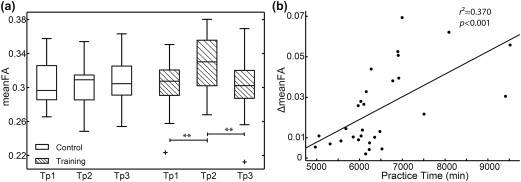
Structural connectivity comparisons and correlation analysis. (a) Structural connectivity between auditory and sensorimotor regions was evaluated by the mean FA of the WM tracts between the two regions in which probabilistic tracking was obtained. Comparisons showed increased mean FA of the WM tracts between sensorimotor and auditory cortices when Tp2 (at the end of training) was compared with Tp1 (at the beginning of training) (**p < .001) and decreased mean FA when Tp3 (at 12 weeks after training) was compared with Tp2 (**p < .001) in the training group, whereas there was no significant change in the control group. (b) Correlation analysis showed that increased mean FA of the WM tracts (Tp2–Tp1) between sensorimotor and auditory cortices was positively correlated with practice time in the training group ( ). Note: Tp1, time point 1; Tp2, time point 2; Tp3, time point 3; FA, fractional anisotropy; WM, white matter
3.4. Correlation analysis
In Figure 3b, the correlation analysis revealed that the increased FC within SMN (between right postcentral and right precentral gyri) when comparing after with before training, was positively correlated with practice time ( ) such that participants who practiced for longer time showed greater increased FC. In addition, the mean FA of the WM tracts between auditory and sensorimotor cortices correlated positively with practice time in the training group ( ) as shown in Figure 5b. That is, participants who practiced longer showed greater enhanced SC of the auditory‐motor network. However, as seen in Figure 3d, there was no significant relationship between practice time and the changes in FC between the auditory and sensorimotor cortices in the training group ( ). Moreover, we have also analyzed the relationship between the decrease in Tp3 of structural and functional connectivity changes and the training hours in the training group. The results showed that the decreased functional connectivity within the sensorimotor network (Tp2–Tp3) was positively correlated with the practice time ( ). However, there were no significant correlations between the practice time and the decreased functional or structural connectivity of the auditory‐motor network (p > .05).
3.5. Relationship between functional and structural connectivity
It can be seen from Figures 3c and 5a that both FC and SC of the auditory‐motor network were increased in the training group when Tp2 was compared with Tp1, showing good correspondence between FC and SC. For connectivity within the two regions, only increased FC within the sensorimotor area (between right postcentral and right precentral gyri) was found in the training group as shown in Figure 3a but with no significant changes of SC. In addition, the relationship between the significant changes of FC and SC of the auditory‐motor network was explored by performing regression analysis in the training group. No significant correlation between changes of FC and SC of the auditory‐motor network was found in the training group (p = .933).
4. DISCUSSION
In this study, we investigated the impact of musical training on the structural and functional connectivity of the auditory and sensorimotor regions. Besides, we also analyzed the relationship between SC and FC of the two regions. Notably, we targeted at the auditory and sensorimotor regions, the most related regions during the musical performance, and demonstrated that musical training affects FC within the sensorimotor regions, whereas no effects were found within the auditory regions. In addition, we also found that musical training was associated with increased FC of the auditory‐motor network and increased SC between the two regions. Moreover, the effects on FC within the sensorimotor regions and SC between the auditory and sensorimotor regions were stronger in participants with longer training time.
4.1. Functional connectivity within and between the auditory and sensorimotor networks
The obtained ICNs in our resting‐state fMRI analysis were consistent with the main networks found in previous studies (Allen et al., 2014). In this study, the ICNs showed significant training‐related changes in the SMN but not the AN. Previous studies used magnetoencephalographic (MEG) measurements of the mismatch negativity (MMNm) with brain sources within the auditory cortex to evaluate the training‐induced cortical response changes not the functional connectivity within the auditory cortex (Lappe, Herholz, Trainor, & Pantev, 2008; Lappe, Trainor, Herholz, & Pantev, 2011). They found differential training effects between mere auditory musical training and sensorimotor‐auditory training. While there was a significant increase in the mismatch negativity after sensorimotor piano training, there was no functional increase in the mismatch negativity after mere auditory training. The SMN, which showed the significant interaction of the group over time included regions of bilateral postcentral gyrus, left superior parietal gyrus, right inferior parietal gyrus, right precentral gyrus, and right superior frontal gyrus. In line with previous studies (Palomar‐García, Zatorre, Ventura‐Campos, Bueichekú, & Ávila, 2017), we also found enhanced FC within sensorimotor areas. In contrast to increased activities in motor areas (Herholz, Coffey, Pantev, & Zatorre, 2016), enhanced FC between subareas in sensorimotor cortex (right precentral and postcentral gyri), that is, FC within the sensorimotor network, was found in the present study. Previous fMRI studies have suggested that the activity of the subareas of the primary motor cortex, which was mentioned above, was related to voluntary finger movements (Indovina & Sanes, 2001). In addition to the motor areas, increases in the magnitude of the task‐evoked BOLD response in the primary somatosensory cortex have also proven to be associated with long‐term motor skill learning (Floyer‐Lea & Matthews, 2005). It has been suggested that somatosensory feedback is also important in motor task learning (Asanuma & Pavlides, 1997; Kaelin‐Lang et al., 2002; Pavlides, Miyashita, & Asanuma, 1993), which is a major source of afferents to the primary motor cortex (Asanuma, Stoney, & Abzug, 1968). Activation of both the somatosensory and motor cortices in hand movements (Kleinschmidt, Nitschke, & Frahm, 1997) suggests the importance of afferent feedback in full movement. The results of this study are compatible with this concept of afferent feedback because we found higher functional connectivity between primary motor and somatosensory cortices after musical training. Thus, we can infer that the information interaction of the local somatosensory and motor areas can be modulated by long‐term musical training in young adults.
In addition to increased FC within the sensorimotor network, our results also showed increased rs‐FC of the auditory‐motor network after long‐term musical training. Feedback interactions are particularly relevant in playing an instrument, where performers must listen to each note they produce and perform appropriate action adjustments in due course. It has been proven that musicians can still perform prerehearsed pieces when auditory feedback is blocked, but expressive aspects of performance are affected (Repp, 1999). More importantly, when auditory feedback is experimentally manipulated by the introduction of delays or distortions, the motor performance is significantly altered (Pfordresher & Palmer, 2006). Thus, information integration between auditory and sensorimotor cortices is of particular importance in musical performance, which indicates that the FC of the auditory‐motor network increased after long‐term musical training.
Perfect musical performance requires the interaction of local information within the auditory and sensorimotor cortices and global integration between the two areas. The results of this study showed enhanced local interaction within the sensorimotor cortex and global integration between the auditory and sensorimotor cortices after long‐term musical training. Interestingly, in this study, participants in the training group with more hours of practice showed a greater increase in FC within the sensorimotor network. This finding indicates the possibility of brain plasticity in local interaction within the sensorimotor cortex. Our findings provide new evidence for revealing the mechanism of brain functional organization modulated by musical training.
4.2. Structural connectivity within and between auditory and sensorimotor networks
In contrast to focusing on white matter architectures, we used probabilistic fiber tracking to construct the structural connectivity within and between auditory and sensorimotor areas. Consistent with the increased FA reported in previous studies (Halwani, Loui, Rueber, & Schlaug, 2011; Rüber, Lindenberg, & Schlaug, 2015; Steele, Bailey, Zatorre, & Penhune, 2013), we also found increased mean FA of WM tracts between the sensorimotor and auditory cortices after long‐term musical training and receded when exercise stopped, whereas no significant changes in mean FA were found within the auditory or sensorimotor cortex in this study. Auditory and sensorimotor cortices are mainly connected by the corticospinal tract (CST), superior longitudinal fasciculus (SLF), and corpus callosum (CC). Both CST and SLF are part of the sensorimotor system. The fiber of the CST plays a key role in the control of voluntary movement which projects from the sensorimotor and premotor cortices to the motor‐neurons in the spinal cord. The SLF links posterior sensory to the frontal regions, which involves the integration of sensory and motor information for action (Hecht et al., 2013; Rodriguez‐Herreros et al., 2015). The body of CC connects premotor and sensorimotor regions, whereas the splenium connects the visual, parietal, and auditory regions (Hofer & Frahm, 2006; Knyazeva, 2013). The lateral portions of the CC are crossed by other fiber tracts, including the SLF and the CST. The FA changes of these pathways have been shown to be related to musical performance (Giacosa, Karpati, Foster, Penhune, & Hyde, 2016; Steele et al., 2013). Children with 15 months musical training showed larger deformation changes of CC compared with the controls which supported the findings in this study (Hyde et al., 2009). Increases in FA are thought to be associated with changes in axon diameter, the fanning of primary fibers or the density and coherence of secondary fibers in crossing regions (Douaud et al., 2009, 2011; Zatorre, Fields, & Johansen‐Berg, 2012). Playing the piano requires the coordinated action of two hands, auditory feedback and interhemispheric interactions, and may place greater demands on interactions between auditory and sensorimotor regions (Zatorre, Chen, & Penhune, 2007), thus promoting the enhanced connections that are indexed by increased FA. In addition, the increased FA of fibers between auditory and sensorimotor cortices was correlated with the practice time in the training group. That is, participants who practiced for longer time showed greater enhanced structural connectivity between the musical performance related regions. Thus, it can be suggested that musical training could induce modulation of long‐range brain structural connectivity, which mediates submodules of the brain.
4.3. Relationship between functional and structural connectivity
In this study, we found increased FC of the auditory‐motor network and increased SC between the two regions in the training group after a long‐term musical training, showing good correspondence between FC and SC. However, the relationship between change in FC and change in SC of auditory‐motor network was not significant in the training group, showing different modulation of FC and SC induced by musical training. Besides increased FC and SC of auditory‐motor network, enhanced FC within the sensorimotor area but no significant changes in SC within sensorimotor or auditory were found.
The human brain is organized by global integration of local interaction in which global integration via long‐range weak connections facilitate diverse cognitive function mediated by short‐range dense connectivity (Park & Friston, 2013). The long‐range weak connections are relatively flexible and facilitate diverse integration for various functional demands (Ekman, Derrfuss, Tittgemeyer, & Fiebach, 2012; Hermundstad et al., 2013). Furthermore, the coupling between different local interactions may be more dynamic and task‐related, which is plausibly mediated by long‐range structural connections, such as commissural fibers for bilateral submodules and longitudinal fibers within a hemisphere (Allen et al., 2014; Park et al., 2012), than the strong coupling within local interactions. Thus, it can be interpreted that both the relatively static SC and the dynamic FC between training related regions could be induced changes after long‐term intensive musical training but changes in FC and SC are not necessarily strongly correlated.
In this study, the FC within the sensorimotor network and SC between auditory and sensorimotor cortices changes degraded nearly to baseline without training over 12 weeks. However, increased FC of the auditory‐motor network lasted for 12 weeks without further training (even though lower than Tp2). The lasting increased long‐range functional connectivity between auditory and sensorimotor cortices may underlie a brain optimization strategy that may reduce the need for the equivalent dedicated structural networks and avoid the incremental metabolic costs in terms of modifying physical connections (Sami & Miall, 2013). Functional connectivity within sensorimotor network was significantly increased after the musical training but decreased to the baseline when training ended. Interestingly, participants in the training group who practiced for a longer time showed greater increased functional connectivity within the sensorimotor network during the training period and also greater decrease after the training period. The transient changes of the functional connectivity within the sensorimotor network could be explained by the perspective that the local connectivity was more task‐related and may only characterize patterns of activity during training (Park & Friston, 2013). However, there were no significant correlations between the practice time and the decrease of the functional and structural connectivity between sensorimotor and auditory cortices. Therefore, in future, the longitudinal study in which imaging data are acquired at multiple time points could help for revealing the different dynamic properties of training‐related plastic changes in structural connectivity and functional connectivity.
4.4. Limitations and future directions
This study still has some limitations. First, the relationship between FC and SC is complex and the alignment of FC and SC seems restricted to specific regions (Fjell et al., 2017), thus an appropriate approach which can qualitatively and quantitatively characterize the SC–FC coupling is needed to examine the effects of musical training on SC–FC relationships of auditory and sensorimotor cortices. Second, we explored the relationship between practice time and changes of connectivity. Even though longer practice time may be linked with an increase in proficiency (Sloboda, Davidson, Howe, & Moore, 1996), in future, the measures of the piano efficiency deserve to be recorded to investigate the relationship between training and changes of connectivity. Third, SC was estimated by tractography and based on diffusion imaging treating the bilateral auditory or sensorimotor as a whole seed. Musical training has been associated with increased hemispheric asymmetries (Boemio, Fromm, Braun, & Poeppel, 2005; Zatorre, Belin, & Penhune, 2002), and investigating the interhemispheric and intrahemispheric SC between auditory and sensorimotor areas is of great importance. Fourth, participants in the training group received instructions in music theory while the controls did not get any cognitive instructions at all, which may be confounding in the analysis of training‐induced auditory and sensorimotor changes. Future studies are needed to shed more light on these issues.
CONFLICT OF INTERESTS
The authors declare that there are no conflicts of interest regarding the publication of this article.
ACKNOWLEDGMENTS
This work was supported by the National Natural Science Foundation of China (Grant No. 81171403, 81471731), National Natural Science Foundation of China Excellent Youth Fund (Grant No. 81622025).
Li Q, Wang X, Wang S, et al. Musical training induces functional and structural auditory‐motor network plasticity in young adults. Hum Brain Mapp. 2018;39:2098–2110. 10.1002/hbm.23989
Funding information National Natural Science Foundation of China, Grant/Award Numbers: 81171403, 81471731; National Natural Science Foundation of China Excellent Youth Fund, Grant/Award Number: 81622025
REFERENCES
- Allen, E. A. , Damaraju, E. , Plis, S. M. , Erhardt, E. B. , Eichele, T. , & Calhoun, V. D. (2014). Tracking whole‐brain connectivity dynamics in the resting state. Cerebral Cortex, 24, 663–676. [DOI] [PMC free article] [PubMed] [Google Scholar]
- Asanuma, H. , & Pavlides, C. (1997). Neurobiological basis of motor learning in mammals. Neuroreport: An International. Journal for the Rapid Communication of Research in Neuroscience, 8, i–vi. [PubMed] [Google Scholar]
- Asanuma, H. , Stoney, S. , & Abzug, C. (1968). Relationship between afferent input and motor outflow in cat motorsensory cortex. Journal of Neurophysiology, 31, 670–681. [DOI] [PubMed] [Google Scholar]
- Basser, P. J. , Mattiello, J. , & LeBihan, D. (1994). MR diffusion tensor spectroscopy and imaging. Biophysical Journal, 66, 259–267. [DOI] [PMC free article] [PubMed] [Google Scholar]
- Bastien, J. S. , Bastien, L. , & Bastien, L. (2000). Piano for adults. Kjos Music Press. [Google Scholar]
- Beck, A. , & Steer, R. (1987). Beck depression inventory manual. New York: The Psychological Corporation Harcourt Brace Jovanovich Inc. [Google Scholar]
- Beckmann, C. F. , DeLuca, M. , Devlin, J. T. , & Smith, S. M. (2005). Investigations into resting‐state connectivity using independent component analysis. Philosophical Transactions of the Royal Society of London B: Biological Sciences, 360, 1001–1013. [DOI] [PMC free article] [PubMed] [Google Scholar]
- Bell, A. J. , & Sejnowski, T. J. (1995). An information‐maximization approach to blind separation and blind deconvolution. Neural Computation, 7, 1129–1159. [DOI] [PubMed] [Google Scholar]
- Bermudez, P. , Lerch, J. P. , Evans, A. C. , & Zatorre, R. J. (2009). Neuroanatomical correlates of musicianship as revealed by cortical thickness and voxel‐based morphometry. Cerebral Cortex, 19, 1583–1596. [DOI] [PubMed] [Google Scholar]
- Boemio, A. , Fromm, S. , Braun, A. , & Poeppel, D. (2005). Hierarchical and asymmetric temporal sensitivity in human auditory cortices. Nature Neuroscience, 8, 389–395. [DOI] [PubMed] [Google Scholar]
- Boyke, J. , Driemeyer, J. , Gaser, C. , Büchel, C. , & May, A. (2008). Training‐induced brain structure changes in the elderly. Journal of Neuroscience, 28, 7031–7035. [DOI] [PMC free article] [PubMed] [Google Scholar]
- Calhoun, V. , Adali, T. , Pearlson, G. , & Pekar, J. (2001). A method for making group inferences from functional MRI data using independent component analysis. Human Brain Mapping, 14, 140–151. [DOI] [PMC free article] [PubMed] [Google Scholar]
- Damoiseaux, J. , Rombouts, S. , Barkhof, F. , Scheltens, P. , Stam, C. , Smith, S. M. , & Beckmann, C. (2006). Consistent resting‐state networks across healthy subjects. Proceedings of the National Academy of Sciences, 103, 13848–13853. [DOI] [PMC free article] [PubMed] [Google Scholar]
- Douaud, G. , Behrens, T. E. , Poupon, C. , Cointepas, Y. , Jbabdi, S. , Gaura, V. , … Damier, P. (2009). In vivo evidence for the selective subcortical degeneration in Huntington's disease. NeuroImage, 46, 958–966. [DOI] [PubMed] [Google Scholar]
- Douaud, G. , Jbabdi, S. , Behrens, T. E. , Menke, R. A. , Gass, A. , Monsch, A. U. , … Matthews, P. M. (2011). DTI measures in crossing‐fibre areas: Increased diffusion anisotropy reveals early white matter alteration in MCI and mild Alzheimer's disease. NeuroImage, 55, 880–890. [DOI] [PMC free article] [PubMed] [Google Scholar]
- Ekman, M. , Derrfuss, J. , Tittgemeyer, M. , & Fiebach, C. J. (2012). Predicting errors from reconfiguration patterns in human brain networks. Proceedings of the National Academy of Sciences, 109, 16714–16719. [DOI] [PMC free article] [PubMed] [Google Scholar]
- Elmer, S. , Hänggi, J. , Meyer, M. , & Jäncke, L. (2013). Increased cortical surface area of the left planum temporale in musicians facilitates the categorization of phonetic and temporal speech sounds. Cortex, 49, 2812–2821. [DOI] [PubMed] [Google Scholar]
- Erhardt, E. B. , Rachakonda, S. , Bedrick, E. J. , Allen, E. A. , Adali, T. , & Calhoun, V. D. (2011). Comparison of multi‐subject ICA methods for analysis of fMRI data. Human Brain Mapping, 32, 2075–2095. [DOI] [PMC free article] [PubMed] [Google Scholar]
- Fjell, A. M. , Sneve, M. H. , Grydeland, H. , Storsve, A. B. , Amlien, I. K. , Yendiki, A. , & Walhovd, K. B. (2017). Relationship between structural and functional connectivity change across the adult lifespan: A longitudinal investigation. Human Brain Mapping, 38, 561–573. [DOI] [PMC free article] [PubMed] [Google Scholar]
- Floyer‐Lea, A. , & Matthews, P. M. (2005). Distinguishable brain activation networks for short‐ and long‐term motor skill learning. Journal of Neurophysiology, 94, 512–518. [DOI] [PubMed] [Google Scholar]
- Gaser, C. , & Schlaug, G. (2003). Brain structures differ between musicians and non‐musicians. Journal of Neuroscience, 23, 9240–9245. [DOI] [PMC free article] [PubMed] [Google Scholar]
- Giacosa, C. , Karpati, F. J. , Foster, N. E. , Penhune, V. B. , & Hyde, K. L. (2016). Dance and music training have different effects on white matter diffusivity in sensorimotor pathways. NeuroImage, 135, 273–286. [DOI] [PubMed] [Google Scholar]
- Gong, Y. (1992). Wechsler Adult Intelligence Scale‐revised (Chinese revised version). Hunan Medical Institute. [Google Scholar]
- Guerra‐Carrillo, B. , Mackey, A. P. , & Bunge, S. A. (2014). Resting‐state fMRI A window into human brain plasticity. Neuroscientist, 20, 522–533. [DOI] [PubMed] [Google Scholar]
- Hagmann, P. , Kurant, M. , Gigandet, X. , Thiran, P. , Wedeen, V. J. , Meuli, R. , & Thiran, J.‐P. (2007). Mapping human whole‐brain structural networks with diffusion MRI. PLoS One, 2, e597. [DOI] [PMC free article] [PubMed] [Google Scholar]
- Halwani, G. , Loui, P. , Rueber, T. , & Schlaug, G. (2011). Effects of practice and experience on the arcuate fasciculus: Comparing singers, instrumentalists, and non‐musicians. Frontiers in Psychology, 2, [DOI] [PMC free article] [PubMed] [Google Scholar]
- Harmelech, T. , & Malach, R. (2013). Neurocognitive biases and the patterns of spontaneous correlations in the human cortex. Trends in Cognitive Sciences, 17, 606–615. [DOI] [PubMed] [Google Scholar]
- Hecht, E. E. , Gutman, D. A. , Preuss, T. M. , Sanchez, M. M. , Parr, L. A. , & Rilling, J. K. (2013). Process versus product in social learning: Comparative diffusion tensor imaging of neural ystems for action execution–Observation matching in macaques, chimpanzees, and humans. Cerebral Cortex, 23, 1014–1024. [DOI] [PMC free article] [PubMed] [Google Scholar]
- Herdener, M. , Esposito, F. , di Salle, F. , Boller, C. , Hilti, C. C. , Habermeyer, B. , … Cattapan‐Ludewig, K. (2010). Musical training induces functional plasticity in human hippocampus. Journal of Neuroscience, 30, 1377–1384. [DOI] [PMC free article] [PubMed] [Google Scholar]
- Herholz, S. C. , Coffey, E. B. J. , Pantev, C. , & Zatorre, R. J. (2016). Dissociation of neural networks for predisposition and for training‐related plasticity in auditory‐motor learning. Cerebral Cortex, 26, 3125–3134. [DOI] [PMC free article] [PubMed] [Google Scholar]
- Hermundstad, A. M. , Bassett, D. S. , Brown, K. S. , Aminoff, E. M. , Clewett, D. , Freeman, S. , … Miller, M. B. (2013). Structural foundations of resting‐state and task‐based functional connectivity in the human brain. Proceedings of the National Academy of Sciences, 110, 6169–6174. [DOI] [PMC free article] [PubMed] [Google Scholar]
- Himberg, J. , Hyvärinen, A. , & Esposito, F. (2004). Validating the independent components of neuroimaging time series via clustering and visualization. NeuroImage, 22, 1214–1222. [DOI] [PubMed] [Google Scholar]
- Hofer, S. , & Frahm, J. (2006). Topography of the human corpus callosum revisited—comprehensive fiber tractography using diffusion tensor magnetic resonance imaging. NeuroImage, 32, 989–994. [DOI] [PubMed] [Google Scholar]
- Hyde, K. L. , Lerch, J. , Norton, A. , Forgeard, M. , Winner, E. , Evans, A. C. , & Schlaug, G. (2009). Musical training shapes structural brain development. Journal of Neuroscience, 29, 3019–3025. [DOI] [PMC free article] [PubMed] [Google Scholar]
- Indovina, I. , & Sanes, J. N. (2001). On somatotopic representation centers for finger movements in human primary motor cortex and supplementary motor area. NeuroImage, 13, 1027–1034. [DOI] [PubMed] [Google Scholar]
- Jenkinson, M. , & Smith, S. (2001). A global optimisation method for robust affine registration of brain images. Medical Image Analysis, 5, 143–156. [DOI] [PubMed] [Google Scholar]
- Kaelin‐Lang, A. , Luft, A. R. , Sawaki, L. , Burstein, A. H. , Sohn, Y. H. , & Cohen, L. G. (2002). Modulation of human corticomotor excitability by somatosensory input. Journal of Physiology, 540, 623–633. [DOI] [PMC free article] [PubMed] [Google Scholar]
- Klein, C. , Liem, F. , Hänggi, J. , Elmer, S. , & Jäncke, L. (2016). The “silent” imprint of musical training. Human Brain Mapping, 37, 536–546. [DOI] [PMC free article] [PubMed] [Google Scholar]
- Kleinschmidt, A. , Nitschke, M. F. , & Frahm, J. (1997). Somatotopy in the human motor cortex hand area. A high‐resolution functional MRI study. European Journal of Neuroscience, 9, 2178–2186. [DOI] [PubMed] [Google Scholar]
- Knyazeva, M. G. (2013). Splenium of corpus callosum: Patterns of interhemispheric interaction in children and adults. Neural Plasticity, 2013, [DOI] [PMC free article] [PubMed] [Google Scholar]
- Laird, A. R. , Eickhoff, S. B. , Rottschy, C. , Bzdok, D. , Ray, K. L. , & Fox, P. T. (2013). Networks of task co‐activations. NeuroImage, 80, 505–514. [DOI] [PMC free article] [PubMed] [Google Scholar]
- Lappe, C. , Herholz, S. C. , Trainor, L. J. , & Pantev, C. (2008). Cortical plasticity induced by short‐term unimodal and multimodal musical training. Journal of Neuroscience, 28, 9632–9639. [DOI] [PMC free article] [PubMed] [Google Scholar]
- Lappe, C. , Trainor, L. J. , Herholz, S. C. , & Pantev, C. (2011). Cortical plasticity induced by short‐term multimodal musical rhythm training. PLoS One, 6, e21493. [DOI] [PMC free article] [PubMed] [Google Scholar]
- Li, Y. O. , Adalı, T. , & Calhoun, V. D. (2007). Estimating the number of independent components for functional magnetic resonance imaging data. Human Brain Mapping, 28, 1251–1266. [DOI] [PMC free article] [PubMed] [Google Scholar]
- Lowe, M. , Mock, B. , & Sorenson, J. (1998). Functional connectivity in single and multislice echoplanar imaging using resting‐state fluctuations. NeuroImage, 7, 119–132. [DOI] [PubMed] [Google Scholar]
- Oldfield, R. C. (1971). The assessment and analysis of handedness: The Edinburgh inventory. Neuropsychologia, 9, 97–113. [DOI] [PubMed] [Google Scholar]
- Palomar‐García, M.‐Á. , Zatorre, R. J. , Ventura‐Campos, N. , Bueichekú, E. , & Ávila, C. (2017). Modulation of functional connectivity in auditory–motor networks in musicians compared with nonmusicians. Cerebral Cortex, 27, 2768–2778. [DOI] [PubMed] [Google Scholar]
- Park, B. , Kim, J. I. , Lee, D. , Jeong, S.‐O. , Lee, J. D. , & Park, H.‐J. (2012). Are brain networks stable during a 24‐hour period? NeuroImage, 59, 456–466. [DOI] [PubMed] [Google Scholar]
- Park, H.‐J. , Kubicki, M. , Westin, C.‐F. , Talos, I.‐F. , Brun, A. , Peiper, S. , … Shenton, M. E. (2004). Method for combining information from white matter fiber tracking and gray matter parcellation. American Journal of Neuroradiology, 25, 1318–1324. [PMC free article] [PubMed] [Google Scholar]
- Park, H. J. , & Friston, K. (2013). Structural and functional brain networks: From connections to cognition. Science (New York, N.Y.), 342, 1238411. [DOI] [PubMed] [Google Scholar]
- Pavlides, C. , Miyashita, E. , & Asanuma, H. (1993). Projection from the sensory to the motor cortex is important in learning motor skills in the monkey. Journal of Neurophysiology, 70, 733–741. [DOI] [PubMed] [Google Scholar]
- Pfordresher, P. Q. , & Palmer, C. (2006). Effects of hearing the past, present, or future during music performance. Attention, Perception, & Psychophysics, 68, 362–376. [DOI] [PubMed] [Google Scholar]
- Putkinen, V. , Tervaniemi, M. , Saarikivi, K. , de Vent, N. , & Huotilainen, M. (2014). Investigating the effects of musical training on functional brain development with a novel melodic MMN paradigm. Neurobiology of Learning and Memory, 110, 8–15. [DOI] [PubMed] [Google Scholar]
- Reitan, R. M. , & Wolfson, D. (1985). The Halstead–Reitan neuropsychological test battery: Theory and clinical interpretation. Reitan Neuropsychology. [Google Scholar]
- Repp, B. H. (1999). Effects of auditory feedback deprivation on expressive piano performance. Music Perception: An Interdisciplinary Journal, 16, 409–438. [Google Scholar]
- Rodriguez‐Herreros, B. , Amengual, J. L. , Gurtubay‐Antolín, A. , Richter, L. , Jauer, P. , Erdmann, C. , … Münte, T. F. (2015). Microstructure of the superior longitudinal fasciculus predicts stimulation‐induced interference with on‐line motor control. NeuroImage, 120, 254–265. [DOI] [PubMed] [Google Scholar]
- Rüber, T. , Lindenberg, R. , & Schlaug, G. (2015). Differential adaptation of descending motor tracts in musicians. Cerebral Cortex, 25, 1490–1498. [DOI] [PMC free article] [PubMed] [Google Scholar]
- Sami, S. , & Miall, R. (2013). Graph network analysis of immediate motor‐learning induced changes in resting state BOLD. Frontiers in Human Neuroscience, 7, [DOI] [PMC free article] [PubMed] [Google Scholar]
- Schlaug, G. (2015). Musicians and music making as a model for the study of brain plasticity. Progress in Brain Research, 217, 37–55. [DOI] [PMC free article] [PubMed] [Google Scholar]
- Shehzad, Z. , Kelly, A. C. , Reiss, P. T. , Gee, D. G. , Gotimer, K. , Uddin, L. Q. , … Biswal, B. B. (2009). The resting brain: Unconstrained yet reliable. Cerebral Cortex, 19, 2209–2229. [DOI] [PMC free article] [PubMed] [Google Scholar]
- Sloboda, J. A. , Davidson, J. W. , Howe, M. J. , & Moore, D. G. (1996). The role of practice in the development of performing musicians. British Journal of Psychology, 87, 287–309. [Google Scholar]
- Smith, S. M. (2002). Fast robust automated brain extraction. Human Brain Mapping, 17, 143–155. [DOI] [PMC free article] [PubMed] [Google Scholar]
- Smith, S. M. , Fox, P. T. , Miller, K. L. , Glahn, D. C. , Fox, P. M. , Mackay, C. E. , … Laird, A. R. (2009). Correspondence of the brain's functional architecture during activation and rest. Proceedings of the National Academy of Sciences, 106, 13040–13045. [DOI] [PMC free article] [PubMed] [Google Scholar]
- Smith, S. M. , Jenkinson, M. , Woolrich, M. W. , Beckmann, C. F. , Behrens, T. E. , Johansen‐Berg, H. , … Flitney, D. E. (2004). Advances in functional and structural MR image analysis and implementation as FSL. NeuroImage, 23, S208–S219. [DOI] [PubMed] [Google Scholar]
- Song, J. H. , Skoe, E. , Banai, K. , & Kraus, N. (2012). Training to improve hearing speech in noise: Biological mechanisms. Cerebral Cortex, 22, 1180. [DOI] [PMC free article] [PubMed] [Google Scholar]
- Stam, C. J. , van Straaten, E. C. W. , Van Dellen, E. , Tewarie, P. , Gong, G. , Hillebrand, A. , … Van Mieghem, P. (2016). The relation between structural and functional connectivity patterns in complex brain networks. International Journal of Psychophysiology, 103, 149–160. [DOI] [PubMed] [Google Scholar]
- Steele, C. J. , Bailey, J. A. , Zatorre, R. J. , & Penhune, V. B. (2013). Early musical training and white‐matter plasticity in the corpus callosum: Evidence for a sensitive period. Journal of Neuroscience, 33, 1282–1290. [DOI] [PMC free article] [PubMed] [Google Scholar]
- Yan, C. , & Zang, Y. (2010). DPARSF: A MATLAB toolbox for “pipeline” data analysis of resting-state fMRI. Frontiers in Systems Neuroscience, 4, 13. [DOI] [PMC free article] [PubMed] [Google Scholar]
- Zatorre, R. J. , Belin, P. , & Penhune, V. B. (2002). Structure and function of auditory cortex: Music and speech. Trends in Cognitive Sciences, 6, 37–46. [DOI] [PubMed] [Google Scholar]
- Zatorre, R. J. , Chen, J. L. , & Penhune, V. B. (2007). When the brain plays music: Auditory–motor interactions in music perception and production. Nature Reviews Neuroscience, 8, 547–558. [DOI] [PubMed] [Google Scholar]
- Zatorre, R. J. , Fields, R. D. , & Johansen‐Berg, H. (2012). Plasticity in gray and white: Neuroimaging changes in brain structure during learning. Nature Neuroscience, 15, 528–536. [DOI] [PMC free article] [PubMed] [Google Scholar]