

Abstract
Perinatal stroke is the leading cause of hemiparetic cerebral palsy (CP), resulting in life‐long disability. In this study, we examined the relationship between robotic upper extremity motor impairment and corticospinal tract (CST) diffusion properties. Thirty‐three children with unilateral perinatal ischemic stroke (17 arterial, 16 venous) and hemiparesis were recruited from a population‐based research cohort. Bilateral CSTs were defined using diffusion tensor imaging (DTI) and four diffusion metrics were quantified: fractional anisotropy (FA), mean (MD), radial (RD), and axial (AD) diffusivities. Participants completed a visually guided reaching task using the KINARM robot to define 10 movement parameters including movement time and maximum speed. Twenty‐six typically developing children underwent the same evaluations. Partial correlations assessed the relationship between robotic reaching and CST diffusion parameters. All diffusion properties of the lesioned CST differed from controls in the arterial group, whereas only FA was reduced in the venous group. Non‐lesioned CST diffusion measures were similar between stroke groups and controls. Both stroke groups demonstrated impaired reaching performance. Multiple reaching parameters of the affected limb correlated with lesioned CST diffusion properties. Lower FA and higher MD were associated with greater movement time. Few correlations were observed between non‐lesioned CST diffusion and unaffected limb function though FA was associated with reaction time (R = −0.39, p < .01). Diffusion properties of the lesioned CST are altered after perinatal stroke, the degree of which correlates with specific elements of visually guided reaching performance, suggesting specific relevance of CST structural connectivity to clinical motor function in hemiparetic children.
Keywords: cerebral palsy, corticospinal tracts, hemiparesis, motor function, perinatal stroke, robotics, tractography
1. INTRODUCTION
Perinatal ischemic stroke due to cerebral arterial or venous occlusion occurs between the 20th week of gestation and 28th postnatal day (Raju, Nelson, Ferriero, & Lynch, 2007). Strokes can be large middle cerebral artery infarctions (arterial ischemic stroke; AIS) occurring close to term or smaller, subcortical periventricular venous infarctions (PVI) that occur in utero (Kirton, deVeber, Pontigon, MacGregor, & Shroff, 2008; Kirton et al., 2011). Areas of the brain critical to motor function are often damaged by both these lesions and perinatal stroke accounts for most hemiparetic cerebral palsy (CP) with lifelong physical disability (Kirton and DeVeber, 2013). Motor deficits are complex and often include muscle weakness, spasticity, and impairments in reaching, grasping, and dexterity (Brown, van Rensburg, Walsh, Lakie, & Wright, 1987; Eliasson, Gordon, & Forssberg, 1992; Eliasson and Gordon, 2000; Gordon, Charles, & Duff, 1999). The presence of motor deficits may result in relative “non‐use” of the affected limb in daily activities and impact a child's quality of life (Klingels et al., 2012). An improved understanding of the neurophysiological mechanisms underlying these developmental disorders of the motor system is required to advance therapeutic interventions to enhance function.
The principal white matter pathway for limb movement is the corticospinal tract (CST). In humans, the development of the CST begins in the first trimester and continues through adolescence (ten Donkelaar et al., 2004; Friel, Chakrabarty, & Martin, 2013; Nezu et al., 1997). These tracts begin with projections originating from each hemisphere, resulting in approximately equal proportions of contralateral and ipsilateral CST early in life (Friel et al., 2013). During normal early motor development, ipsilateral projections are selectively withdrawn while contralateral connections are strengthened, leading to mature patterns of predominantly contralateral motor control (Eyre, Taylor, Villagra, Smith, & Miller, 2001). Early unilateral brain injuries, such as perinatal stroke, alter this process, often leading to persistent ipsilateral control of the hemiparetic limbs by the non‐lesioned hemisphere. An increase of such ipsilateral control of the paretic limb relative to preserved motor control from the original, lesioned hemisphere has been associated with worse motor function (Cioni, Montanaro, Tosetti, Canapicchi, & Ghelarducci, 2001; Holmström et al., 2010; Staudt et al., 2002; Ward, 2004; Zewdie, Damji, Ciechanski, Seeger, & Kirton, 2016). Such models are well supported by both animal studies (Martin, Friel, Salimi, & Chakrabarty, 2007) and human studies employing both brain stimulation and advanced brain imaging mapping techniques (Eyre, 2007; Kirton, 2013; Staudt, 2007). However, elements of structural connectivity remain to be defined.
Advances in neuroimaging offering opportunities to assess brain tissue microstructure can further refine such models. Neuroimaging can provide details about the neural, structural, and functional composition of the injured brain and contribute to understanding the links between anatomical injuries, plasticity, and resulting impairments. Diffusion tensor imaging (DTI) can noninvasively characterize the structural connectivity and underlying microstructure of white matter pathways (Mori, Crain, Chacko, & van Zijl, 1999). Diffusion imaging is sensitive to the motion of water molecules and can be modelled using a tensor to quantify diffusion anisotropy (the directionality of water motion) (Basser and Jones, 2002). Fractional anisotropy (FA) is a commonly investigated biomarker of such diffusion and tissue microstructure, where greater values indicate more ordered diffusion along white matter tracts. Several studies in children with hemiparesis have demonstrated that reduced FA, indicative of more random diffusion within the stroke‐affected CST, is associated with poor motor function in the contralateral, affected limbs (van der Aa et al., 2013a; Lennartsson et al., 2015; Roze et al., 2012; Yoshida et al., 2010). More recently, we have investigated the relationship between sensory dysfunction (Kuczynski, Dukelow, Semrau, & Kirton, 2016; Kuczynski, Semrau, Kirton, & Dukelow, 2017b) and diffusion properties of the dorsal column medial lemniscus sensory pathways in children with perinatal stroke and hemiparetic CP (Kuczynski et al., 2017a). We found that diffusion properties were abnormal (reduced FA and fiber count; increased diffusivities) in stroke subjects, the degree of which was associated with clinical measures of impaired sensorimotor function. This was facilitated by the use of robotics which allow the careful characterization and quantification of discrete sensory functions not amenable to clinical assessments alone.
The clinical evaluation of motor function in hemiparetic patients is similarly limited by the poor sensitivity of available clinical assessments and examiner bias. Robotic technology can help overcome this and be used to accurately quantify motor function in children (Aboelnasr, Hegazy, & Altalway, 2016; Fasoli et al., 2008; Little et al., 2015; Little et al., 2016), and adults with stroke (Aisen, Krebs, Hogan, McDowell, & Volpe, 1997; Coderre et al., 2010; Dukelow, Herter, Bagg, & Scott, 2012; Kitago et al., 2015; Krebs, Ladenheim, Hippolyte, Monterroso, & Mast, 2009; Semrau, Herter, Scott, & Dukelow, 2015; Volpe, Krebs, & Hogan, 2001) and traumatic brain injury (Debert, Herter, Scott, & Dukelow, 2012). In these studies, motor function as measured by robotic devices correlates with clinical measures of disability (Semrau et al., 2015). We have recently characterized detailed dysfunction of visually guided reaching in both upper extremities of children with perinatal stroke and cerebral palsy (Kuczynski et al., 2017a, under review). The relationship between CST structural connectivity and such robotic measures of motor performance in disabled children with perinatal stroke has not been investigated. Filling in such missing pieces of models for brain development following early injury is essential as they are now informing targeted interventional clinical trials with emerging evidence of efficacy and improved outcomes (Gillick et al., 2015; Kirton, 2016; Kirton et al., 2017).
In this study, we examined the diffusion properties of bilateral CSTs in hemiparetic children with perinatal ischemic stroke and in typically developing controls. We aimed to characterize differences in CST structural connectivity in both hemispheres and their relationship to motor function as measured by both standardized clinical measures and robotic visually guided reaching performance. We hypothesized that the CST diffusion properties, specifically fractional anisotropy, in the lesioned hemisphere would differ from the CST in the non‐dominant hemisphere of controls, the degree of which would be associated with robot‐quantified motor performance.
2. METHODS
2.1. Participants
Participants were recruited through the Alberta Perinatal Stroke Project, a population‐based research cohort (Cole et al., 2017). Inclusion criteria were age 6–19 years, term birth (≥36 weeks), MRI confirmed unilateral perinatal ischemic stroke (arterial or venous) (Kirton et al., 2008), and clinical confirmation of symptomatic hemiparetic CP (≥0.5 in the sensorimotor component of the Pediatric Stroke Outcome Measure (Kitchen et al., 2012), Manual Abilities Classification System (Eliasson et al., 2006) grade I–IV), and child and parent perceived functional limitations. Exclusion criteria included multifocal stroke, other neurological disorders not attributable to stroke, severe hemiparesis (Manual Abilities Classification System grade V), severe spasticity (Modified Ashworth Scale = 4) or contracture, upper limb surgery or botulinum toxin injections in the last 6 months, and the inability to comply with testing protocols.
Typically developing children comparable in age and sex were recruited from the community and underwent the same evaluations. Healthy controls were right‐handed per the Edinburgh Handedness Inventory (Oldfield, 1971). The study was approved by the Research Ethics Board at the University of Calgary. Written informed consent and assent were obtained.
2.2. Imaging acquisition and tractography
Participants were imaged at the Alberta Children's Hospital 3T MRI (GE Discovery MR750w, GE Healthcare, Waukesha, WI) using a 32‐channel receive‐only head coil (MR Instruments). High‐resolution T1‐weighted anatomical images were obtained using a fast‐spoiled gradient echo sequence with the following parameters: 166 slices, repetition time (TR) = 8.5 ms, echo time (TE) = 3.2 ms, flip angle = 11, field of view = 256, matrix size = 256 × 256, axial acquisition, voxels = 1 mm3 isotropic. DTI was acquired with 32 directions, TR = 11.5 s, TE = 69.1 ms, b‐values = 0, 750 s/mm2; matrix size = 256 × 256, voxels = 2.2 mm3 isotropic, and scan duration = 6:13 min. Images were visually inspected for artefacts. Eddy current distortions and participant movement in the diffusion weighted image was corrected using FSL's Diffusion Toolbox (Jenkinson, Beckmann, Behrens, Woolrich, & Smith, 2012).
Using MRtrix software (Tournier, Calamante, & Connelly, 2012), the diffusion tensor was calculated and a color‐coded FA map delineating areas of high anisotropy and directionality of water diffusion was generated. Two ROIs were manually defined on axial slices at anatomically guided locations according to known anatomy using the color map for guidance (Figure 1) (Oishi, Faria, Van Zijl, & Mori, 2011; Wakana, Jiang, Nagae‐Poetscher, van Zijl, & Mori, 2004; Yoshida et al., 2010). Bilateral CSTs were generated with the first ROI encompassing the cerebral peduncle and the second ROI placed in the posterior limb of the internal capsule. Probabilistic tractography was used to reconstruct the CSTs in both hemispheres separately requiring each streamline to pass through both ROIs (FA threshold = 0.2, maximum turning angle 70°, 7500 streamline samples). Spurious fibers definitively not within the CST (connecting to the corpus callosum or cerebellum) were identified and removed using exclusion ROIs. As this stage introduces some unavoidable subjectivity, standard rules were employed as previously described (Hodge, Goodyear, Carlson, Wei, & Kirton, 2017). Average FA, radial (RD), axial (AD), and mean diffusivity (MD) of the entire tract were then calculated for each CST. Inter‐rater reliability was performed by a second, blinded assessor (JAH) two months apart on a subset of 8 randomly selected stroke cases and controls. Intraclass correlations (ICC) evaluated inter‐rater reliability of all CST diffusion outcomes.
Figure 1.
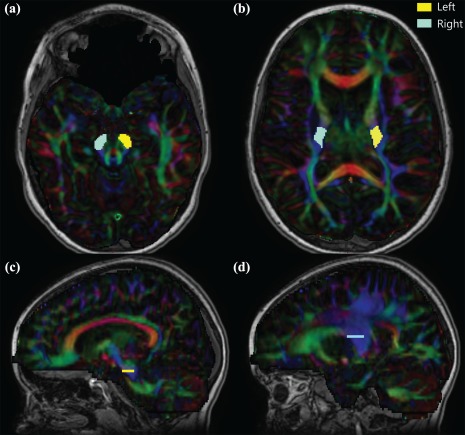
Seed regions of interest in reconstructing bilateral CSTs. Regions of interest are shown for both the left (yellow) and right (blue) CSTs in a typically developing nine year old. (a) Cerebral peduncles ROI were placed on the slice with the greatest decussation of the superior cerebellar peduncles (red). (b) Posterior limb of the internal capsule seed was placed in vertically oriented white matter between the thalamus and putamen and behind the genu five slices cranial to the first sighting of the full splenium. The relative location of each ROI is shown on sagittal slices for the cerebral peduncles (c) and posterior limb of the internal capsule (d) for the left (dominant) CST [Color figure can be viewed at http://wileyonlinelibrary.com]
In our right‐handed controls, the CST generated in the left hemisphere was referred to as the dominant CST, whereas the contralateral right CST projecting to the left upper extremity was classified as nondominant. In stroke participants, the CST in the stroke‐affected hemisphere was referred to as the lesioned CST while the contralateral CST from the non‐lesioned hemisphere was classified as non‐lesioned CST. Accordingly, the upper extremities evaluated are referred to as dominant (right) or non‐dominant (left) in controls and affected (contralateral to stroke) or unaffected (ipsilateral to stroke) for stroke cases. We acknowledge that both the non‐lesioned CST and the “unaffected” arm may not be entirely normal but have chosen this convention for simplicity.
2.3. Robotic visually guided reaching
Assessments were performed at the Foothills Medical Centre Stroke Robotics Laboratory (Calgary, Canada) using the KINARM robotic exoskeleton (BKIN Technologies Ltd., Kingston, Ontario). Participants sat in a modified wheelchair base, while the robot supported the participant's arms in the horizontal plane (Figure 2a). The robot was custom‐fit for each participant including risers for the arm troughs and a booster seat with foam padding for optimal limb positioning in smaller children. Once fit, participants were wheeled into the augmented reality workstation where virtual targets for the task were projected through a semi‐transparent screen.
Figure 2.
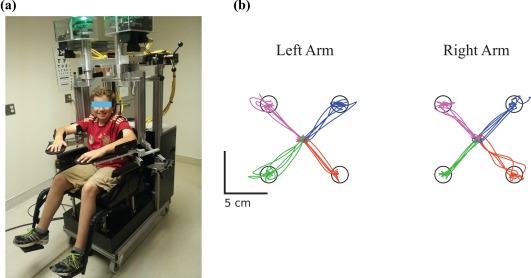
KINARM robot and visually guided reaching task. (a) A healthy, right‐handed eleven year old control is shown in the KINARM robot adjusted to fit the participant. (b) The visually guided reaching task performance of this same control is shown for both his left (nondominant) and right (dominant) arms. The participant reached out from a central target to one of four peripheral targets with each arm separately. Each color (pink, blue, green, and orange) represents the movements made to one peripheral target [Color figure can be viewed at http://wileyonlinelibrary.com]
The KINARM robot assessed visually guided reaching of each arm separately (Coderre et al., 2010; Dukelow et al., 2012). Participants were instructed to move their hand from a fixed central position to one of four peripheral circular targets as quickly and accurately as possible. The peripheral targets were located in the circumference of a circle, separated by 6 cm (Figure 2b). Participants completed five blocks of trials for a total of 20 reaches out from the central target with each arm. When discussing control performance on the task, the limbs were referred to as the dominant or non‐dominant, whereas stroke participant performance referred to the affected or unaffected limb as above. Ten parameters were recorded for each arm for movements out of the central target:
Postural speed (PS): hand speed in the 500 ms prior to the illumination of the peripheral target (in centimeters/second) while holding at the center target.
Reaction time (RT): time from the illumination of the peripheral target to the onset of arm movement in reaching for this target (in seconds).
Initial direction error (IDE): angular deviation (in degrees) between a) a straight line from the hand position at movement onset to the peripheral target and b) a vector from the hand position at movement onset to the hand position after the initial movement. The initial stage of movement was defined as the time between movement onset and the first minimum hand speed.
Initial distance ratio (IDR): the ratio of distance the hand moved during the initial movement to the distance the hand moved between movement onset and offset. A ratio >1 indicated distances moved greater than required to reach the peripheral target.
Initial speed ratio (ISR): the ratio of the maximum hand speed during initial movement to the global hand speed maximum of the trial.
Speed maxima count (SMC): the number of peaks in the speed profile between movement onset and offset
Minimum–maximum speed difference (MMSD): the differences between local speed peak maxima and minima throughout the movement.
Movement time (MT): the total time from movement onset to offset (in seconds).
Path length ratio (PLR): the total distance traveled by the hand between movement onset and offset.
Maximum speed (MS): the maximum hand speed achieved during the movement (in centimeters/second).
Two thresholds were calculated for each participant based on their hand speed when holding in the central target (Coderre et al., 2010). The lower posture speed threshold corresponded to the 95th percentile while holding in the center target prior to peripheral target illumination. The upper posture speed threshold corresponded to the 50th percentile of hand speed prior to peripheral target illumination. Movement onset was defined as the time at which hand speed fell below the lower speed threshold or a minimum in hand speed below the upper threshold was identified. If a participant's hand speed was never greater than the higher speed threshold, movement onset was defined as the time at which the hand left the central target. Movement offset was defined as the time at which the hand entered the peripheral target when hand speed was below the lower or higher speed threshold. If a participant did not reach the peripheral target, movement offset was not recorded.
2.4. Clinical assessment of motor function
Standardized, validated assessments of motor function that assessed bimanual upper extremity function were performed by a trained physiotherapist:
Assisting Hand Assessment (AHA), a 22‐item assessment measuring bimanual hand function (Krumlinde‐Sundholm, Holmefur, Kottorp, & Eliasson, 2007; Krumlinde‐sundholm and Eliasson, 2003) expressed in logit AHA units ranging from 37 (little to no use of contralesional hand) to 100 (normal motor function).
Melbourne Assessment of Unilateral Upper Limb Function (MA), a 16‐task measure of contralesional limb motor function (Bourke‐Taylor, 2003; Randall, Johnson, & Reddihough, 1999). Scores ranged from 0 (inability to perform tasks) to 100 (no difficulty performing tasks).
Chedoke‐McMaster Stroke Assessment (CMSA), a 19‐task measure of unilateral upper limb motor function assessed both the contralesional and ipsilesional arms and hands of children with perinatal stroke through seven stages of movement. Scores ranged from 0 (paralysis) to 7 (normal movement) (Barreca, Stratford, Lambert, Masters, & Streiner, 2005).
Mirror Movement Assessment was performed in all participants in each hand separately. Participants were asked to hold both hands up in front of them with their palms open and facing the therapist. Three tasks were assessed: finger tapping (tapping the index finger with the thumb), finger sequence (tapping each finger to the thumb in sequence, tapping the index and pinky finger twice when changing direction), and grasp (opening and closing of the hand in rapid succession). Scores were based on the mirror movement in the hand not performing the three tasks, ranging from 0 (no movement) to 5 (full movement >80%).
Purdue pegboard test (PPB) (LaFayette Instrument Co, LaFayette, IN) tested fine motor function of each hand separately. Participants picked up one peg at a time and in 30 s, successively filled them down a row of holes as quickly and accurately as possible. This test was repeated twice and the best score used in analysis (Tiffin and Asher, 1948). Scores for both hands were recorded.
2.5. Statistical analysis
A one‐way, mixed model analysis of covariance (ANCOVA) with Bonferroni post‐hoc correction tested for differences in diffusion parameters in each hemisphere and robotic reaching performance among the stroke and control groups while controlling for age. Within each group, paired t tests evaluated differences of mean diffusion parameters of the CSTs between the two hemispheres. The relationship between DTI parameters, robotic visually guided reaching and clinical motor function was assessed using partial Spearman's correlations controlling for age. When assessing the relationship between CST diffusion measures and robot parameters, all three groups were combined in the analysis to optimize power. The diffusion parameters of the CST from each hemisphere were assessed for their correlation with reaching metrics of both upper extremities. A Bonferroni post‐hoc test corrected for multiple comparisons when assessing the relationship of CST diffusion properties with robotic (α = 0.005) and clinical (α = 0.008) measures. The developmental trajectories of DTI parameters with age were fit with linear equations based on best fit of the data. The number of participants that fell outside the 95% prediction interval of control performance for each diffusion parameter was determined. Statistical analyses were performed using SigmaPlot (Systat Software Inc., San Jose, CA, USA), and SPSS (IBM, Armonk, NY, USA).
3. RESULTS
3.1. Population
A total of 63 participants underwent imaging and robotic assessment (AIS n = 21, PVI n = 16, controls n = 26). Four AIS participants with large cortical/subcortical stroke were excluded from analyses due to the inability to reconstruct a CST in the lesioned hemisphere. Fifty‐nine participants were included in the final analyses. Between all three groups, age (F(2,56) = 0.14, p = .9) and sex (F(2,56) = 0.35, p = .7) were comparable (Table 1). Three representative examples of reconstructed CSTs in participants with AIS, PVI, and a healthy control are shown in Figure 3. This study was a subset of a larger study in children with perinatal stroke, and subsequently all stroke and control participants underwent full KINARM protocols completing sensory and motor tasks as previously reported (Kuczynski et al., 2017a, 2016, 2017b).
Table 1.
Demographic and clinical details of both upper extremities in stroke cases and controls
| AIS | PVI | Controls | |
|---|---|---|---|
| Number of subjects | 17 | 16 | 26 |
| Age (years) | 12.1 ± 4.3 | 11.7 ± 3.6 | 12.3 ± 3.5 |
| Sex (F, M) | 5, 12 | 6, 10 | 11, 15 |
| Affected hemisphere (L, R) | 12, 5 | 9, 7 | – |
| Handedness (L, R) | 9, 8 | 8, 8 | 0, 26 |
| Logit AHA [0–100] | 71.6 ± 18.4 (47–100)a | 76.7 ± 15.8 (55–100)a | – |
| MA [0–100] | 81.5 ± 16.5 (52–100)a | 89.5 ± 11.1 (64–100)a | – |
| Affected | Unaffected | Affected | Unaffected | Non‐dominant | Dominant | |
|---|---|---|---|---|---|---|
|
CMSA [0–7] Arm Hand |
[0,0,0,5,0,4,3,5] [0,0,1,6,3,2,3,1] |
[0,0,0,0,0,0,3,14] [0,0,0,0,1,0,3,13] |
[0,0,0,3,1,3,5,4] [0,0,0,1,0,9,6,0] |
[0,0,0,0,0,0,4,12] [0,0,0,0,0,0,5,11] |
– – |
– – |
|
Mirror Movements [0–5] Finger Tap Finger Sequence Grasp |
[7,3,4,2,1,0] [6,2,4,2,1,1] [4,2,8,2,0,1] |
[3,6,4,1,1,2] [1,2,7,3,3,1] [3,3,2,3,2,3] |
[3,7,4,0,1,1] [1,5,5,3,1,1] [1,4,5,3,0,3] |
[1,5,5,1,2,1] [1,4,5,1,3,1] [2,6,2,2,1,3] |
[18,18,3,0,0,0] [18,18,2,2,1,0] [19,19,4,0,0,0] |
[15,15,3,1,0,0] [13,13,4,1,0,0] [13,15,2,2,1,0] |
| PPB | 2.82 ± 3.9 (0–11) | 12.5 ± 1.7 (10–16) | 5.94 ± 4.7 (0–16) | 12.4 ± 2.3 (7–16) | 13.9 ± 2.4 (10–19) | 15.0 ± 2.2 (11–21) |
Note. Abbreviations: AIS = arterial ischemic stroke; PVI = periventricular venous infarction; F = female; M = male; L = left; R = right. Participant age is indicated as a mean ± standard deviation. Results from Assisting Hand Assessment (AHA), Melbourne Assessment of Unilateral Upper Limb Function (MA), and Purdue Pegboard (PPB) scores are shown as a mean ± standard deviation with the range of scores (round brackets). Chedoke‐McMaster Stroke Assessment (CMSA) scores for the arm and hand are shown as the number of participants that received a certain score between 0 and 7. Mirror Movements for the hand are shown as the number of participants that received a certain score between 0 and 5.
Indicates data missing from four participants.
Figure 3.
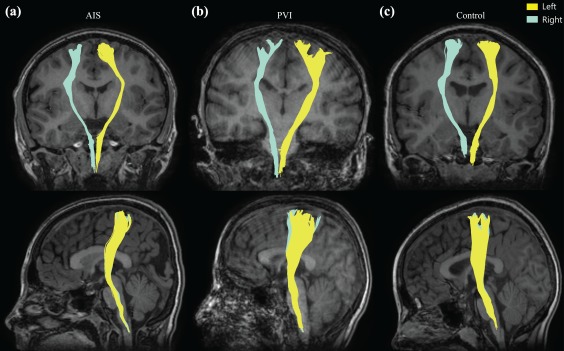
Corticospinal tractography of exemplar stroke and control participants. CSTs in both the left (yellow) and right (blue) hemispheres are shown as per radiological convention in a participant with (a) left hemisphere AIS, (b) right hemisphere PVI, and (c) a typically developing control [Color figure can be viewed at http://wileyonlinelibrary.com]
Inter‐rater reliability was high as defined by previous guidelines (Marenco et al., 2006). For the lesioned and non‐dominant CST, values included FA (ICC = 0.90, p < .01), MD (ICC = 0.964, p = .01), RD (ICC = 0.76, p < .05), and AD (ICC = 0.39, p = .3). In the non‐lesioned or dominant hemisphere, values included FA (ICC = 0.96, p < .001), MD (ICC = 0.98, p < .001), RD (ICC = 0.98, p < .001), and AD (ICC = 0.93, p = .001).
3.2. CST diffusion properties: Lesioned/non‐dominant hemisphere
Comparison of diffusion outcomes for the lesioned and non‐dominant hemisphere across groups is summarized in Figure 4. Mean tract FA in the lesioned hemisphere was lower in AIS (0.44 ± 0.05, p < .001) and PVI (0.46 ± 0.04, p < .05) cases relative to controls (0.49 ± 0.03, F(2,55) = 11.6; Figure 4a). Eight (47%) AIS and four (25%) PVI participants fell outside the range of control FA (Figure 4b). Aside from differences in FA, the PVI group had similar diffusion measures of the CST in their lesioned hemisphere relative to the non‐dominant CST in controls.
Figure 4.
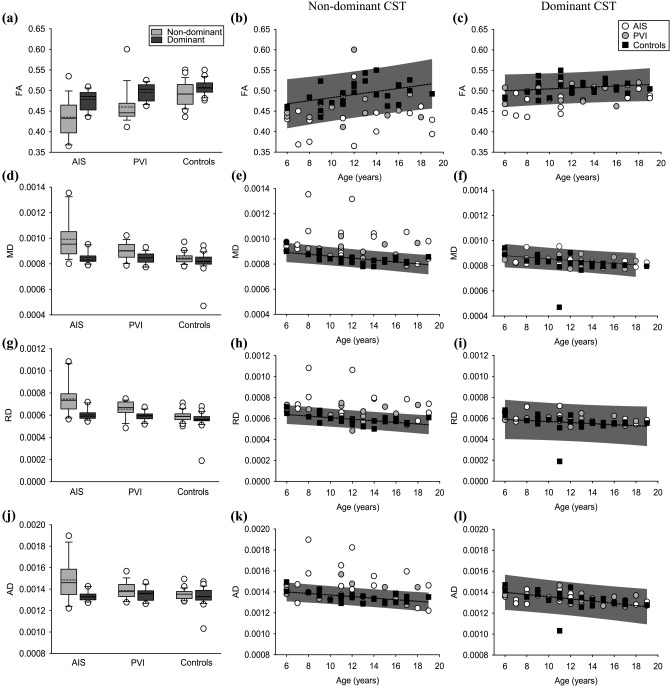
CST diffusion properties. (a–c) CST fractional anisotropy, (d–f) mean, (g–i) radial, and (j–l) axial diffusivities are shown. Boxplots of the diffusion parameters (left column) of non‐dominant (light grey bars) and dominant (dark gray bars) hemispheres are shown for stroke groups and controls. Scatter plots for the lesioned/non‐dominant (middle row) and non‐lesioned/dominant (right row) hemisphere diffusion measures show the stroke cases and controls with the mean line of best fit (dashed line) and 95% prediction intervals of control performance defining normal boundaries (grey box)
The remaining lesioned diffusion parameters were different in AIS but not PVI compared to controls. MD was greater in AIS cases (9.92 × 10⁻⁴±1.5 × 10⁻⁴) compared to both PVI (8.99 × 10⁻⁴±4.6 × 10⁻⁵, p = .01) and controls (8.45 × 10⁻⁴±4.3 × 10⁻⁵, F(2,55) = 13.6, p < .001; Figure 4d). Eight (47%) AIS and four (25%) PVI participants fell outside the range of control MD (Figure 4e). RD was greater in the AIS group (7.46 × 10⁻⁴±1.4 × 10⁻⁴) compared to the PVI (6.55 × 10⁻⁴±7.3 × 10⁻⁵, p = .01) and controls (5.91 × 10⁻⁴±4.8 × 10⁻⁵, F(2,55) = 15.4, p < .001) (Figure 4g). Nine (53%) AIS and five (31%) PVI cases fell outside the control range for RD (Figure 4h). Compared to control (1.35 × 10⁻³±4.7 × 10⁻⁵, F(2,55) = 7.68, p = .001) and PVI groups (1.39 × 10⁻³±8.0 × 10⁻⁵, p < .05), participants with AIS had greater AD (1.49 × 10⁻³±1.9 × 10⁻⁴; Figure 4j). Nine (53%) AIS and four (25%) PVI participants fell outside the range of control AD (Figure 4k).
3.3. CST diffusion properties: Non‐lesioned/dominant hemisphere
Comparison of diffusion outcomes for the non‐lesioned and dominant hemispheres across groups is summarized in Figure 4. FA of the CST in the non‐lesioned hemisphere of participants with AIS (0.48 ± 0.02) was again reduced compared to both PVI (0.50 ± 0.02, p = .05) and the dominant CST of controls (0.51 ± 0.02, F(2,55) = 10.4, p < .001) participants. Five (29%) AIS cases and one (6%) PVI participant fell outside the 95% range of control FA (Figure 4c). Mean MD did not differ between AIS (8.47 × 10⁻⁴±4.6 × 10⁻⁵, p = .4) and PVI (8.45 × 10⁻⁴±4.4 × 10⁻⁵, p = .6) cases relative to controls (8.16 × 10⁻⁴±8.2 × 10⁻⁵, F(2,55) = 1.50). Eight (47%) AIS and four (25%) PVI participants fell outside the range of control dominant hemisphere MD (Figure 4f).
RD was similar between AIS (6.03 × 10⁻⁴±4.9 × 10⁻⁵, p = .1), PVI (5.90 × 10⁻⁴±4.1 × 10⁻⁵, p = .5), and controls (5.58 × 10⁻⁴±8.4 × 10⁻⁵, F(2,55) = 2.64). No stroke cases fell outside the range of control RD (Figure 4i). Compared to controls (1.33 × 10⁻³±8.2 × 10⁻⁵, F(2,55) = 0.45), AD did not differ for AIS (1.34 × 10⁻³±4.5 × 10⁻⁵, p = 1) or PVI (1.35 × 10⁻³±5.9 × 10⁻⁵, p = 1) groups. No stroke participants fell outside the range of control AD (Figure 4l).
3.4. Differences between the hemispheres
Diffusion properties of the CST differed between the lesioned/non‐dominant and non‐lesioned/dominant hemisphere tracts in all three groups (Figure 4). Within each group, FA of the CST in the non‐dominant hemisphere was reduced relative to the dominant hemisphere: AIS (p < .01), PVI (p < .01), controls (p < .05). MD was greater in the non‐dominant CST within each group: AIS (p < .001), PVI (p < .001), and controls (p < .01). Within each group, RD was greater in the non‐dominant hemisphere relative to the dominant hemisphere: AIS (p < .001), PVI (p = .001), and controls (p < .01). AD of the lesioned, non‐dominant hemisphere CST was greater than AD of the dominant hemisphere in the AIS group (p < .01) but not PVI (p = .1) or controls (p = .3).
3.5. Visually guided reaching
Visually guided reaching performance is summarized in Table 2 and reported in detail elsewhere (Kuczynski et al., 2017a, under review). Reaching data was not obtained in one AIS participant due to difficulty completing the task with the affected limb. Overall, the affected limb of the stroke participants showed reaching impairments compared to controls. Less impairment was observed with the unaffected limb. AIS and PVI groups did not differ in performance with their unaffected arm with the exception of lower maximum hand speed in the AIS group relative to PVI (F(2,54) = 5.28, p < .05) when reaching out from the central target. With the unaffected limb, movement time was greater in AIS participants relative to PVI (F(2,54) = 7.21, p < .05) when reaching out. Maximum speed when reaching out was also lower in the AIS group relative to PVI (F(2,54) = 8.51, p < .01) and controls.
Table 2.
Robotic visually guided reaching performance
| AIS | PVI | Controls | |
|---|---|---|---|
| Affected/non‐dominant upper extremity | |||
| PS (cm/s) | 0.30 ± 0.2 | 0.21 ± 0.1 | 0.25 ± 0.1 |
| RT (s) | 0.47 ± 0.1† | 0.43 ± 0.1* | 0.37 ± 0.09 |
| IDE (°) | 8.20 ± 3.5† | 8.59 ± 4.3† | 4.02 ± 1.3 |
| IDR | 0.68 ± 0.2† | 0.69 ± 0.2† | 0.86 ± 0.09 |
| ISR | 0.95 ± 0.06 | 0.93 ± 0.06ǂ | 0.98 ± 0.02 |
| SMC | 2.52 ± 0.6* | 2.41 ± 0.4 | 2.13 ± 0.5 |
| MMSD (cm/s) | 1.68 ± 1.6* | 2.25 ± 1.2† | 0.65 ± 0.6 |
| MT (s) | 1.28 ± 0.3† | 1.16 ± 0.2* | 0.98 ± 0.2 |
| PLR | 1.52 ± 0.5† | 1.50 ± 0.2ǂ | 1.20 ± 0.1 |
| MS (cm/s) | 13.2 ± 2.3* | 16.2 ± 3.6 | 16.2 ± 3.5 |
| Unaffected/dominant upper extremity | |||
| PS (cm/s) | 0.23 ± 0.1 | 0.24 ± 0.1 | 0.21 ± 0.1 |
| RT (s) | 0.44 ± 0.1ǂ | 0.42 ± 0.1 | 0.35 ± 0.08 |
| IDE (°) | 5.72 ± 2.4 | 5.18 ± 2.0 | 4.67 ± 1.5 |
| IDR | 0.75 ± 0.2* | 0.79 ± 0.09 | 0.85 ± 0.09 |
| ISR | 0.95 ± 0.04ǂ | 0.96 ± 0.04* | 0.99 ± 0.02 |
| SMC | 2.49 ± 0.6 | 2.14 ± 0.4 | 2.12 ± 0.5 |
| MMSD (cm/s) | 0.77 ± 0.7 | 0.90 ± 0.4 | 0.90 ± 0.6 |
| MT (s) | 1.11 ± 0.2† | 0.97 ± 0.2 | 0.92 ± 0.1 |
| PLR | 1.19 ± 0.1 | 1.22 ± 0.1 | 1.18 ± 0.09 |
| MS (cm/s) | 12.8 ± 2.2† | 16.3 ± 3.9 | 16.5 ± 3.1 |
Note. Abbreviations: PS = posture speed; RT = reaction time; IDE = initial direction error; IDR = initial distance ratio; ISR = initial speed ratio; SMC = speed maxima count; MMSD = minimum‐maximum speed difference; MT = movement time; PLR = path length ratio; MS = maximum speed. Scores are shown as mean ± standard deviation. Statistical significance (ANCOVA) in performance compared to controls is indicated as * p < .05; ǂ p < .01; † p < .001. More detailed results are available elsewhere (Kuczynski et al., 2017a, under review).
3.6. CST diffusion properties and reaching performance
Significant correlations between all lesioned/non‐dominant CST diffusion metrics and robotic reaching for were found only in the AIS group. Correlations were not found in the individual groups between the nonlesioned/dominant tract and reaching of the “unaffected”/dominant limb. All three groups (AIS, PVI, and controls) were combined to demonstrate the correlations between motor tract connectivity and motor control across a pediatric sample.
Consistent and specific associations were observed between affected/non‐dominant limb reaching performance and lesioned/non‐dominant CST diffusion properties (Table 3). Of the 10 reaching parameters, 7 were highly correlated with CST diffusion measures of the lesioned/non‐dominant hemisphere. These included reaction time, initial direction error, initial distance ratio, speed maxima count, minimum–maximum speed difference, movement time, and path length ratio. Without exception, all of these correlations were seen for all 4 of the primary diffusion outcomes (FA, MD, RD, and AD). In contrast, the other three reaching parameters (posture speed, initial speed ratio, and maximum speed) demonstrated no association for any of these four diffusion metrics. An example of correlations with a spatial (initial direction error) and temporal (movement time) robotic parameter with diffusion properties of the CST in the non‐dominant hemisphere is shown in Figure 5.
Table 3.
Relationship between robotic reaching performance and CST diffusion measures
| Lesioned/non‐dominant | Non‐lesioned/dominant | |
|---|---|---|
| PS (cm/s) | ||
| FA | R = −0.10, p = .46 | R = −0.023, p = .86 |
| MD | R = 0.065, p = .63 | R = −0.001, p = .99 |
| RD | R = 0.076, p = .57 | R = 0.015, p = .91 |
| AD | R = 0.037, p = .79 | R = −0.036, p = .79 |
| RT (s) | ||
| FA | R = −0.42, p = .0011* | R = −0.39, p = .0024* |
| MD | R = 0.48, p = 1.7 × 10⁻⁴* | R = 0.33, p = .012 |
| RD | R = 0.48, p = 1.5 × 10⁻⁴* | R = 0.35, p = .0078 |
| AD | R = 0.41, p = .0014* | R = 0.25, p = .063 |
| IDE (°) | ||
| FA | R = −0.42, p = .0010* | R = −0.12, p = .36 |
| MD | R = 0.57, p = 4.0 × 10⁻⁶* | R = 0.18, p = .18 |
| RD | R = 0.57, p = 4.0 × 10⁻⁶* | R = 0.19, p = .16 |
| AD | R = 0.50, p = 7.7 × 10⁻⁵* | R = 0.15, p = .28 |
| IDR | ||
| FA | R = 0.41, p = .0014* | R = 0.34, p = .0086 |
| MD | R = −0.52, p = 3.2 × 10⁻⁵* | R = −0.23, p = .090 |
| RD | R = −0.53, p = 2.1 × 10⁻⁵* | R = −0.28, p = .035 |
| AD | R = −0.44, p = 6.2 × 10⁻⁴* | R = −0.082, p = .54 |
| ISR | ||
| FA | R = 0.17, p = .21 | R = 0.39, p = .0025* |
| MD | R = −0.17, p = .21 | R = −0.16, p = .24 |
| RD | R = −0.18, p = .18 | R = −0.22, p = .097 |
| AD | R = −0.13, p = .34 | R = −0.0064, p = .96 |
| SMC | ||
| FA | R = −0.37, p = .0049* | R = −0.24, p = .070 |
| MD | R = 0.57, p = 5.0 × 10⁻⁶* | R = 0.15, p = .26 |
| RD | R = 0.55, p = 8.0 × 10⁻⁶* | R = 0.19, p = .16 |
| AD | R = 0.52, p = 3.9 × 10⁻⁵* | R = 0.053, p = .69 |
| MMSD (cm/s) | ||
| FA | R = −0.44, p = 6.1 × 10⁻⁴* | R = −0.070, p = .60 |
| MD | R = 0.59, p = 1.0 × 10⁻⁶* | R = 0.20, p = .13 |
| RD | R = 0.59, p = 1.0 × 10⁻⁶* | R = 0.22, p = .091 |
| AD | R = 0.53, p = 2.7 × 10⁻⁵* | R = 0.13, p = .33 |
| MT (s) | ||
| FA | R = −0.51, p = 4.5 × 10⁻⁵* | R = −0.24, p = .074 |
| MD | R = 0.66, p = 4.0 × 10⁻⁸* | R = 0.16, p = .22 |
| RD | R = 0.67, p = 3.1 × 10⁻⁸* | R = 0.19, p = .15 |
| AD | R = 0.58, p = 3.0 × 10⁻⁶* | R = 0.081, p = .55 |
| PLR | ||
| FA | R = −0.45, p = 4.8 × 10⁻⁴* | R = −0.22, p = .11 |
| MD | R = 0.74, p = 1.1 × 10⁻⁹* | R = 0.21, p = .11 |
| RD | R = 0.71, p = 5.2 × 10⁻⁹* | R = 0.25, p = .063 |
| AD | R = 0.70, p = 7.7 × 10⁻⁹* | R = 0.12, p = .39 |
| MS (cm/s) | ||
| FA | R = 0.17, p = .20 | R = 0.21, p = .11 |
| MD | R = −0.13, p = .33 | R = −0.16, p = .23 |
| RD | R = −0.15, p = .27 | R = −0.17, p = .20 |
| AD | R = −0.080, p = .56 | R = −0.12, p = .38 |
Note. Abbreviations: PS = posture speed; RT = reaction time; IDE = initial direction error; IDR = initial distance ratio; ISR = initial speed ratio; SMC = speed maxima count; MMSD = minimum‐maximum speed difference; MT = movement time; PLR = path length ratio; MS = maximum speed; FA = fractional anisotropy; MD = mean diffusivity; RD = radial diffusivity; AD = axial diffusivity. Partial Spearman's correlations comparing the relationship between robotic reaching parameters and CST diffusion properties. Diffusion measures of the lesioned/non‐dominant CST and the correlations with affected/non‐dominant arm motor control, and non‐lesioned/dominant CST correlations with unaffected/dominant limb reaching performance are shown. R and p values with age‐correction are shown. An asterisks (*) denotes significant correlations following Bonferroni correction for multiple comparisons (α = 0.005).
Figure 5.
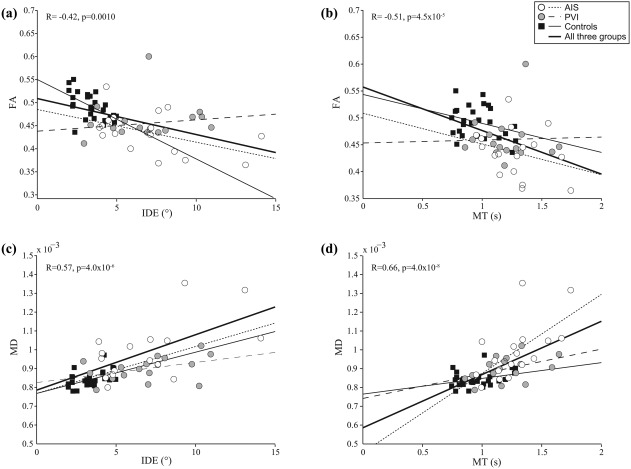
Relationship between CST diffusion properties and robotic visually guided reaching performance. FA of the lesioned/non‐dominant CST was negatively correlated with (a) initial direction error and (b) movement time of the non‐dominant limb. Conversely, lesioned/non‐dominant CST MD was positively correlated with (c) initial direction error and (d) movement time of the affected/non‐dominant limb. The bold regression line and statistics (R and p values) indicate the correlation when all three groups were pooled together
Within the seven movement metrics associated with CST diffusion properties, FA consistently demonstrated lower correlation strengths than the other diffusion variables. Mean FA of the lesioned/non‐dominant CST was negatively correlated with reaction time (R = −0.42, p = .001), initial direction error (R= −0.42, p = .001), speed maxima count (R = −0.37, p < .01), minimum–maximum speed difference (R = −0.44, p < .001), movement time (R = −0.51, p < .001), and path length ratio (R = −0.45, p < .001). FA was also positively correlated with initial distance ratio (R = 0.41, p = .001) of the affected, non‐dominant arm. MD was positively correlated with reaction time (R = 0.48, p < .001), initial direction error (R = 0.57, p < .001), speed maxima count (R = 0.57, p < .001), minimum–maximum speed difference (R = 0.59, p < .001), movement time (R = 0.66, p < .001), and path length ratio (R = 0.74, p < .001), and negatively correlated with initial distance ratio (R = −0.52, p < .001). The remaining primary diffusion variables (MD, RD, and AD) all demonstrated similar or higher correlations with the same seven visually guided reaching movement metrics.
Visually guided reaching performance of the unaffected/dominant arm did not correlate with any CST diffusion measures in the lesioned/non‐dominant hemisphere. The non‐lesioned/dominant CST diffusion parameters demonstrated fewer associations with visually guided reaching performance of the unaffected arm. Mean FA of the non‐lesioned, dominant CST was correlated with reaction time (R = −0.39, p < .01) and initial speed ratio (R = 0.39, p < .01) of the unaffected/dominant limb (Table 3). The non‐lesioned/dominant CST diffusion parameters did not correlate with reaching measures of the affected/non‐dominant limb.
3.7. CST diffusion properties and clinical measures of motor function
The AIS and PVI groups were combined (n = 24) to examine the relationship between AHA and MA scores with CST diffusion properties. Four AIS and four PVI participants did not have AHA and MA scores. Mean AHA and MA scores did not differ between AIS and PVI groups (t(22) = 0.70, p = .5 and U = 60.0, p = .5; Table 1). Associations were observed between these motor measures and lesioned CST diffusion metrics. AHA scores were negatively correlated with lesioned CST MD (R = −0.56, p = .005). MA scores were also correlated with lesioned MD (R = −0.65, p = .001), RD (R = −0.62, p = .002), and AD (R = −0.64, p = .001). Non‐lesioned hemisphere CST diffusion parameters did not correlate with AHA or MA scores.
The AIS and PVI participants were combined (n = 33) to assess the relationship between clinical CMSA arm and hand scores and CST diffusion measures. CMSA scores of the affected (U = 128.0, p = .8) and unaffected (U = 126.0, p = .6) arms did not differ between the two stroke groups. CMSA scores of the affected (U = 77.5, p = .03) hand were worse for the AIS group compared to PVI, but there was no difference for the unaffected (U = 128.0, p = .7) hand. CMSA scores of the affected arm correlated with mean MD (R = −0.56, p = .001), RD (R = −0.53, p = .002), and AD (R = −0.54, p = .001) of the lesioned CST. CMSA scores of the affected hand were positively correlated with lesioned CST FA (R = 0.47, p = .006), and negatively correlated with MD (R = −0.63, p = .0001), RD (R = −0.64, p = .00009), and AD (R = −0.53, p = .002). CMSA scores for the unaffected arm and hand did not correlate with any diffusion parameters of either the lesioned or non‐lesioned CST.
All three groups were again combined (n = 59) to assess the relationship between Purdue pegboard (PPB) scores and CST diffusion properties. PPB scores of the affected limb were lower in both the AIS and PVI group compared to controls (F(2,56) = 51.7, p < .001; Table 1). Participants with AIS had lower PPB scores than PVI (p = .05). PPB scores of the affected limb were positively correlated with lesioned CST FA (R = 0.52, p = .00003), and negatively correlated with MD (R = −0.59, p = .000001), RD (R = −0.60, p = .000001), and AD (R = −0.49, p = .0001). Affected limb PPB scores also correlated with nonlesioned/dominant CST mean FA (R = 0.36, p = .005). With the unaffected limb, PPB scores were lower in both stroke groups relative to the control dominant limb (F(2,56)=10.7, p = .001). PPB scores of the unaffected limb were not correlated with any CST diffusion measures of the non‐lesioned/dominant hemisphere, but were correlated with lesioned/non‐dominant CST FA (R = 0.39, p = .003).
4. DISCUSSION
We assessed CST microstructure in hemiparetic and healthy children using probabilistic diffusion tensor imaging and evaluated the relationship between diffusion properties with both robotic and clinical measures of motor function. We demonstrated that children with perinatal stroke have different diffusion properties in the lesioned CST, the degree of which is associated with both robotic and clinical measures of function in the contralesional affected upper extremity. More subtle findings suggest the diffusion properties of the non‐lesioned CST may also be altered and relevant to bimanual function. CST diffusion imaging may reveal multiple biomarkers informing models of developmental plasticity and relevant to clinical function in children with perinatal stroke and hemiparetic cerebral palsy.
Investigating white matter in the developing brain requires considerations across a protracted timeframe. White matter tracts develop during gestational weeks 24–34 with structural connectivity advancing past term and myelination continuing for decades (Jaspers, Byblow, Feys, & Wenderoth, 2015). Even perinatal stroke injuries differ between preterm (PVI) and term (AIS) periods where location, size, white matter maturity, and other factors likely dictate subsequent developmental plasticity (Eyre, Miller, Clowry, Conway, & Watts, 2000; Staudt et al., 2002). The development of CST diffusion metrics during childhood has been reported as nonlinear (Lebel and Beaulieu, 2011) though our measures appeared more linear. In keeping with previous studies, FA increased while MD, RD, and AD decreased with increasing age. Compared to the non‐dominant tract in controls, the development of the lesioned CST in stroke cases appeared to follow a similar pattern. Despite not following the same curve of white matter development, our observations fell within previously reported ranges (Lebel and Beaulieu, 2011). These differences may also be due in part due to our modest sample size and wide age range with larger, longitudinal studies required to understand white matter developmental trajectories after perinatal stroke.
Ours is not the first study to explore CST diffusion biomarkers in hemiparetic children. Previous studies have found reduced FA in the lesioned CST in children with hemiparesis that correlated with simple motor assessments such as the Gross Motor Function Classification System (Yoshida et al., 2010). Similar to our findings here, others have demonstrated that reduced FA and increased MD correlate with bimanual motor function as measured by the Assisting Hand Assessment and Melbourne Assessment of Unilateral Upper Limb Function (Rose, Guzzetta, Pannek, & Boyd, 2011; Tsao, Pannek, Boyd, & Rose, 2013). Limitations of these studies include modest sample sizes and heterogeneous populations, typically all types of “hemiparetic cerebral palsy” rather than the specific stroke diseases focused on here. Acute and subacute measures of CST diffusion appears predictive of ultimate hemiparesis in neonates with AIS (van der Aa et al., 2013a; van der Aa et al., 2013b). We believe our study brings additional important contributions. First, we describe the differences between two specific stroke types (AIS, PVI), demonstrating common themes but also disease‐specific differences in CST structural connectivity relative to controls. Second, we have objectively quantified motor dysfunction using a validated robotic exoskeleton (Coderre et al., 2010; Debert et al., 2012; Dukelow et al., 2012), bringing a much deeper level of functional motor assessment with correspondingly greater detail of specific deficits. Finally, this combination brought new opportunity to explore the role of both the lesioned and non‐lesioned CST as well as clinical function in bilateral upper extremities.
We characterized five standard diffusion biomarkers within the CST. Studies suggest that FA and MD may be more global measures of diffusion, associated with uniformity and integrity of axonal fibers (Basser and Pierpaoli, 1996). RD and AD, more specific measures, may relate to tract density and the degree of myelination, and axonal integrity, respectively (Mori and Zhang, 2006; Song et al., 2003). We found that the lesioned CST was significantly impaired in all diffusion properties, suggesting a loss of ordered diffusion within the CST and possible disruption in axonal organization and density. Previous studies have found reduced FA in the lesioned CST of hemiparetic children that correlated with motor assessments such as the Gross Motor Function Classification System (Yoshida et al., 2010), Assisting Hand Assessment, and Melbourne Assessment (Rose et al., 2011; Tsao et al., 2013). Similarly in our study, we found correlations between the diffusion metrics of the lesioned CST and clinical motor assessments such as the Assisting Hand Assessment, Melbourne Assessment, Chedoke‐McMaster Stroke Assessment, and Purdue Pegboard. These findings suggest that a loss of integrity and greater bulk diffusion in the non‐dominant CST are related to poor motor outcome, and indicate that the lack of preservation of these tracts affects overall disability.
The non‐lesioned hemisphere is an essential component of increasingly informed models of motor organization following perinatal stroke (Eyre, 2007; Kirton, 2013; Staudt, 2007). Accordingly, the properties of the contralesional CST are of great interest. This pathway may include upper motor neuron projections to both the contralateral, less affected limbs (see below) as well as preserved ipsilateral projections to the affected extremities. We observed several differences in the diffusion measures of the non‐lesioned CST including reduced FA in the AIS group and multiple affected limb clinical measures were correlated with non‐lesioned CST FA. These results contrast with recent case‐control studies from adult stroke suggesting non‐lesioned CST diffusion metrics are often within normal range (Jang et al., 2016). Studies of children with cerebral palsy suggesting no difference in diffusion properties of the CSTs between the two hemispheres share significant limitations (Yoshida et al., 2010). Studies of normal children have suggested there is little difference between CST diffusion properties of the two hemispheres (Roze et al., 2012). However, we recently described differences in both diffusion metrics and white matter signal intensity between the right and left hemispheres of typically developing school aged children (Kuczynski et al., 2017a). We therefore suggest that detailed measurement of both imaging and clinical outcomes in well powered, controlled studies may be able to inform understanding of structural connectivity in the non‐lesioned hemisphere.
Historical studies and our recent robotic study of reaching in perinatal stroke (Kuczynski et al., 2017a, under review) confirm that motor function in the unaffected limb of children with hemiparesis does not often perform at the same level as the dominant arm in healthy individuals. Several studies in adults and children with stroke have demonstrated that the “unaffected” (ipsilesional) upper extremity is not normal (Chestnut and Haaland, 2008; Eliasson and Gordon, 2000; Haaland and Delaney, 1981; Holmström et al., 2010; Wetter, Poole, & Haaland, 2005; Wingert, Burton, Sinclair, Brunstrom, & Damiano, 2008), but the mechanisms behind this are not well understood. The current study further informs this important issue. Clinical measures of unaffected limb function were often lower in both stroke groups relative to the dominant limb of controls. The same measures did not correlate with CST diffusion measures of the non‐lesioned hemisphere but were instead associated with lesioned CST FA. One simple speculation is that “worse” injury in the original hemisphere leads to more complex motor reorganization in the contralateral, non‐lesioned hemisphere with subsequent compromise to unaffected limb function though such “crowding theory” is not well supported by current evidence. Regardless, that the clinical performance of the limb most of these disabled children are dependent on for daily functioning is associated with CST diffusion measures supports their relevance and ongoing investigation in this population.
Combined dysfunction of both motor and sensory systems likely contributes to disability in cerebral palsy. Complementary parallels to this study focused on motor tracts and corresponding deficits can be drawn to recent work in the sensory system. In a similar controlled study of hemiparetic children with perinatal stroke, we recently quantified the diffusion properties of the dorsal column medial lemniscus pathway (Kuczynski et al., 2017a) and correlated them with specific dysfunction of position sense (Kuczynski et al., 2016) and kinesthesia (Kuczynski et al., 2017b). Children with AIS had reduced FA and fiber count, and increased MD, RD, and AD in the sensory tract in their lesioned hemisphere while similar but distinct abnormalities were observed in PVI subjects. This study appears somewhat in contrast to this relationship, where diffusion properties of the lesioned CST were quite similar between PVI and controls. These findings may suggest specific differences in the relevance of structural connectivity differences between both specific stroke types and the physiological function under consideration.
Despite its utility in imaging structural connectivity, DTI has several limitations. DTI is moderately sensitive to motion and noise, leading to co‐registration errors and phase shifting that may be corrected with postprocessing procedures (Chen, Guo, & Song, 2006). Selection of an adequate b‐value may also affect the generated tracts. B‐values reflect the timing and strength of diffusion weighted gradients, and generally a smaller b‐value (i.e., 600–800 s/mm2) is recommended for the pediatric population (Hüppi and Dubois, 2006; Pannek, Guzzetta, Colditz, & Rose, 2012). Owing to the large water content in the pediatric brain, a larger b‐value may provide greater diffusion‐weighting but also more noise.
The greatest limitations with DTI may be its inability to resolve crossing fiber (Tournier, Mori, & Leemans, 2011) and partial volume effects (Farquharson et al., 2013). Crossing fibers can be observed in roughly 90% of the brain's white matter voxels (Jeurissen, Leemans, Tournier, Jones, & Sijbers, 2010) and DTI algorithms are unable to resolve intravoxel fiber heterogeneity. Moreover, regions containing these crossing fibers may be susceptible to intravoxel partial volume effects corresponding to different tissues (i.e., white matter, grey matter, cerebrospinal fluid) with differing anisotropy and diffusion metrics. The result of this insensitivity is an average across different populations of fibers, which may not represent actual diffusion within the generated tracts. This averaging may further manifest as reduced fanning of the delineated tracts and may explain the lack of corticospinal projections to the upper extremity region of the motor cortex in the present study. A related limitation is the co‐existence of both contralateral and ipsilateral upper motor neurons in the CSTs emanating from the contralesional hemisphere. Our future studies will combine brain simulation with diffusion imaging below the cervicomedullary junction to better delineate this issue of motor structural connectivity.
5. CONCLUSION
Our observation of consistent correspondence between detailed motor behaviors and CST structural connectivity improves our understanding of structure‐function relationships, stroke‐induced microstructural changes, and how they differ with age and type of insult. Improving models of motor system developmental plasticity following early unilateral brain injury has the potential to advance emerging interventions (Kirton, 2016). Establishing imaging biomarkers of potential for recovery can help prognostication (Wen et al., 2016). Imaging predictors of responsiveness to therapeutic interventions may help select patients for clinical trials, bringing the potential of personalized medicine to pediatric neurorehabilitation. Collectively, such efforts may help to improve rehabilitation strategies and long term outcomes for disabled children with perinatal stroke and hemiparetic CP and their families.
CONFLICTS OF INTEREST
CL's spouse is an employee of General Electric. All other authors confirm no conflicts of interest.
FUNDING
This project was funded through an Alberta Children's Hospital CIHR trainee studentship, Alberta Innovates – Health Solutions graduate studentship, Alberta Innovates – Health Solutions Collaborative Research and Innovation Opportunities, Hotchkiss Brain Institute's Robertson Fund, and a Cerebral Palsy International Research Foundation Grant.
ACKNOWLEDGMENT
The authors would like to acknowledge the efforts and support of J. Yajure, M. Piitz, and M. Metzler.
Kuczynski AM, Dukelow SP, Hodge JA, et al. Corticospinal tract diffusion properties and robotic visually guided reaching in children with hemiparetic cerebral palsy. Hum Brain Mapp. 2018;39:1130–1144. 10.1002/hbm.23904
Funding information Alberta Children's Hospital CIHR trainee studentship; Alberta Innovates – Health Solutions graduate studentship; Alberta Innovates – Health Solutions Collaborative Research and Innovation Opportunities; Hotchkiss Brain Institute's Robertson Fund; Cerebral Palsy International Research Foundation
REFERENCES
- van der Aa, N. E. , Northington, F. J. , Stone, B. S. , Groenendaal, F. , Benders, M. J. N. L. , Porro, G. , … Zhang, J. (2013a). Quantification of white matter injury following neonatal stroke with serial DTI. Pediatr Research, 73, 756–762. [DOI] [PMC free article] [PubMed] [Google Scholar]
- van der Aa, N. E. , Verhage, C. H. , Groenendaal, F. , Vermeulen, R. J. , de Bode, S. , van Nieuwenhuizen, O. , & de Vries, L. S. (2013b). Neonatal neuroimaging predicts recruitment of contralesional corticospinal tracts following perinatal brain injury. Developmental Medicine and Child Neurology, 55, 707–712. [DOI] [PubMed] [Google Scholar]
- Aboelnasr, E. A. , Hegazy, F. A. , & Altalway, H. A. (2016). Kinematic characteristics of reaching in children with hemiplegic cerebral palsy: A comparative study. Brain Injury, 1–7. [DOI] [PubMed] [Google Scholar]
- Aisen, M. L. , Krebs, H. I. , Hogan, N. , McDowell, F. , & Volpe, B. T. (1997). The effect of robot‐assisted therapy and rehabilitative training on motor recovery following stroke. Archives of Neurology, 54, 443–446. [DOI] [PubMed] [Google Scholar]
- Barreca, S. R. , Stratford, P. W. , Lambert, C. L. , Masters, L. M. , & Streiner, D. L. (2005). Test‐retest reliability, validity, and sensitivity of the Chedoke arm and hand activity inventory: A new measure of upper‐limb function for survivors of stroke. Archives of Physical Medicine and Rehabilitation, 86, 1616–1622. [DOI] [PubMed] [Google Scholar]
- Basser, P. J. , & Pierpaoli, C. (1996). Microstructural and physiological features of tissues elucidated by quantitative‐diffusion‐tensor MRI. Journal of Magnetic Resonance. Series B, 111, 209–219. [DOI] [PubMed] [Google Scholar]
- Basser, P. J. , & Jones, D. K. (2002). Diffusion‐tensor MRI: Theory, experimental design and data analysis ‐ A technical review. NMRi N Biomedicine, 15, 456–467. [DOI] [PubMed] [Google Scholar]
- Bourke‐Taylor, H. (2003). Melbourne assessment of unilateral upper limb function: Construct validity and correlation with the pediatric evaluation of disability inventory. Developmental Medicine and Child Neurology, 45, 92–96. [PubMed] [Google Scholar]
- Brown, J. K. , van Rensburg, F. , Walsh, G. , Lakie, M. , & Wright, G. W. (1987). A neurological study of hand function of hemiplegic children. Developmental Medicine and Child Neurology, 29, 287–304. [DOI] [PubMed] [Google Scholar]
- Chen, B. , Guo, H. , & Song, A. W. (2006). Correction for direction‐dependent distortions in diffusion tensor imaging using matched magnetic field maps. NeuroImage, 30, 121–129. [DOI] [PubMed] [Google Scholar]
- Chestnut, C. , & Haaland, K. Y. (2008). Functional significance of ipsilesional motor deficits after unilateral stroke. Archives of Physical Medicine and Rehabilitation, 89, 62–68. [DOI] [PubMed] [Google Scholar]
- Cioni, G. , Montanaro, D. , Tosetti, M. , Canapicchi, R. , & Ghelarducci, B. (2001). Reorganisation of the sensorimotor cortex after early focal brain lesion: A functional MRI study in monozygotic twins. NeuroReport, 12, 1335–1340. [DOI] [PubMed] [Google Scholar]
- Coderre, A. M. , Zeid, A. A. , Dukelow, S. P. , Demmer, M. J. , Moore, K. D. , Demers, M. J. , … Scott, S. H. (2010). Assessment of upper‐limb sensorimotor function of subacute stroke patients using visually guided reaching. Neurorehabilitation and Neural Repair. [DOI] [PubMed] [Google Scholar]
- Cole, L. , Dewey, D. , Letourneau, N. , Kaplan, B. J. , Chaput, K. , Gallagher, C. , … Kirton, A. (2017). Clinical characteristics, risk factors, and outcomes associated with neonatal hemorrhagic stroke: A population‐based case‐control study. JAMA Pediatrics. [DOI] [PubMed] [Google Scholar]
- Debert, C. T. , Herter, T. M. , Scott, S. H. , & Dukelow, S. (2012). Robotic assessment of sensorimotor deficits after traumatic brain injury. Journal of Neurologic Physical Therapy, 36, 58–67. [DOI] [PubMed] [Google Scholar]
- ten Donkelaar, H. J. , Lammens, M. , Wesseling, P. , Hori, A. , Keyser, A. , & Rotteveel, J. (2004). Development and malformations of the human pyramidal tract. Journal of Neurology, 251, 1429–1442. [DOI] [PubMed] [Google Scholar]
- Dukelow, S. P. , Herter, T. M. , Bagg, S. D. , & Scott, S. H. (2012). The independence of deficits in position sense and visually guided reaching following stroke. Journal of Neuroengineering and Rehabilitation, 9, 72. [DOI] [PMC free article] [PubMed] [Google Scholar]
- Eliasson, A. C. , & Gordon, A. M. (2000). Impaired force coordination during object release in children with hemiplegic cerebral palsy. Developmental Medicine and Child Neurology, 42, 228–234. [DOI] [PubMed] [Google Scholar]
- Eliasson, A. C. , Gordon, A. M. , & Forssberg, H. (1992). Impaired anticipatory control of isometric forces during grasping by children with cerebral palsy. Developmental Medicine and Child Neurology, 34, 216–225. [DOI] [PubMed] [Google Scholar]
- Eliasson, A. C. , Krumlinde‐Sundholm, L. , Rosblad, B. , Beckung, E. , Arner, M. , Ohrvall, A. M. , & Rosenbaum, P. (2006). The Manual Ability Classification System (MACS) for children with cerebral palsy: Scale development and evidence of validity and reliability. Developmental Medicine and Child Neurology, 48, 549–554. [DOI] [PubMed] [Google Scholar]
- Eyre, J. A. (2007). Corticospinal tract development and its plasticity after perinatal injury. Neuroscience and Biobehavioral Reviews, 31, 1136–1149. [DOI] [PubMed] [Google Scholar]
- Eyre, J. A. , Miller, S. , Clowry, G. J. , Conway, E. A. , & Watts, C. (2000). Functional corticospinal projections are established prenatally in the human foetus permitting involvement in the development of spinal motor centres. Brain, 123(Pt 1), 51–64. [DOI] [PubMed] [Google Scholar]
- Eyre, J. A. , Taylor, J. P. , Villagra, F. , Smith, M. , & Miller, S. (2001). Evidence of activity‐dependent withdrawal of corticospinal projections during human development. Neurology, 57, 1543–1554. [DOI] [PubMed] [Google Scholar]
- Farquharson, S. , Tournier, J.‐D. , Calamante, F. , Fabinyi, G. , Schneider‐Kolsky, M. , Jackson, G. D. , & Connelly, A. (2013). White matter fiber tractography: Why we need to move beyond DTI. Journal of Neurosurgery, 118, 1367–1377. [DOI] [PubMed] [Google Scholar]
- Fasoli, S. E. , Fragala‐Pinkham, M. , Hughes, R. , Hogan, N. , Krebs, H. I. , & Stein, J. (2008). Upper limb robotic therapy for children with hemiplegia. American Journal of Physical Medicine & Rehabilitation, 87, 929–936. [DOI] [PubMed] [Google Scholar]
- Friel, K. M. , Chakrabarty, S. , & Martin, J. H. (2013). Pathophysiological mechanisms of impaired limb use and repair strategies for motor systems after unilateral injury of the developing brain. Developmental Medicine and Child Neurology, 55(Suppl 4), 27–31. [DOI] [PubMed] [Google Scholar]
- Gillick, B. , Menk, J. , Mueller, B. , Meekins, G. , Krach, L. E. , Feyma, T. , & Rudser, K. (2015). Synergistic effect of combined transcranial direct current stimulation/constraint‐induced movement therapy in children and young adults with hemiparesis: Study protocol. BMC Pediatrics, 15, 178. [DOI] [PMC free article] [PubMed] [Google Scholar]
- Gordon, A. M. , Charles, J. , & Duff, S. V. (1999). Fingertip forces during object manipulation in children with hemiplegic cerebral palsy. II: Bilateral coordination. Developmental Medicine and Child Neurology, 41, 176–185. [DOI] [PubMed] [Google Scholar]
- Haaland, K. Y. , & Delaney, H. D. (1981). Motor deficits after left or right hemisphere damage due to stroke or tumor. Neuropsychologia, 19, 17–27. [DOI] [PubMed] [Google Scholar]
- Hodge, J. , Goodyear, B. , Carlson, H. , Wei, X.‐C. , & Kirton, A. (2017). Segmental diffusion properties of the corticospinal tract and motor outcome in hemiparetic children with perinatal stroke. Journal of Child Neurology, 32, 550–559. [DOI] [PubMed] [Google Scholar]
- Holmström, L. , Vollmer, B. , Tedroff, K. , Islam, M. , Persson, J. K. E. , Kits, A. , … Eliasson, A.‐C. (2010). Hand function in relation to brain lesions and corticomotor‐projection pattern in children with unilateral cerebral palsy. Developmental Medicine and Child Neurology, 52, 145–152. [DOI] [PubMed] [Google Scholar]
- Hüppi, P. S. , & Dubois, J. (2006). Diffusion tensor imaging of brain development. Seminars in Fetal &Amp; Neonatal Medicine, 11, 489–497. [DOI] [PubMed] [Google Scholar]
- Jang, S. H. , Yi, J. H. , Choi, B. Y. , Chang, C. H. , Jung, Y. J. , Lee, H. D. , & Yeo, S. S. (2016). Changes of the corticospinal tract in the unaffected hemisphere in stroke patients: A diffusion tensor imaging study. Somatosensory &Amp; Motor Research, 33, 1–7. [DOI] [PubMed] [Google Scholar]
- Jaspers, E. , Byblow, W. D. , Feys, H. , & Wenderoth, N. (2015). The corticospinal tract: A biomarker to categorize upper limb functional potential in unilateral cerebral palsy. Frontiers in Pediatrics, 3, 112. [DOI] [PMC free article] [PubMed] [Google Scholar]
- Jenkinson, M. , Beckmann, C. F. , Behrens, T. E. J. , Woolrich, M. W. , & Smith, S. M. (2012). FSL. NeuroImage, 62, 782–790. [DOI] [PubMed] [Google Scholar]
- Jeurissen, B. , Leemans, A. , Tournier, J.‐D. , Jones, D. K. , & Sijbers, J. (2010). Estimating the number of fiber orientations in diffusion MRI voxels: A constrained spherical deconvolution study. In: Proceedings of the International Society for Magnetic Resonance in Medicine p 573.
- Kirton, A. (2013). Modeling developmental plasticity after perinatal stroke: Defining central therapeutic targets in cerebral palsy. Pediatric Neurology, 48, 81–94. [DOI] [PubMed] [Google Scholar]
- Kirton, A. , Armstrong‐Wells, J. , Chang, T. , deVeber, G. , Rivkin, M. J. , Hernandez, M. , … Ferriero, D. M. (2011). Symptomatic neonatal arterial ischemic stroke: The International Pediatric Stroke Study. Pediatrics, 128, e1402–e1410. [DOI] [PubMed] [Google Scholar]
- Kirton, A. , deVeber, G. , Pontigon, A. M. , MacGregor, D. , & Shroff, M. (2008). Presumed perinatal ischemic stroke: Vascular classification predicts outcomes. Annals of Neurology, 63, 436–443. [DOI] [PubMed] [Google Scholar]
- Kirton, A. (2016). Advancing non‐invasive neuromodulation clinical trials in children: Lessons from perinatal stroke. European Journal of Paediatric Neurology, 21, 75–103. [DOI] [PubMed] [Google Scholar]
- Kirton, A. , Ciechanski, P. , Zewdie, E. , Andersen, J. , Nettel‐Aguirre, A. , Carlson, H. , … Hill, M. (2017). Transcranial direct current stimulation for children with perinatal stroke and hemiparesis. Neurology, 88, 259–267. [DOI] [PubMed] [Google Scholar]
- Kirton, A. , & DeVeber, G. (2013). Life after perinatal stroke. Stroke, 44, 3265–3271. [DOI] [PubMed] [Google Scholar]
- Kitago, T. , Goldsmith, J. , Harran, M. , Kane, L. , Berard, J. , Huang, S. , … Huang, V. S. (2015). Robotic therapy for chronic stroke: General recovery of impairment or improved task‐specific skill? Journal of Neurophysiology, 114, 1885–1894. [DOI] [PMC free article] [PubMed] [Google Scholar]
- Kitchen, L. , Westmacott, R. , Friefeld, S. , MacGregor, D. , Curtis, R. , Allen, A. , … deVeber, G. (2012). The pediatric stroke outcome measure: A validation and reliability study. Stroke, 43, 1602–1608. [DOI] [PubMed] [Google Scholar]
- Klingels, K. , Demeyere, I. , Jaspers, E. , De Cock, P. , Molenaers, G. , Boyd, R. , & Feys, H. (2012). Upper limb impairments and their impact on activity measures in children with unilateral cerebral palsy. European Journal of Paediatric Neurology, 16, 475–484. [DOI] [PubMed] [Google Scholar]
- Krebs, H. I. , Ladenheim, B. , Hippolyte, C. , Monterroso, L. , & Mast, J. (2009). Robot‐assisted task‐specific training in cerebral palsy. Developmental Medicine and Child Neurology, 51(Suppl 4), 140–145. [DOI] [PubMed] [Google Scholar]
- Krumlinde‐Sundholm, L. , & Eliasson, A.‐C. (2003). Development of the assisting hand assessment: A Rasch‐built measure intended for children with unilateral upper limb impairments. Scandinavian Journal of Occupational Therapy, 10, 16–26. [Google Scholar]
- Krumlinde‐Sundholm, L. , Holmefur, M. , Kottorp, A. , & Eliasson, A. C. (2007). The Assisting Hand Assessment: Current evidence of validity, reliability, and responsiveness to change. Developmental Medicine and Child Neurology, 49, 259–264. [DOI] [PubMed] [Google Scholar]
- Kuczynski, A. M. , Carlson, H. L. , Lebel, C. , Hodge, J. A. , Dukelow, S. P. , Semrau, J. A. , & Kirton, A. (2017a). Sensory tractography and robot‐quantified proprioception in hemiparetic children with perinatal stroke. Human Brain Mapping, 38, 2424–2440. [DOI] [PMC free article] [PubMed] [Google Scholar]
- Kuczynski, A. M. , Dukelow, S. P. , Semrau, J. A. , & Kirton, A. (2016). Robotic quantification of position sense in children with perinatal stroke. Neurorehabilitation and Neural Repair, 30, 762–772. [DOI] [PubMed] [Google Scholar]
- Kuczynski, A. M. , Semrau, J. A. , Kirton, A. , & Dukelow, S. P. (2017b). Kinesthetic deficits after perinatal stroke: Robotic measurement in hemiparetic children. Journal of Neuroengineering and Rehabilitation, 14, 13. [DOI] [PMC free article] [PubMed] [Google Scholar]
- Lebel, C. , & Beaulieu, C. (2011). Longitudinal development of human brain wiring continues from childhood into adulthood. Journal of Neuroscience, 31, 10937–10947. [DOI] [PMC free article] [PubMed] [Google Scholar]
- Lennartsson, F. , Holmström, L. , Eliasson, A.‐C. , Flodmark, O. , Forssberg, H. , Tournier, J.‐D. , & Vollmer, B. (2015). Advanced fiber tracking in early acquired brain injury causing cerebral palsy. American Journal of Neuroradiology, 36, 181–187. [DOI] [PMC free article] [PubMed] [Google Scholar]
- Little, C. E. , Emery, C. , Black, A. , Scott, S. H. , Meeuwisse, W. , Nettel‐Aguirre, A. , … Dukelow, S. (2015). Test‐retest reliability of KINARM robot sensorimotor and cognitive assessment: In pediatric ice hockey players. Journal of Neuroengineering and Rehabilitation, 12, 78. [DOI] [PMC free article] [PubMed] [Google Scholar]
- Little, C. E. , Emery, C. , Scott, S. H. , Meeuwisse, W. , Palacios‐Derflingher, L. , & Dukelow, S. P. (2016). Do children and adolescent ice hockey players with and without a history of concussion differ in robotic testing of sensory, motor and cognitive function? Journal of Neuroengineering and Rehabilitation, 13, 89. [DOI] [PMC free article] [PubMed] [Google Scholar]
- Marenco, S. , Rawlings, R. , Rohde, G. K. , Barnett, A. S. , Honea, R. A. , Pierpaoli, C. , & Weinberger, D. R. (2006). Regional distribution of measurement error in diffusion tensor imaging. Psychiatry Research, 147, 69–78. [DOI] [PMC free article] [PubMed] [Google Scholar]
- Martin, J. H. , Friel, K. M. , Salimi, I. , & Chakrabarty, S. (2007). Activity‐ and use‐dependent plasticity of the developing corticospinal system. Neuroscience and Biobehavioral Reviews, 31, 1125–1135. [DOI] [PMC free article] [PubMed] [Google Scholar]
- Mori, S. , Crain, B. J. , Chacko, V. P. , & van Zijl, P. C. (1999). Three‐dimensional tracking of axonal projections in the brain by magnetic resonance imaging. Annals of Neurology, 45, 265–269. [DOI] [PubMed] [Google Scholar]
- Mori, S. , & Zhang, J. (2006). Principles of diffusion tensor imaging and its applications to basic neuroscience research. Neuron, 51, 527–539. [DOI] [PubMed] [Google Scholar]
- Nezu, A. , Kimura, S. , Uehara, S. , Kobayashi, T. , Tanaka, M. , & Saito, K. (1997). Magnetic stimulation of motor cortex in children: Maturity of corticospinal pathway and problem of clinical application. Brain Development, 19, 176–180. [DOI] [PubMed] [Google Scholar]
- Oishi, K. , Faria, A. V. , Van Zijl, P. C. M. , & Mori, S. (2011). MRI atlas of human white matter.
- Oldfield, R. C. (1971). The assessment and analysis of handedness: The Edinburgh inventory. Neuropsychologia, 9, 97–113. [DOI] [PubMed] [Google Scholar]
- Pannek, K. , Guzzetta, A. , Colditz, P. B. , & Rose, S. E. (2012). Diffusion MRI of the neonate brain: Acquisition, processing and analysis techniques. Pediatric Radiology, 42, 1169–1182. [DOI] [PubMed] [Google Scholar]
- Raju, T. N. , Nelson, K. B. , Ferriero, D. , & Lynch, J. K. (2007). Ischemic perinatal stroke: Summary of a workshop sponsored by the National Institute of Child Health and Human Development and the National Institute of Neurological Disorders and Stroke. Pediatrics, 120, 609–616. [DOI] [PubMed] [Google Scholar]
- Randall, M. , Johnson, L. M. , & Reddihough, D. (1999). The Melbourne assessment of unilateral upper limb function. Melbourne: Royal Children's Hospital. [DOI] [PubMed] [Google Scholar]
- Rose, S. , Guzzetta, A. , Pannek, K. , & Boyd, R. (2011). MRI structural connectivity, disruption of primary sensorimotor pathways, and hand function in cerebral palsy. Brain Connect, 1, 309–316. [DOI] [PubMed] [Google Scholar]
- Roze, E. , Harris, P. A. , Ball, G. , Elorza, L. Z. , Braga, R. M. , Allsop, J. M. , … Counsell, S. J. (2012). Tractography of the corticospinal tracts in infants with focal perinatal injury: Comparison with normal controls and to motor development. Neuroradiology, 54, 507–516. [DOI] [PubMed] [Google Scholar]
- Semrau, J. A. , Herter, T. M. , Scott, S. H. , & Dukelow, S. P. (2015). Examining differences in patterns of sensory and motor recovery after stroke with robotics. Stroke, 46, 3459–3469. [DOI] [PubMed] [Google Scholar]
- Song, S. K. , Sun, S. W. , Ju, W. K. , Lin, S. J. , Cross, A. H. , & Neufeld, A. H. (2003). Diffusion tensor imaging detects and differentiates axon and myelin degeneration in mouse optic nerve after retinal ischemia. NeuroImage, 20, 1714–1722. [DOI] [PubMed] [Google Scholar]
- Staudt, M. (2007). Reorganization of the developing human brain after early lesions. Developmental Medicine and Child Neurology, 49, 564. [DOI] [PubMed] [Google Scholar]
- Staudt, M. , Grodd, W. , Gerloff, C. , Erb, M. , Stitz, J. , & Krageloh‐Mann, I. (2002). Two types of ipsilateral reorganization in congenital hemiparesis: A TMS and fMRI study. Brain, 125, 2222–2237. [DOI] [PubMed] [Google Scholar]
- Tiffin, J. , & Asher, E. J. (1948). The Purdue pegboard; norms and studies of reliability and validity. The Journal of Applied Psychology, 32, 234–247. [DOI] [PubMed] [Google Scholar]
- Tournier, J. D. , Mori, S. , & Leemans, A. (2011). Diffusion tensor imaging and beyond. Magnetic Resonance in Medicine, 65, 1532–1556. [DOI] [PMC free article] [PubMed] [Google Scholar]
- Tournier, J.‐D. , Calamante, F. , & Connelly, A. (2012). MRtrix: Diffusion tractography in crossing fiber regions. International Journal of Imaging Systems and Technology, 22, 53–66. [Google Scholar]
- Tsao, H. , Pannek, K. , Boyd, R. N. , & Rose, S. E. (2013). Changes in the integrity of thalamocortical connections are associated with sensorimotor deficits in children with congenital hemiplegia. Brain Structure &Amp; Function, 220, 307–318. [DOI] [PubMed] [Google Scholar]
- Volpe, B. T. , Krebs, H. I. , & Hogan, N. (2001). Is robot‐aided sensorimotor training in stroke rehabilitation a realistic option? Current Opinion in Neurology, 14, 745–752. [DOI] [PubMed] [Google Scholar]
- Wakana, S. , Jiang, H. , Nagae‐Poetscher, L. M. , van Zijl, P. C. , & Mori, S. (2004). Fiber tract‐based atlas of human white matter anatomy. Radiology, 230, 77–87. [DOI] [PubMed] [Google Scholar]
- Ward, N. S. (2004). Functional reorganization of the cerebral motor system after stroke. Current Opinion in Neurology, 17, 725–730. [DOI] [PubMed] [Google Scholar]
- Wen, H. , Alshikho, M. J. , Wang, Y. , Luo, X. , Zafonte, R. , Herbert, M. R. , & Wang, Q. M. (2016). Correlation of fractional anisotropy with motor recovery in patients with stroke after postacute rehabilitation. Archives of Physical Medicine and Rehabilitation, 97, 1487–1495. [DOI] [PMC free article] [PubMed] [Google Scholar]
- Wetter, S. , Poole, J. L. , & Haaland, K. Y. (2005). Functional implications of ipsilesional motor deficits after unilateral stroke. Archives of Physical Medicine and Rehabilitation, 86, 776–781. [DOI] [PubMed] [Google Scholar]
- Wingert, J. R. , Burton, H. , Sinclair, R. J. , Brunstrom, J. E. , & Damiano, D. L. (2008). Tactile sensory abilities in cerebral palsy: Deficits in roughness and object discrimination. Developmental Medicine and Child Neurology, 50, 832–838. [DOI] [PMC free article] [PubMed] [Google Scholar]
- Yoshida, S. , Hayakawa, K. , Yamamoto, A. , Okano, S. , Kanda, T. , Yamori, Y. , … Hirota, H. (2010). Quantitative diffusion tensor tractography of the motor and sensory tract in children with cerebral palsy. Developmental Medicine and Child Neurology, 52, 935–940. [DOI] [PubMed] [Google Scholar]
- Zewdie, E. , Damji, O. , Ciechanski, P. , Seeger, T. , & Kirton, A. (2016). Contralesional corticomotor neurophysiology in hemiparetic children with perinatal stroke: Developmental plasticity and clinical function. Neurorehabilitation and Neural Repair, 31, 261–271. [DOI] [PubMed] [Google Scholar]