

Abstract
Benign epilepsy with centrotemporal spikes (BECTS) is characterized by abnormal (static) functional interactions among cortical and subcortical regions, regardless of the active or chronic epileptic state. However, human brain connectivity is dynamic and associated with ongoing rhythmic activity. The dynamic functional connectivity (dFC) of the distinct striato–cortical circuitry associated with or without interictal epileptiform discharges (IEDs) are poorly understood in BECTS. Herein, we captured the pattern of dFC using sliding window correlation of putamen subregions in the BECTS (without IEDs, n = 23; with IEDs, n = 20) and sex‐ and age‐matched healthy controls (HCs, n = 28) during rest. Furthermore, we quantified dFC variability using their standard deviation. Compared with HCs and patients without IEDs, patients with IEDs exhibited excessive variability in the dorsal striatal‐sensorimotor circuitry related to typical seizure semiology. By contrast, excessive stability (decreased dFC variability) was found in the ventral striatal–cognitive circuitry (p < .05, GRF corrected). In addition, correlation analysis revealed that the excessive variability in the dorsal striatal‐sensorimotor circuitry was related to highly frequent IEDs (p < .05, uncorrected). Our finding of excessive variability in the dorsal striatal‐sensorimotor circuitry could be an indication of increased sensitivity to regional fluctuations in the epileptogenic zone, while excessive stability in the ventral striatal–cognitive circuitry could represent compensatory mechanisms that prevent or postpone cognitive impairments in BECTS. Overall, the differentiated dynamics of the striato–cortical circuitry extend our understanding of interactions among epileptic activity, striato–cortical functional architecture, and neurocognitive processes in BECTS.
Keywords: BECTS, dynamic functional connectivity variability, IEDs, resting‐state fMRI, striato–cortical circuitry
1. INTRODUCTION
Benign epilepsy with centrotemporal spikes (BECTS) is an idiopathic focal epilepsy syndrome in children with facial sensorimotor symptoms (Kellaway, 2000; Panayiotopoulos, Michael, Sanders, Valeta, & Koutroumanidis, 2008). Although seizure prognosis is benign in children with BECTS, accumulating evidence suggest that BECTS can suffer from various cognitive comorbidities, particularly motor functions (Overvliet et al., 2011), language skills (Datta et al., 2013), and attentive processes (Kavros et al., 2008). Recent neuroimaging evidence that BECTS is characterized by dysfunctional cortical and subcortical circuitry, which is particularly prominent during the active epileptic state associated with interictal epileptiform discharges (IEDs) (Koelewijn et al., 2015; Li et al., 2017; Xiao et al., 2016). The role of IEDs is gaining prominence as a hypothetical mechanism by which seizures interfere with the normative organization of oscillatory brain networks and consequently result in cognitive deficits (Gotman et al., 2005; Ibrahim et al., 2014).
The abnormal oscillatory organization of functional networks in BECTS has been related to the pathogenesis of centrotemporal spikes. The neural source of centrotemporal spikes is generally located in the primary sensorimotor cortices. Using resting‐state functional and structural MRI measures, researchers have reported spike‐related blood‐oxygen‐level‐dependent (BOLD) (de)activation and gray matter volume abnormalities in syndrome‐specific regions (Kim et al., 2015; Koelewijn et al., 2015). Beyond the seizure onset zone, the propagation of epileptiform discharges through an underlying network can induce the secondary pathology of distal cortical regions as well as subcortical regions, contributing to neurodevelopmental and neurocognitive impairments (Garcia‐Ramos et al., 2015; Lin et al., 2012; Pardoe, Berg, Archer, Fulbright, & Jackson, 2013). Prior works focusing on the subcortical development of BECTS reported selective putamen hypertrophy among the basal ganglia structures (Garcia‐Ramos et al., 2015; Lin et al., 2012). In addition, a recent resting‐state fMRI study has shown decreased connections among the motor network and fronto‐striatal loop in BECTS (Luo et al., 2015). Aberrant functional interaction between the motor cortex and language areas was also demonstrated in children with rolandic epilepsy (Besseling et al., 2013). Taken together, these evidence highlight the role for striato–cortical circuitry and abnormal functional interactions among subcortical and cortical regions in BECTS.
Although the static functional connectivity of striatal seeds is widely used in previous studies (Gerardin et al., 2004; O'Doherty et al., 2004; Postuma and Dagher, 2006), it may not be sufficient to fully characterize the human brain activity. Human brain connectivity is dynamic and associated with ongoing rhythmic activity, rather than stationarity, over time (Calhoun, Miller, Pearlson, & Adali, 2014; Preti, Bolton, Van, & Ville, 2016). An emerging method is dynamic FC (dFC) (Hutchison et al., 2013), which can be investigated by measuring the variability in the strength or spatial dynamic organization of functional connectivity. Disruption of this intrinsic activity through pathologic processes, such as IEDs, may be a significant mechanism underlying cognitive dysfunction in epilepsy patients (Bai et al., 2010; Liao et al., 2014b). A recent study based on simultaneous electroencephalography (EEG) and fMRI dynamically captured the altered neurophysiologic synchrony across different discharge periods in children with BECTS, describing the effects of IEDs on cognitive functions (Xiao et al., 2016).
Given the growing evidence for selective putamen anomaly in BECTS (Lin et al., 2012), we selected three putamen subregions adopted from a previous meta‐analysis study (Postuma and Dagher, 2006) and conducted dFC analysis to investigate the IED‐related dFC variability of distinct striato–cortical circuitry. The dorsal putamen, which mainly receives projections from the sensorimotor cortices, is believed to play an important role in motor processing. Meanwhile, the ventral putamen–dorsolateral prefrontal circuitry is involved in executive function (Di Martino et al., 2008). Accordingly, we hypothesized that patients would exhibit differential functional alterations of striato–cortical circuitry that attributed to dorsal versus ventral putamen divisions, particularly in those patients with IEDs. Specifically, patients with IEDs would show excessive dFC variability between dorsal putamen seeds and seizure origin regions, and decreased dFC variability between the ventral putamen seeds and high‐level cognitive areas. Secondary Pearson's correlation analysis was performed to examine the potential relationship between the dFC variability alterations and the clinical characteristics and cognitive performance of patients.
2. METHODS
2.1. Subjects
This study recruited 45 children diagnosed with BECTS from the Second Affiliated Hospital of Zhejiang University School of Medicine, Hangzhou, China. These clinical data were derived from our previously reported studies (Ji et al., 2016; Li et al., 2017; Zhu et al., 2015). All human procedures were approved by the Local Medical Ethics Committee of the Center for Cognition and Brain Disorders of Hangzhou Normal University. All participants’ parents provided written informed assent and consent. The inclusion criteria for patients were as follows: (a) diagnosed with BECTS in accordance with the International League Against Epilepsy classification (Berg et al., 2010), (b) aged 6–13 years and attending regular schools, (c) with no other developmental disability, (4d) full‐scale intelligence quotient (IQ) above 70, and (e) no history of addiction or disease other than epilepsy. Specifically, all children with BECTS demonstrated the (a) presence of simple partial, often facial, and motor or tonic–clonic seizures during sleep and (b) spike waves in the centrotemporal regions visible on EEG. The exclusion criteria were (a) pathologic abnormality on conventional MRI, (b) falling asleep during scanning (assessed by self‐report and the loss of alpha wave on simultaneously recorded EEG data), and (c) head motion exceeding 3 mm in translation or 3° in rotation. A final total of 43 patients with BECTS, including 27 patients treated with antiepileptic drugs, were included in this study. A total of 28 sex‐ and age‐matched right‐handed healthy controls (HCs; 13 girls and 15 boys, mean age: 10.00 ± 2.31 years) were randomly recruited through local primary schools. The HCs did not have a history of neurologic or psychiatric disorders or gross abnormalities on brain MRI and were unrelated to the BECTS patients.
2.2. Simultaneous EEG data acquisition
All patients underwent one or two simultaneous EEG and fMRI scans to record IEDs within one week after they recorded sleep EEG. EEG data were continuously recorded with an MR‐compatible EEG recording system (Brain Products, Germany) during fMRI acquisition. The 32 Ag/AgCl electrodes were arranged in a 10/20 system, attached to the scalp with conductive cream and connected to a BrainAmp amplifier located outside the scanner room with sampling at 5000 Hz. The total recording time during simultaneous EEG and fMRI data acquisition was 480 s. The EEG data were processed offline to filter out MR artifacts and remove ballistocardiogram artifacts (Brain Vision Analyzer 2.0, Germany). The IEDs were recorded independently by two experienced electroencephalographers in accordance with both spatial distribution and morphology. Accordingly, we divided BECTS patients into IED and non‐IED subgroups on the basis of whether IEDs were detected during scanning. The IED subgroup is consisted of 20 patients and the non‐IED subgroup is consisted of 23 patients.
2.3. fMRI data acquisition
All subjects were scanned on a 3.0 T MRI scanner (GE Discovery 750, Milwaukee) at the Center for Cognition and Brain Disorders, Hangzhou Normal University. For the resting‐state scans, all subjects were instructed to simply rest with their eyes closed, not to focus their thoughts on anything in particular, and not to fall asleep during scanning. The acquisition parameters for functional imaging were as follows: repetition time/echo time = 2000 ms/30 ms, flip angle = 90°, field of view = 220 × 220 mm2, matrix = 64 × 64, 43 transverse slices with thickness = 3.2 mm, and no interslice gap. For each participant, 240 volumes were acquired, resulting in a total scan time of 480 s. High‐resolution 3D T1‐weighted anatomical images were also acquired in the sagittal orientation using a magnetization‐prepared rapid acquisition gradient‐echo sequence (repetition time/echo time = 8.06 ms/3.136 ms, flip angle = 8°, field of view = 220 × 220 mm2, matrix = 256 × 256, slice thickness = 1 mm, no interslice gap, and 176 slices).
2.4. Neuropsychological assessment
General intelligence (IQ)—including verbal IQ, performance IQ, and full‐scale IQ—was assessed using the Chinese version of the Wechsler Intelligence Scale for Children (WISCIII). All scores were standardized for age and sex.
2.5. Data preprocessing
Functional images were preprocessed using Data Processing Assistant for Resting‐State fMRI software (DPARSF, Advanced Edition, V3.2) (http://www.restfmri.net/forum/). The initial 10 volumes of each subject were discarded to ensure a steady‐state longitudinal magnetization. Subsequently, we performed slice timing and motion correction for the remaining 230 frames. We required that the transient movement during the scanning was no more than 3 mm of translation and 3° of rotation. Some recent studies have shown that FC analysis is sensitive to gross head motion effects (Power, Barnes, Snyder, Schlaggar, & Petersen, 2012; Van Dijk, Sabuncu, & Buckner, 2012). Hence, the mean frame‐wise displacement (FD) was calculated to further determine the comparability of head movement across groups. Individual 3D T1‐weighted anatomical images were coregistered with functional images. The 3D T1‐weighted images were segmented into gray matter, white matter, and cerebrospinal fluid (CSF). These functional images were then normalized to the Montreal Neurologic Institute (MNI) space. The normalized images were resliced at a resolution of 3 × 3× 3 mm3 and spatially smoothed with a 6 mm full‐width at half‐maximum. Nuisance signals (i.e., 24 head motion parameters, averaged signals from CSF, white matter, and global signal) were regressed out using multiple linear regression analysis. Finally, functional images with linear trend were removed by temporal bandpass filtering (0.01–0.08 Hz).
2.6. dFC variability analysis
Three previously validated putamen seeds were employed for each hemisphere (4 mm radius spheres) for dFC analysis. Putamen was divided into dorsal–caudal putamen (DCP), dorsal–rostral putamen (DRP), and ventral–rostral putamen (VRP). The coordinates of putamen seeds are provided in Supporting Information, Table S1. To identify the dFC variability of the striato–cortical circuitry, we used a sliding window dFC approach in the DynamicBC toolbox (Liao et al., 2014a). In the sliding window‐based dFC analysis, window length is an open area of research and an important parameter. A “rule of thumb” is that the minimum window length should be no less than 1/f min, because short time segments would introduce spurious fluctuations. In this relation, f min was the minimum frequency of the correlating time courses (Leonardi and Van De Ville, 2015). Here, sliding window length of 50 TR was selected to optimize the balance between capturing a rapidly shifting dynamic relationship (with shorter windows) and achieving reliable estimates of the correlations between regions (with longer windows). We also tried other window lengths (30 TR and 70 TR) and shifting step (1 TR) to further examine the possible effects on dFC results. The entire resting‐state fMRI scan for each subject was segmented into sliding windows of 50 TR (100 s) and shifted with a step size of 10 TR. This step resulted in 19 windows in total. In each sliding window, we computed the temporal correlation coefficient between the truncated time course of the putamen seeds and those of all the other voxels. Consequently, a set of sliding window correlation maps was created for each participant. A Fisher's r‐to‐z transformation was then applied to all the correlation maps to improve the normality of the correlation distribution (Liu et al., 2015). The variance of the time series of the correlation coefficient was computed by calculating the standard deviation of z values at each voxel to assess the dFC variability.
2.7. Statistical analysis
One‐sample t tests were performed for within‐group dFC variability patterns. The significance level was set at p < .05 (uncorrected), and an extent threshold of 5 contiguous voxels was applied. Furthermore, to examine the difference of dFC variability patterns among three groups, one‐way ANOVA analysis was performed on the standard deviation in z values at each voxel. Given that BECTS is thought to be part of a spectrum of neurodevelopmental disorders (Gobbi, Boni, & Filippini, 2006) and the age range of the current subjects was relatively large (aged 6–13), the age effects were corrected by including them as confounding covariates. Gaussian random field (GRF) theory was used for cluster‐level multiple comparisons correction (minimum z > 2.3; cluster significance: p < .05, corrected). The brain regions showing significant differences based on the results of one‐way ANOVA were defined as regions of interests (ROIs) for further post hoc analysis using the Bonferroni correction. The Bonferroni‐corrected significance level was p < .05 divided by the number of ROIs and the total number of comparisons.
2.8. Clinical correlation analysis
We then further explored the potential relationship between dFC variability and disease characteristics and neuropsychological scores in BECTS. Secondary Pearson's correlation analyses between the dFC variability and clinical characteristics (disease duration, age at onset, and number of IEDs), and with the former and neuropsychological parameters (verbal IQ, performance IQ, and full‐scale IQ) were conducted within the BECTS patients. The statistical significance level for the correlation analysis was set at p < .05 (uncorrected).
3. RESULTS
3.1. Demographics and neuropsychological results
No subject's head motion exceeded 3 mm of translation or 3° of rotation. The largest mean FD of all the subjects was less than 0.3 mm. All IED patients presented centrotemporal spikes on their EEGs during the time of EEG–fMRI recording (mean number of spikes = 91.05 ± 88.16). No significant difference was found in age, sex ratio, FD, or IQ (verbal, performance, and full‐scale) among the three groups. A summary listing of demographic and clinical characteristics of all participants is given in Table 1. The antiepileptic drug information for patients under treatment is provided in Supporting Information, Table S2.
Table 1.
Demographic and clinical information of subjects
| IED (n = 20) | Non‐IED (n = 23) | HCs (n = 28) | p value | |
|---|---|---|---|---|
| Age (years) | 9.00 ± 1.95 | 10.22 ± 2.13 | 10.00 ± 2.31 | 0.63a |
| Sex (female: male) | 13:7 | 11:12 | 13:15 | 0.40b |
| Onset age (years) | 6.95 ± 1.85 | 7.48 ± 2.43 | ‐ | 0.43c |
| Duration (months) | 23.28 ± 31.90 | 34.27 ± 35.92 | ‐ | 0.32d |
| Side of EEG (L:R:Bil) | 6:13:1 | 10:11:2 | ‐ | 0.52e |
| Number of seizures (/year) | 2.27 ± 2.13 | 6.12 ± 11.75 | ‐ | 0.42d |
| Treatment:Naive | 10:10 | 17:6 | ‐ | 0.11e |
| Medication (LEV:VAL:LTG:OXC) | 2:2:2:5 | 6:4:4:3 | ‐ | 0.45e |
| IQ | ||||
| Full‐scale IQs | 111.80 ± 11.52 | 107.40 ± 14.85 | 113.80 ± 14.59 | 0.31a |
| Verbal IQ | 107.50 ± 14.05 | 105.00 ± 16.54 | 114.50 ± 15.84 | 0.13a |
| Performance IQ | 113.90 ± 13.38 | 108.70 ± 16.51 | 109.50 ± 14.36 | 0.52a |
| mean FD (mm) | 0.08 ± 0.06 | 0.06 ± 0.03 | 0.09 ± 0.06 | 0.15a |
Note. L = left; R = right; Bil = bilateral; LEV = levetiracetam; VAL = sodium valproate; LTG = lamotrigine; OXC = oxcarbazepine; FD = frame‐wise displacement. All values are mean ± standard deviation.
One‐way analysis of variance (ANOVA).
Kruskal–Wallis ANOVA.
Two‐sample t test.
Mann–Whitney U test.
Chi‐square test.
3.2. dFC variability results
The dFC variability patterns for each seed are shown in Figure 1 (one‐sample t tests, p < .05 uncorrected for visual inspection). Consistent with previous static FC studies (Di Martino et al., 2011, 2008), seed‐based FC analyses revealed distinct connectivity patterns of each of the three putamen seeds per hemisphere (Supporting Information, Figure S1). Figures 2 and 3 illustrate the significant dFC variability differences among the three groups for the dorsal and the ventral putamen seeds, respectively (minimum z > 2.3; cluster significance: p < .05, GRF corrected). For dorsal rostral and caudal putamen seeds, we observed significant group differences by one‐way ANOVA analysis in the bilateral superior occipital gyrus, right rolandic operculum (ROL), bilateral precentral gyrus (PrG), left middle occipital gyrus (MOG), and left supramarginal gyrus (SMG), (Figure 2). For ventral rostral putamen seeds, the significant differences were seen in the bilateral cerebellum posterior lobe (CPL), left middle temporal gyrus (MTG), right medial prefrontal cortex (MPFC), and right insula/parahippocampus (Figure 3). Post hoc analyses were performed for the ROIs encompassing each of these regions (Figures 2 and 3; p < .05, Bonferroni correction). Compared with the HCs and non‐IED patients, the IED group exhibited significant excessive dFC variability among the dorsal putamen seeds, motor areas, and occipital cortex. Secondary correlation analyses showed that the hypervariability between the right dorsal rostral putamen and the left precentral gyrus was positively correlated with the number of IEDs (Figure 4; r = −.48, p = .0330, uncorrected). No significant correlation was found in the control group and non‐IED patients. It is interesting that we observed significant lower dFC variability between the dorsal rostral putamen and the SMG in the non‐IED group, comparing to the control group and IED patients. In contrast to the higher variability in the dorsal‐sensorimotor circuitry, the IED group showed decreased dFC variability between the ventral putamen seed and regions of the medial part of prefrontal cortex, CPL, and limbic insula/parahippocampus. No significant correlation between dFC variability and neuropsychological scores including verbal IQ, performance IQ, and full‐scale IQ was found in the secondary correlation analyses.
Figure 1.
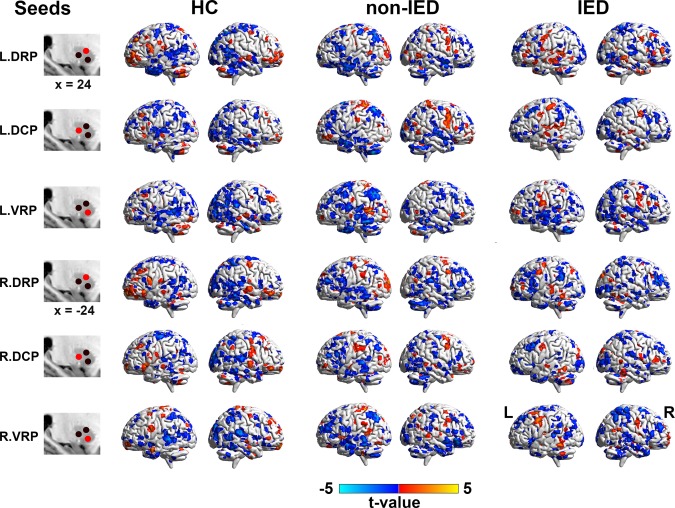
Dynamic functional connectivity patterns of putamen seeds in three groups (HCs, non‐IED, and IED). Dynamic functional connectivity expressed as normalized group variance for left and right hemisphere seeds are shown from top to bottom rows. For visual inspection, maps of each group were obtained by uncorrected one‐sample t tests with p < .05 and an extent threshold of 5 contiguous voxels. DRP = dorsal rostral putamen; DCP = dorsal caudal putamen; VRP = ventral rostral putamen; L = left; R = right [Color figure can be viewed at http://wileyonlinelibrary.com]
Figure 2.
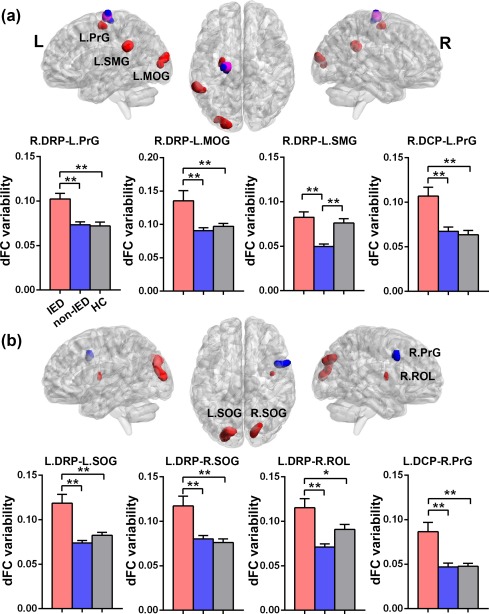
Group differences of dFC variability for bilateral dorsal putamen seeds among three groups (HCs, non‐IED, and IED). (a) Brain regions showing significant differences of dFC variability for right DRP (in red) and DCP (in blue) seeds. The pink region represents the overlap between the result from the right DRP and the right DCP seeds. One‐way analysis of variance revealed significant group differences in the left precentral gyrus (PrG), left middle occipital gyrus (MOG), and left supramarginal gyrus (SMG). (b) Brain regions showing significant differences of dFC variability for left DRP (in red) and DCP (in blue) seeds. Significant group differences were seen in the bilateral superior occipital gyrus (SOG), right rolandic operculum (ROL), and the right PrG. Gaussian random field theory was used for cluster‐level multiple comparisons correction (minimum z > 2.3; cluster significance: p < .05, GRF corrected). ROI‐wise post hoc analysis results are illustrated in the bar charts (*p < .05, uncorrected; **p < .05, Bonferroni correction). dFC = dynamic functional connectivity; DRP = dorsal rostral putamen; DCP = dorsal caudal putamen; L = left; R = right [Color figure can be viewed at http://wileyonlinelibrary.com]
Figure 3.
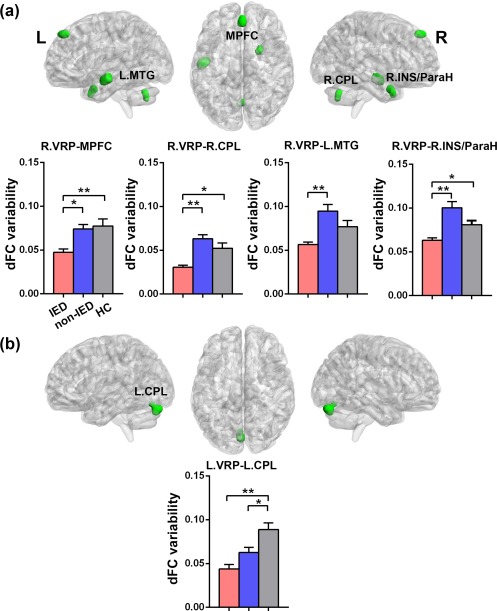
Group differences of dFC variability for bilateral ventral putamen seeds among three groups (HCs, non‐IED, and IED). (a) Brain regions showing significant differences of dFC variability for right VRP (in green) seed. One‐way analysis of variance revealed significant group differences in the right medial prefrontal cortex (MPFC), left middle temporal gyrus (MTG), right cerebellum posterior lobe (CPL), and right insula/parahippocampus (INS/ParaH). (b) Brain regions showing significant differences of dFC variability for left VRP (in green) seed. Significant group differences were seen in the left CPL. Gaussian random field theory was used for cluster‐level multiple comparisons correction (minimum z > 2.3; cluster significance: p < .05, GRF corrected). ROI‐wise post hoc analysis results are illustrated in the bar charts (*p < .05, uncorrected; **p < .05, Bonferroni correction). dFC = dynamic functional connectivity; VRP = ventral rostral putamen; L = left; R = right [Color figure can be viewed at http://wileyonlinelibrary.com]
Figure 4.
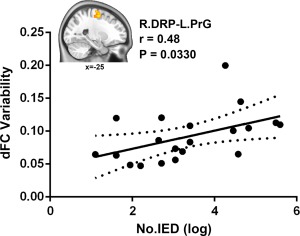
Correlation between dFC variability and the number of IEDs. The pattern of excessive dFC variability between the right dorsal rostral putamen and the left precentral gyrus was positively correlated with the number of IEDs in IED patients group (r = .48, p = .0330, uncorrected). The brain slice displays the sagittal view of the left precentral gyrus with significant group differences. dFC = dynamic functional connectivity; DRP = dorsal rostral putamen; PrG = precentral gyrus; L = left; R = right [Color figure can be viewed at http://wileyonlinelibrary.com]
3.3. Verification analyses
To validate the current findings, the significant group differences of dFC variability were reanalyzed with different conditions (window length, shifting step, medication, and IED lateralization) to confirm the reproducibility (see detailed information in Supporting Information). In these verification analyses, the group differences in dFC variability remained similar to the main findings. Compared with the control group and non‐IED patients, the IED group generally showed increased dFC variability between dorsal putamen seeds and sensorimotor areas. The IED group also presented decreased connectivity variability between ventral putamen seeds and cognitive regions (Supporting Information, Figures S2–S4).
4. DISCUSSION
Using a seed‐based dFC approach, the current study provides a unique investigation of the dynamics of striato–cortical circuitry associated with the presence of IEDs in BECTS. We observed dissociation in the dFC variability of striato–cortical interactions attributed to dorsal versus ventral putamen divisions. Importantly, these excessive variability and excessive stability patterns were found to be vulnerable to highly frequent IEDs. These differential functional alterations of striato–cortical circuitry in BECTS imply that the dorsal and ventral circuits distinctively contribute to dynamic network oscillatory interactions associated with IEDs.
Studies of human epilepsy have recognized the importance of the dynamic nature of spike‐related functional networks for brain dysfunction and cognitive comorbidities (Bai et al., 2010; Liao et al., 2014b; Liu et al., 2017; Xiao et al., 2016). The findings of fMRI studies have shown a complex transition of functional network topology, and dynamic changes of connectivity between the thalamus and the default mode network (DMN) in absence epilepsy and idiopathic generalized epilepsy (Bai et al., 2010; Gotman et al., 2005; Liao et al., 2014b). A more recent study combining EEG and fMRI demonstrated that interictal centrotemporal spikes might directly disrupt the functional brain networks responsible for language, behavior, and cognition in children with typical rolandic epilepsy (Xiao et al., 2016). The altered dFC variability of striato–cortical circuits in the IED patients support and extend previous proposals that epileptic activity dynamics cannot be viewed in isolation but should be perceived in the context of dynamic network interactions between cortical and subcortical structures.
Although the cortex is often emphasized as the site of seizure origin, emerging evidence points to a crucial role for subcortical structures in the propagation of epileptic seizures and behavioral manifestations through their interactions with cortical structures. Several seizure manifestations, such as focal onset involving limb dystonic posturing, have been attributed to the spread of discharges to the basal ganglia, mainly the sensorimotor part of putamen (Badawy, Lai, Vogrin, & Cook, 2013; Norden and Blumenfeld, 2002). The posterior putamen and the dorsolateral anterior putamen have been demonstrated to receive projections from motor and motor association cortex, which are implicated in various motor‐related functions (Choi, Yeo, & Buckner, 2012). Our recent study has shown epileptic discharge‐related FC abnormalities in the basal ganglia and sensorimotor networks in patients with BECTS (Li et al., 2017). In agreement with these findings, the present results of highly variable dorsal putamen‐to‐sensorimotor cortex connectivity fits well with the epileptiform discharge localization and seizure semiology in BECTS. The sensorimotor cortex is thought to be the source of epileptiform activity in BECTS, and the epileptic activity may spread to one or more functionally interconnected areas. The pattern of variable FC between the dorsal putamen and sensorimotor cortex in patients with IEDs could be an indication of increased sensitivity to regional fluctuations in the epileptogenic zone and unstable sensorimotor network connectivity. In support of this point, more frequent IEDs were associated with more variable connectivity between the right dorsal rostral putamen and left precentral gyrus in patients with IEDs. These findings suggest that the dynamic characteristics of interictal epileptic activity might lead to highly oscillatory dynamics in the dorsal striatal–sensorimotor circuitry.
In contrast to the excessive variability in the dorsal striatal–sensorimotor circuitry, decreased connectivity variability was observed between the ventral rostral putamen and brain regions involved in a diverse array of higher level cognitive functions. Functional studies of the human striatum have revealed that the rostral division of the putamen shows a greater connectivity with cognitive regions than that of the caudal division (Di Martino et al., 2008). Consistent with the functional distribution of the putamen, the present findings of invariable connectivity in the ventral rostral circuitry suggest that the dynamics of striato–cortical interactions in children with BECTS are more vulnerable to IEDs. Specifically, the decreased dFC variability between the ventral rostral putamen and the medial prefrontal cortex, middle temporal gyrus, and cerebellum is in line with previously reported disturbances in the DMN in epilepsy literature (Jiang et al., 2017; Li et al., 2016). The findings obtained from previous EEG and fMRI studies suggested that epileptic discharges might deactivate the default mode regions in both generalized (Blumenfeld et al., 2009) and focal epilepsy (Laufs et al., 2007). Cognitive deficits in patients with absence seizures (Liao et al., 2014b) and temporal lobe epilepsy are also linked with significant deactivations in the DMN during interictal discharges (Laufs et al., 2007). This confluence of evidence suggests that a “push–pull” mechanism (Danielson, Guo, & Blumenfeld, 2011) may participate in the suppression of DMN activity in these diverse seizure types. It is possible that, increased regional fluctuations in the epileptogenic zone by epileptic discharges may lead to decreased variability in the DMN through compensatory mechanisms yet to be determined. The DMN constitutes a favorable baseline neurometabolic environment for self‐related processes like mind wandering and retrieving autobiographical memories (Raichle et al., 2001; Spreng and Grady, 2010), which has been implicated in several types of epilepsy (Blumenfeld et al., 2009; Laufs et al., 2007). In this study, we demonstrated decreased dFC variability between the ventral rostral putamen and the regions belonging to the DMN in BECTS with IEDs, which we speculate may be associated with the disrupted self‐referential mental activity during epileptic transients in patients. More interestingly, the decreased connectivity variability between the right ventral rostral putamen and the right insula/parahippocampus was found in patients with IEDs. Previous epilepsy studies have suggested that the excitatory activity in epileptogenic zone is related to compensatory mechanisms of inhibitory effects in limbic network, especially in hippocampus and parahippocampal region (Bettus et al., 2009). It has also been demonstrated that spontaneous seizure activity is associated with sprouting and enhanced remodeling of inhibitory hippocampal circuits (Palop et al., 2007). We infer that this decreased dFC variability between ventral rostral putamen and insula/parahippocampus represents compensatory inhibitory mechanisms aiming at limiting network dysfunction in BECTS. Given that there was no significant behavioral difference between patients and controls, the pattern of invariable connectivity in the ventral striatal‐cognitive loop is possibly due to neural adaptation or compensation mechanism that may prevent or postpone functional impairment and cognitive decline in patients.
Another unexpected finding was significant decreased dFC variability between the dorsal rostral putamen and the supramarginal gyrus in non‐IED group. The supramarginal gyrus is part of the somatosensory association cortex, which has been implicated in language perception and processing (Celsis et al., 1999). Growing evidence suggests that BECTS is associated with cognition abnormalities, specifically language and language dependent skills (Datta et al., 2013). Given that there was no significant change in this area in IED group, the decreased dFC variability in non‐IED patients may be the result of chronic epileptogenic processes. We may speculate that these chronic variability changes in supramarginal gyrus are associated with lasting dysfunction of functional circuits mediating language development and function.
The present work is limited in several ways but lays the groundwork for additional important future studies. First, the antiepileptic medications taken by some patients may have confounded dFC variability findings and neurocognitive test results. Although we assess for the treatment effect on dFC variability in a relatively limited number of drug‐naïve patients, these findings require replication in a larger homogeneous, prospective investigation. Second, we have assessed the IED lateralization on the dFC variability by comparing the patients with right‐sided spikes and with left‐sided spikes. But the original spike foci may sometimes shift from one hemisphere to the homologous region of the other hemisphere in rolanidc epilepsy (Kellaway, 2000), the side of the diagnosed foci may not be considered absolute and definitive. Because we were interested here in investigating the dFC changes with the presence of transient IEDs during scanning, further longitudinal studies are required to assess the side of the spike on lateralized brain function changes. Third, it has been suggested that children with BECTS are usually associated with several cognitive comorbidities, particularly language dysfunction (Datta et al., 2013), IQ may not be the most sensitive measure of cognition. Thus, multidimensional cognitive tests are needed in the future studies to assess cognitive functions of BECTS patients. Finally, head motion exerts a confounding effect on the resting‐state FC. We conducted a series of procedures, such as applying motion‐related data exclusion criteria and including motion regressors in the models, even so, the head motion effect could not be completely eliminated.
5. CONCLUSIONS
In this study, we investigated the dynamics of striato–cortical circuitry associated with interictal epileptiform activity in children with BECTS. Our findings revealed distinct IED‐related functional alterations of striato–cortical interactions that attributed to dorsal versus ventral putamen divisions. Notably, excessive variability in dorsal striatal‐sensorimotor circuitry may be an indication of increased sensitivity to regional fluctuations in the epileptogenic zone. In contrast, excessive stability in the ventral striatal–frontal circuitry may represent compensatory mechanisms that may prevent or postpone cognitive impairments in patients. This dissociation of the dorsal and ventral striato–cortical circuitry distinctively contributes to altered functional dynamics associated with IEDs. The differentiated dynamic functional alterations of striato–cortical circuitry offer novel insights into the interactions among epileptic dynamics, striato–cortical functional architecture, and neurocognitive processes in BECTS.
CONTRIBUTORS
RL, WL, and HFC designed the study. YL took charge of patient identification and data acquisition. RL, YYY, HC, and XNG were responsible for data analysis and results summary. RL and WL drafted and revised the manuscript.
FUNDING
This work was supported by the 863 project (2015AA020505), the National Natural Science Foundation of China (61533006 and 81471653), the China Postdoctoral Science Foundation (2013M532229), the Science and Technology Planning Project of Zhejiang Province (2014C33189), and the “111” project (B12027).
CONFLICTS OF INTEREST
All authors disclosed no conflicts of interest.
Supporting information
Additional Supporting Information may be found online in the supporting information tab for this article.
Supporting Information
ACKNOWLEDGMENTS
The authors thank the patients and volunteers for participating in this study and also Zhong‐Jin Wang for initial patient identification and video/EEG review.
Li R, Liao W, Yu Y, et al. Differential patterns of dynamic functional connectivity variability of striato–cortical circuitry in children with benign epilepsy with centrotemporal spikes. Hum Brain Mapp. 2018;39:1207–1217. 10.1002/hbm.23910
Funding information The 863 project, Grant/Award Number: 2015AA020505; The National Natural Science Foundation of China, Grant/Award Numbers: 61533006, 81471653; The China Postdoctoral Science Foundation, Grant/Award Number: 2013M532229; The Science and Technology Planning Project of Zhejiang Province, Grant/Award Number: 2014C33189; The “111” project, Grant/Award Number: B12027
Contributor Information
Wei Liao, Email: weiliao.wl@gmail.com.
Ye‐Lei Tang, Email: tangyel@sina.cn.
Huafu Chen, Email: chenhf@uestc.edu.cn.
REFERENCES
- Badawy, R. A. , Lai, A. , Vogrin, S. J. , & Cook, M. J. (2013). Subcortical epilepsy? Neurology, 80, 1901–1907. [DOI] [PubMed] [Google Scholar]
- Bai, X. , Vestal, M. , Berman, R. , Negishi, M. , Spann, M. , Vega, C. , … Blumenfeld, H. (2010). Dynamic time course of typical childhood absence seizures: EEG, behavior, and functional magnetic resonance imaging. Journal of Neuroscience, 30, 5884–5893. [DOI] [PMC free article] [PubMed] [Google Scholar]
- Berg, A. T. , Berkovic, S. F. , Brodie, M. J. , Buchhalter, J. , Cross, J. H. , van Emde Boas, W. , … Scheffer, I. E. (2010). Revised terminology and concepts for organization of seizures and epilepsies: Report of the ILAE Commission on Classification and Terminology, 2005–2009. Epilepsia, 51, 676–685. [DOI] [PubMed] [Google Scholar]
- Besseling, R. M. , Jansen, J. F. , Overvliet, G. M. , van der Kruijs, S. J. , Vles, J. S. , Ebus, S. C. , … Backes, W. H. (2013). Reduced functional integration of the sensorimotor and language network in rolandic epilepsy. NeuroImage. Clinics, 2, 239–246. [DOI] [PMC free article] [PubMed] [Google Scholar]
- Bettus, G. , Guedj, E. , Joyeux, F. , Confort‐Gouny, S. , Soulier, E. , Laguitton, V. , … Guye, M. (2009). Decreased basal fMRI functional connectivity in epileptogenic networks and contralateral compensatory mechanisms. Human Brain Mapping, 30, 1580–1591. [DOI] [PMC free article] [PubMed] [Google Scholar]
- Blumenfeld, H. , Varghese, G. I. , Purcaro, M. J. , Motelow, J. E. , Enev, M. , McNally, K. A. , … Spencer, S. S. (2009). Cortical and subcortical networks in human secondarily generalized tonic‐clonic seizures. Brain, 132, 999–1012. [DOI] [PMC free article] [PubMed] [Google Scholar]
- Calhoun, V. D. , Miller, R. , Pearlson, G. , & Adali, T. (2014). The chronnectome: Time‐varying connectivity networks as the next frontier in fMRI data discovery. Neuron, 84, 262–274. [DOI] [PMC free article] [PubMed] [Google Scholar]
- Celsis, P. , Boulanouar, K. , Doyon, B. , Ranjeva, J. P. , Berry, I. , Nespoulous, J. L. , & Chollet, F. (1999). Differential fMRI responses in the left posterior superior temporal gyrus and left supramarginal gyrus to habituation and change detection in syllables and tones. NeuroImage, 9, 135–144. [DOI] [PubMed] [Google Scholar]
- Choi, E. Y. , Yeo, B. T. , & Buckner, R. L. (2012). The organization of the human striatum estimated by intrinsic functional connectivity. Journal of Neurophysiology, 108, 2242–2263. [DOI] [PMC free article] [PubMed] [Google Scholar]
- Danielson, N. B. , Guo, J. N. , & Blumenfeld, H. (2011). The default mode network and altered consciousness in epilepsy. Behavioural Neurology, 24, 55–65. [DOI] [PMC free article] [PubMed] [Google Scholar]
- Datta, A. N. , Oser, N. , Bauder, F. , Maier, O. , Martin, F. , Ramelli, G. P. , … Penner, I. K. (2013). Cognitive impairment and cortical reorganization in children with benign epilepsy with centrotemporal spikes. Epilepsia, 54, 487–494. [DOI] [PubMed] [Google Scholar]
- Di Martino, A. , Kelly, C. , Grzadzinski, R. , Zuo, X. N. , Mennes, M. , Mairena, M. A. , … Milham, M. P. (2011). Aberrant striatal functional connectivity in children with autism. Biological Psychiatry, 69, 847–856. [DOI] [PMC free article] [PubMed] [Google Scholar]
- Di Martino, A. , Scheres, A. , Margulies, D. S. , Kelly, A. M. , Uddin, L. Q. , Shehzad, Z. , … Milham, M. P. (2008). Functional connectivity of human striatum: A resting state FMRI study. Cerebral Cortex (New York, N.Y.: 1991), 18, 2735–2747. [DOI] [PubMed] [Google Scholar]
- Garcia‐Ramos, C. , Jackson, D. C. , Lin, J. J. , Dabbs, K. , Jones, J. E. , Hsu, D. A. , … Hermann, B. P. (2015). Cognition and brain development in children with benign epilepsy with centrotemporal spikes. Epilepsia, 56, 1615–1622. [DOI] [PMC free article] [PubMed] [Google Scholar]
- Gerardin, E. , Pochon, J. B. , Poline, J. B. , Tremblay, L. , Van de Moortele, P. F. , Levy, R. , … Lehericy, S. (2004). Distinct striatal regions support movement selection, preparation and execution. NeuroReport, 15, 2327–2331. [DOI] [PubMed] [Google Scholar]
- Gobbi, G. , Boni, A. , & Filippini, M. (2006). The spectrum of idiopathic Rolandic epilepsy syndromes and idiopathic occipital epilepsies: From the benign to the disabling. Epilepsia, 47 Suppl 2, 62–66. [DOI] [PubMed] [Google Scholar]
- Gotman, J. , Grova, C. , Bagshaw, A. , Kobayashi, E. , Aghakhani, Y. , & Dubeau, F. (2005). Generalized epileptic discharges show thalamocortical activation and suspension of the default state of the brain. Proceedings of the National Academy of Sciences of the United States of America, 102, 15236–15240. [DOI] [PMC free article] [PubMed] [Google Scholar]
- Hutchison, R. M. , Womelsdorf, T. , Allen, E. A. , Bandettini, P. A. , Calhoun, V. D. , Corbetta, M. , … Chang, C. (2013). Dynamic functional connectivity: Promise, issues, and interpretations. NeuroImage, 80, 360–378. [DOI] [PMC free article] [PubMed] [Google Scholar]
- Ibrahim, G. M. , Cassel, D. , Morgan, B. R. , Smith, M. L. , Otsubo, H. , Ochi, A. , … Doesburg, S. (2014). Resilience of developing brain networks to interictal epileptiform discharges is associated with cognitive outcome. Brain, 137, 2690–2702. [DOI] [PMC free article] [PubMed] [Google Scholar]
- Ji, G. J. , Yu, Y. , Miao, H. H. , Wang, Z. J. , Tang, Y. L. , & Liao, W. (2016). Decreased network efficiency in benign epilepsy with centrotemporal spikes. Radiology, 283, 186–194. [DOI] [PubMed] [Google Scholar]
- Jiang, S. , Luo, C. , Gong, J. , Peng, R. , Ma, S. , Tan, S. , … Yao, D. (2017). Aberrant thalamocortical connectivity in juvenile myoclonic epilepsy. International Journal of Neural Systems, 1750034. [DOI] [PubMed] [Google Scholar]
- Kavros, P. M. , Clarke, T. , Strug, L. J. , Halperin, J. M. , Dorta, N. J. , & Pal, D. K. (2008). Attention impairment in rolandic epilepsy: Systematic review. Epilepsia, 49, 1570–1580. [DOI] [PubMed] [Google Scholar]
- Kellaway, P. (2000). The electroencephalographic features of benign centrotemporal (rolandic) epilepsy of childhood. Epilepsia, 41, 1053–1056. [DOI] [PubMed] [Google Scholar]
- Kim, E. H. , Yum, M. S. , Shim, W. H. , Yoon, H. K. , Lee, Y. J. , & Ko, T. S. (2015). Structural abnormalities in benign childhood epilepsy with centrotemporal spikes (BCECTS). Seizure, 27, 40–46. [DOI] [PubMed] [Google Scholar]
- Koelewijn, L. , Hamandi, K. , Brindley, L. M. , Brookes, M. J. , Routley, B. C. , Muthukumaraswamy, S. D. , … Singh, K. D. (2015). Resting‐state oscillatory dynamics in sensorimotor cortex in benign epilepsy with centro‐temporal spikes and typical brain development. Human Brain Mapping, 36, 3935–3949. [DOI] [PMC free article] [PubMed] [Google Scholar]
- Laufs, H. , Hamandi, K. , Salek‐Haddadi, A. , Kleinschmidt, A. K. , Duncan, J. S. , & Lemieux, L. (2007). Temporal lobe interictal epileptic discharges affect cerebral activity in “default mode” brain regions. Human Brain Mapping, 28, 1023–1032. [DOI] [PMC free article] [PubMed] [Google Scholar]
- Leonardi, N. , & Van De Ville, D. (2015). On spurious and real fluctuations of dynamic functional connectivity during rest. NeuroImage, 104, 430–436. [DOI] [PubMed] [Google Scholar]
- Li, R. , Ji, G.‐J. , Yu, Y. , Ding, M.‐P. , Tang, Y.‐L. , Chen, H. , & Liao, W. (2017). Epileptic discharge related functional connectivity within and between networks in benign epilepsy with centrotemporal spikes. International Journal of Neural Systems, 1750018. [DOI] [PubMed] [Google Scholar]
- Li, R. , Liao, W. , Li, Y. , Yu, Y. , Zhang, Z. , Lu, G. , & Chen, H. (2016). Disrupted structural and functional rich club organization of the brain connectome in patients with generalized tonic‐clonic seizure. Human Brain Mapping, 37, 4487–4499. [DOI] [PMC free article] [PubMed] [Google Scholar]
- Liao, W. , Wu, G. R. , Xu, Q. , Ji, G. J. , Zhang, Z. , Zang, Y. F. , & Lu, G. (2014a). DynamicBC: A MATLAB toolbox for dynamic brain connectome analysis. Brain Connectivity, 4, 780–790. [DOI] [PMC free article] [PubMed] [Google Scholar]
- Liao, W. , Zhang, Z. , Mantini, D. , Xu, Q. , Ji, G. J. , Zhang, H. , … Lu, G. (2014b). Dynamical intrinsic functional architecture of the brain during absence seizures. Brain Structure and Function, 219, 2001–2015. [DOI] [PubMed] [Google Scholar]
- Lin, J. J. , Riley, J. D. , Hsu, D. A. , Stafstrom, C. E. , Dabbs, K. , Becker, T. , … Hermann, B. P. (2012). Striatal hypertrophy and its cognitive effects in new‐onset benign epilepsy with centrotemporal spikes. Epilepsia, 53, 677–685. [DOI] [PMC free article] [PubMed] [Google Scholar]
- Liu, F. , Wang, Y. , Li, M. , Wang, W. , Li, R. , Zhang, Z. , … Chen, H. (2017). Dynamic functional network connectivity in idiopathic generalized epilepsy with generalized tonic‐clonic seizure. Human Brain Mapping, 38, 957–973. [DOI] [PMC free article] [PubMed] [Google Scholar]
- Liu, F. , Xie, B. , Wang, Y. , Guo, W. , Fouche, J. P. , Long, Z. , … Qiu, M. (2015). Characterization of post‐traumatic stress disorder using resting‐state fMRI with a multi‐level parametric classification approach. Brain Topography, 28, 221–237. [DOI] [PubMed] [Google Scholar]
- Luo, C. , Zhang, Y. , Cao, W. , Huang, Y. , Yang, F. , Wang, J. , … Yao, D. (2015). Altered structural and functional feature of striato‐cortical circuit in benign epilepsy with centrotemporal spikes. International Journal of Neural Systems, 25, 1550027. [DOI] [PubMed] [Google Scholar]
- Norden, A. D. , & Blumenfeld, H. (2002). The role of subcortical structures in human epilepsy. Epilepsy &Amp; Behavior, 3, 219–231. [DOI] [PubMed] [Google Scholar]
- O'Doherty, J. , Dayan, P. , Schultz, J. , Deichmann, R. , Friston, K. , & Dolan, R. J. (2004). Dissociable roles of ventral and dorsal striatum in instrumental conditioning. Science, 304, 452–454. [DOI] [PubMed] [Google Scholar]
- Overvliet, G. M. , Aldenkamp, A. P. , Klinkenberg, S. , Nicolai, J. , Vles, J. S. H. , Besseling, R. M. H. , … Hendriksen, J. (2011). Correlation between language impairment and problems in motor development in children with rolandic epilepsy. Epilepsy & Behavior, 22, 527–531. [DOI] [PubMed] [Google Scholar]
- Palop, J. J. , Chin, J. , Roberson, E. D. , Wang, J. , Thwin, M. T. , Bien‐Ly, N. , … Mucke, L. (2007). Aberrant excitatory neuronal activity and compensatory remodeling of inhibitory hippocampal circuits in mouse models of Alzheimer's disease. Neuron, 55, 697–711. [DOI] [PMC free article] [PubMed] [Google Scholar]
- Panayiotopoulos, C. P. , Michael, M. , Sanders, S. , Valeta, T. , & Koutroumanidis, M. (2008). Benign childhood focal epilepsies: Assessment of established and newly recognized syndromes. Brain, 131, 2264–2286. [DOI] [PubMed] [Google Scholar]
- Pardoe, H. R. , Berg, A. T. , Archer, J. S. , Fulbright, R. K. , & Jackson, G. D. (2013). A neurodevelopmental basis for BECTS: Evidence from structural MRI. Epilepsy Research, 105, 133–139. [DOI] [PMC free article] [PubMed] [Google Scholar]
- Postuma, R. B. , & Dagher, A. (2006). Basal ganglia functional connectivity based on a meta‐analysis of 126 positron emission tomography and functional magnetic resonance imaging publications. Cerebral Cortex (New York, N.Y.: 1991), 16, 1508–1521. [DOI] [PubMed] [Google Scholar]
- Power, J. D. , Barnes, K. A. , Snyder, A. Z. , Schlaggar, B. L. , & Petersen, S. E. (2012). Spurious but systematic correlations in functional connectivity MRI networks arise from subject motion. NeuroImage, 59, 2142–2154. [DOI] [PMC free article] [PubMed] [Google Scholar]
- Preti, M. G. , Bolton, T. A. , Van, D. , & Ville, D. (2016). The dynamic functional connectome: State‐of‐the‐art and perspectives. NeuroImage. [DOI] [PubMed] [Google Scholar]
- Raichle, M. E. , MacLeod, A. M. , Snyder, A. Z. , Powers, W. J. , Gusnard, D. A. , & Shulman, G. L. (2001). A default mode of brain function. Proceedings of the National Academy of Sciences of the United States of America, 98, 676–682. [DOI] [PMC free article] [PubMed] [Google Scholar]
- Spreng, R. N. , & Grady, C. L. (2010). Patterns of brain activity supporting autobiographical memory, prospection, and theory of mind, and their relationship to the default mode network. Journal of Cognitive Neuroscience, 22, 1112–1123. [DOI] [PubMed] [Google Scholar]
- Van Dijk, K. R. , Sabuncu, M. R. , & Buckner, R. L. (2012). The influence of head motion on intrinsic functional connectivity MRI. NeuroImage, 59, 431–438. [DOI] [PMC free article] [PubMed] [Google Scholar]
- Xiao, F. , An, D. , Lei, D. , Li, L. , Chen, S. , Wu, X. , … Zhou, D. Real‐time effects of centrotemporal spikes on cognition in rolandic epilepsy: An EEG‐fMRI study. Neurology, 86, 544–551. [DOI] [PubMed] [Google Scholar]
- Zhu, Y. , Yu, Y. , Shinkareva, S. V. , Ji, G. J. , Wang, J. , Wang, Z. J. , … Tang, Y. L. (2015). Intrinsic brain activity as a diagnostic biomarker in children with benign epilepsy with centrotemporal spikes. Human Brain Mapping, 36, 3878–3889. [DOI] [PMC free article] [PubMed] [Google Scholar]
Associated Data
This section collects any data citations, data availability statements, or supplementary materials included in this article.
Supplementary Materials
Additional Supporting Information may be found online in the supporting information tab for this article.
Supporting Information