

Abstract
Deficient inhibition of return (IOR) for emotional materials is an important cognitive biomarker of depression. However, its neural mechanism and role in depression remission remain largely unknown. Using functional magnetic resonance imaging (fMRI), this study observed the neural foundation of inhibition of return in individuals with current (n = 30) and remitted (n = 27) depression and in healthy controls (n = 33), by using a cue‐target task. The results showed that individuals with remitted depression (RMD) possessed a nonavoidant attention model for sad faces, which indicated a cue validity and was correlated with enhanced task‐ and resting‐state activation and function connectivity in orbitofrontal cortex (OFC). The patients with major depressive disorder (MDD), in contrast, displayed an IOR effect for all faces, which indicated a strategy of attention avoidance due to the high cognitive burden in the cue‐target task, and was correlated with decreased resting‐state activation and function connectivity in OFC. Moreover, the hippocampus, a less‐known cortex in IOR, showed a contrary model, that is, lower activation in depression remission and higher task‐ and resting‐state activation in depressive episodes. The results suggest the OFC mechanism of the IOR effect in remitted depression and the hippocampus mechanism of the IOR effect in depressive episodes, which offer potential biomarkers for the clinical treatment of depression.
Keywords: depression, fMRI, inhibition of return, orbitofrontal cortex, remission
1. INTRODUCTION
Depression is one of the most commonly occurring mental disorders (Smith, 2014). It has been proposed that different factors contribute to a depressive episode, among which, the cognitive biases, particularly the attentional bias and memory bias for negative materials, play a unique role, in the occurrence or recurrence of depression (Beck, Steer, & Brown, 1996; Joormann & Tanovic, 2015). Being involved in attentional control, the prefrontal cortex (PFC) has been supposed to be important in the occurrence, maintenance, or remission of depression, which has been treated as a main target in antidepressant therapy (Ahdab, Ayache, Brugières, Goujon, & Lefaucheur, 2010; Fitzgerald et al., 2012; Korb, Hunter, Cook, & Leuchter, 2009). However, the PFC consists of different parts, and which part functions as an antidepressant is unclear. Simultaneously, attentional control comprises different components, but which component is critical to an antidepressant remains unknown. This knowledge is very important to optimize clinical depression therapy.
Inhibition of return (IOR), a phenomenon of delayed response to objects that appeared at a formerly attended location, is a critical component of attentional control. In the late 1980s, Posner discovered the IOR phenomenon in the classic cue‐target task (James & Mark, 2006). In a cue‐target task, a cue appears on the left or right side of the screen, which is followed by a target. Participants are required to respond to the location of the target. In the valid cue condition, the target appears at the same location with the cue, while in the invalid cue condition, the target appears at the opposite location of the cue. A cue validity represents that the reaction times for the valid cue condition are significantly quicker than those for the invalid cue condition, while an IOR effect represents that the response for the invalid cue condition is much quicker. The occurring time of IOR is about 200–300 ms after the onset of cue (James & Mark, 2006). IOR phenomenon shifts one's attention to new nonsearching locations, which promotes the efficiency of attention searching of a person; and is essential to the maintenance of normal cognitive processing and emotional control in people.
Currently, it has been assumed that emotional disorders such as depression have been correlating with deficient IOR ability for negative materials, which might be a critical mechanism for the occurrence or recurrence of depression (Haaker et al., 2015) . Indeed, Kellough found that depressed individuals spent significantly more time viewing dysphoric images and less time viewing positive images than their healthy counterparts (Kellough, Beevers, Ellis, & Wells, 2008). Lo reported that the depressed patients exhibited greater difficulty in switching their internal focus of attention in the affective task when compared to healthy controls, which suggested that depression was related to impaired internal attention shifting from affective material (Lo & Allen, 2011). One of our previous studies also confirmed that participants with major depressive disorder (MDD) had cue validity and deficient IOR for negative stimuli, which rendered them unable to eliminate the interference of negative stimuli and led to the maintenance and deterioration of depression (Dai & Feng, 2009). The results suggested an impaired IOR ability for negative stimuli in depression.
Quite a few studies have confirmed that the orbitofrontal cortex (OFC), a part of PFC, is correlated with the IOR phenomenon, which guides attention toward new places and starts new searching. That is to say, IOR is a function of the OFC (Barbas, Zikopoulos, & Timbie, 2011; Smith, Jackson, & Rorden, 2009). Indeed, early in 2002, Hodgson reported that the orbital part of the PFC mediates an inhibitory effect on actions directed towards previously attended locations, which plays a role in controlling natural search and foraging behavior (Hodgson et al., 2002). This has been confirmed by later event‐related potential studies (Tian & Yao, 2008). Functional magnetic resonance imaging (fMRI) further confirmed that the activation of the OFC was elevated when an IOR phenomenon occured (Nahum, Simon, Sander, Lazeyras, & Schnider, 2011). The results confirmed the role of OFC in the IOR phenomenon.
It was reported that the volume of OFC was reduced in individuals with depression, and the severity of depression was negatively correlated with the volume of OFC, which was confirmed in both younger and older patients (Lorenzetti, Allen, Fornito, & Yucel, 2009). The reduced grey matter volume and activation in the OFC was as high as 9% in depression (Bennett, 2011; Dichter, Felder, & Smoski, 2010). Furthermore, patients with depression showed decreased function connectivity between the OFC and dorsal anterior cingulate cortex, precuneus, cerebellum activity, and increased connectivity between the OFC and right dorsolateral prefrontal cortex (DLPFC), right inferior frontal operculum, and left motor areas (Frodl et al., 2010). The results suggested that the OFC played an important role in the etiology of major depression. However, the OFC mechanism of the IOR in depression remained unclear.
Recent fMRI results suggested that after the treatment of selective serotonin reuptake inhibitors (SSRIs), the theta current density of medial OFC was elevated in medication responders compared to medication nonresponders, which could be an effective biomarker in antidepressant treatment (Korb et al., 2009). Another research indicated that the repetitive transcranial magnetic stimulation (rTMS) over OFC could change the attentional allocation (Muggleton, Juan, Cowey, Walsh, & O'Breathnach, 2010) and speed the response for the invalid cue condition (Smith et al., 2009). The results suggested that antidepressants might be functional for improving the IOR ability of the OFC. However, the role of the IOR phenomenon and the OFC activation mechanism in the process of remission in depression was unclear.
In summary, this study had two aims. First, to observe the OFC mechanism in the IOR phenomenon in depression. Second, to test whether the IOR phenomenon and the OFC mechanism played a role in depression remission. Our hypotheses were (a) the activation of the OFC would be correlated with the IOR phenomenon in depression and (b) the IOR phenomenon and the OFC mechanism would play a role in remitted depression.
2. METHODS
2.1. Participants
To compare the IOR ability in different depressive states, we recruited patients with current depression, individuals with remitted depression (RMD), and never depressed healthy controls (NC). The healthy controls were recruited through advertisement, and the depressed individuals were obtained via clinical psychiatrists. The depressive symptoms were assessed by the Patient Health Questionnaire (PHQ‐9) (Kroenke, Spitzer, & Williams, 2001), the Beck Depression Inventory‐II (BDI‐II) (Beck et al., 1996), the Hamilton Depression Rating Scale (HDRS, 24 items) (Hamilton, 1960), and the Structured Clinical Interview for Diagnostic and Statistical Manual of Mental Disorders‐V (SCID) (APA., 2013). To observe the anxiety level of subjects, the Beck Anxiety Inventory‐II (BAI) was further investigated. The criteria for each group were as follows: patients with current depression should be diagnosed as MDD based on the criteria of the DSM‐V, having had two or more episodes (de Graaf et al., 2011; O'Reardon et al., 2007); the individuals of remitted depression should be remitted from the last episode for at least six months (average remission duration was 9.24 months) and free from antidepressants for at least 3 months; while the healthy controls should be exempted from current or lifetime depression or psychosis. Exclusion criterion: Infection, physical trauma, allergy within 2 weeks, bipolar disorder, schizophrenia, general anxiety disorder, severe physiological disease, learning disability, drug dependence, history of psychosis, and/or history of alcohol or drug abuse. Taking the risk of the functional magnetic resonance imaging (fMRI) scan into account, participants with the following conditions were also excluded: any metal or magnetic materials within the body, having a pacemaker or being pregnant, or having a history of neurosurgery or epilepsy. The detailed recruiting procedure was shown in Figure 1 and in our previous work (Dai & Feng, 2011). Thirty‐three healthy controls, 30 MDD patients, and 27 remitted individuals were obtained finally. All patients were medicated (10 were taking mirtazapine, 30–40 mg; 8 were taking fluoxetine hydrochloride, 20–40 mg; 12 were taking paroxetine hydrochloride, 20–30 mg).
Figure 1.
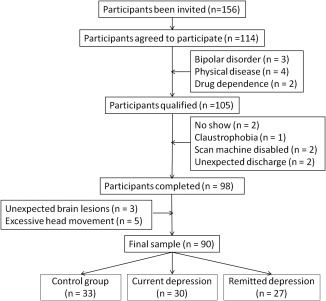
Flow chart of participant recruitment
2.2. Instrument
2.2.1. Cue‐target task (Figure 2)
Figure 2.
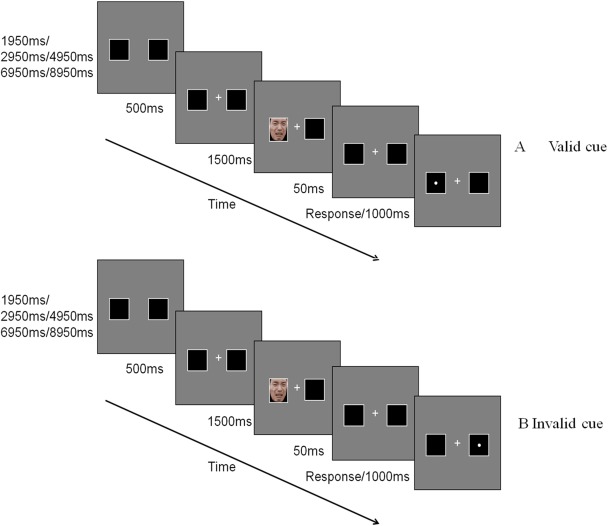
Cue‐target task (sad faces) [Color figure can be viewed at http://wileyonlinelibrary.com]
Participants had the fMRI done on the Siemens Trio Tim 3.0 T machine. E‐prime 2.0 was used to present the stimuli and collect the behavioral data. The trial was initiated by two squares on the left and right side of the screen without “+” for a pseudorandomized time duration (1,950 ms/2,950 ms/4,950 ms/6,950 ms/8,950 ms). After that, a central “+” and two squares were presented for 500 ms. Then an emotional face appeared at one of the squares for 1,500 ms. After a 50 ms interval, a mandatory pressing response was required for the target “•” which was visible at the same (valid condition) or opposite (invalid condition) location of the cue for 1,000 ms. The next trial was initiated after the 1,000 ms with or without a participant's response. The sequence of emotional faces was pseudorandomized. In this task, a cue validity represents that the reaction times for the valid cue condition are significantly quicker than those for the invalid cue condition, while an IOR effect represents that the response for an invalid cue condition is much quicker. The whole task consisted of four blocks, with 45 trials in each block. Half trials were valid‐cued, while another half were invalid‐cued. A 16 s black screen was allocated at the beginning and ending part of each block to eliminate any variation in the participants or scan machine.
2.2.2. Questionnaire
The BDI‐II and PHQ were used to assess depression level. Specifically, the BDI‐II reflected the severity of depression with 21‐items (Beck et al., 1996; Liu & Shu, 1999), while the PHQ mainly examined the frequency of depressive symptoms referring to the nine diagnostic criterion of MDD based on the DSM‐V (Xu, Wu, & Xu, 2007). The BAI was used to examine anxiety level, which comprised of 21 items too (Beck, Epstein, Brown, & Steer, 1988; Liu & Shu, 1999). The ruminative response scale (RRS) assessed the rumination level mainly from the frequency of ruminative response (Nolen‐Hoeksema, 2000; Nolen‐Hoeksema, Parker, & Larson, 1994; Spasojevic & Alloy, 2001), and contained 22‐items. Cronbach's α coefficient of the Chinese RRS was 0.93 (Dai et al., 2015).
2.3. Procedure
The research protocol was approved by the Human Research Ethics Committee of the Third Military Medical University. Patients were diagnosed and recruited by clinical psychiatrists based on HDRS and SCID. Candidate participants (healthy controls and patients) were interviewed via telephone by trained doctoral‐level psychological personnels based on SCID, and qualified subjects were dated from the telephone interview. After the subjects’ arrival, the participants were informed of the details of the experiment again, and they were informed of the voluntary nature of the study and their right to quit during the experiment. After written informed consents were signed, a 10‐min rest was set before the experiment to allow participants to familiarize themselves with the environment.
2.4. fMRI image acquisition
Functional images were acquired on a 3.0‐T Siemens TimTrio whole‐body MRI system (Siemens Medical Solutions, Erlangen, Germany) with a 12‐channel phased‐array head coil, located at Southwest Hospital, Chongqing, China. Image data were obtained using single shot T2‐weighted EPI (echo planar imaging, TR/TE = 2,000/30 ms, flip angle = 90°, reconstruction matrix = 64 × 64, field of view (FOV) = 384 mm, 4 mm slice thickness with 1 mm gap, voxel size = 3.0 mm × 3.0 mm × 3.0 mm, number of slices per volume = 36). The scan duration was 8 min for resting state (240 volumes), and 29 min and 12 s for task‐state (with 7 min and 18 s (219 volumes) for each block). The anatomical images were acquired through 3D‐T1MPRAGE protocol (inversion time (TI)/repetition time (TR)/echo time (TE) = 900/2,530/2.34 ms, flip angle = 7°, reconstruction matrix = 256 × 256, FOV = 256 mm, slice thickness = 1 mm, number of slices = 192).
2.5. fMRI data analyses
The neural activation data were analyzed through SPM8 (statistical parametric mapping, Wellcome Department of Cognitive Neurology, London, UK).
2.5.1. Preprocessing
Image data were preprocessed after removing the first 10 scan images through SPM8. The basic procedures were: (a) slice timing, (b) realign, (c) coregister, (d) segment, (e) normalize (by DARTEL, with resampling rate 3 mm × 3 mm × 3 mm (1 mm × 1 mm × 1 mm for anatomic data)); (f) smooth (size of kernel smoothing = 6 mm (full‐width at half‐maximum, FWHM)). During the preprocessing, the head motion, white matter, and cerebrospinal fluid were regressed out.
2.5.2. Task‐state data
Data matrix was designed based on the experimental design, which was estimated by general linear model. To observe the neural activation (whole brain) of IOR phenomenon, the activation differences (activation of invalid cue − activation of valid cue) during the pressing response of each subject were then extracted for 3 face type conditions: happy, neutral, and sad, which were resulted from t test (FWE correction, corrected p value < .05, voxel threshold = 10) between invalid and valid cue condition.
2.5.3. Resting‐state data
The amplitude of low‐frequency fluctuation (ALFF) of resting state was analyzed with REST 1.8 (Song et al., 2011). In brief, data after preprocessing were analyzed with linear regression to remove linear tendency. Then Hamming band‐pass filter was conducted to remain the low‐frequency signals between 0.01 and 0.08 Hz. ALFF value of whole‐brain voxel was calculated, which was used to divide the average ALFF, and resulted in a standard ALFF value (Zang et al., 2007).
Function connectivity was analyzed with REST 1.8 (Resting‐State fMRI Data Analysis Toolkit) (Song et al., 2011) based on an automated anatomical labeling (AAL) (Tzourio‐Mazoyer et al., 2002). The average timing sequences of regions of interest (ROI, bilateral medial, inferior, middle, and superior OFC, Ventral tegmental area, bilateral superior frontal gyrus, bilateral medial prefrontal gyrus (mPFC), bilateral anterior cingulate cortex (ACC), and bilateral hippocampus) in each subject were calculated, which were included in correlation analysis. These regions were previously reported involving in depressive episode (Beevers, Clasen, Stice, & Schnyer, 2010; De Raedt et al., 2010) and frequently activated in the cue‐target task of this study. The obtained correlation coefficients reflected the intensity of function connectivity between cortexes, which were analyzed through ANOVA to indicate the group differences.
2.5.4. Group analysis
For task image data, after individual analysis, the neural activation was analyzed with 3 (group) × 3 (face type) two‐way ANOVA. While a one‐way ANOVA was conducted for ALFF image data and function connectivity correlation coefficients. A further two‐sample t test was applied to compare each of two groups (AlphaSim correction, corrected p value < .01 (uncorrected p value < .001), voxel threshold >40, whole‐brain mask). Gender and age were included as co‐variables. The final image was overlaid on a ch2 bet.nii template, and figured with Rest Viewer (Song et al., 2011).
2.6. Statistics
The basic information of the subjects was analyzed through χ2 test and one‐way ANOVA. The reaction times (RTs) and the accuracy of the cue‐target task were analyzed through 3 (group: NC, MDD, and RMD) × 3 (face type: happy, neutral, and sad) × 2 (cue type: valid and invalid) three‐way repeated ANOVA. While the IOR scores were analyzed by 3 (group) × 3 (face type) two‐way repeated ANOVA (Shu, 2005). Follow‐up post‐hoc multiple comparisons were Turkey corrected (p < .05). A Pearson correlation was also conducted between ROI‐wise extracted activation difference in cortexes (invalid cue condition − valid cue condition) and IOR scores of behavioral results.
3. RESULTS
3.1. Group information (Table 1)
Table 1.
General information
| Gender (M/F) | Age | Education (years) | Episodes | Duration of illness (years) | FD value of head motion | PHQ | BDI | HDRS | BAI | |
|---|---|---|---|---|---|---|---|---|---|---|
| NC (n = 33) | 12/21 | 48.85 ± 12.86 | 13.00 ± 5.12 | 0.13 ± 0.06 | 1.09 ± 1.26 | 2.12 ± 1.62 | 1.76 ± 1.12 | 1.76 ± 3.24 | ||
| MDD (n = 30) | 7/23 | 48.77 ± 11.88 | 11.93 ± 2.86 | 3.1 ± 1.37 | 8.75 ± 6.94 | 0.11 ± 0.06 | 21.00 ± 5.80 | 35.86 ± 10.12 | 23.43 ± 2.94 | 11.89 ± 6.86 |
| RMD (n = 27) | 10/17 | 49.56 ± 10.77 | 12.19 ± 4.15 | 2.56 ± 1.39 | 9.76 ± 5.16 | 0.15 ± 0.12 | 5.41 ± 3.88 | 6.70 ± 4.51 | 5.11 ± 1.91 | 4.93 ± 5.02 |
| p | .442 | .963 | .573 | .199 | .578 | .127 | <.001 | <.001 | <.001 | <.001 |
Note. Abbreviations: M = male; F = female; BAI = Beck Anxiety Inventory; BDI = Beck Depression Inventory; PHQ = patient health questionnaire; HDRS = the Hamilton Depression Rating Scale; NC = never disordered healthy controls; MDD = major depressive disorder; RMD = remitted depression.
Three of the groups did not differ on the gender ratio (χ2 = 1.631, df = 2, N = 90, p = .442), age (F (2,87) = 0.037, p = 0.963, partial‐eta2 = 0.002), or year of education (F (2,87) = 0.56, p = .573, partial‐eta2 = 0.013). As expected, they differed on the scores of PHQ (F (2,87) = 210.829, p < .001, partial‐eta2 = 0.835), BDI (F (2,87) = 254.812, p < .001, partial‐eta2 = 0.845), BAI (F (2,87) = 29.674, p < .001, partial‐eta2 = 0.41), and HDRS (F (2,87) = 935.236, p < .001, partial‐eta2 = 0.95) between each of the two groups, with higher scores in the MDD group and lower scores in the NC group. The three groups did not differ in head motion (F (2,87) = 2.114, p = .127, partial‐eta2 = 0.10). The current and remitted depression groups did not differ in the number of episodes and duration of illness (p > .05).
3.2. IOR effects of the three groups in the cue‐target task
The ANOVA on the reaction times (RTs, Supporting Information, Table S1) of the cue‐target task for the three groups found a main effect of face type, F (2,174) = 5.278, p = .006, partial‐eta2 = 0.057, and cue type, F (1,87) = 4.739, p = .032, partial‐eta2 = 0.052, with slower response time for neutral faces and a faster response time for invalid cue condition and an expected three‐way interaction, group × cue type × face type, F (4,174) = 3.916, p = 0.023, partial‐eta2 = 0.034. No main or interaction effect was found on accuracy, F (4,174) = 0.775, p = 0.543, partial‐eta2 = 0.017.
The cue‐target task was used to observe the IOR phenomenon in this study. To further explain the three‐way interaction in raw RTs and to better observe the IOR ability for emotional faces between groups (Table 2), IOR scores (RTs of invalid − RTs of valid) were calculated, which was included in a further two‐way repeated ANOVA. In this following ANOVA, a main effect was confirmed of face type, F (2,174) = 3.253, p = .041, partial‐eta2 = 0.036, and group, F (2, 87) = 3.809, p = .026, partial‐eta2 = .081, with a bigger IOR effect for happy faces and a bigger cue validity in the RMD group, and an expected two‐way interaction, group × face type, F (4, 174) = 2.593, p = .038, partial‐eta2 = 0.056. Between‐group analysis (post‐hoc multiple comparisons, Turkey, p < .05) found that the RMD group had a greater cue validity for sad faces (F (2, 87) = 3.773, p = .027, partial‐eta2 = 0.008), while the MDD group had a greater IOR effect for neutral faces (F (2, 87) = 5.203, p = .007, partial‐eta2 = 0.011).
Table 2.
The IOR scores of three groups ( ±SD)
| Accuracy | RTs | |||||
|---|---|---|---|---|---|---|
| Happy | Neutral | Sad | Happy | Neutral | Sad | |
| NC | 0.00 ± 0.00 | −0.01 ± 0.01 | 0.00 ± 0.01 | −14.36 ± 30.02 | 4.24 ± 28.26 | −8.53 ± 26.54 |
| MDD | 0.00 ± 0.01 | −0.01 ± 0.04 | 0.00 ± 0.01 | −15.41 ± 38.63 | −17.57 ± 38.81 | −12.12 ± 45.58 |
| RMD | 0.00 ± 0.01 | 0.00 ± 0.01 | 0.00 ± 0.01 | −2.91 ± 23.89 | 3.23 ± 16.53 | 10.60 ± 23.19 |
| p | .935 | .422 | .802 | .262 | .007 | .027 |
Note. Abbreviations: IOR = inhibition of return; RTs = reaction times; NC = never disordered healthy controls; MDD = major depressive disorder; RMD = remitted depression.
3.3. Neural activation in three groups
3.3.1. Neural activation of IOR effects
Main effect
ANOVA was conducted on the neural activation during the pressing response of the cue‐target task, which indicated a main effect of group, in the bilateral superior OFC (k = 16, k = 11, p < .001), the bilateral middle OFC (k = 28, k = 18, p < .001), the right inferior OFC (k = 104, p < .001), the right superior frontal cortex (k = 337, p < .001), the left anterior cingulate cortex (ACC) (k = 51, p < .001), the ventral tegmental area (k = 210, p < .001), the right superior parietal lobule (k = 46, p < .001), the right superior temporal lobe (k = 298, p < .001), the left middle‐temporal lobe (k = 95, p < .001), and the right inferior‐occipital lobe (k = 44, p < .001). See Supporting Information, Table S2 for details.
Meanwhile, a t test was applied, which confirmed a main effect of the cue type, with higher activation in the invalid cue condition as compared to the valid cue condition in the left middle OFC (k = 34, p < .01), left inferior OFC (k = 40, p < .01), and left middle‐occipital lobe (k = 324, p < .01).
Between‐group comparison
As the behavioral results indicated an IOR difference in valence, with a significant between‐group difference in neutral and sad faces and a trend in happy faces, the analysis of neural activations would focus on the valence difference between groups. To observe the IOR effect of neural activation, the difference in activation was calculated (activation of invalid cue condition ‐ activation of valid cue condition). Although quite a few brain cortexes were identified in the task, the current study would like to focus on the previously reported emotion related cortexes (Beevers et al., 2010; De Raedt et al., 2010), such as the orbitofrontal cortex, the ACC, the hippocampus, the medial prefrontal gyrus (mPFC), and the superior frontal gyrus.
Total activation difference
The ANOVA on the activation differences indicated an interaction between group and cue‐type, in the bilateral hippocampus (k = 15, k = 14, p < .01). A further two‐sample t test (AlphaSim correction, corrected p value < .01) found that patients with current depression had a higher activation in the left hippocampus (k = 30, p < .01) as compared to healthy controls, and a higher activation in the bilateral medial OFC (k = 18, k = 29, p < .01), ACC (k = 26, p < .01) compared with the RMD group. See Supporting Information, Table S3 and Figure S1 for details.
Activation difference for sad faces
The ANOVA indicated an interaction between group and cue type for sad faces in the left hippocampus, k = 24, p < .01. A further two‐sample t test (AlphaSim correction, corrected p value < .01) found that the MDD group had a higher hippocampus activation for sad faces as compared to the NC group (Figure 3). See Supporting Information, Table S4 for details.
Figure 3.
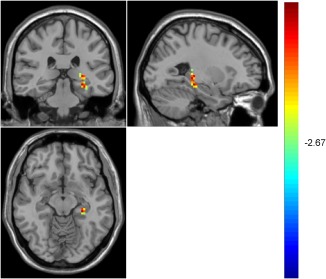
Higher hippocampus activation for sad faces in the MDD group compared with the NC group [Color figure can be viewed at http://wileyonlinelibrary.com]
Within‐group comparison
Total activation difference
Our analysis indicated a main effect of cue type in the MDD and RMD groups. A further two‐sample t test (AlphaSim correction, corrected p value < .01) found that patients with MDD had a higher activation for the invalid cue condition in the left inferior OFC (k = 90, p < .05), and the left hippocampus (k = 19, p < .01), as compared to the valid cue condition. The RMD group, in contrast, had lower activation for the invalid cue condition in the bilateral medial OFC (k = 53, p < .005, k = 13, p < .01), the left‐superior frontal gyrus (k = 40, p < .01), and the anterior cingulate lobe (k = 29, p < .01), as compared to the valid cue condition, and higher activation in the invalid cue condition in the left inferior OFC (k = 20, p < .01), the right medial frontal gyrus (k = 49, p < .01), and the right hippocampus (k = 19, p < .01), as compared to the valid cue condition. See Supporting Information, Table S5 and Figure S2 for details.
Happy faces (Table 3)
Table 3.
Activation difference for happy faces
| Cortexes | MNI | |||||
|---|---|---|---|---|---|---|
| RMD | L/R | Cluster (k) | t | x | y | z |
| Medial OFC | L | 30 | −3.09 | −3 | 48 | −6 |
| Medial OFC | R | 12 | −3.37 | 15 | 45 | −6 |
| Superior OFC | L | 19 | −3.70 | −18 | 51 | −9 |
| Middle OFC | L | 29 | −4.85 | −24 | 51 | −9 |
| Middle OFC | R | 21 | −3.83 | 33 | 54 | −6 |
| Inferior OFC | L | 16 | −3.87 | −30 | 33 | −9 |
| mPFC | L | 34 | −3.31 | −3 | 60 | 21 |
| Superior frontal gyrus | L | 236 | −5.98 | −15 | 51 | 21 |
| ACC | L | 29 | −2.99 | −9 | 24 | 30 |
| Hippocampus | R | 62 | −3.06 | 12 | −36 | 9 |
| Middle temporal lobe | L | 79 | −5.60 | −54 | −12 | −21 |
Note. Abbreviations: L = left; R = right; activation differences = activation of invalid cue condition − activation of valid cue condition.
For happy faces, only the RMD group indicated a main effect of cue type. A further two‐sample t test (AlphaSim correction, corrected p value < .01) found that this group had lower activation for the invalid cue condition in the bilateral medial OFC (k = 30, k = 12, p < .01), the left superior OFC (k = 19, p < .01), the bilateral middle OFC (k = 29, k = 21, p < .01), the left inferior OFC (k = 16, p < .01), the left medial frontal gyrus (k = 34, p < .01), the left superior frontal gyrus (k = 236, p < .01), ACC (k = 29, p < .01), and the right hippocampus (k = 62, p < .01), compared with the valid cue condition.
Neutral faces (Table 4 and Figure 4)
Table 4.
Activation difference for neutral faces
| Cortex | MNI | |||||
|---|---|---|---|---|---|---|
| NC | L/R | Cluster (k) | t | x | y | z |
| Superior OFC | R | 14 | −3.58 | 30 | 60 | −6 |
| Middle OFC | R | 32 | −4.05 | 33 | 60 | −9 |
| Hippocampus | R | 55 | −4.21 | 39 | −18 | −15 |
| Middle occipital lobe | R | 500 | −7.26 | 27 | −99 | 3 |
| RMD | x | y | z | |||
| Superior OFC | R | 20 | 2.93 | 16 | 32 | −24 |
| Inferior OFC | R | 33 | 5.17 | 60 | 15 | 0 |
| Superior frontal gyrus | R | 55 | 4.89 | 3 | 27 | 51 |
| Hippocampus | L | 24 | 6.01 | −27 | −33 | −3 |
| Hippocampus | R | 45 | 3.47 | 26 | −18 | −12 |
| Nucleus accumbens | R | 57 | 3.45 | 12 | 12 | −15 |
| Middle occipital lobe | L | 405 | 7.61 | −24 | −72 | −15 |
Figure 4.
Higher OFC and hippocampus activation for invalid cue condition of neutral faces in the RMD group [Color figure can be viewed at http://wileyonlinelibrary.com]
For neutral faces, both the NC and the RMD groups had a main effect of cue type. A further two‐sample t test (AlphaSim correction, corrected p value < .01) found that the NC group had lower activation for the invalid cue condition in the right superior OFC (k = 14, p < .01), the right middle OFC (k = 32, p < .01), and the right hippocampus (k = 55, p < .01), compared with valid cue condition. The RMD group, however, showed higher activation for the invalid cue condition in the right superior OFC (k = 20, p < .01), the right inferior OFC (k = 33, p < .01), the right superior frontal gyrus (k = 55, p < .01), and the bilateral hippocampus (k = 24, k = 45, p < .01), compared with the valid cue condition.
Sad faces (Table 5 and Figure 5)
Table 5.
Activation difference for sad faces
| Cortex | MNI | |||||
|---|---|---|---|---|---|---|
| MDD | L/R | Cluster (k) | t | x | y | z |
| Hippocampus | R | 26 | 3.43 | 24 | −14 | −16 |
| Middle occipital lobe | L | 95 | 4.84 | −27 | −63 | −6 |
| RMD | x | y | z | |||
| Middle OFC | L | 27 | 2.94 | −39 | 48 | −9 |
| Inferior OFC | L | 148 | 4.90 | −36 | 33 | −9 |
| mPFC | L | 41 | 5.00 | −12 | 15 | 48 |
| Superior frontal gyrus | L | 46 | 4.73 | −9 | 51 | 33 |
| Inferior temporal lobe | R | 56 | 7.20 | 45 | −18 | −24 |
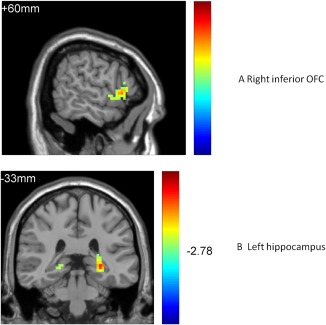
Figure 5.
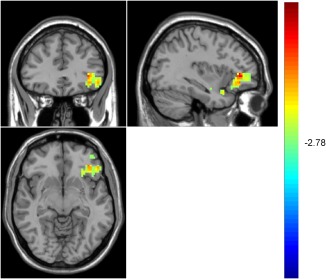
Higher OFC activation for invalid cue condition of sad faces in the RMD group [Color figure can be viewed at http://wileyonlinelibrary.com]
For sad faces, both the MDD and the RMD groups had a main effect of cue type. A further two‐sample t test (AlphaSim correction, corrected p value < .01) found that the MDD group showed higher activation for the invalid cue condition in the right hippocampus (k = 26, p < .01), compared with the valid cue condition. The RMD group, in contrast, showed a higher activation for the invalid cue condition in the right middle OFC (k = 27, p < .01), the right inferior OFC (k = 148, p < .01), the left medial frontal gyrus (k = 41, p < .01), and the left superior frontal gyrus (k = 46, p < .01), compared with the valid cue condition.
Correlation between neural activation and IOR scores of behavioral results
To observe the relationship between the behavioral IOR effect and neural response, a Pearson correlation was conducted between the IOR scores of behavioral results and the ROI‐wise extracted activation differences in cortexes (invalid cue condition − valid cue condition). In the NC group, there was a positive correlation between the IOR scores of sad faces and the activation difference in the right hippocampus (r = .357, p < .05) and the left hippocampus (r = .361, p < .05). In the MDD group, there was a negative correlation between the IOR scores of neutral faces and the activation difference in the right medial OFC (r = −.408, p < .05), the left medial OFC (r = −.459, p < .05), the right superior OFC (r = −.562, p < .01), the left superior OFC (r = −.415, p < .05), and the left medial PFC (r = −.448, p < .05). In the RMD group, there was a positive correlation between the IOR scores of neutral faces and the activation difference in the left medial OFC (r = .52, p < .01), as well as between the IOR scores of sad faces and the activation difference in the left inferior OFC (r = .53, p < .01). A negative correlation also existed in the RMD group between the IOR effects of sad faces and the activation difference in the left hippocampus (r = −.44, p < .01), and the left superior cortex (r = −.39, p < .01). These results indicated that a bigger IOR ability was correlated with a stronger activation difference in the hippocampus of the NC group, but with a smaller activation difference of the OFC in the MDD group, which suggests that more hippocampus resources were required for the IOR phenomenon to occur in the NC group, but less OFC activation in the MDD group. The RMD group, however, showed a smaller activation difference for bigger IOR in the hippocampus and superior frontal cortex, but a stronger activation difference for a bigger IOR in the OFC, which suggests a difference compared with other two groups, that is, less involvement of the hippocampus and more activation of the OFC in the IOR phenomenon of the RMD group. See Supporting Information, Table S6 for details.
3.3.2. Resting‐state activity and function connectivity of the cortexes activated in the IOR phenomenon
Amplitude of low‐frequency fluctuation (ALFF) (Table 6)
Table 6.
ALFF in three groups
| Cortex | MNI | |||||
|---|---|---|---|---|---|---|
| Three groups | L/R | Cluster (k) | F | x | y | z |
| Superior OFC | L | 18 | 4.48 | −30 | 60 | −3 |
| Middle OFC | L | 33 | 18.84 | −24 | 54 | −15 |
| ACC | R | 13 | 7.04 | 9 | 21 | −9 |
| Hippocampus | L | 37 | 8.86 | −21 | −42 | −12 |
| Superior temporal lobe | R | 461 | 19.61 | 63 | −27 | 0 |
| Superior parietal lobe | R | 28 | 12.83 | 12 | −69 | 54 |
| Middle occipital lobe | R | 486 | 13.26 | 6 | −93 | 0 |
| MDD‐NC | t | x | y | z | ||
| Medial OFC | R | 35 | 3.72* | 9 | 42 | −3 |
| Middle occipital lobe | R | 73 | −4.58 | 18 | −87 | −12 |
| MDD‐RMD | t | x | y | z | ||
| Superior OFC | L | 33 | −3.07* | −9 | 60 | −15 |
| Middle OFC | L | 40 | −5.73 | −27 | 54 | −15 |
| Middle OFC | R | 20 | −3.21* | 33 | 51 | −12 |
| Inferior OFC | R | 108 | −3.30* | 42 | 42 | −15 |
| ACC | R | 17 | 3.09 | 9 | 21 | −6 |
| Hippocampus | L | 41 | 4.30 | −24 | −42 | −12 |
| Superior temporal lobe | R | 479 | 4.10 | 66 | −27 | −3 |
| Middle occipital lobe | R | 243 | 5.28 | 42 | −33 | 27 |
| RMD‐NC | t | x | y | z | ||
| Superior OFC | L | 21 | 3.01 | −9 | 57 | −15 |
| Middle OFC | L | 39 | 5.39 | −24 | 54 | −15 |
| Hippocampus | L | 34 | −3.20 | −24 | −54 | −9 |
| Superior parietal lobe | R | 26 | −4.68 | 12 | −69 | 54 |
| Superior temporal lobe | R | 298 | −4.83 | 60 | −24 | 0 |
| Middle occipital lobe | R | 205 | −5.56 | 66 | −12 | −3 |
Note. Abbreviations: L = left; R = right; NC = never disordered healthy controls; MDD = major depressive disorder; RMD = remitted depression.
*p < .05, others were p < .01.
An ANOVA was conducted on the ALFF data, which indicated a difference between the three groups in the left superior OFC (k = 18, p < .01), the left middle OFC (k = 33, p < .01), the ACC (k = 13, p < .01), and the left hippocampus (k = 37, p < .01). A further two‐sample t test (AlphaSim correction, corrected p value < .01) showed that the MDD group had a higher activation in the right medial OFC (k = 35, p < .05) compared with the NC group, and lower activity in the left superior OFC (k = 33, p < .05), the bilateral middle OFC (k = 40, k = 20, p < .01), the right inferior OFC (k = 108, p < .05), along with higher activity in the ACC (k = 17, p < .01) and the left hippocampus (k = 41, p < .01), compared with RMD group. The RMD group, however, had higher activity in the left superior OFC (k = 21, p < .01), the left middle OFC (k = 39, p < .01), and lower activity in left hippocampus (k = 34, p < .01), compared with NC group. See Supporting Information, Figure S3 for details.
Resting‐state function connectivity (Table 7 and Figure 6)
Table 7.
Function connectivity in three groups (F value)
| OFCMid | OFCSup | VTA | ACC | Hippo | SFC | mPFC | |||||
|---|---|---|---|---|---|---|---|---|---|---|---|
| L | R | R | L | R | L | R | L | R | L | ||
| OFCMed‐R | 6.77**③ | 3.96*① | |||||||||
| OFCMed‐L | 5.10**④ | 6.98**③ | 4.46*① | 4.36*⑥ | 4.28*⑦ | 5.44**⑦ | |||||
| OFCInf‐R | 4.58*⑦ | 3.15*③ | 3.14*⑥ | ||||||||
| OFCInf‐L | 4.83*① | 3.71*⑦ | 3.17*⑥ | 3.39*⑦ | |||||||
| OFCMid‐R | 8.82**④ | 3.56*⑦ | |||||||||
| OFCMid‐L | 5.58**④ | 9.10**④ | 4.28*⑦ | 4.89*⑦ | 5.83**④ | 6.25**④ | 4.55*④ | ||||
| OFCSup‐R | 6.97**⑤ | 5.43**④ | 3.39*① | ||||||||
| OFCSup‐L | 3.86*④ | 3.354*⑤ | 4.70*⑧ | ||||||||
| ACC‐R | 3.66*⑦ | ||||||||||
| Hippo‐R | 3.23*④ | 3.32*⑨ | |||||||||
| SFC‐L | 4.78*② | ||||||||||
Note. L = left; R = right; OFC = orbitofrontal cortex; Inf = inferior; Mid = middle; Sup = superior; Med = medial; SFC = superior frontal gyrus; mPFC = medial prefrontal gyrus; ACC = anterior cingulate cortex; Hippo = hippocampus.
*p < .05; **p < .01; ①RMD < NC, MDD; ②RMD < NC; ③RMD < MDD; ④RMD > NC, MDD; ⑤RMD > NC; ⑥RMD > MDD; ⑦MDD < NC, RMD; ⑧MDD < NC; ⑨MDD > NC, RMD; underline = negative connectivity.
Figure 6.
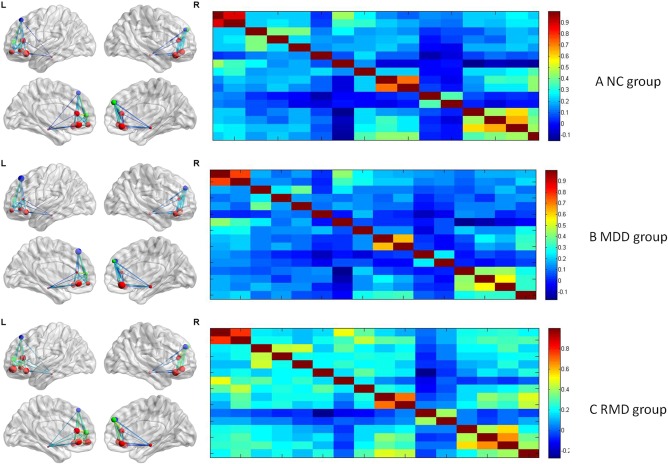
ROI‐based resting‐state function connectivity of the three groups [Color figure can be viewed at http://wileyonlinelibrary.com]
One‐way ANOVA (post‐hoc multiple comparisons, Turkey, p < .05) on the value of function connectivity between ROI based cortexes indicated that the RMD group showed lower connectivity between the right hippocampus and the right medial OFC (F (2,87) = 3.96, p < .05), and the left medial OFC (F (2,87) = 4.46, p < .05), between left inferior OFC and ventral tegmental area (F (2,87) = 4.83, p < .05), compared with the other two groups; lower connectivity between the left superior frontal gyrus and the left mPFC (F (2,87) = 4.78, p < .05) compared with the NC group; and lower connectivity between the right inferior OFC and the right hippocampus (F (2,87) = 3.15, p < .05), between ventral tegmental area and right medirial OFC (F (2,87) = 6.77, p < .01), and left medirial OFC (F (2,87) = 6.98, p < .01), compared with MDD group.
Meanwhile, the RMD group had a higher connectivity between the left medial OFC and the left middle OFC (F (2,87) = 5.10, p < .01); between the left middle OFC and the right superior OFC (F (2,87) = 5.58, p < .01), the right hippocampus (F (2,87) = 5.83, p < .01), the right medial PFC (F (2,87) = 6.25, p < .01), and the left medial PFC (F (2,87) = 4.55, p < .05); between the right superior OFC and the right hippocampus (F (2,87) = 5.43, p < .01); and between the right superior frontal gyrus and the right hippocampus (F (2,87) = 3.23, p < .05); between ventral tegmental area and left superior OFC (F (2,87) = 3.86, p < .05), right middle OFC (F (2,87) = 8.82, p < .01), left middle OFC (F (2,87) = 9.10, p < .01), compared with the other two groups. They also had a higher connectivity between the left superior OFC and the right hippocampus (F (2,87) = 3.354, p < .05), between right superior OFC and ventral tegmental area (F (2,87) < 6.97, p < .01), compared with the NC group. Furthermore, they showed a stronger connectivity between the right superior frontal gyrus and the left medial OFC (F (2,87) = 4.36, p < .05), the left inferior OFC (F (2,87) = 3.17, p < .05), and between the left superior frontal gyrus and the right inferior OFC (F (2,87) = 3.14, p < .05), compared with the MDD group.
The MDD group, in contrast, had a lower connectivity between the left superior frontal gyrus and the left medial OFC (F (2,87) = 4.28, p < .05), the left ACC (F (2,87) = 4.66, p < .05), between the right ACC and the left inferior OFC (F (2,87) = 3.71, p < .05), the right middle OFC (F (2,87) = 3.56, p < .05), and the left middle OFC (F (2,87) = 4.29, p < .05); between the left ACC and the left middle OFC (F (2,87) = 4.89, p < .05), between the right mPFC and the left inferior OFC (F (2,87) = 3.39, p < .05), the left medial OFC (F (2,87) = 5.44, p < .01), and the right ACC (F (2,87) = 3.66, p < .05); between the right inferior OFC and the left middle OFC (F (2,87) = 4.58, p < .05), compared with other two groups. They also had a lower connectivity between the left superior OFC and the right superior frontal gyrus (F (2,87) = 4.70, p < .05), compared with the NC group. Furthermore, the MDD group showed a stronger connectivity between the right mPFC and the right hippocampus (F (2,87) = 3.32, p < .05) compared with the other two groups. See Supporting Information, Tables S7 and S8 for details.
4. DISCUSSIONS
This study was among the first to observe whether IOR phenomenon and potential OFC mechanism played an important role in remitted depression. The behavioral results indicated an IOR effect for all faces in MDD patients and a cue validity for neutral and sad faces in the RMD individuals. The neural activation during the cue‐target task indicated that the hippocampus was more activated and the middle or superior part of the OFC was less activated in the perception of sad faces in the MDD group, while a higher activation in the middle or superior part of the OFC and less activation in the hippocampus were involved in the IOR effect of the RMD group, which was consistent with the resting‐state of ALFF activity. Resting‐state function connectivity indicated that the OFC played an important role in the depressive episodes and the remission of depression, and different parts of the OFC played different roles. Our results confirmed that the OFC mechanism of the IOR effect in the episodes and remission of depression, and the possible hippocampus mechanism of the IOR effect in depression, which might be potential targets in future antidepressant therapy.
In the behavioral cue‐target task, the MDD group displayed an IOR effect for all emotional faces, while the RMD group indicated a contrary model, that is, a cue validity for almost all emotional faces (especially the sad faces), which was contrary to our expectation. Further analysis found that in our fMRI cue‐target task, the intertribal interval (ITI) was very long, varying between 1,950 ms and 8,950 ms. During that time, although no “+” was present, the participants were required to look at the white squares on the screen, which increased their demand for attentional resources. This challenged the cognitive resources of patients with MDD, as their cognitive resources were limited for the outer world due to their inner depressive rumination (Koster, De Lissnyder, & De Raedt, 2013). Therefore, they chose to avoid the perception for emotional materials in the cue‐target task to reduce their cognitive burden, which resulted in an IOR effect for all faces (lower middle and superior OFC activation for IOR phenomenon was another evidence of attentional avoidance in the MDD group). However, the RMD individuals were clinically improved in depressive symptoms, this enabled them to withstand the cognitive challenge, resulting in a cue validity for neutral and sad materials (especially the sad faces). These results were supported by the previous literature, which confirmed that the cognitive burden influenced the attention perception for emotional materials (Takano, Iijima, Sakamoto, & Tanno, 2014). Interestingly, the NC group showed an IOR effect for happy and sad faces, which was very similar with MDD patients. However, they did not show an IOR effect for neutral faces, in which they differed from the MDD patients. The results suggest an effective inhibiting strategy of healthy controls in the process of emotional materials, which help them maintain an emotional balance.
During the cue‐target task, the neural activation was observed using fMRI in the current study, which found that the total activation differences (activation of invalid cue condition − activation of valid cue condition) between the three groups were as follows: MDD group > NC group ≈ RMD group. Specifically, the MDD group showed a higher activation difference for sad faces in the hippocampus, while the RMD group showed a lower activation difference for happy faces in the hippocampus, and a higher activation difference for neutral and sad faces in the OFC and other parts of the PFC. This suggests that the hippocampus is more involved in the perception of sad materials in the MDD group, which might be a potential neural mechanism of negative mood in depression (Lai, 2014). The higher activation in the OFC and less activation in the hippocampus in the IOR effect of the RMD group suggest that the remitted individuals might be able to keep emotional balance through more effort in the OFC and less involvement in the hippocampus (Heeren, Maurage, & Philippot, 2015).
Resting‐state activity showed a different cerebral model for the three groups. For the bilateral OFC, the activity model was RMD group > MDD group > NC group; while for the left hippocampus, the model was NC group > MDD group > RMD group, which suggest different activations between the OFC and the hippocampus in depression, and are consistent with previous results (Lai & Wu, 2015). The RMD group might achieve emotional balance by more attentional control of the OFC and less activation of the hippocampus, which are quite consistent with the results of task‐state neural activation in this study.
Function connectivity analysis found that the RMD group possessed a lower connectivity between the medial or inferior OFC and the hippocampus or ventral tegmental area, between the DLPFC and the mPFC, and higher connectivity within the subcortexes of the OFC, and between the middle or superior OFC and the mPFC, hippocampus. The MDD group, however, had a weaker connectivity within the subcortexes of the OFC, between the OFC and the mPFC, the superior frontal gyrus, the ACC, but had enhanced connectivity between the medial or inferior OFC and the superior frontal gyrus or ventral tegmental area, between the mPFC and the hippocampus. The results suggest a contrary model in the resting‐state function connectivity between the MDD and RMD groups. Decreased connectivity between the OFC and other cortexes in the MDD group might lead to reduced attentional control of the OFC (Frodl et al., 2010), and decreased connectivity within the subcortexes of OFC might cause the deficient rewarding system (Burke et al., 2014), while enhanced connectivity between the mPFC and the hippocampus might result in a stronger negative memory connection in depression (Frodl et al., 2010). For the RMD group, however, enhanced connectivity within the subcortexes of the OFC, between the medial or inferior OFC and the superior frontal gyrus, between the middle or superior OFC and the mPFC, the hippocampus, might lead to enhanced attentional control, executive control of the OFC, and increased rewarding function. While decreased connectivity between the medial‐inferior parts of the OFC and hippocampus or ventral tegmental area resulted in weaker negative memory connection or weaker negative regulation on reward in remitted depression, which led to a balance in emotional state. Our results suggest that the OFC plays an important role in the depressive episodes and in the remission of depression. This was supported by previous results, which confirmed the theta current density of the OFC could be used as a biomarker of SSRI treatment (Korb et al., 2009). Our results also suggest that different parts of the OFC play different roles in depression, with the middle or superior parts correlate with depression remission, while the medial or inferior parts more associate with depressive episodes (Cheng et al., 2016).
One significant point was that the hippocampus was identified in both task‐state and resting‐state in this study, which was correlated with learning memory (Xiao, Liu, Chen, & Zhang, 2016). The hippocampus was more involved in the depressive episodes and less activated in remitted depression in both the task‐state and resting‐state in this study, which indicated that the hippocampus played different roles in the IOR ability during depressive episode and depression remission. Further analysis indicated that the hippocampus activation in the cue‐target task was correlated with rumination, especially the brood component of rumination (see Supporting Information for details). Specifically, a positive correlation between the right hippocampus and brood scores of RRS (0.58**), and a negative correlation between the left hippocampus and depression scores of RRS (−0.628**) in the MDD group reflected differentiated function of the left and right hippocampus during depressive episodes (Joshi et al., 2015). The RMD group, however, possessed a negative correlation between the right hippocampus and brood scores of RRS (−0.496**), and between the left hippocampus and depression scores of depression (−0.524**), which suggest a potential compensation hippocampus mechanism in the remission of depression.
This study also confirmed a correlation between activation difference (activation of invalid cue condition − activation of valid cue condition) and IOR scores in the cue‐target task. A positive correlation between the activation difference of the hippocampus and the IOR scores of sad faces suggested that it took more hippocampus resources of the NC group to inhibit the perception of sad faces. In contrast, a negative correlation between the activation difference of the OFC, PFC, and IOR scores of neutral faces suggested that it took relatively less OFC effort for the MDD group to inhibit the perception of neutral materials. For the RMD group, however, a negative correlation between the activation difference of the PFC, hippocampus, and IOR scores of sad faces, and a positive correlation between the activation difference of the OFC and IOR scores of sad faces suggested that to inhibit the perception of sad faces, the hippocampus was less involved, while the OFC was more activated. The correlation results suggest that the OFC plays a unique role in the IOR phenomenon of depression, which is consistent with the results of task‐state and resting‐state activation.
Limitations
First of all, the sample size was relatively small, which limited the explanation power of the results. Second, although no significant difference of gender ratio was reported between the three groups, the MDD group included more females compared with the other two groups, which might lead to a potential deviation of the results. Third, the intelligence level or brain volume of participants was not assessed as it was common in the fMRI study (Liston et al., 2014), which might influence the fMRI data. Fourth, patients who were current depressed were medicated, which might influence their behavioral or neural responses. However, previous research indicated no significant influence of medication on behavioral or neural response was observed (Baert, De Raedt, Schacht, & Koster, 2010; Hernández‐Ribas et al., 2013). Finally, the remitted individuals in this study were not the same individuals recovered from the current depression, that is, this was a cross‐sectional instead of a longitudinal study. Thus, the OFC mechanism in the IOR phenomenon in the remission of depression was not causally confirmed by this study.
In conclusion, this study is among the first to confirm the OFC mechanism of the IOR phenomenon in remitted depression, which might suggest a potential target for future antidepressant therapy. The results that the OFC and hippocampus function differently during episodes of and the remission of depression provide an important hint for the clinical therapy of depression, that is, the OFC is involved more in the remission of depression and less in the depressive episodes, while the hippocampus activates more in the depressive episodes and less in the remission of depression. Therefore, the value of this study is to offer important evidence of the OFC mechanism of the IOR effect in remitted depression, and the hippocampus mechanism in the IOR effect in depressive episodes, which offer potential biomarkers for the clinical treatment of depression.
Supporting information
Additional Supporting Information may be found online in the supporting information tab for this article.
Supporting Information
ACKNOWLEDGMENTS
Doctor Dai claimed that this study was supported by Shenzhen basic research layout project (JCYJ20150729104249783), the Innovation Project of People's Liberation Army of China (17QNP008), and the Key Project of Chongqing education fund (162061). The authors thanked clinical doctors who devoted to patients recruitment, including Dr L. D. Hu from Geleshan Psychiatry Hospital, Dr X. Y. Zhou from Psychiatry center of Chongqing, and Dr Y. He from 324 Hospital of Chong Qing. They appreciated the endeavor of all graduate students who participated in this study as research assistants. They also thanked all subjects who took part in this study, especially the clinical patients.
Dai Q, Yin X, Li H, Feng Z. Orbito‐frontal cortex mechanism of inhibition of return in current and remitted depression. Hum Brain Mapp. 2018;39:2941–2954. 10.1002/hbm.24051
Funding information Shenzhen basic research layout project, Grant/Award Number: JCYJ20150729104249783; Innovation Project of People's Liberation Army of China, Grant/Award Number: 17QNP008; Key Project of Chongqing Education Fund, Grant/Award Number: 162061
REFERENCES
- Ahdab, R. , Ayache, S. S. , Brugières, P. , Goujon, C. , & Lefaucheur, J. P. (2010). Comparison of “standard” and “navigated” procedures of TMS coil positioning over motor, premotor and prefrontal targets in patients with chronic pain and depression. Clinical Neurophysiology, 40(1), 27–36. [DOI] [PubMed] [Google Scholar]
- APA. (2013). Diagnostic and statistical manual of mental disorders (5th ed.). Arlington, VA: American Psychiatric Publishing. [Google Scholar]
- Baert, S. , De Raedt, R. , Schacht, R. , & Koster, E. H. W. (2010). Attentional bias training in depression, therapeutic effects depend on depression severity. Journal of Behavior Therapy and Experimental Psychiatry, 41, 265–274. [DOI] [PubMed] [Google Scholar]
- Barbas, H. , & Zikopoulos, B. , & Timbie, C. (2011). Sensory pathways and emotional context for action in primate prefrontal cortex. Biological Psychiatry, 69(12), 1133–1139. [DOI] [PubMed] [Google Scholar]
- Beck, A. T. , Epstein, N. , Brown, G. , & Steer, R. A. (1988). An inventory for measuring clinical anxiety: Psychometric properties. Journal of Consultant and Clinical Psychology, 56, 893–897. [DOI] [PubMed] [Google Scholar]
- Beck, A. T. , Steer, R. A. , & Brown, G. K. (1996). Manual for the Beck depression inventory. San Antonio, TX: The Psychological Association. [Google Scholar]
- Beevers, C. G. , Clasen, P. , Stice, E. , & Schnyer, D. (2010). Depression symptoms and cognitive control of emotion cues: A functional magnetic resonance imaging study. Neuroscience and Biobehavioral Reviews, 167(1), 97–103. [DOI] [PMC free article] [PubMed] [Google Scholar]
- Bennett, M. R. (2011). The prefrontal‐limbic network in depression: A core pathology of synapse regression. Progress in Neurobiology, 93(4), 457–467. [DOI] [PubMed] [Google Scholar]
- Burke, S. N. , Thome, A. , Plange, K. , Engle, J. R. , Trouard, T. P. , Gothard, K. M. , & Barnes, C. A. (2014). Orbitofrontal cortex volume in area 11/13 predicts reward devaluation, but not reversal learning performance, in young and aged monkeys. Journal of Neuroscience, 34(30), 9905–9916. [DOI] [PMC free article] [PubMed] [Google Scholar]
- Cheng, W. , Rolls, E. T. , Qiu, J. , Liu, W. , Tang, Y. , Huang, C. C. , … Feng, J. (2016). Medial reward and lateral non‐reward orbitofrontal cortex circuits change in opposite directions indepression. Brain and Cognition, 139(Pt 12), 3296–3309. [DOI] [PubMed] [Google Scholar]
- Dai, Q. , & Feng, Z. Z. (2009). Deficient inhibition of return for emotional faces in depression. Progress in Neuro‐Psychopharmacology & Biological Psychiatry, 33, 921–932. [DOI] [PubMed] [Google Scholar]
- Dai, Q. , & Feng, Z. Z. (2011). Deficient Interference Inhibition for Negative Stimuli in depression: An event‐related potential study. Clinical Neurophysiology, 122, 52–61. [DOI] [PubMed] [Google Scholar]
- Dai, Q. , Xu, S. , Xie, J. R. , Liu, K. Y. , Yu, Y. J. , Wang, X. X. , … Feng, Z. Z. (2015). The reliability and validity analysis of the Chinese version ruminative response scale (RRS) in undergraduates (Chinese). Chinese Journal of Health Psychology, 23(5), 753–758. [Google Scholar]
- de Graaf, L. E. , Gerhards, S. A. H. , Arntz, A. , Riper, H. , Metsemakers, J. F. M. , Evers, S. M. A. A. , … Huibers, M. J. H. (2011). One‐year follow‐up results of unsupported online computerized cognitive behavioural therapy for depression in primary care: A randomized trial. Journal of Behavior Therapy and Experimental Psychiatry, 42(1), 89–95. [DOI] [PubMed] [Google Scholar]
- De Raedt, R. , Leyman, L. , Baeken, C. , Van Schuerbeek, P. , Luypaert, R. , Vanderhasselt, M. A. , & Dannlowski, U. (2010). Neurocognitive effects of HF‐rTMS over the dorsolateral prefrontal cortex on the attentional processing of emotional information in healthy women: An event‐related fMRI study. Biological Psychiatry, 85(3), 487–495. [DOI] [PubMed] [Google Scholar]
- Dichter, G. S. , Felder, J. N. , & Smoski, M. J. (2010). The effects of brief behavioral activation therapy for depression on cognitive control in affective contexts: An fMRI investigation. Journal of Affective Disorders, 126(1–2), 236–244. [DOI] [PMC free article] [PubMed] [Google Scholar]
- Fitzgerald, P. B. , Hoy, K. E. , Herring, S. E. , McQueen, S. , Peachey, A. V. J. , Segrave, R. A. , … Daskalakis, Z. J. (2012). A double blind randomized trial of unilateral left and bilateral prefrontal cortex transcranial magnetic stimulation in treatment resistant major depression. Journal of Affective Disorders, 139(2), 193–198. [DOI] [PubMed] [Google Scholar]
- Frodl, T. , Bokde, A. L. W. , Scheuerecker, J. , Lisiecka, D. , Schoepf, V. , Hampel, H. , … Meisenzahl, E. (2010). Functional connectivity bias of the orbitofrontal cortex in drug‐free patients with major depression. Biological Psychiatry, 67(2), 161–167. [DOI] [PubMed] [Google Scholar]
- Haaker, J. , Lonsdorf, T. B. , Schümann, D. , Menz, M. , Brassen, S. , Bunzeck, N. , … Kalisch, R. (2015). Deficient inhibitory processing in trait anxiety: Evidence from context‐dependent fear learning, extinction recall and renewal. Biological Psychiatry, 111, 65–72. [DOI] [PubMed] [Google Scholar]
- Hamilton, M. (1960). A rating scale for depression. Journal of Neurological and Neurosurgical Psychiatry, 23(1), 56–62. [DOI] [PMC free article] [PubMed] [Google Scholar]
- Heeren, A. , Maurage, P. , & Philippot, P. (2015). Revisiting attentional processing of non‐emotional cues in social anxiety: A specific impairment for the orienting network of attention. Psychiatry Research, 228(1), 136–142. [DOI] [PubMed] [Google Scholar]
- Hernández‐Ribas, R. , Deus, J. , Pujol, J. , Segalàs, C. , Vallejo, J. , Menchón, J. M. , … Soriano‐Mas, C. (2013). Identifying brain imaging correlates of clinical response to repetitive transcranial magnetic stimulation (rTMS) in major depression. Brain Stimulation, 6(1), 54–61. [DOI] [PubMed] [Google Scholar]
- Hodgson, T. L. , Mort, D. , Chamberlain, M. M. , Hutton, S. B. , O'neill, K. S. , & Kennard, C. (2002). Orbitofrontal cortex mediates inhibition of return. Neuropsychologia, 40(12), 1891–1901. [DOI] [PubMed] [Google Scholar]
- James, C. , & Mark, W. G. (2006). Mood effects on the ERP processing of emotional intensity in faces: A P3 investigation with depressed students. International Journal of Psychophysiology, 60, 27–33. [DOI] [PubMed] [Google Scholar]
- Joormann, J. , & Tanovic, E. (2015). Cognitive vulnerability to depression: Examining cognitive control and emotion regulation. Current Opinion in Psychology, 4, 86–92. [Google Scholar]
- Joshi, S. H. , Espinoza, R. T. , Pirnia, T. , Shi, J. , Wang, Y. , Ayers, B. , … Narr, K. L. (2015). Structural plasticity of the hippocampus and amygdala induced by electroconvulsive therapy in major depression. Biological Psychiatry, 5, S0006–S3223. 0015)00154–00157. [DOI] [PMC free article] [PubMed] [Google Scholar]
- Kellough, J. L. , Beevers, C. G. , Ellis, A. J. , & Wells, T. T. (2008). Time course of selective attention in clinically depressed young adults: An eye tracking study. Behaviour Research and Therapy, 46(11), 1238–1243. [DOI] [PMC free article] [PubMed] [Google Scholar]
- Korb, A. S. , Hunter, A. M. , Cook, I. A. , & Leuchter, A. F. (2009). Rostral anterior cingulate cortex theta current density and response to antidepressants and placebo in major depression. Clinical Neurophysiology, 120(7), 1313–1319. [DOI] [PMC free article] [PubMed] [Google Scholar]
- Koster, E. H. W. , De Lissnyder, E. , & De Raedt, R. (2013). Rumination is characterized by valence‐specific impairments in switching of attention. Acta Psychologica, 144(3), 563–570. [DOI] [PubMed] [Google Scholar]
- Kroenke, K. , Spitzer, R. L. , & Williams, J. B. W. (2001). The PHQ‐9: Validity of a brief depression severity measure. Journal of General Internal Medicine, 16, 606–613. [DOI] [PMC free article] [PubMed] [Google Scholar]
- Lai, C. H. (2014). Hippocampal and subcortical alterations of first‐episode, medication‐naïve major depressivedisorder with panic disorder patients. Journal of Neuropsychiatry and Clinical Neurosciences, 26(2), 142–149. [DOI] [PubMed] [Google Scholar]
- Lai, C. H. , & Wu, Y. T. (2015). The patterns of fractional amplitude of low‐frequency fluctuations in depression patients: The dissociation between temporal regions and fronto‐parietal regions. Journal of Affective Disorders, 175, 441–445. [DOI] [PubMed] [Google Scholar]
- Liston, C. , Chen, A. C. , Zebley, B. D. , Drysdale, A. T. , Gordon, R. , Leuchter, B. , … Dubin, M. J. (2014). Default mode network mechanisms of transcranial magnetic stimulation in depression. Biological Psychiatry, 76(7), 517–526. [DOI] [PMC free article] [PubMed] [Google Scholar]
- Liu, P. , & Shu, L. (1999). Beck depression inventory, BDI; Beck anxiety inventory, BAI; Hamilton depression rating scale, HDRS (Chinese) In Xiangdong Wang X. W. & Hong Ma. (Eds.), Assessment inventory handbook of mental health. Bei Jing: Chinese Journal of Mental Health. [Google Scholar]
- Lo, B. C. , & Allen, N. B. (2011). Affective bias in internal attention shifting among depressed youth. Psychiatry Research, 187(1–2), 125–129. [DOI] [PubMed] [Google Scholar]
- Lorenzetti, V. , Allen, N. B. , Fornito, A. , & Yucel, M. (2009). Structural brain abnormalities in major depressive disorder: A selective review of recent MRI studies. Journal of Affective Disorders, 117(1–2), 1–17. [DOI] [PubMed] [Google Scholar]
- Muggleton, N. G. , Juan, C. H. , Cowey, A. , Walsh, V. , & O'Breathnach, U. (2010). Human frontal eye fields and target switching. Cortex, 42(2), 178–184. [DOI] [PubMed] [Google Scholar]
- Nahum, L. , Simon, S. R. , Sander, D. , Lazeyras, F. , & Schnider, A. (2011). Neural response to the behaviorally relevant absence of anticipated outcomes and the presentation of potentially harmful stimuli: A human fMRI study. Cortex, 47(2), 191–201. [DOI] [PubMed] [Google Scholar]
- Nolen‐Hoeksema, S. (2000). The role of rumination in depressive disorders and mixed anxiety/depressive symptoms. Journal of Abnormal Psychology, 109(3), 504–511. [PubMed] [Google Scholar]
- Nolen‐Hoeksema, S. , Parker, L. E. , & Larson, J. (1994). Ruminative coping with depressed mood following loss. Journal of Personality and Social Psychology, 67(1), 92–104. [DOI] [PubMed] [Google Scholar]
- O'Reardon, J. P. , Solvason, H. B. , Janicak, P. G. , Sampson, S. , Isenberg, K. E. , Nahas, Z. , … Sackeim, H. A. (2007). Efficacy and safety of transcranial magnetic stimulation in the acute treatment of major depression: A multisite randomized controlled trial. Biological Psychiatry, 62(1), 1208–1216. [DOI] [PubMed] [Google Scholar]
- Shu, H. (2005). Factorial experimental design in psychology and education. Beijing: Beijing Normal University Publishing House. [Google Scholar]
- Smith, D. T. , Jackson, S. R. , & Rorden, C. (2009). Repetitive transcranial magnetic stimulation over frontal eye fields disrupts visually cued auditory attention. Brain Stimulation, 2(2), 81–87. [DOI] [PMC free article] [PubMed] [Google Scholar]
- Smith, K. (2014). Mental health: A world of depression. Nature, 515(7526), 181. [DOI] [PubMed] [Google Scholar]
- Song, X.‐W. , Dong, Z.‐Y. , Long, X.‐Y. , Li, S.‐F. , Zuo, X.‐N. , Zhu, C.‐Z. , … Zang, Y.‐F. (2011). REST: A toolkit for resting‐state functional magnetic resonance imaging data processing. PLoS ONE, 6(9), e25031. [DOI] [PMC free article] [PubMed] [Google Scholar]
- Spasojevic, J. , & Alloy, L. B. (2001). Rumination as a common mechanism relating depressive risk factors to depression. Emotion (Washington, D.C.), 1(1), 25–37. [DOI] [PubMed] [Google Scholar]
- Takano, K. , Iijima, Y. , Sakamoto, S. , & Tanno, Y. (2014). Exploring the cognitive load of negative thinking: A novel dual‐task experiment. Journal of Behavior Therapy and Experimental Psychiatry, 45(4), 435–440. [DOI] [PubMed] [Google Scholar]
- Tian, Y. , & Yao, D. Z. (2008). A study on the neural mechanism of inhibition of return by the event‐related potential in the Go/Nogo task. Biological Psychology, 79(2), 171–178. [DOI] [PubMed] [Google Scholar]
- Tzourio‐Mazoyer, N. , Landeau, B. , Papathanassiou, D. , Crivello, F. , Etard, O. , Delcroix, N. , … Joliot, M. (2002). Automated anatomical labelling of activations in SPM using a macroscopic anatomical parcellation of the MNI MRI single subject brain. NeuroImage, 15(1), 273. [DOI] [PubMed] [Google Scholar]
- Xiao, H. , Liu, B. , Chen, Y. , & Zhang, J. (2016). Learning, memory and synaptic plasticity in hippocampus in rats exposed to sevoflurane. International Journal of Developmental Neuroscience, 48, 38–49. [DOI] [PubMed] [Google Scholar]
- Xu, Y. , Wu, H. S. , & Xu, Y. F. (2007). The reliability and validity analysis: Application of patient health questionnaire ‐ 9 in commility elders (Chinese). Psychiatry Medicine of Shanghai, 19(5), 257–259. [Google Scholar]
- Zang, Y. F. , He, Y. , Zhu, C. Z. , Cao, Q. J. , Sui, M. Q. , Liang, M. , … Wang, Y. F. (2007). Altered baseline brain activity in children with ADHD revealed by resting‐state functional MR. Brain and Development, 29(2), 883–914. [DOI] [PubMed] [Google Scholar]
Associated Data
This section collects any data citations, data availability statements, or supplementary materials included in this article.
Supplementary Materials
Additional Supporting Information may be found online in the supporting information tab for this article.
Supporting Information