

Abstract
The human brain is a large, interacting dynamic network, and its architecture of coupling among brain regions varies across time (termed the “chronnectome”). However, very little is known about whether and how the dynamic properties of the chronnectome can characterize individual uniqueness, such as identifying individuals as a “fingerprint” of the brain. Here, we employed multiband resting‐state functional magnetic resonance imaging data from the Human Connectome Project (N = 105) and a sliding time‐window dynamic network analysis approach to systematically examine individual time‐varying properties of the chronnectome. We revealed stable and remarkable individual variability in three dynamic characteristics of brain connectivity (i.e., strength, stability, and variability), which was mainly distributed in three higher order cognitive systems (i.e., default mode, dorsal attention, and fronto‐parietal) and in two primary systems (i.e., visual and sensorimotor). Intriguingly, the spatial patterns of these dynamic characteristics of brain connectivity could successfully identify individuals with high accuracy and could further significantly predict individual higher cognitive performance (e.g., fluid intelligence and executive function), which was primarily contributed by the higher order cognitive systems. Together, our findings highlight that the chronnectome captures inherent functional dynamics of individual brain networks and provides implications for individualized characterization of health and disease.
Keywords: connectomics, functional dynamics, individual differences, R‐fMRI, sliding window
1. INTRODUCTION
Functional brain connectomics derived from resting‐state functional MRI (R‐fMRI) data offer a powerful tool to greatly advance our understanding of individual differences in human cognitive and behavioral performance in a network perspective. Recent studies have reported inter‐individual variability in functional brain connectivity architecture at rest (Airan et al., 2016; Barnes, Anderson, Plitt, & Martin, 2014; Finn et al., 2015; Gao et al., 2014; Mueller et al., 2013). Such interindividual connectivity variability is closely associated with evolutionary cortical expansion (Mueller et al., 2013) and genetics (Gao et al., 2014), and it is partially responsible for individual differences in cognitive performance (Baldassarre et al., 2012; Gerraty, Davidow, Wimmer, Kahn, & Shohamy, 2014; Hampson, Driesen, Skudlarski, Gore, & Constable, 2006; Liu et al., 2016; Seeley et al., 2007; Wei et al., 2012). Moreover, individual connectivity patterns can act as a detectable “fingerprint” of the brain, with higher order functional systems (e.g., the fronto‐parietal system) as the most distinctive feature (Finn et al., 2015). These studies suggest that the R‐fMRI‐derived functional connectome captures inherent or intrinsic individual characteristics of brain activity. However, all these R‐fMRI studies of individual differences have implicitly assumed that the functional coupling among brain regions is static and unchanging over the entire scanning period.
Recently, there has been growing interest in the “chronnectome,” a new concept that has emerged to emphasize the dynamic characteristics of functional brain connectivity (Allen et al., 2014; Calhoun & Adali, 2016; Calhoun, Miller, Pearlson, & Adali, 2014; Hutchison et al., 2013; Preti, Bolton, Van, & Ville, 2017). Mounting evidence has suggested that the chronnectome at rest reflects underlying temporal changes in neural activities measured by electrophysiological recording (Chang, Liu, Chen, Liu, & Duyn, 2013; Keilholz, 2014; Tagliazucchi, von Wegner, Morzelewski, Brodbeck, & Laufs, 2012; Zhang et al., 2016), is structurally constrained by white matter connectivity (Liao et al., 2015; Shen, Hutchison, Bezgin, Everling, & McIntosh, 2015a; Zhang et al., 2016), and is able to trace alterations in normal development (Davison et al., 2016; Hutchison & Morton, 2015; Qin et al., 2015) and neuropsychiatric disorders, such as depression (Wei et al., 2015) and schizophrenia (Damaraju et al., 2014; Rashid, Damaraju, Pearlson, & Calhoun, 2014; Zhang et al., 2016). Notably, most research involving the dynamic functional network has primarily focused on group‐level analyses, largely ignoring individual‐specific characteristics in the chronnectome. Recently, several studies have found that the resting‐state dynamic connectivity pattern is associated with individual perception and attention abilities (Madhyastha, Askren, Boord, & Grabowski, 2015; Sadaghiani, Poline, Kleinschmidt, & D'esposito, 2015) and demographic characteristics, such as age (Davison et al., 2016), indicating the existence of individual variability in the resting‐state chronnectome. However, very little is known about whether the chronnectome is unique to each person and can act as a fingerprint to identify individuals, and contribute to individual differences in high cognitive performance.
To address these issues, we employed multiband R‐fMRI data (N = 105) with a sub‐second sampling rate and a sliding time‐window dynamic network analysis approach to systematically investigate the individual time‐varying characteristics of the chronnectome. Specifically, we first constructed dynamic functional networks for each participant and calculated the dynamic functional connectivity (DFC) strength, stability and variability to comprehensively characterize the time‐varying characteristics of each functional connectivity. Then, we examined the spatial distribution pattern of inter‐subject variability of these dynamic characteristics, followed by individual identification analyses and individual prediction analyses of higher cognitive functions. Given the existing correlation between dynamic connectivity patterns and individual cognitive behaviors and demographic characteristics (Chen, Cai, Ryali, Supekar, & Menon, 2016; Davison et al., 2016; Madhyastha et al., 2015; Sadaghiani et al., 2015; Yaesoubi, Miller, & Calhoun, 2015), we hypothesized that the chronnectome would capture individual unique characteristics in time‐varying functional organization to identify individuals from one another and significantly contribute to cognition prediction.
2. MATERIALS AND METHODS
2.1. Data collection
We used the publicly available Q2 Data Release of the Human Connectome Project (HCP) (Van Essen et al., 2013). The full Q2 release contains data from 142 healthy participants, 132 of whom underwent repeated R‐fMRI scanning in two sessions (S1 and S2). Written informed consent was obtained from each participant. The scanning protocol was approved by the Institutional Review Board of Washington University in St. Louis, MO, USA (IRB #20120436). Data from 27 participants were excluded because of large head motion (24 participants; see Section 2.2) or missing time points in image data (3 participants) in either of the two sessions. Therefore, R‐fMRI data from two sessions with 105 participants were included in the following analyses (Table 1).
Table 1.
Demographics and behavioral performances of the participants
| HCP Q2 dataset (N = 105)a | |
|---|---|
| Gender (M/F) | 37/68 |
| Age (years) | 22–35 |
| Executive function/cognitive flexibility | 103.3 ± 9.9 (66.6–122.7) |
| Executive function/inhibition | 104.5 ± 9.0 (80.3–123.6) |
| Fluid intelligence | 16.6 ± 4.6 (5–24) |
| Sustained attention | 57.4 ± 2.9 (42–60) |
| Working memory | 101.6 ± 15.0 (60.1–127.4) |
Note. Behavioral data are presented as mean ± SD (minimum–maximum).
Data from 27 participants were not used because of large head motion (N = 24) and missing time points in image data (N = 3) in either of the two sessions.
Whole‐brain multiband gradient‐echo‐planar imaging acquisitions were acquired on a customized 32‐channel 3T Siemens “Connectome Skyra” scanner at Washington University. The sequence parameters were as follows: repetition time = 720 ms, time echo = 33.1 ms, flip angle = 52°, bandwidth = 2,290 Hz/pixel, in‐plane field of view = 208 × 180 mm2, matrix = 104 × 90, 72 slices, 2 mm isotropic voxels, multiband acceleration factor = 8 and 1,200 volumes (14 min and 24 s). Data were collected over 2 days with one session of R‐fMRI data collection (eyes open with fixation) on each day. Two phase‐encoding directions (left‐to‐right or right‐to‐left) were used in each session during R‐fMRI data acquisition. Here, we included only the left‐to‐right‐encoded runs to avoid potential effects of different phase‐encoding directions on our findings.
2.2. Data preprocessing
Our image analysis was based on the HCP R‐fMRI dataset with the minimal preprocessing procedure (Glasser et al., 2013), which included gradient distortion correction, head motion correction, image distortion correction, spatial transformation to the Montreal Neurological Institute (MNI) space and intensity normalization. Notably, R‐fMRI data from 24 participants were excluded due to large head motion in either session with the exclusion criteria of translation/rotation above 3 mm/3° or mean frame‐wise head motion above 0.14 mm (HCP: Movement_RelativeRMS_mean) (Finn et al., 2015). We further used the Data Processing Assistant for Resting‐State fMRI (DPARSF) (Yan & Zang, 2010) and the Statistical Parametric Mapping software (SPM8; http://www.fil.ion.ucl.ac.uk/spm) to reduce biophysical and other noise in the minimally preprocessed data by removing linear trend, regressing nuisance signals (24 head motion parameters (Friston, Williams, Howard, Frackowiak, & Turner, 1996), cerebrospinal fluid, white matter and global signals), and performing temporal band‐pass filtering (0.01–0.1 Hz). The resultant residuals were used for the following analysis.
2.3. Dynamic network construction
For each participant, whole‐brain dynamic functional networks were constructed based on the preprocessed R‐fMRI data. A flow chart of the analysis strategy is illustrated in Figure 1. Briefly, for the node definition, we employed a 268‐node functional atlas (Finn et al., 2015), which was defined using a group‐wise spectral clustering algorithm (Shen, Tokoglu, Papademetris, & Constable, 2013). To focus on the cerebrum and cerebellum, thirteen nodes located in the brainstem or ventricles were excluded, yielding 255 nodes for subsequent dynamic connectivity construction. Then, we extracted the time series of each node by averaging the time courses of all voxels within the node. Another 264‐node functional atlas (Power et al., 2011) was also utilized for validation purposes (Section 2.8).
Figure 1.
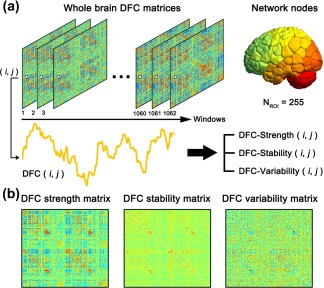
Flow chart of the dynamic network analysis. (a) Left: transient dynamic functional connectivity matrices at different sliding windows. The edges of the matrices were defined as the Pearson's correlation between any pair of nodes in terms of the resting‐state time series. The color indicates the weight of each edge. For a given edge/connectivity between node i and node j (i ≠ j), the strength fluctuates across windows. Right: definition of nodes. The regions of interest (ROI) set including 255 regions was obtained after removing ROIs located in the brainstem from a previously defined functional atlas (Finn et al., 2015). (b) To quantitatively describe time‐varying characteristics, we estimated three dynamic measurements for each functional connectivity, including dynamic functional connectivity strength (DFC‐Str), dynamic functional connectivity stability (DFC‐Sta) and dynamic functional connectivity variability (DFC‐Var). Then, for each participant, we obtained three different DFC matrices in each session, reflecting the intrinsic chronnectome profiles in three different ways [Color figure can be viewed at http://wileyonlinelibrary.com]
DFC was estimated with a widely used sliding window approach (Allen et al., 2014; Calhoun et al., 2014; Hutchison et al., 2013; Kiviniemi et al., 2011; Liao, Cao, Xia, & He, 2017; Liao et al., 2015; Tagliazucchi et al., 2012; Zalesky, Fornito, Cocchi, Gollo, & Breakspear, 2014). Specifically, Pearson's correlation coefficients were calculated between any pair of nodes using segments of the time course within a time window. The window had a width of 139 TRs (i.e., 100 s) and slide on time with a time step of 1 TR (i.e., 720 ms). Using time window of this width provided a sufficient number of time points (at least one period of oscillation) to estimate functional connectivity over the low‐frequency band of interest (0.01–0.1 Hz) and to simultaneously capture temporal changes in functional connectivity during a short period (Betzel, Fukushima, He, Zuo, & Sporns, 2016; Leonardi & Van De Ville, 2015; Liao et al., 2015). Finally, for each participant in each session, we obtained a total of 1,062 windows, each of which had 32,385 functional connectivities (i.e., 255 × 254/2). Additionally, we examined the influence of different sliding window widths on the main findings, and validated the effect of dynamic network construction approach by using dynamic conditional correlation (DCC) (Lindquist, Xu, Nebel, & Caffo, 2014) (Section 2.8).
2.4. Dynamic characteristic measurements
To quantitatively describe the time‐varying characteristics of the functional connectivities, we calculated three measurements, including DFC mean strength (DFC‐Str), DFC stability (DFC‐Sta) and DFC variability (DFC‐Var), for each functional connectivity as follows:
| (1) |
| (2) |
| (3) |
where r ( i,j ) t is the strength of functional connectivity between node i and node j of a given window t; T is the total number of time windows (i.e., T = 1,062); is the amplitude of the temporal fluctuations in functional connectivity between node i and node j at a given frequency range f; and F is the total number of discrete low frequencies of interest (<0.08 Hz, corresponding to 80% energy of the frequency spectrum; the evaluation of the effect of the low‐frequency threshold in the DFC‐Var calculation was described in Section 2.8). Notably, these measurements reflect different aspects of dynamic features of functional connectivity: DFC‐Str indicates the overall strength around which the DFC fluctuates; DFC‐Sta represents the continuousness of the temporal changes in DFC between adjacent windows; and DFC‐Var describes the overall fluctuating level of DFC across time. Of note, DFC‐Var used here takes into account the information of power and amplitude in the frequency domain by filtering the potential fluctuating noises contained in the high frequencies (>0.08 Hz), which is slightly different from a simple measure of standard deviation. For each participant, we obtained three different DFC matrices in each session, reflecting the intrinsic chronnectome profiles in three different ways.
To further ascertain whether these dynamic characteristics of the chronnectome were strongly system dependent, we employed a previously published brain template with seven functional systems (Yeo et al., 2011): the default mode, fronto‐parietal, dorsal attention, ventral attention, visual, sensorimotor, and limbic systems. Given that this template included only the cerebral cortex, we added two additional systems—the subcortical and cerebellar areas—to the template according to the automated anatomical labeling atlas (Tzourio‐Mazoyer et al., 2002), yielding nine brain systems in total (Supporting Information, Figure S1). Finally, 255 nodes were assigned to the nine systems according to the maximal spatial overlap between nodes and systems. Specifically, for a given node, we separately calculated the percentage of voxels located in each system and assigned this node to the system with the largest percentage.
2.5. Individual variability analysis
To assess individual variability in DFC, we computed the standard deviation of each dynamic characteristic (DFC‐Str, DFC‐Sta, and DFC‐Var) across participants (N = 105) for each connectivity, yielding three individual variability matrices in each session. To examine whether the individual difference patterns of dynamic properties of functional connectivity were consistent across scan sessions, we compared the individual difference patterns between two sessions by calculating Pearson's correlation across connections for each dynamic characteristic. Further, we quantified the distribution of highest variability in brain systems by counting the number of the highest individual variability connections (top 5%) within or between systems.
2.6. Individual identification analysis
To explore the potential power of chronnectome profiles in discriminating individuals from each other, we performed an individual identification analysis proposed by Finn et al. (2015). First, for each participant, we compared the matrix of the dynamic characteristic of this participant from Session 1 to each of the matrices of all the participants in Session 2 (S1→S2). For each comparison, the similarity was computed using Pearson's correlation coefficient across connections. Second, the predicted identity of this participant was assigned the same label as the participant in Session 2 who showed maximal similarity to this participant. The accuracy of the comparison was designated 1 if the predicted identity matched the true identity; otherwise, it was designated 0. After the identities of all the participants had been predicted, we determined the identification accuracy of all the participants by calculating the proportion of participants with correct identification. Finally, Sessions 1 and 2 were reversed, and all the processes described above were performed again (S2→S1). All these processes, including the S1→S2 and S2→S1 identification analyses, were performed separately for each dynamic characteristic (i.e., DFC‐Str, DFC‐Sta, and DFC‐Var).
After obtaining the identification accuracy of each dynamic characteristic, we performed a nonparametric permutation test to examine its statistical significance. Briefly, for each permutation, we randomized the identities of the participants in both sessions, reperformed the identification processes and recorded the identification accuracy. An empirical distribution of the identification accuracy was obtained with 10,000 permutations, and the 95th percentile points of the empirical distribution were used as critical values to determine whether the observed identification accuracy occurred by chance.
To ascertain which specific functional connectivity contributed the most to individual identification, for each functional connectivity we calculated the modified differential power (DP) based on Finn et al. (2015):
| (4) |
where , indicates the probability that between two different participants is higher than within the same participant; and and represent the dynamic characteristic values of functional connectivity between node i and node j in two sessions (S1 and S2) after z‐score normalization; l and k (l ≠ k) represent the labels of two different participants; and N denotes the number of all participants (here, N = 105). For a given functional connectivity, a higher DP value indicates a great positive contribution to individual identification. Moreover, to explore the system‐dependent contribution to individual identification, we counted the distribution of functional connectivity with the highest DP value (top 5%; the results for additional two thresholds are also shown in Supporting Information) within or between systems to examine whether specific brain systems play important roles in discriminating individuals.
2.7. Individual cognition prediction analysis using support vector regression
To explore the possibility that the dynamic characteristics (DFC‐Str, DFC‐Sta, and DFC‐Var) of the chronnectome could significantly predict individual cognitive performance, we performed epsilon‐insensitive support vector regression (SVR) with a linear kernel. SVR is one of the most widely used supervised machine‐learning approaches (Dosenbach et al., 2010; Erus et al., 2015; He et al., 2013). We employed behavioral data on high‐level cognition from the HCP protocol, including executive function/cognitive flexibility (Dimensional Change Card Sort, HCP: CardSort_AgeAdj), executive function/inhibition (Flanker task, HCP: Flanker_AgeAdj), fluid intelligence (Penn Progressive Matrices, HCP: PMAT24_A_CR), sustained attention (Short Penn Continuous Performance Test, HCP: SCPT_TP) and working memory (List Sorting, HCP: ListSort_AgeAdj) (see Table 1 for more details). Then, dynamic characteristics (DFC‐Str, DFC‐Sta, or DFC‐Var) from Session 1 were separately used as features in the SVR analysis to predict the scores of these high‐level cognitive abilities.
For the SVR analysis, the leave‐one‐out cross‐validation (LOOCV) strategy was adopted to provide a conservative estimate of the prediction accuracy. As an example, to assess the ability of DFC‐Str to predict executive function/cognitive flexibility, in each LOOCV fold, one participant was designated as the test sample and the remaining participants were used as the training set in the SVR analysis. First, the DFC‐Str values of all functional connectivities (i.e., 32,385 connections) were concatenated to generate a feature vector for each participant; then, each feature was normalized by subtracting the mean value and dividing it by its standard deviation across the participants in the training set (the average value and standard deviation were also used for normalizing the test sample). Second, a feature selection procedure (Dosenbach et al., 2010) was implemented by ranking features according to their correlation coefficient with the executive function/cognitive flexibility score, retaining only features with the highest correlation coefficient corresponding to p value <.001 (the evaluation of the effect of the feature selection threshold in SVR is described in Section 2.8). Third, a predicted model was built using SVR to fit the relationship between the pattern of the selected features and the score of individual executive function/cognitive flexibility in the training set. Fourth, the model was used to predict the behavioral score of a previously unseen test sample. Each participant was set as the test sample once, and after all the LOOCV folds were completed, we correlated the predicted scores and observed scores across all folds to yield final accuracy estimation. The predictive power of each feature was calculated by counting the number of times that this feature was selected across all folds of the LOOCV, which was termed the feature frequency (Dosenbach et al., 2010; Zeng et al., 2012). At the functional system level, the predictive power was computed by summing the feature frequency of all connections within or between systems. Further, to elucidate the directions of relationship between the dynamic features and cognitive scores, we separated the predictive features into two types according to whether the connections were positively or negatively correlated with high‐level cognitive capabilities. In addition, 5‐fold and 10‐fold cross‐validation strategies were used, as described in Section 2.8.
Finally, a permutation test (10,000 times) was used to assess the statistical significance of the observed prediction accuracy for each dynamic characteristic (Cui, Su, Li, Shu, & Gong, 2017). During each permutation, the observed behavioral scores of participants were randomly shuffled prior to the SVR analysis. In other words, we estimated the possibility of the same prediction performance occurring by chance. Bonferroni correction was used to correct for multiple predictions across three measurements and five behavioral indexes (here, N = 15).
SVR was implemented using the LIBSVM toolbox for Matlab (http://www.csie.ntu.edu.tw/~cjlin/libsvm/) (Chang & Lin, 2011) with the default settings of C = 1 and ɛ = 0.001.
2.8. Validation analysis
To validate our main results, we examined the effects of different image preprocessing procedures and analysis strategies as follows. (a) Head motion. A recent study suggested that observations of DFC could be affected by head motion (Laumann et al., 2017); therefore, we assessed the potential influence of head motion on our main findings in three ways. First, during the individual cognitive prediction analysis, we examined the relationship between the predicted behavioral scores and the observed behavioral scores after controlling for individual mean frame‐wise head motion (HCP: Movement_RelativeRMS_mean). Second, we performed a spike‐regression‐based scrubbing in the original nuisance regression procedure during data preprocessing (Power, Schlaggar, & Petersen, 2015; Yan et al., 2013), with the criterion of a frame‐wise displacement (FD) (Power, Barnes, Snyder, Schlaggar, & Petersen, 2012) above 0.5 mm; then, we repeated the main analyses above. Third, we performed correlation analyses across participants between the mean frame‐wide head motion and the averaged value of each dynamic characteristic to rule out the possibility that time‐varying characteristics were driven simply by head motion. (b) Parcellation scheme. To determine whether our major results were affected by the brain parcellations, we also computed the dynamic characteristics based on a functional atlas (Power‐264) consisting of 264 regions of interest (Power et al., 2011); then, we reperformed the individual identification and prediction analysis. (c) Global signal. Previous studies have suggested that while global signal regression can effectively reduce the impacts of physiological and non‐neuronal signals (Birn, Diamond, Smith, & Bandettini, 2006; Fox, Zhang, Snyder, & Raichle, 2009; Power et al., 2014), it may simultaneously alter the intrinsic network architecture (Ibinson et al., 2015; Murphy, Birn, Handwerker, Jones, & Bandettini, 2009; Weissenbacher et al., 2009). Very recently, Murphy and Fox (2017) suggested that different preprocessing strategies are likely to provide complementary insights into functional brain organization. Thus, we also examined the results without global signal regression. (d) Feature selection threshold. We examined the effects of different feature selection thresholds on our main results in the SVR analysis using two additional feature selection thresholds (i.e., p value <.0005 and p value <.0001). (e) Cross‐validation strategy. We employed a commonly used LOOCV strategy to estimate the prediction accuracy of the cognitive prediction analysis; however, a recent study suggested that this strategy might produce some unstable and biased estimates (Varoquaux et al., 2017). Thus, we also employed 5‐fold and 10‐fold cross‐validation strategies to conservatively validate the estimates. The 5‐fold and 10‐fold cross‐validations were repeated 100 times. (f) Sliding window width. We employed a commonly used sliding window approach to capture the dynamics of functional connectivity. However, the optimal selection of the window width remains controversial (Allen et al., 2014; Hutchison et al., 2013; Jones et al., 2012; Kiviniemi et al., 2011; Zalesky et al., 2014). Two additional window widths (50 and 150 s) were considered to validate our main findings. (g) Dynamic network construction approach. Recent studies have suggested that sliding window correlation analysis with a short window width could introduce artificial fluctuations in estimating DFC (Hindriks et al., 2016; Liegeois, Laumann, Snyder, Zhou, & Yeo, 2017; Lindquist et al., 2014). Thus, in this study, a long window width of 100s was adopted to avoid this issue. However, to further assess the potential effect, we constructed the dynamic functional brain networks by utilizing the dynamic condition correlation (DCC) approach (Lindquist et al., 2014) to estimate DFC and validate our main results. (h) Static FC regression. To further investigate the potential effect of static FC on the characteristics of DFC in the individual identification and cognitive prediction analysis, for each participant, we regressed out the static FC strength from three dynamic characteristics across the connections using general linear model, respectively. Then, we reperformed the individual identification and cognitive prediction analysis using the residual from the model. (i) Low‐frequency threshold. To investigate the effects of the low‐frequency threshold in the DFC‐Var calculation on the identification accuracy and prediction performance, different thresholds (0.04 Hz and 0.19 Hz, corresponding to 70% and 90% energy of the frequency spectrum) were used to estimate the robustness of our findings.
3. RESULTS
3.1. Individual variability in dynamic characteristics of time‐varying network connectivity
Figure 2a displays the spatial patterns of individual variability in the three dynamic properties (DFC‐Str, DFC‐Sta, and DFC‐Var) in Session 1 (Right) and Session 2 (Left). Further cross‐connection correlation analysis revealed significant positive correlations between Session 1 and Session 2 for all three characteristics (DFC‐Str: r = 0.85; DFC‐Sta: r = 0.89; and DFC‐Var: r = 0.55; all p values <.0001) (Figure 2b), suggesting a stable spatial pattern of individual differences in these dynamic characteristics across repeated scanning sessions. At the system level, the individual variability in the three dynamic characteristics was spatially heterogeneous in both sessions, with the greatest variability predominantly in the default mode, visual, dorsal attention, sensorimotor and fronto‐parietal systems (Figure 2c).
Figure 2.
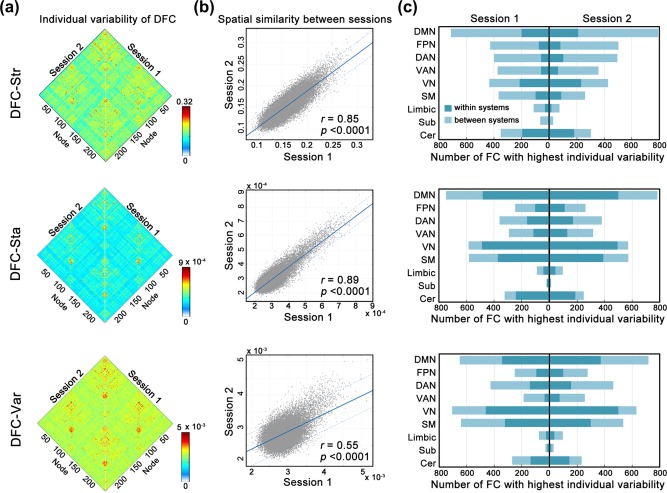
Individual variability in dynamic characteristics of functional connectivity. (a) Individual variability matrices of the three dynamic characteristics (DFC‐Str, DFC‐Sta, and DFC‐Var) were evaluated in two sessions. (b) There was high similarity of the spatial distribution patterns of individual variability in the three dynamic characteristics between the two sessions. Each dot represents the variability of one connectivity. The dashed lines indicate the 95% prediction error bounds. (c) The system‐dependency of the individual variability distribution in the three dynamic characteristics. Numbers of connectivities with the highest individual variability (top 5%) within a system and between systems (connected with other systems) were counted for each system. FC, functional connectivity; DFC‐Str, dynamic functional connectivity strength; DFC‐Sta, dynamic functional connectivity stability; DFC‐Var, dynamic functional connectivity variability; DMN, default mode network; FPN, fronto‐parietal network; DAN, dorsal attention network; VAN, ventral attention network; VN, visual network; SM, sensorimotor network; Sub, subcortical network; Cer, cerebellar network [Color figure can be viewed at http://wileyonlinelibrary.com]
3.2. Chronnectome‐based individual identification
Based on the dynamic characteristics of the intrinsic chronnectome, we identified individuals with the following identification accuracies: S1→S2, 95/105 (90.5%) for DFC‐Str, 82/105 (78.1%) for DFC‐Sta and 56/105 (53.3%) for DFC‐Var; and S2→S1, 96/105 (91.4%) for DFC‐Str, 83/105 (79.0%) for DFC‐Sta; and 57/105 (54.3%) for DFC‐Var (all p values <.0001, permutation tests) (Figure 3a–c, top). To demonstrate functional connectivity with large contributions to individual discrimination, we calculated the DP for all connections in the brain network and showed the top 5% for each dynamic characteristic (Figure 3a–c, bottom). Generally, most of the DFCs with high DP for three characteristics were the connections related to the default mode, fronto‐parietal and dorsal attention systems. Specifically, the connections with high DP were mainly between the default mode, fronto‐parietal and dorsal attentional systems for DFC‐Str (Figure 3a), whereas the connections with high DP were predominantly connected to the default mode for DFC‐Sta and DFC‐Var (Figure 3b,c). Of note, although high individual variability was observed in primary systems such as the visual and sensorimotor systems (Figure 2c), primary systems contributed less to individual identification than did the default mode (Figure 3, bottom). Similar results were observed at two additional thresholds (top 1% and top 10%) (Supporting Information, Figure S2). These findings suggest that DFC patterns can act as a fingerprint feature to identify individuals; in particular, connections involving higher order functional brain systems play critical roles in individual identification.
Figure 3.
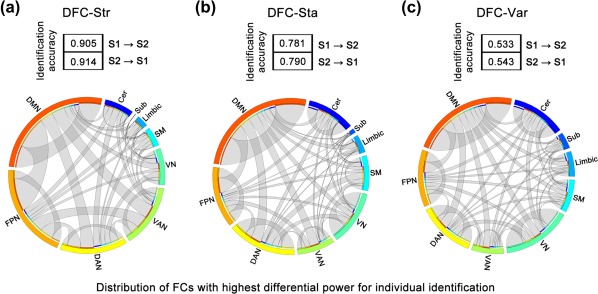
The identification accuracy and distribution of the highest differential power connectivity among systems for the three dynamic characteristics. The identification accuracy of each dynamic characteristic is shown in the box for S1→S2 and S2→S1. Circle plots show the functional connectivity with the highest differential power (top 5%) in individual identification for DFC‐Str (a), DFC‐Sta (b), and DFC‐Var (c). Outer circle segments with different colors indicate different brain functional systems, and the segment length indicates the total number of functional connectivities with the highest differential power (both within and between systems) connected to a system. Ribbons indicate functional connectivity, and their width represents the number of connectivity within a system or between two systems. The colors of the inner circle segments indicate the systems to which the ribbons are connected [Color figure can be viewed at http://wileyonlinelibrary.com]
3.3. Chronnectome‐based high‐level cognition prediction
Three dynamic characteristics (DFC‐Str, DFC‐Sta, or DFC‐Var) of the chronnectome exhibited different prediction abilities for different higher cognitive functions. (a) DFC‐Str: The SVR models using DFC‐Str patterns successfully predicted the performance of fluid intelligence for previously unseen participants (test sample), with a predicted‐observed correlation of r = 0.42 (p value <.0001, corrected) (Figure 4a, left). Further, we found that the functional connectivity within the dorsal attention system, between the default mode and ventral attention systems, and between the default mode and cerebellar systems contributed the most to fluid intelligence prediction (Figure 4a, right). In detail, the predictive power of the connections within the dorsal attention system and between the default mode and ventral attention systems was contributed by the positive correlation with fluid intelligence, while the predictive power of the connections between the default mode and cerebellar systems was contributed by the negative correlation with fluid intelligence (Supporting Information, Figure S3). When predicting the performance of working memory, we found a marginally significant predicted‐observed correlation (r = 0.24, p value <.051, corrected) (Supporting Information, Figure S4). Notably, the DFC‐Str patterns could not significantly predict individual executive function (both cognitive flexibility and inhibition) or sustained attention. (b) DFC‐Sta: When using DFC‐Sta patterns as a feature in the SVR models, we did not find significant predictions for any of the five cognitive functions after Bonferroni corrections. (c) DFC‐Var: The SVR models using the DFC‐Var patterns significantly predicted the scores of executive function/cognitive flexibility (r = 0.49, p value <.0001, corrected) and executive function/inhibition (r = 0.31, p value <.0015, corrected) (Figure 4b,c, left). Specifically, connections within the default mode system made the greatest contribution to executive function/cognitive flexibility prediction (Figure 4b, right), whereas the connections within fronto‐parietal and dorsal attention systems predominantly contributed to executive function/inhibition prediction (Figure 4c, right). Furthermore, for cognitive flexibility, we observed that the predictive power of the default mode system was contributed by both connections positively and negatively correlated with this behavioral score (Supporting Information, Figure S3). In the prediction of inhibition, the predictive power of the fronto‐parietal system was contributed by the connections negatively correlated with inhibition, while that of dorsal attention system was contributed by both connections positively and negatively related to inhibition (Supporting Information, Figure S3). DFC‐Var had no significant predictive power for fluid intelligence, working memory or sustained attention after Bonferroni corrections.
Figure 4.
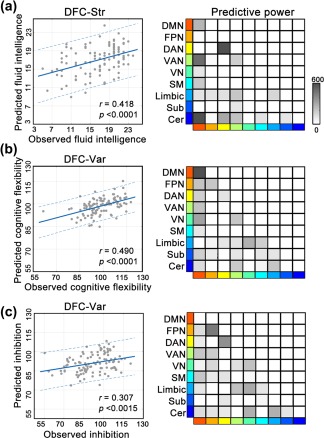
Predictive ability and distribution of contribution of dynamic characteristics to cognitive performance. Left: scatter plots show significant positive correlations between the predicted scores derived from the SVR analysis using DFC‐Str as a feature and the observed scores of fluid intelligence (a), DFC‐Var and executive function/cognitive flexibility (b), and DFC‐Var and executive function/inhibition (c). Each dot represents the data from one subject, and the dashes indicate the 95% prediction error bounds. Right: matrices represent the predictive power of functional connectivity within and between brain functional systems for each prediction on the left. The color of the outer rectangle indicates different functional systems, and the color depth of the gird in the matrix indicates the predictive power within and between systems [Color figure can be viewed at http://wileyonlinelibrary.com]
3.4. Validation results
We evaluated the reliability of our main findings using data obtained under different image preprocessing procedures and analysis strategies, including head motion correction, parcellation schemes, data preprocessing without global signal regression, feature selection thresholds and cross‐validation strategies in SVR, sliding window widths, the dynamic network construction approach, static FC regression and low‐frequency thresholds in DFC‐Var calculations. The main results of the individual variability analysis and individual identification analysis were highly consistent across these different image preprocessing procedures and analysis strategies (Figure 5a,b). The majority of the cognitive prediction results were validated (Figure 5c), whereas the executive function prediction with DFC‐Var as the feature was relatively sensitive to the effects of several factors, such as the selection of parcellation schemes, the absence of global signal regression, sliding window widths and spike‐based scrubbing. Moreover, we calculated the across‐subject correlations between the mean frame‐wide head motion and averaged value of each dynamic characteristic across connections and we found no significant correlations. Together, the results of the validation analysis suggested our main findings had robust reproducibility.
Figure 5.
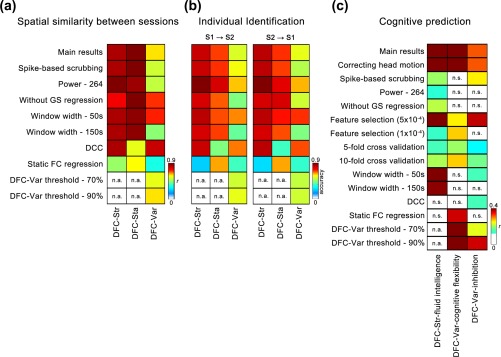
Results of individual variability estimation, individual identification and cognition prediction in validation analysis. (a) The color of the matrix represents the r value for the correlation of individual variability in the three dynamic characteristics between Sessions 1 and 2. Each row represents the result of a different preprocessing or analysis strategy. (b) The color of the two matrices represents the identification accuracy using Session 1 to identify individuals in Session 2 and the reverse. (c) The color of the matrix represents the correlation coefficient between the predicted scores and observed scores in the cognition prediction analysis. The r values or identification accuracies with p value <.05 are shown in these matrices. The r value for DFC‐Var to inhibition prediction in 5‐fold across the validation strategy (row 8, column 3) was at the marginally significant level of .05 < p value < .1. In (a–c), the first row indicates the main results for better comparisons with the validation results. n.a., not available; n.s., not significant [Color figure can be viewed at http://wileyonlinelibrary.com]
4. DISCUSSION
In this study, we showed that the spatial distribution patterns of individual variability in DFC characteristics (i.e., DFC‐Str, DFC‐Sta, and DFC‐Var) were heterogeneously distributed among functional brain systems and these patterns were highly similar across repeated scanning sessions. More importantly, we showed that DFC could successfully distinguish one individual from others with high identification accuracy and could significantly predict individual high‐level cognitive behaviors, including fluid intelligence and executive function. Notably, the default mode, dorsal attention and fronto‐parietal systems showed large contributions to individual identification and cognition prediction. Collectively, our findings provide empirical evidence to support the functional significance of chronnectome fingerprints, which extends our understanding of how individual brains vary temporally in unique ways.
4.1. Chronnectome captures individual inherent characteristics of brain and behaviors
We found that the spatial pattern of individual variation in DFC characteristics was highly similar between two repeated scanning sessions, suggesting stable individual variability of the intrinsic chronnectome. Intriguingly, we found that the DFC pattern derived from R‐fMRI showed a notable ability to differentiate between individuals, suggesting that the chronnectome at rest may act as a fingerprint that reflects individual intrinsic characteristics. Previous studies have explored inter‐individual variability in dynamic functional architecture in terms of associations with individual cognitive performance (Bassett, Yang, Wymbs, & Grafton, 2015; Braun et al., 2015; Davison et al., 2016; Gonzalez‐Castillo et al., 2015; Madhyastha et al., 2015; Nomi et al., 2017), individual demographics (Davison et al., 2016) and clinical characteristics (Damaraju et al., 2014; Rashid et al., 2014; Wei et al., 2015; Zhang et al., 2016). In a recent study, by performing a hypergraph analysis (a method based on dynamic network theory) on lifespan datasets, Davison et al. (2016) showed that one dynamic metric (i.e., hypergraph cardinality) exhibited individual differences and was significantly correlated with age. Our finding of the strong individual identification power of DFC patterns further suggests that chronnectomes not only vary across individuals but also are unique for each person. Correspondingly, the SVR analysis revealed significant predictive abilities of DFC for individual higher cognitive performance. All our findings highlight that the intrinsic chronnectome at rest has individual uniqueness, which may capture individual inherent characteristics of the brain and behaviors.
The individual uniqueness of the chronnectome may largely result from both genetic and environmental factors. On one hand, previous research has shown that dynamic network reconfigurations are associated with a genetic liability for schizophrenia (Braun et al., 2016). On the other hand, the individual chronnectome has prominent plasticity; the patterns of DFC can change with improvements in individual skills, such as motor learning tasks (Bassett et al., 2011) and daily driving (Shen et al., 2016). Therefore, genetics and acquired experience may influence or even shape the individual chronnectome. Given each individual's unique genetic basis and life experiences, the individualized chronnectome may gradually form and develop during interactions between genetic factors and environmental adaptation.
4.2. Chronnectome of higher order functional systems mainly contributes to individual characterization
In this study, we observed that the DFC with the largest variations across individuals were located in both higher order systems (i.e., default mode, dorsal attention and fronto‐parietal systems) and primary systems (i.e., visual and sensorimotor systems), with the former contributing much more to individual identification and cognition prediction than the latter. These results suggest that the DFC patterns of higher order systems may carry more unique individual differentiating information that reflects individual cognitive ability or demographic characteristics than those of primary systems. Such divergent phenomena might be due to the different developmental and functional features of the two types of functional systems.
First, the primary systems are mainly distributed in the unimodal cortex, whereas the higher order systems are mainly located in the association cortex area, a brain area that is thought to be developmentally late maturing (Gogtay et al., 2004; Yakovlev & Lecours, 1967). The higher order functional systems may have an extended developmental period and thus are more influenced by individual environmental effects than primary systems (Mueller et al., 2013). Second, the higher order systems and their collaboration with other systems are more involved in various complex cognitive behaviors than the primary systems and play central roles in task control to adapt to changeable external environments (Cole et al., 2013; Cole, Yarkoni, Repovs, Anticevic, & Braver, 2012; Liang, Zou, He, & Yang, 2013, 2016; Liu et al., 2016; Vatansever, Menon, Manktelow, Sahakian, & Stamatakis, 2015). Thus, the DFC patterns of the higher order systems involving multiple complex cognitive processing may more easily show diversity among individuals than the primary systems, which mainly focus on basic visual and sensorimotor processing. We speculate that the extended developmental period and cognitive processing complexity reinforce the impact of variable environmental factors during individual development and make interindividual variability in the higher order functional systems more conspicuous. Notably, the observed variances in DFC in primary systems, which were relatively high among individuals but did not contribute greatly to individual identification and cognitive prediction, might suggest that interindividual variability in primary systems may be partially influenced by the temporary states or reaction of each individual during scanning.
We also demonstrated large contributions of DFC in the default mode, dorsal attention and fronto‐parietal systems to individual fluid intelligence and executive function. The regions identified here are consistent with previous studies (Cole et al., 2012; Crittenden, Mitchell, & Duncan, 2015; Dong, Lin, & Potenza, 2015; Finn et al., 2015; Leskin & White, 2007; Reineberg, Andrews‐Hanna, Depue, Friedman, & Banich, 2015; Spreng et al., 2014; Vakhtin, Ryman, Flores, & Jung, 2014; Widjaja, Zamyadi, Raybaud, Snead, & Smith, 2013). Specifically, functional connectivity strength within the default mode network has been found to show an association with fluid intelligence (Cole et al., 2012; Finn et al., 2015), and the activity of the default mode network becomes more active when performing a task requiring more cognitive flexibility than a simple task (Crittenden et al., 2015; Spreng et al., 2014). Functional connectivity strength related to the dorsal attention network is involved in executive control (Reineberg et al., 2015). With regard to the fronto‐parietal network, substantial evidence suggests that connectivity within this network is closely linked to executive function (Dong et al., 2015; Lin, Tseng, Lai, Matsuo, & Gau, 2015; Reineberg & Banich, 2016; Widjaja et al., 2013). Of note, in addition to the contribution of functional integration within a single system, previous studies also found that the complicated interactions among these three higher order functional systems support complex cognitive processes and behaviors. For instance, the interactions between the default mode and dorsal attention networks were increased during intelligence testing (Vakhtin et al., 2014), and the anticorrelations between these two networks can be regulated via the fronto‐parietal network in fitting different task requirements (Gao & Lin, 2012; Spreng, Stevens, Chamberlain, Gilmore, & Schacter, 2010; Spreng, Sepulcre, Turner, Stevens, & Schacter, 2013). More recently, researchers revealed that such anticorrelations and their regulations by the fronto‐parietal network were different across default mode subsystems (Dixon et al., 2017), suggesting the intricate and flexible interactions among these three high‐order functional systems. The findings of this study further suggest that not only the functional architecture or activation but also the dynamic characteristics of the higher order functional systems are crucial for individual higher cognitive processing.
4.3. Different dynamic measurements may capture distinct individual information
In this study, we used three dynamic measurements to systematically investigate time‐varying characteristics of functional connectivity. Our analyses revealed that three different dynamic measurements showed divergent abilities in individual identification and cognitive prediction, suggesting these three dynamic characteristics may capture different aspects of dynamic features of functional connectivity. DFC‐Str, estimated as the averaged strength across time windows, is algorithmically close to static functional connectivity, which captures the basic skeleton of the chronnectome. The sensitive predictive ability of DFC‐Str for fluid intelligence is in line with previous findings based on static functional connectivity (Cole et al., 2012; Finn et al., 2015; Song et al., 2008). DFC‐Var measures the overall fluctuating level for each functional connectivity across time, which is similar to the power of fluctuation of correlation across time windows (Elton & Gao, 2015). We found that DFC‐Var can significantly predict individual executive function, which is consistent with the findings of a recent study (Nguyen et al., 2017). DFC‐Sta measures the tendency to maintain a metastable state during a short period of time (Allen et al., 2014) and might be associated with the transition between different states. Furthermore, it is worth noting that DFC‐Var could predict individual performance in executive function, while DFC‐Str (numerically closer to static functional connectivity) could predict fluid intelligence, and such divergent predictive abilities toward different cognitive performances might suggest that individual inherent traits captured by the chronnectome are different from that captured by static functional connectivity. Similarly, previous studies suggested that static and dynamic aspects of functional connectivity might simultaneously capture individual information about stably inherent traits (e.g., abilities and tendencies) and ongoing conscious or unconscious states, with the DFC more involved in the latter (Elton & Gao, 2015; Kucyi, 2017). For example, Kucyi Davis (2014) demonstrated that the mean strength of static functional connectivity (numerically close to DFC‐Str) within the default mode network is more associated with the general tendency to mind‐wandering while the dynamic variability across time tends to reflect the degree of ongoing mind‐wandering. Given the possibility of different degree of mind‐wandering in two scanning sessions within individuals and because DFC is more involved in such ongoing mind‐wandering states than the static connectome, mind‐wandering might be one of the potential reasons for the lower identification accuracy in DFC‐Sta and DFC‐Var than in DFC‐Str. In this study, our findings might provide further evidence that the static connectome tends to reflect stably inherent traits, while the chronnectome captures more ongoing states.
In addition to divergent abilities in individual identification and cognition prediction, previous studies have reported that the mean strength and variability of functional connectivity showed divergent alterations in skill learning (Shen et al., 2016) and in neurological disorders, such as mild traumatic brain injury (Mayer et al., 2015). Specifically, Shen et al. (2016) found that the variability in DFC, instead of the mean connectivity strength, could effectively distinguish taxi drivers from nondrivers. Mayer et al. (2015) demonstrated that the variability, rather than the strength, of functional connectivity across resting‐state functional systems had a decreasing trend in patients with mild traumatic brain injury. Further, using a principal component analysis across the individuals in Sessions 1 and 2 separately, we found that although DFC‐Str was similar to the static functional connectivity strength, neither DFC‐Sta nor DFC‐Var can be explained by the same factor as the static functional connectivity strength (Supporting Information, Table S1). Together with our findings, these lines of evidence suggest that different dynamic measurements might reflect distinct individual inherent characteristics of the brain and behavior.
Recent studies have probed the underlying physiological and structural mechanisms of functional network dynamics in terms of different measurements. For instance, Liang et al. (2013) found tight coupling between regional cerebral blood flow and functional connectivity strength (close to DFC‐Str) during rest and its modulation in response to increasing task demands. An infusion of the N‐methyl‐D‐aspartate (NMDA) glutamate receptor antagonist ketamine in healthy subjects can result in enhanced functional connectivity strength (Driesen et al., 2013) and increased dynamic brain network flexibility (Braun et al., 2016). Intriguingly, in the resting state, the strength of DFC with direct structural connections has been found to be generally stronger than without direct structural connections, whereas the variability in DFC is the opposite (Liao et al., 2015). Similar findings were also found in macaques (Shen et al., 2015a, 2015b), suggesting that different dynamic measurements might have different underlying structural bases. Given the distinct identification and cognitive prediction abilities of different measurements of DFC, future works should be conducted to systematically and comprehensively ascertain the convergence and divergence of the structural and physiological mechanisms underlying different dynamic characteristics of intrinsic functional connectivity.
4.4. Methodological considerations
Several issues require further consideration. First, several confounding factors might influence the results of DFC analyses, such as parcellation schemes, sliding window widths, head motion (Laumann et al., 2017) and global signal removal (Chai, Castanon, Ongur, & Whitfield‐Gabrieli, 2012; Scholvinck, Maier, Ye, Duyn, & Leopold, 2010). Here, using data obtained from two repeated scanning sessions for the same group, we evaluated the effects of these possible influencing factors on our results and found that most of the findings remained robust (Figure 5). Nevertheless, future studies are required to propose better approaches to minimize noise in estimating the dynamic BOLD signal and connectivity and to evaluate the optimal parameters in dynamic network analysis approaches. Second, different dynamic measurements showed distinct abilities for individual characterization in our work. It is worthwhile to further explore their underlying physiological or structural substrates using multimodal imaging and simultaneous EEG‐fMRI data, which can help us better understand and interpret the BOLD‐based dynamic mechanisms in the brain. Third, we focused our exploration on a cohort of young, healthy adults (22–35 years old). Exploring individual variability in DFC in a group with a broader age range would delineate the normal developmental trajectory of the individual variability in DFC and would further improve our understanding of the formation and development of individual differences in lifespan. Finally, our findings further support the notion that DFC could provide complementary individual information distinct from static functional connectivity. A combination of dynamic and static network analyses is certainly worth applying to diseased populations, which may provide more comprehensive insights to deepen our understanding of the pathological mechanism and exploring potential predictive neuroimaging biomarkers for the clinical evaluation of brain diseases.
Supporting information
Additional Supporting Information may be found online in the supporting information tab for this article.
Supporting Information
ACKNOWLEDGMENT
The authors would like to thank Zaixu Cui, Tengda Zhao, and Xindi Wang for their helps with data analyses. Data were provided by the Human Connectome Project, WU‐Minn Consortium (Principal Investigators: David Van Essen and Kamil Ugurbil; 1U54MH091657) funded by the 16 NIH Institutes and Centers that support the NIH Blueprint for Neuroscience Research; and by the McDonnell Center for Systems Neuroscience at Washington University.
Liu J, Liao X, Xia M, He Y. Chronnectome fingerprinting: Identifying individuals and predicting higher cognitive functions using dynamic brain connectivity patterns. Hum Brain Mapp. 2018;39:902–915. 10.1002/hbm.23890
Funding information National Natural Science Foundation of China, Grant/Award Numbers: 81620108016, 81401479, 91432115, 81671767, 31521063; Beijing Natural Science Foundation, Grant/Award Numbers: Z151100003915082, Z161100004916027, Z161100000216152; Beijing Brain Project, Grant/Award Number: Z161100000216125; Changjiang Scholar Professorship Award, Grant/Award Number: T2015027; China Postdoctoral Science Foundation, Grant/Award Number: 2016T90056; Fundamental Research Funds for the Central Universities, Grant/Award Numbers: 2015KJJCA13, 2017XTCX04
REFERENCES
- Airan, R. D. , Vogelstein, J. T. , Pillai, J. J. , Caffo, B. , Pekar, J. J. , & Sair, H. I. (2016). Factors affecting characterization and localization of interindividual differences in functional connectivity using MRI. Human Brain Mapping, 37, 1986–1997. [DOI] [PMC free article] [PubMed] [Google Scholar]
- Allen, E. A. , Damaraju, E. , Plis, S. M. , Erhardt, E. B. , Eichele, T. , & Calhoun, V. D. (2014). Tracking whole‐brain connectivity dynamics in the resting state. Cerebral Cortex, 24, 663–676. [DOI] [PMC free article] [PubMed] [Google Scholar]
- Baldassarre, A. , Lewis, C. M. , Committeri, G. , Snyder, A. Z. , Romani, G. L. , & Corbetta, M. (2012). Individual variability in functional connectivity predicts performance of a perceptual task. Proceedings of the National Academy of Sciences of the United States of America U S A, 109, 3516–3521. [DOI] [PMC free article] [PubMed] [Google Scholar]
- Barnes, K. A. , Anderson, K. M. , Plitt, M. , & Martin, A. (2014). Individual differences in intrinsic brain connectivity predict decision strategy. Journal of Neurophysiology, 112, 1838–1848. [DOI] [PMC free article] [PubMed] [Google Scholar]
- Bassett, D. S. , Wymbs, N. F. , Porter, M. A. , Mucha, P. J. , Carlson, J. M. , & Grafton, S. T. (2011). Dynamic reconfiguration of human brain networks during learning. Proceedings of the National Academy of Sciences of the United States of America U S A, 108, 7641–7646. [DOI] [PMC free article] [PubMed] [Google Scholar]
- Bassett, D. S. , Yang, M. , Wymbs, N. F. , & Grafton, S. T. (2015). Learning‐induced autonomy of sensorimotor systems. Nature Neuroscience, 18, 744–751. [DOI] [PMC free article] [PubMed] [Google Scholar]
- Betzel, R. F. , Fukushima, M. , He, Y. , Zuo, X. N. , & Sporns, O. (2016). Dynamic fluctuations coincide with periods of high and low modularity in resting‐state functional brain networks. NeuroImage, 127, 287–297. [DOI] [PMC free article] [PubMed] [Google Scholar]
- Birn, R. M. , Diamond, J. B. , Smith, M. A. , & Bandettini, P. A. (2006). Separating respiratory‐variation‐related fluctuations from neuronal‐activity‐related fluctuations in fMRI. NeuroImage, 31, 1536–1548. [DOI] [PubMed] [Google Scholar]
- Braun, U. , Schafer, A. , Bassett, D. S. , Rausch, F. , Schweiger, J. I. , Bilek, E. , … Tost, H. (2016). Dynamic brain network reconfiguration as a potential schizophrenia genetic risk mechanism modulated by NMDA receptor function. Proceedings of the National Academy of Sciences of the United States of America U S A, 113, 12568–12573. [DOI] [PMC free article] [PubMed] [Google Scholar]
- Braun, U. , Schafer, A. , Walter, H. , Erk, S. , Romanczuk‐Seiferth, N. , Haddad, L. , … Bassett, D. S. (2015). Dynamic reconfiguration of frontal brain networks during executive cognition in humans. Proceedings of the National Academy of Sciences of the United States of America U S A, 112, 11678–11683. [DOI] [PMC free article] [PubMed] [Google Scholar]
- Calhoun, V. D. , & Adali, T. (2016). Time‐varying brain connectivity in fMRI data: Whole‐brain data‐driven approaches for capturing and characterizing dynamic states. IEEE Signal Processing Magazine, 33, 52–66. [Google Scholar]
- Calhoun, V. D. , Miller, R. , Pearlson, G. , & Adali, T. (2014). The Chronnectome: Time‐varying connectivity networks as the next frontier in fMRI data discovery. Neuron, 84, 262–274. [DOI] [PMC free article] [PubMed] [Google Scholar]
- Chai, X. J. , Castanon, A. N. , Ongur, D. , & Whitfield‐Gabrieli, S. (2012). Anticorrelations in resting state networks without global signal regression. NeuroImage, 59, 1420–1428. [DOI] [PMC free article] [PubMed] [Google Scholar]
- Chang, C.‐C. , & Lin, C.‐J. (2011). LIBSVM: A library for support vector machines. ACM Transactions on Intelligent Systems and Technology, 2, 27. [Google Scholar]
- Chang, C. , Liu, Z. , Chen, M. C. , Liu, X. , & Duyn, J. H. (2013). EEG correlates of time‐varying BOLD functional connectivity. NeuroImage, 72, 227–236. [DOI] [PMC free article] [PubMed] [Google Scholar]
- Chen, T. , Cai, W. , Ryali, S. , Supekar, K. , & Menon, V. (2016). Distinct global brain dynamics and spatiotemporal organization of the salience network. PLoS Biology, 14, e1002469. [DOI] [PMC free article] [PubMed] [Google Scholar]
- Cole, M. W. , Reynolds, J. R. , Power, J. D. , Repovs, G. , Anticevic, A. , & Braver, T. S. (2013). Multi‐task connectivity reveals flexible hubs for adaptive task control. Nature Neuroscience, 16, 1348–1355. [DOI] [PMC free article] [PubMed] [Google Scholar]
- Cole, M. W. , Yarkoni, T. , Repovs, G. , Anticevic, A. , & Braver, T. S. (2012). Global connectivity of prefrontal cortex predicts cognitive control and intelligence. The Journal of Neuroscience: The Official Journal of the Society for Neuroscience, 32, 8988–8999. [DOI] [PMC free article] [PubMed] [Google Scholar]
- Crittenden, B. M. , Mitchell, D. J. , & Duncan, J. (2015). Recruitment of the default mode network during a demanding act of executive control. eLife, 4, e06481. [DOI] [PMC free article] [PubMed] [Google Scholar]
- Cui, Z. , Su, M. , Li, L. , Shu, H. , & Gong, G. (2017). Individualized prediction of reading comprehension ability using gray matter volume. Cerebral Cortex, 1–17. [DOI] [PMC free article] [PubMed] [Google Scholar]
- Damaraju, E. , Allen, E. A. , Belger, A. , Ford, J. M. , McEwen, S. , Mathalon, D. H. , … Calhoun, V. D. (2014). Dynamic functional connectivity analysis reveals transient states of dysconnectivity in schizophrenia. NeuroImage. Clinical, 5, 298–308. [DOI] [PMC free article] [PubMed] [Google Scholar]
- Davison, E. N. , Turner, B. O. , Schlesinger, K. J. , Miller, M. B. , Grafton, S. T. , Bassett, D. S. , & Carlson, J. M. (2016). Individual differences in dynamic functional brain connectivity across the human lifespan. PLoS Computational Biology, 12, e1005178. [DOI] [PMC free article] [PubMed] [Google Scholar]
- Dixon, M. L. , Andrews‐Hanna, J. R. , Spreng, R. N. , Irving, Z. C. , Mills, C. , Girn, M. , & Christoff, K. (2017). Interactions between the default network and dorsal attention network vary across default subsystems, time, and cognitive states. NeuroImage, 147, 632–649. [DOI] [PubMed] [Google Scholar]
- Dong, G. , Lin, X. , & Potenza, M. N. (2015). Decreased functional connectivity in an executive control network is related to impaired executive function in Internet gaming disorder. Progress in Neuro‐Psychopharmacology & Biological Psychiatry, 57, 76–85. [DOI] [PMC free article] [PubMed] [Google Scholar]
- Dosenbach, N. U. , Nardos, B. , Cohen, A. L. , Fair, D. A. , Power, J. D. , Church, J. A. , … Schlaggar, B. L. (2010). Prediction of individual brain maturity using fMRI. Science, 329, 1358–1361. [DOI] [PMC free article] [PubMed] [Google Scholar]
- Driesen, N. R. , McCarthy, G. , Bhagwagar, Z. , Bloch, M. , Calhoun, V. , D'souza, D. C. , … Krystal, J. H. (2013). Relationship of resting brain hyperconnectivity and schizophrenia‐like symptoms produced by the NMDA receptor antagonist ketamine in humans. Molecular Psychiatry, 18, 1199–1204. [DOI] [PMC free article] [PubMed] [Google Scholar]
- Elton, A. , & Gao, W. (2015). Task‐related modulation of functional connectivity variability and its behavioral correlations. Human Brain Mapping, 36, 3260–3272. [DOI] [PMC free article] [PubMed] [Google Scholar]
- Erus, G. , Battapady, H. , Satterthwaite, T. D. , Hakonarson, H. , Gur, R. E. , Davatzikos, C. , & Gur, R. C. (2015). Imaging patterns of brain development and their relationship to cognition. Cerebral Cortex (New York, N.Y.: 1991), 25, 1676–1684. [DOI] [PMC free article] [PubMed] [Google Scholar]
- Finn, E. S. , Shen, X. , Scheinost, D. , Rosenberg, M. D. , Huang, J. , Chun, M. M. , … Constable, R. T. (2015). Functional connectome fingerprinting: Identifying individuals using patterns of brain connectivity. Nature Neuroscience, 18, 1664–1671. [DOI] [PMC free article] [PubMed] [Google Scholar]
- Fox, M. D. , Zhang, D. , Snyder, A. Z. , & Raichle, M. E. (2009). The global signal and observed anticorrelated resting state brain networks. Journal of Neurophysiology, 101, 3270–3283. [DOI] [PMC free article] [PubMed] [Google Scholar]
- Friston, K. J. , Williams, S. , Howard, R. , Frackowiak, R. S. , & Turner, R. (1996). Movement‐related effects in fMRI time‐series. Magnetic Resonance in Medicine, 35, 346–355. [DOI] [PubMed] [Google Scholar]
- Gao, W. , Elton, A. , Zhu, H. , Alcauter, S. , Smith, J. K. , Gilmore, J. H. , & Lin, W. (2014). Intersubject variability of and genetic effects on the brain's functional connectivity during infancy. The Journal of Neuroscience: The Official Journal of the Society for Neuroscience, 34, 11288–11296. [DOI] [PMC free article] [PubMed] [Google Scholar]
- Gao, W. , & Lin, W. (2012). Frontal parietal control network regulates the anti‐correlated default and dorsal attention networks. Human Brain Mapping, 33, 192–202. [DOI] [PMC free article] [PubMed] [Google Scholar]
- Gerraty, R. T. , Davidow, J. Y. , Wimmer, G. E. , Kahn, I. , & Shohamy, D. (2014). Transfer of learning relates to intrinsic connectivity between hippocampus, ventromedial prefrontal cortex, and large‐scale networks. The Journal of Neuroscience: The Official Journal of the Society for Neuroscience, 34, 11297–11303. [DOI] [PMC free article] [PubMed] [Google Scholar]
- Glasser, M. F. , Sotiropoulos, S. N. , Wilson, J. A. , Coalson, T. S. , Fischl, B. , Andersson, J. L. , … Jenkinson, M. (2013). The minimal preprocessing pipelines for the Human Connectome Project. NeuroImage, 80, 105–124. [DOI] [PMC free article] [PubMed] [Google Scholar]
- Gogtay, N. , Giedd, J. N. , Lusk, L. , Hayashi, K. M. , Greenstein, D. , Vaituzis, A. C. , … Thompson, P. M. (2004). Dynamic mapping of human cortical development during childhood through early adulthood. Proceedings of the National Academy of Sciences of the United States of America, 101, 8174–8179. [DOI] [PMC free article] [PubMed] [Google Scholar]
- Gonzalez‐Castillo, J. , Hoy, C. W. , Handwerker, D. A. , Robinson, M. E. , Buchanan, L. C. , Saad, Z. S. , & Bandettini, P. A. (2015). Tracking ongoing cognition in individuals using brief, whole‐brain functional connectivity patterns. Proceedings of the National Academy of Sciences, 112, 8762–8767. [DOI] [PMC free article] [PubMed] [Google Scholar]
- Hampson, M. , Driesen, N. R. , Skudlarski, P. , Gore, J. C. , & Constable, R. T. (2006). Brain connectivity related to working memory performance. The Journal of Neuroscience: The Official Journal of the Society for Neuroscience, 26, 13338–13343. [DOI] [PMC free article] [PubMed] [Google Scholar]
- He, Q. , Xue, G. , Chen, C. , Chen, C. , Lu, Z. L. , & Dong, Q. (2013). Decoding the neuroanatomical basis of reading ability: A multivoxel morphometric study. The Journal of Neuroscience: The Official Journal of the Society for Neuroscience, 33, 12835–12843. [DOI] [PMC free article] [PubMed] [Google Scholar]
- Hindriks, R. , Adhikari, M. H. , Murayama, Y. , Ganzetti, M. , Mantini, D. , Logothetis, N. K. , & Deco, G. (2016). Can sliding‐window correlations reveal dynamic functional connectivity in resting‐state fMRI? NeuroImage, 127, 242–256. [DOI] [PMC free article] [PubMed] [Google Scholar]
- Hutchison, R. M. , & Morton, J. B. (2015). Tracking the brain's functional coupling dynamics over development. The Journal of Neuroscience: The Official Journal of the Society for Neuroscience, 35, 6849–6859. [DOI] [PMC free article] [PubMed] [Google Scholar]
- Hutchison, R. M. , Womelsdorf, T. , Allen, E. A. , Bandettini, P. A. , Calhoun, V. D. , Corbetta, M. , … Chang, C. (2013). Dynamic functional connectivity: Promise, issues, and interpretations. NeuroImage, 80, 360–378. [DOI] [PMC free article] [PubMed] [Google Scholar]
- Ibinson, J. W. , Vogt, K. M. , Taylor, K. B. , Dua, S. B. , Becker, C. J. , Loggia, M. , & Wasan, A. D. (2015). Optimizing and interpreting insular functional connectivity maps obtained during acute experimental pain: The effects of global signal and task paradigm regression. Brain Connectivity, 5, 649–657. [DOI] [PMC free article] [PubMed] [Google Scholar]
- Jones, D. T. , Vemuri, P. , Murphy, M. C. , Gunter, J. L. , Senjem, M. L. , Machulda, M. M. , … Jack, C. R. Jr. (2012). Non‐stationarity in the “resting brain's” modular architecture. PLoS One, 7, e39731. [DOI] [PMC free article] [PubMed] [Google Scholar]
- Keilholz, S. D. (2014). The neural basis of time‐varying resting‐state functional connectivity. Brain Connectivity, 4, 769–779. [DOI] [PMC free article] [PubMed] [Google Scholar]
- Kiviniemi, V. , Vire, T. , Remes, J. , Elseoud, A. A. , Starck, T. , Tervonen, O. , & Nikkinen, J. (2011). A sliding time‐window ICA reveals spatial variability of the default mode network in time. Brain Connectivity, 1, 339–347. [DOI] [PubMed] [Google Scholar]
- Kucyi, A. (2017). Just a thought: How mind‐wandering is represented in dynamic brain connectivity. NeuroImage. [DOI] [PubMed] [Google Scholar]
- Kucyi, A. , & Davis, K. D. (2014). Dynamic functional connectivity of the default mode network tracks daydreaming. NeuroImage, 100, 471–480. [DOI] [PubMed] [Google Scholar]
- Laumann, T. O. , Snyder, A. Z. , Mitra, A. , Gordon, E. M. , Gratton, C. , Adeyemo, B. , … Petersen, S. E. (2017). On the stability of BOLD fMRI correlations. Cerebral Cortex, 27, 4719–4732. [DOI] [PMC free article] [PubMed] [Google Scholar]
- Leonardi, N. , & Van De Ville, D. (2015). On spurious and real fluctuations of dynamic functional connectivity during rest. NeuroImage, 104, 430–436. [DOI] [PubMed] [Google Scholar]
- Leskin, L. P. , & White, P. M. (2007). Attentional networks reveal executive function deficits in posttraumatic stress disorder. Neuropsychology, 21, 275–284. [DOI] [PubMed] [Google Scholar]
- Liang, X. , Zou, Q. , He, Y. , & Yang, Y. (2013). Coupling of functional connectivity and regional cerebral blood flow reveals a physiological basis for network hubs of the human brain. Proceedings of the National Academy of Sciences of the United States of America U S A, 110, 1929–1934. [DOI] [PMC free article] [PubMed] [Google Scholar]
- Liang, X. , Zou, Q. , He, Y. , & Yang, Y. (2016). Topologically reorganized connectivity architecture of default‐mode, executive‐control, and salience networks across working memory task loads. Cerebral Cortex, 26, 1501–1511. [DOI] [PMC free article] [PubMed] [Google Scholar]
- Liao, X. , Cao, M. , Xia, M. , & He, Y. (2017). Individual differences and time‐varying features of modular brain architecture. NeuroImage, 152, 94–107. [DOI] [PubMed] [Google Scholar]
- Liao, X. , Yuan, L. , Zhao, T. , Dai, Z. , Shu, N. , Xia, M. , … He, Y. (2015). Spontaneous functional network dynamics and associated structural substrates in the human brain. Frontiers in Human Neuroscience, 9, 478. [DOI] [PMC free article] [PubMed] [Google Scholar]
- Liegeois, R. , Laumann, T. O. , Snyder, A. Z. , Zhou, J. , & Yeo, B. T. T. (2017). Interpreting temporal fluctuations in resting‐state functional connectivity MRI. NeuroImage, 135681. [DOI] [PubMed] [Google Scholar]
- Lin, H. Y. , Tseng, W. Y. , Lai, M. C. , Matsuo, K. , & Gau, S. S. (2015). Altered resting‐state frontoparietal control network in children with attention‐deficit/hyperactivity disorder. Journal of the International Neuropsychological Society, 21, 271–284. [DOI] [PubMed] [Google Scholar]
- Lindquist, M. A. , Xu, Y. , Nebel, M. B. , & Caffo, B. S. (2014). Evaluating dynamic bivariate correlations in resting‐state fMRI: A comparison study and a new approach. NeuroImage, 101, 531–546. [DOI] [PMC free article] [PubMed] [Google Scholar]
- Liu, J. , Xia, M. , Dai, Z. , Wang, X. , Liao, X. , Bi, Y. , & He, Y. (2016). Intrinsic brain hub connectivity underlies individual differences in spatial working memory. Cerebral Cortex, 1–13. [DOI] [PubMed] [Google Scholar]
- Madhyastha, T. M. , Askren, M. K. , Boord, P. , & Grabowski, T. J. (2015). Dynamic connectivity at rest predicts attention task performance. Brain Connectivity, 5, 45–59. [DOI] [PMC free article] [PubMed] [Google Scholar]
- Mayer, A. R. , Ling, J. M. , Allen, E. A. , Klimaj, S. D. , Yeo, R. A. , & Hanlon, F. M. (2015). Static and dynamic intrinsic connectivity following mild traumatic brain injury. Journal of Neurotrauma, 32, 1046–1055. [DOI] [PMC free article] [PubMed] [Google Scholar]
- Mueller, S. , Wang, D. , Fox, M. D. , Yeo, B. T. , Sepulcre, J. , Sabuncu, M. R. , … Liu, H. (2013). Individual variability in functional connectivity architecture of the human brain. Neuron, 77, 586–595. [DOI] [PMC free article] [PubMed] [Google Scholar]
- Murphy, K. , Birn, R. M. , Handwerker, D. A. , Jones, T. B. , & Bandettini, P. A. (2009). The impact of global signal regression on resting state correlations: Are anti‐correlated networks introduced? NeuroImage, 44, 893–905. [DOI] [PMC free article] [PubMed] [Google Scholar]
- Murphy, K. , & Fox, M. D. (2017). Towards a consensus regarding global signal regression for resting state functional connectivity MRI. NeuroImage, 154, 169–173. [DOI] [PMC free article] [PubMed] [Google Scholar]
- Nguyen, T. T. , Kovacevic, S. , Dev, S. I. , Lu, K. , Liu, T. T. , & Eyler, L. T. (2017). Dynamic functional connectivity in bipolar disorder is associated with executive function and processing speed: A preliminary study. Neuropsychology, 31, 73–83. [DOI] [PMC free article] [PubMed] [Google Scholar]
- Nomi, J. S. , Vij, S. G. , Dajani, D. R. , Steimke, R. , Damaraju, E. , Rachakonda, S. , … Uddin, L. Q. (2017). Chronnectomic patterns and neural flexibility underlie executive function. NeuroImage, 147, 861–871. [DOI] [PMC free article] [PubMed] [Google Scholar]
- Power, J. D. , Barnes, K. A. , Snyder, A. Z. , Schlaggar, B. L. , & Petersen, S. E. (2012). Spurious but systematic correlations in functional connectivity MRI networks arise from subject motion. NeuroImage, 59, 2142–2154. [DOI] [PMC free article] [PubMed] [Google Scholar]
- Power, J. D. , Cohen, A. L. , Nelson, S. M. , Wig, G. S. , Barnes, K. A. , Church, J. A. , … Petersen, S. E. (2011). Functional network organization of the human brain. Neuron, 72, 665–678. [DOI] [PMC free article] [PubMed] [Google Scholar]
- Power, J. D. , Mitra, A. , Laumann, T. O. , Snyder, A. Z. , Schlaggar, B. L. , & Petersen, S. E. (2014). Methods to detect, characterize, and remove motion artifact in resting state fMRI. NeuroImage, 84, 320–341. [DOI] [PMC free article] [PubMed] [Google Scholar]
- Power, J. D. , Schlaggar, B. L. , & Petersen, S. E. (2015). Recent progress and outstanding issues in motion correction in resting state fMRI. NeuroImage, 105, 536–551. [DOI] [PMC free article] [PubMed] [Google Scholar]
- Preti, M. G. , Bolton, T. A. , Van, D. , & Ville, D. (2017). The dynamic functional connectome: State‐of‐the‐art and perspectives. NeuroImage, 160, 41–54. [DOI] [PubMed] [Google Scholar]
- Qin, J. , Chen, S. G. , Hu, D. , Zeng, L. L. , Fan, Y. M. , Chen, X. P. , & Shen, H. (2015). Predicting individual brain maturity using dynamic functional connectivity. Frontiers in Human Neuroscience, 9, 418. [DOI] [PMC free article] [PubMed] [Google Scholar]
- Rashid, B. , Damaraju, E. , Pearlson, G. D. , & Calhoun, V. D. (2014). Dynamic connectivity states estimated from resting fMRI Identify differences among Schizophrenia, bipolar disorder, and healthy control subjects. Frontiers in Human Neuroscience, 8, 897. [DOI] [PMC free article] [PubMed] [Google Scholar]
- Reineberg, A. E. , Andrews‐Hanna, J. R. , Depue, B. E. , Friedman, N. P. , & Banich, M. T. (2015). Resting‐state networks predict individual differences in common and specific aspects of executive function. NeuroImage, 104, 69–78. [DOI] [PMC free article] [PubMed] [Google Scholar]
- Reineberg, A. E. , & Banich, M. T. (2016). Functional connectivity at rest is sensitive to individual differences in executive function: A network analysis. Human Brain Mapping, 37, 2959–2975. [DOI] [PMC free article] [PubMed] [Google Scholar]
- Sadaghiani, S. , Poline, J. B. , Kleinschmidt, A. , & D'esposito, M. (2015). Ongoing dynamics in large‐scale functional connectivity predict perception. Proceedings of the National Academy of Sciences of the United States of America U S A, 112, 8463–8468. [DOI] [PMC free article] [PubMed] [Google Scholar]
- Scholvinck, M. L. , Maier, A. , Ye, F. Q. , Duyn, J. H. , & Leopold, D. A. (2010). Neural basis of global resting‐state fMRI activity. Proceedings of the National Academy of Sciences of the United States of America U S A, 107, 10238–10243. [DOI] [PMC free article] [PubMed] [Google Scholar]
- Seeley, W. W. , Menon, V. , Schatzberg, A. F. , Keller, J. , Glover, G. H. , Kenna, H. , … Greicius, M. D. (2007). Dissociable intrinsic connectivity networks for salience processing and executive control. The Journal of Neuroscience: The Official Journal of the Society for Neuroscience, 27, 2349–2356. [DOI] [PMC free article] [PubMed] [Google Scholar]
- Shen, H. , Li, Z. , Qin, J. , Liu, Q. , Wang, L. , Zeng, L. L. , … Hu, D. (2016). Changes in functional connectivity dynamics associated with vigilance network in taxi drivers. NeuroImage, 124, 367–378. [DOI] [PubMed] [Google Scholar]
- Shen, K. , Hutchison, R. M. , Bezgin, G. , Everling, S. , & McIntosh, A. R. (2015a). Network structure shapes spontaneous functional connectivity dynamics. Journal of Neuroscience, 35, 5579–5588. [DOI] [PMC free article] [PubMed] [Google Scholar]
- Shen, K. , Misic, B. , Cipollini, B. N. , Bezgin, G. , Buschkuehl, M. , Hutchison, R. M. , … Berman, M. G. (2015b). Stable long‐range interhemispheric coordination is supported by direct anatomical projections. Proceedings of the National Academy of Sciences of the United States of America, 112, 6473–6478. [DOI] [PMC free article] [PubMed] [Google Scholar]
- Shen, X. , Tokoglu, F. , Papademetris, X. , & Constable, R. T. (2013). Groupwise whole‐brain parcellation from resting‐state fMRI data for network node identification. NeuroImage, 82, 403–415. [DOI] [PMC free article] [PubMed] [Google Scholar]
- Song, M. , Zhou, Y. , Li, J. , Liu, Y. , Tian, L. , Yu, C. , & Jiang, T. (2008). Brain spontaneous functional connectivity and intelligence. NeuroImage, 41, 1168–1176. [DOI] [PubMed] [Google Scholar]
- Spreng, R. N. , DuPre, E. , Selarka, D. , Garcia, J. , Gojkovic, S. , Mildner, J. , … Turner, G. R. (2014). Goal‐congruent default network activity facilitates cognitive control. The Journal of Neuroscience: The Official Journal of the Society for Neuroscience, 34, 14108–14114. [DOI] [PMC free article] [PubMed] [Google Scholar]
- Spreng, R. N. , Sepulcre, J. , Turner, G. R. , Stevens, W. D. , & Schacter, D. L. (2013). Intrinsic architecture underlying the relations among the default, dorsal attention, and frontoparietal control networks of the human brain. Journal of Cognitive Neuroscience, 25, 74–86. [DOI] [PMC free article] [PubMed] [Google Scholar]
- Spreng, R. N. , Stevens, W. D. , Chamberlain, J. P. , Gilmore, A. W. , & Schacter, D. L. (2010). Default network activity, coupled with the frontoparietal control network, supports goal‐directed cognition. NeuroImage, 53, 303–317. [DOI] [PMC free article] [PubMed] [Google Scholar]
- Tagliazucchi, E. , von Wegner, F. , Morzelewski, A. , Brodbeck, V. , & Laufs, H. (2012). Dynamic BOLD functional connectivity in humans and its electrophysiological correlates. Frontiers in Human Neuroscience, 6, 339. [DOI] [PMC free article] [PubMed] [Google Scholar]
- Tzourio‐Mazoyer, N. , Landeau, B. , Papathanassiou, D. , Crivello, F. , Etard, O. , Delcroix, N. , … Joliot, M. (2002). Automated anatomical labeling of activations in SPM using a macroscopic anatomical parcellation of the MNI MRI single‐subject brain. NeuroImage, 15, 273–289. [DOI] [PubMed] [Google Scholar]
- Vakhtin, A. A. , Ryman, S. G. , Flores, R. A. , & Jung, R. E. (2014). Functional brain networks contributing to the Parieto‐Frontal Integration Theory of Intelligence. NeuroImage, 103, 349–354. [DOI] [PubMed] [Google Scholar]
- Van Essen, D. C. , Smith, S. M. , Barch, D. M. , Behrens, T. E. , Yacoub, E. , & Ugurbil, K. Consortium WU‐MH (2013). The WU‐Minn human connectome project: An overview. NeuroImage, 80, 62–79. [DOI] [PMC free article] [PubMed] [Google Scholar]
- Varoquaux, G. , Raamana, P. R. , Engemann, D. A. , Hoyos‐Idrobo, A. , Schwartz, Y. , & Thirion, B. (2017). Assessing and tuning brain decoders: Cross‐validation, caveats, and guidelines. NeuroImage, 145, 166–179. [DOI] [PubMed] [Google Scholar]
- Vatansever, D. , Menon, D. K. , Manktelow, A. E. , Sahakian, B. J. , & Stamatakis, E. A. (2015). Default mode dynamics for global functional integration. The Journal of Neuroscience: The Official Journal of the Society for Neuroscience, 35, 15254–15262. [DOI] [PMC free article] [PubMed] [Google Scholar]
- Wei, M. , Qin, J. , Yan, R. , Bi, K. , Liu, C. , Yao, Z. , & Lu, Q. (2015). Association of resting‐state network dysfunction with their dynamics of inter‐network interactions in depression. Journal of Affective Disorders, 174, 527–534. [DOI] [PubMed] [Google Scholar]
- Wei, T. , Liang, X. , He, Y. , Zang, Y. , Han, Z. , Caramazza, A. , & Bi, Y. (2012). Predicting conceptual processing capacity from spontaneous neuronal activity of the left middle temporal gyrus. The Journal of Neuroscience: The Official Journal of the Society for Neuroscience, 32, 481–489. [DOI] [PMC free article] [PubMed] [Google Scholar]
- Weissenbacher, A. , Kasess, C. , Gerstl, F. , Lanzenberger, R. , Moser, E. , & Windischberger, C. (2009). Correlations and anticorrelations in resting‐state functional connectivity MRI: A quantitative comparison of preprocessing strategies. NeuroImage, 47, 1408–1416. [DOI] [PubMed] [Google Scholar]
- Widjaja, E. , Zamyadi, M. , Raybaud, C. , Snead, O. C. , & Smith, M. L. (2013). Abnormal functional network connectivity among resting‐state networks in children with frontal lobe epilepsy. AJNR. American Journal of Neuroradiology, 34, 2386–2392. [DOI] [PMC free article] [PubMed] [Google Scholar]
- Yaesoubi, M. , Miller, R. L. , & Calhoun, V. D. (2015). Mutually temporally independent connectivity patterns: A new framework to study the dynamics of brain connectivity at rest with application to explain group difference based on gender. NeuroImage, 107, 85–94. [DOI] [PMC free article] [PubMed] [Google Scholar]
- Yakovlev, P. I. , & Lecours, A. R. (1967). The myelogenetic cycles of regional maturation of the brain. Regional Development of the Brain in Early Life, 3–70. [Google Scholar]
- Yan, C.‐G. , & Zang, Y.‐F. (2010). DPARSF: A MATLAB toolbox for “pipeline” data analysis of resting‐state fMRI. Frontiers in System Neuroscience, 4, 13. [DOI] [PMC free article] [PubMed] [Google Scholar]
- Yan, C. G. , Cheung, B. , Kelly, C. , Colcombe, S. , Craddock, R. C. , Di Martino, A. , … Milham, M. P. (2013). A comprehensive assessment of regional variation in the impact of head micromovements on functional connectomics. NeuroImage, 76, 183–201. [DOI] [PMC free article] [PubMed] [Google Scholar]
- Yeo, B. T. , Krienen, F. M. , Sepulcre, J. , Sabuncu, M. R. , Lashkari, D. , Hollinshead, M. , … Buckner, R. L. (2011). The organization of the human cerebral cortex estimated by intrinsic functional connectivity. Journal of Neurophysiology, 106, 1125–1165. [DOI] [PMC free article] [PubMed] [Google Scholar]
- Zalesky, A. , Fornito, A. , Cocchi, L. , Gollo, L. L. , & Breakspear, M. (2014). Time‐resolved resting‐state brain networks. Proceedings of the National Academy of Sciences of the United States of America U S A, 111, 10341–10346. [DOI] [PMC free article] [PubMed] [Google Scholar]
- Zeng, L. L. , Shen, H. , Liu, L. , Wang, L. , Li, B. , Fang, P. , … Hu, D. (2012). Identifying major depression using whole‐brain functional connectivity: A multivariate pattern analysis. Brain: A Journal of Neurology, 135, 1498–1507. [DOI] [PubMed] [Google Scholar]
- Zhang, J. , Cheng, W. , Liu, Z. , Zhang, K. , Lei, X. , Yao, Y. , … Feng, J. (2016). Neural, electrophysiological and anatomical basis of brain‐network variability and its characteristic changes in mental disorders. Brain: A Journal of Neurology, 139, 2307–2321. [DOI] [PubMed] [Google Scholar]
Associated Data
This section collects any data citations, data availability statements, or supplementary materials included in this article.
Supplementary Materials
Additional Supporting Information may be found online in the supporting information tab for this article.
Supporting Information