

Abstract
Visual selective attention operates through top–down mechanisms of signal enhancement and suppression, mediated by α‐band oscillations. The effects of such top–down signals on local processing in primary visual cortex (V1) remain poorly understood. In this work, we characterize the interplay between large‐scale interactions and local activity changes in V1 that orchestrates selective attention, using Granger‐causality and phase‐amplitude coupling (PAC) analysis of EEG source signals. The task required participants to either attend to or ignore oriented gratings. Results from time‐varying, directed connectivity analysis revealed frequency‐specific effects of attentional selection: bottom–up γ‐band influences from visual areas increased rapidly in response to attended stimuli while distributed top–down α‐band influences originated from parietal cortex in response to ignored stimuli. Importantly, the results revealed a critical interplay between top–down parietal signals and α–γ PAC in visual areas. Parietal α‐band influences disrupted the α–γ coupling in visual cortex, which in turn reduced the amount of γ‐band outflow from visual areas. Our results are a first demonstration of how directed interactions affect cross‐frequency coupling in downstream areas depending on task demands. These findings suggest that parietal cortex realizes selective attention by disrupting cross‐frequency coupling at target regions, which prevents them from propagating task‐irrelevant information.
Keywords: connectivity, EEG, EEG source imaging, fMRI, Granger causality, partial directed coherence, phase amplitude coupling, selective attention
SIGNIFICANCE STATEMENT
In this work, we demonstrated how selective attention emerges from the interplay between large‐scale brain interactions and local structures of information processing in sensory areas. When visual input is relevant, the visual cortex rapidly propagates attended information through feedforward oscillations in the gamma band. When stimuli are irrelevant, however, the parietal cortex suppresses information processing through inhibitory influences in the alpha band. Importantly, we show that alpha activity from parietal cortex disrupts the coupling between low and high frequencies in visual regions, which in turn determine their amount of feedforward propagation. Our results provide novel insight into how the brain orchestrates selective attention and reveal how the parietal cortex prevents the processing of irrelevant information in other cortical areas.
1. INTRODUCTION
Our visual environment typically contains more information than our perceptual system can handle. Selective attention is therefore a key mechanism to regulate cortical information flow and prioritize the processing of behaviorally relevant stimuli. How the brain accomplishes such selectivity is one of the fundamental questions in cognitive neuroscience.
At the neuronal level, selective attention operates through the enhancement of activity that represents attended information and the suppression of activity for unattended stimuli. Attentional selection, for example, can either increase or attenuate local responses in early sensory areas, depending on whether they convey information that is relevant or irrelevant for the task at hand (Carrasco, 2011; Daffner et al., 2012; Kanwisher & Wojciulik, 2000; Kastner & Ungerleider, 2001; O'Craven, Downing, & Kanwisher, 1999; Smith, Singh, & Greenlee, 2000). A hallmark of such selective mechanism is the differential pattern of event‐related potentials that can be observed on the scalp when a physically identical stimulus is attended or ignored: Attended stimuli often increase the amplitude of early evoked responses (e.g., the P1 component) (Hillyard, Vogel, & Luck, 1998), whereas ignored stimuli evoke a later negative activation, the selection negativity (SN) component (Daffner et al., 2012; Hillyard & Anllo‐Vento, 1998), which underlies an inhibitory response to irrelevant and potentially distracting input.
While the modulatory effects of selective attention on sensory analysis and psychophysical performance have been extensively characterized (Carrasco, 2006, 2011; Desimone & Duncan, 1995; Downing, Liu, & Kanwisher, 2001; Driver, 2001; Maunsell & Treue, 2006; Pascucci & Turatto, 2015; Reynolds & Chelazzi, 2004), a fundamental question remains how selective attention is orchestrated between brain areas and what sources and dynamics underlie the emergence of local attentional modulations.
Neuroimaging and lesion studies have contributed to the identification of two distinct functional networks where modulatory signals of selective attention may originate: the ventral attention network (VAN), which comprises the temporo‐parietal junction and the ventral frontal cortex and is activated by salient and unexpected stimuli, and the dorsal attention network (DAN), which includes the intraparietal sulcus, superior parietal lobule and frontal eye fields and is engaged by the voluntary and top–down control of attention (Corbetta & Shulman, 2002; Ptak & Schnider, 2011; Vossel, Geng, & Fink, 2014). Recent models of attention suggest that when these attentional control systems are activated, their constituent units may use long‐range connections to influence neuronal activity in early sensory areas (Fries, 2009; Vossel et al., 2014).
One way neurons in the attentional network can modulate activity in sensory areas is through coupled oscillations at specific frequencies (Lakatos, Karmos, Mehta, Ulbert, & Schroeder, 2008; Womelsdorf & Fries, 2008). Neuronal oscillations reflect rhythmic synchronization among neuronal ensembles over a wide range of spatial and temporal scales, which may play a crucial role in determining the quality and propagation of sensory signals (Buffalo, Fries, Landman, Buschman, & Desimone, 2011; Foxe & Snyder, 2011; Fries, 2009; Michalareas et al., 2016; Womelsdorf & Fries, 2008). Gamma‐band activity (γ, 30–150 Hz), for instance, has been shown to reflect neuronal processing (Gruber, Müller, Keil, & Elbert, 1999; Jensen, Kaiser, & Lachaux, 2007; Keil, Müller, Ray, Gruber, & Elbert, 1999) and feedforward communication (Bastos et al., 2015; Michalareas et al., 2016), and has been related to perceptual operations (Singer, 1999) and to neuronal states of high excitability (Fries, Reynolds, Rorie, & Desimone, 2001; Tallon‐Baudry, Bertrand, Hénaff, Isnard, & Fischer, 2004; Vossel et al., 2014). Oscillatory activity at lower frequencies (alpha (α) band, 8–14 Hz), in turn, has been implicated in sensory suppression and temporal parsing mechanisms (Haegens et al., 2015; Jensen & Mazaheri, 2010), and has been associated with feedback interactions (Haegens et al., 2015), attentional disengagement (Vanni, Revonsuo, & Hari, 1997), and low states of perceptual receptivity and psychophysical performance (Hanslmayr et al., 2007; Mathewson, Gratton, Fabiani, Beck, & Ro, 2009; Van Dijk, Schoffelen, Oostenveld, & Jensen, 2008). Interestingly, when attention is engaged by relevant stimuli, both a sustained increase in γ power and a decrease in α power have been reported (Bauer, Stenner, Friston, & Dolan, 2014; Foxe, Simpson, & Ahlfors, 1998; Klimesch, Doppelmayr, Russegger, Pachinger, & Schwaiger, 1998; Rajagovindan & Ding, 2011; Thut, Nietzel, Brandt, & Pascual‐Leone, 2006; Wyart & Tallon‐Baudry, 2008).
These functional roles of α and γ activity suggest neuronal oscillations as the candidate mechanisms through which selective attention operates: sources of attentional control may drive enhancing or suppressive signals at specific frequencies, which in turn could interact with rhythmic synchronization and neuronal communication structures in the ascending pathway (Fries, 2005; Siegel, Donner, Oostenveld, Fries, & Engel, 2008; Womelsdorf & Fries, 2008). However, a good understanding of how directed cortical interactions dynamically implement selective attention is currently lacking.
In this work, we investigated the brain dynamics of directed interactions that characterize the emergence of selective attention. We recorded functional magnetic resonance imaging (fMRI) and high‐density EEG separately, while participants either attended to or ignored physically identical stimuli presented at the same spatial location. Stimulus‐evoked EEG source activity was extracted from 20 critical regions of the attentional and perceptual networks.
Dynamic connectivity analysis revealed a rapid emergence of selective directed connections in the γ‐ and α‐bands: feed‐forward interactions in the γ‐band increased in response to attended stimuli and were directed from early visual areas to the lateral occipital and fronto‐parietal cortex; Inhibitory interactions in the α‐band dominated network activity in response to irrelevant stimuli and were orchestrated by parietal cortex. Interestingly, long‐range α‐band interactions from parietal cortex disrupted phase‐amplitude coupling (PAC) between α and γ activity in visual areas, a key mechanism regulating information transmission and neuronal communication (Bonnefond & Jensen, 2015; Dvorak & Fenton, 2014; Jensen & Mazaheri, 2010). Such reduced local αγ‐band asynchrony, in turn led to a suppression of γ‐band interactions from visual areas, effectively inhibiting feed‐forward information flow.
2. MATERIALS & METHODS
2.1. Participants
Sixteen healthy subjects (mean age = 31± 20, 3 female), all right‐handed and with good visual acuity (mean 1.5 ± range 0.8–1.7, as measured with the Freiburg acuity test (Bach, 1996)) took part in the experiment for monetary compensation. Written informed consent was obtained from each participant before the experiment. The study was performed according to the declaration of Helsinki and after approval by the ethics committee of the University of Geneva.
2.2. Experimental design
Stimuli were Gaussian‐windowed sinusoidal gratings (Gabors; σ = 3°, frequency = 3 cycles per degree) presented for 200 ms around a central fixation spot (0.2°). Each Gabor had a contrast of 100% and a variable orientation (maximal −45° to 45° off vertical). The intertrial interval (ITI) varied randomly between 700 and 1,200 ms (fMRI session) or 500 and 1,200 ms (EEG session). There were two conditions depending on whether the Gabor stimulus was relevant or not for the current task. In the Relevant condition, participants had to report the orientation of each Gabor in a two‐choice task (left vs right) by pressing the corresponding key on a response box. In the Irrelevant condition, participants had to detect a color change in the fixation spot (from black to red) occurring on ∼33% of trials during the inter‐stimulus interval between Gabors.
The same task and stimuli were used in separate fMRI and EEG sessions. Stimuli were back‐projected onto a screen (60 Hz, 1,024 × 768 pixels) during fMRI recordings, and presented on a CRT monitor (75 Hz, 1,600 × 1,200 pixels) during the EEG session. Stimulus generation, presentation and timing were controlled with PsychoPy (Peirce, 2008) software run under Python 2.7.
The fMRI session consisted of 16 blocks (8 for each condition) of variable length (between 14.7 and 25.2 s), presented in pseudo‐random order and interleaved with 8 blocks of rest (between 12.6 and 21 s, consecutive task blocks were randomly interleaved with the 8 rest blocks). In the EEG session the two conditions were performed in 4, pseudo‐randomly interleaved blocks of 100 trials. Written task instructions were provided before each block.
The orientation of Gabors in the Relevant condition was determined through an adaptive staircase procedure (Watson & Pelli, 1983) designed to keep participants' accuracy at 83%. In the Irrelevant condition, Gabors were randomly tilted toward the left or right with the offset fixed at threshold estimated in the last staircase procedure.
2.3. fMRI data acquisition and preprocessing
fMRI images were acquired using a whole‐body Tim Trio system (3T; Siemens Healthcare) at the Brain and Behaviour Laboratory at the University of Geneva, with a radio‐frequency (RF) body transmitter and a 32‐channel receiver head coil. Functional runs consisted of 295 volumes with 36 T2*weighted echo planar slices (EPIs; repetition time (TR) = 2,100 ms; time to echo (TE) = 30 ms; flip angle (FA) = 80°; 3.2 mm slice‐thickness with a 0.6 mm gap). After the experimental session, a structural whole‐head image was acquired for each participant (TR = 1,900 ms; TE = 2.27 ms; field of view (FOV) = 256 × 256 mm2; inversion time (TI) = 900 ms; voxel size = 1 × 1 × 1 mm3; sagittal orientation).
Functional and structural images were analyzed with the Statistical Parametric Mapping toolbox (SPM12; University College of London, London, United Kingdom). All EPI volumes were realigned to the mean functional image using a two‐pass procedure to correct for movement artefacts. The mean of the realigned volumes was then co‐registered to the structural image. All images were normalized relative to the standard Montreal Neurological Institute (MNI) space using trilinear interpolation and smoothed with an isotropic 8 mm2 full‐width half‐maximum Gaussian kernel. The time course of cerebrospinal fluid (CSF) and white matter (WM) signals were extracted for each participant before normalization, using individual CSF and WM masks obtained from the standard segmentation procedure in SPM12.
2.4. Statistical analysis: fMRI data
Functional images were submitted to a two‐stage mixed‐effects model (Friston et al., 1994) (GLM). First‐level analysis was performed using a block design with three regressors of interest (the Relevant and Irrelevant conditions and the rest period) modeled with a boxcar function convolved with the canonical hemodynamic response function. The six motion parameters derived from realignment, the CSF and WM signals and a constant term were included in the model as nuisance regressors. A high‐pass filter with cutoff of 512 s was applied to the time‐series of functional images to remove low‐frequency noise while preserving signals at task‐related frequencies.
Task‐related activation maps were obtained from two contrasts of interest (Figure 3). In the Task versus Rest contrast, we computed the difference between activity during the two conditions (Relevant and Irrelevant) and the rest period. In the “Irrelevant vs. Relevant” contrast, we computed the difference between conditions. The combination of these contrasts allowed identifying functional areas that were engaged by the two tasks but also showing differential activity across conditions. The resulting statistical maps were submitted to second‐level group analysis consisting of voxel‐wise comparison across subject (one‐sample t test), treating each subject as a random effect. Statistical significance was assessed at the group‐level using an uncorrected voxel‐based threshold of p < .0001 and a minimum cluster size of 5 voxels. From the resulting group‐statistic, we selected 20 functional peaks of interest (14 from the Task vs Rest and 6 from the Irrelevant vs. Relevant contrast; see Table 1) corresponding to voxels of maximum T‐statistic within spatially segregated clusters and uniquely labeled regions (based on the AAL2 and Neuromorphometrics labels, SPM12). Only cortical and subcortical regions were considered. The coordinates of the 20 peaks selected from group‐statistic were then transformed back from standard to the individual space of each participant by applying the deformation parameters generated after normalization. These 20 locations in individual brains were the nodes in the network used for functional connectivity analysis of EEG source activity (see below).
Figure 3.
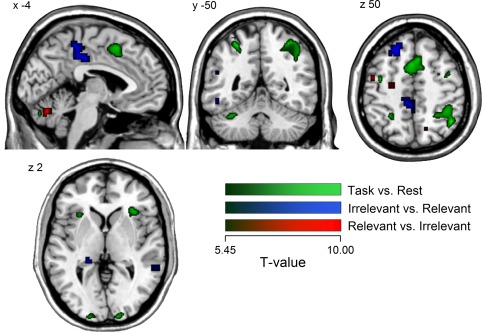
fMRI region of interest selection. Regions with higher activity in both tasks compared to rest are shown in the green color scale. Negative and positive results from the comparison Irrelevant versus Relevant are shown in the blue and red color scales, respectively. Significant voxels (p(unc.) = .0001, minimum cluster size = 5 voxels) are superimposed on a MNI ICMB152 Average Brain atlas using MRIcron software (http://www.mricro.com) (Rorden & Brett, 2000) [Color figure can be viewed at http://wileyonlinelibrary.com]
Table 1.
Maxima of fMRI activation from the group statistic on the contrast Task versus Rest and Irrelevant > Relevant
| MNI coordinates | ||||
|---|---|---|---|---|
| Label | Region | x | y | z |
| Task vs Rest | ||||
| rSPL | Right superior parietal lobule | 45 | −55 | 49 |
| rMFG | Right mediofrontal gyrus | 39 | 8 | 34 |
| SMC | Supplementary motor cortex | 6 | 20 | 46 |
| lSPL | Left superior parietal lobule | −27 | −52 | 55 |
| lPoC | Left post‐central gyrus | −33 | −37 | 43 |
| lV1 | Left V1 | −15 | −100 | −2 |
| lPrC | Left pre‐central gyrus | −39 | −4 | 49 |
| rV1 | Right V1 | 15 | −100 | −2 |
| rSFG | Right superior frontal gyrus | 24 | 5 | 55 |
| rIns | Right Insula | 33 | 26 | 1 |
| rITG | Right infero temporal gyrus | 60 | −55 | −8 |
| lIns | Left insula | −30 | 23 | 1 |
| lIOG | Left inferior occipital gyrus | −36 | −85 | −14 |
| rTMid | Right middle temporal (fusiform) | 42 | −73 | −2 |
| Irrelevant > Relevant | ||||
| mCC | Middle cingulate cortex | −3 | −25 | 40 |
| lSFG | Left superior frontal gyrus | −21 | 32 | 49 |
| lTInf | Left inferior temporal gyrus | −48 | −43 | −14 |
| rMTG | Right middle temporal gyrus | 57 | −43 | 4 |
| lMTG | Left middle temporal gyrus | −57 | −58 | 19 |
| lThal | Left thalamus | −21 | −34 | 1 |
Note. Abbreviations: l = left; r = right; m = middle.
Only cortical and subcortical peaks within spatially segregated clusters and uniquely labeled regions were selected and used to define ROIs for connectivity analysis. Regions from the Relevant > Irrelevant contrast were not included because of their proximity and overlap with ROIs from the other two contrasts. Regions are labeled using the neuromorphometrics labeling in SPM12.
2.5. EEG data acquisition and preprocessing
EEG data were acquired on a separate day with a 256 channel EGI Geodesic setup (EGI Eugene, OR). Recordings were digitized at 1,000 Hz and referenced against the Cz electrode, the impedance was kept below 50 kΩ. Electrode positions were digitized in 3D using a photogrammetry system (EGI Eugene, OR). The cheek and lower neck electrodes were excluded, leaving 204 electrodes for further analysis. Four participants were excluded from further analysis due to excessive noise in the data. For the remaining 12 participants, EEG recordings were preprocessed using a combination of functions from EEGLAB (Delorme & Makeig, 2004) and custom scripts in Matlab (The Mathworks, Natick, MA).
Prior to signal preprocessing, noisy EEG channels (as determined through careful visual inspection) were removed from the dataset (mean number of channels removed across participants: 19.5 ± 4.6). Data were then down‐sampled to 200 Hz after applying an antialiasing filter with cutoff frequency of 160 Hz and transition bandwidth of 80 Hz, DC‐corrected and high‐pass filtered at 0.1 Hz with a forward and reverse noncausal FIR filter. EEG epochs were extracted from the continuous dataset and time‐locked from −500 to 1,000 ms relative to the onset of each Gabor. Individual epochs containing nonstereotyped artifacts, peri‐stimulus eye blinks, and eye movements were identified by visual inspection and removed from further analysis (mean number of epochs removed across participants: 33.4 ± 14.3). Data were then re‐referenced to the average potential of all electrodes at each time point (Lehmann & Skrandies, 1980; Michel et al., 2004) and cleaned from line and monitor noise (50 and 75 Hz, plus harmonics) with an adaptive filter (Cleanline plugin for EEGLAB). Because physiological artifacts such as eye blinks, horizontal and vertical eye movements, muscle potentials, and microsaccades may strongly compromise the investigation of high‐frequency oscillatory components (Hipp & Siegel, 2013; Keren, Yuval‐Greenberg, & Deouell, 2010; Yuval‐Greenberg, Tomer, Keren, Nelken, & Deouell, 2008); in a final step, we performed ICA‐based removal of cranial and ocular artifacts following recent guidelines (Hipp & Siegel, 2013) and using the extended Infomax process implemented in EEGLAB (average number of components obtained across participants: 183.5 ± 4.6; average number of rejected components: 20.3 ± 12.5). It has been shown that while ICA may have a negligible impact on functional connectivity measures such as the one employed here (Leistritz et al., 2013), a careful ICA cleaning and the projection of EEG data into source space can efficiently remove the confounding effect of cranial and ocular muscle artifacts during the investigation of visual γ activity (Hipp & Siegel, 2013). After ICA cleaning, excluded channels were interpolated using the nearest‐neighbor spline method.
Subject‐specific lead fields were computed from a simplified realistic head model (locally spherical model with anatomical constraints, LSMAC) derived from individual MRI images, while confining the solution space to the grey matter without constraining source orientation (Brunet, Murray, & Michel, 2011). For each participant, we co‐registered the digitized 3D electrode layout with the structural MRI, defining a solution space of about 5,000 solution points. Distributed source activity was estimated at each solution point with a linear inverse solution (weighted minimum norm, regularization parameter: 12; Cartool software (Brunet et al., 2011)). Scalar current density values were obtained by projecting instantaneous 3D dipoles to the predominant evoked dipole direction (between 50 and 500 ms after stimulus onset (Coito et al., 2015; Plomp, Leeuwen, & Ioannides, 2010)). For source‐level functional connectivity analysis, we extracted source activity from source points located inside a sphere (radius = 10 mm) around each one of the 20 fMRI peaks. The solution point with the highest relative amplitude within each that sphere was then selected, using the average difference between the magnitude of evoked (between 70 and 150 ms) and baseline (between −100 and 0 ms) activity across trials. Data in the resulting set of 20 solution points of interest were then z‐scored across channels and time within participants, and submitted to directed connectivity analysis.
2.6. Statistical analysis: EEG data
The analysis of EEG scalp potentials was restricted to a cluster of electrodes in right and left occipito‐parietal regions (n = 110, see Figure 2.A, right panel). This cluster was determined according to previous work showing EEG components related to selective attention at occipital and parietal electrodes, in a comparable experimental design (Anllo‐Vento, Luck, & Hillyard, 1998; Daffner et al., 2012). Event‐related potentials (ERPs) within the cluster were separately averaged for epochs of the Relevant and Irrelevant conditions. A difference wave was then computed for each participant by subtracting ERPs to the Irrelevant condition from those to the Relevant condition. Individual difference waves were submitted to group‐level statistic by means of multiple t tests, comparing the difference at each time point against zero (p < .05, corrected using false discovery rate).
Figure 2.
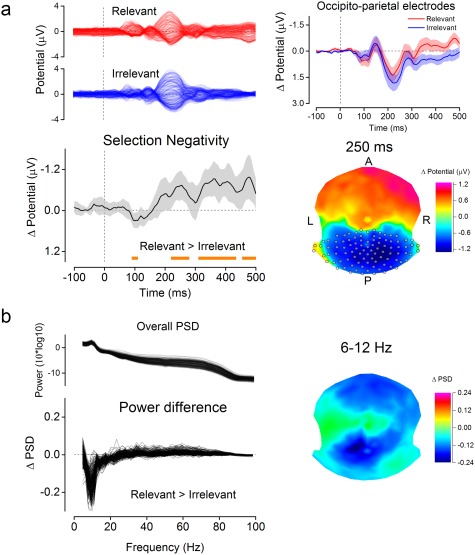
Attentional modulations of evoked potentials and power spectrum. (a) Evoked potentials for all EEG channels (top‐left) and the activity evoked by the Gabor stimuli in the two conditions at occipito‐parietal sites (top‐right, red for the Relevant and blue for the Irrelevant condition). The Selection Negativity (SN) component observed in a subset of occipito‐parietal electrodes (gray circles, bottom‐right panel) is shown in the bottom‐left panel with the corresponding SN scalp topography at 250 ms (bottom‐right panel). Significant differences between evoked activity in the Relevant and Irrelevant condition are highlighted by the orange bottom line (p(FDR) = .05). Shaded areas are 95% confidence intervals of the mean. (b) The power spectrum density across the whole epoch (PSD, top‐right panel) with the difference in the PSD between conditions for all EEG channels (Relevant minus Irrelevant, bottom‐left panel) and the topography of the increased α activity (6–12 Hz) in the Irrelevant condition at posterior sites (right panel) [Color figure can be viewed at http://wileyonlinelibrary.com]
The power spectral density (Figure 2.B) was estimated across the entire EEG epoch separately for each channel and condition by means of Fourier transformation.
2.7. Directed connectivity
To measure dynamics of directed connectivity between nodes in the Irrelevant and Relevant conditions we used a formulation of partial directed coherence (Baccalá & Sameshima, 2001) (PDC) based on time‐varying multivariate autoregressive modeling (tvMVAR) through Kalman filtering (Milde et al., 2010). PDC is a frequency‐domain descriptor of directed linear relationships among time series in a network of interacting structures. It is based on the concept of Granger causality (Bressler & Seth, 2011; Granger, 1969) which infers causality in terms of cross‐prediction between pairs of signals: signal A Granger‐causes signal B if past values of A can be used to improve predictions of future values of B.
The computation of PDC follows the MVAR modeling of a multivariate time series, Y, and the estimation of a set of coefficients, A ( k ), describing the linear prediction effect of kth past samples of Y, Y ( t‐k ), on predicting Y ( t ). The ijth element of A ( k ), aij ( k ), quantifies directed interactions in the time domain from element i to j, up to some lag k, with k > 0 (i.e., excluding instantaneous effects to guard against problems from volume conduction (Vinck et al., 2015)). A ( k ) parameters were estimated through a Kalman filter‐based MVAR approach (Milde et al., 2010), which yields high accuracy in modeling nonstationary, high‐dimensional multivariate processes, resulting in estimates of the MVAR model at each time point (tvMVAR).tvMVAR modeling requires the choice of an optimal lag order k and an adaptation constant c regulating the tradeoff between the speed and stability of tvMVAR estimates (Milde et al., 2010). To determine the optimal combination of k and c, we used a two‐step procedure. In the first step, multiple tvMVAR models of increasing order (from k = 1 to k = 30) were fitted to all the epochs of each participant using the method of ordinary least squares (OLS). We then used a combination of three information criteria, the Bayesian Information Criterion (BIC), the Akaike Information Criterion (AIC) and the minimum description length (MDL) to estimate the lag order k that minimizes each criterion for each participant. A common model order was chosen as the optimal k corresponding to the 70th percentile among all ks selected by the information criteria, across participants. According to this procedure, we selected a fixed model order of k = 10 (50 ms) as a tradeoff between sufficient time–frequency resolution and over‐parametrization.
In the second step, for each epoch and participant in the two conditions, we computed a series of Kalman filter‐based tvMVAR models with fixed model order (k = 10) but increasing c (from 0.001 to 0.4, in 10 logarithmic steps). The model performance at each c was evaluated based on two indexes of model fit. The first index is a measure of the goodness‐of‐fit, the relative explained variance (RExV) (Schlogl, Roberts, & Pfurtscheller, 2000):
| (1) |
where MSE is the mean square of the model residuals and MSY is the variance of the multivariate time series Y. The RExV indicates the percentage of variance in the signal that is accounted for by the tvMVAR model. The second index, called percent consistency (PC; Ding, Bressler, Yang, & Liang, 2000), measures the percentage of the correlational structure in the data that is captured by the MVAR model and is expressed as
| (2) |
where is the vector of all pairwise cross‐correlations among signals predicted by the tvMVAR model, up to a lag k = 50, and P is the vector of all pairwise cross‐correlations in the real data. The RExV and PC for each adaptation constant were averaged across participants and the optimal c was selected as the one for which both the RExV and PC were higher than 85%. According to this procedure, we selected an adaptation constant of c = 0.1 which is consistent with the range reported in previous work (Astolfi et al., 2008).
Thus, combined together, the model order selection based on information criteria and the choice of c based on RExV and PC provided a parsimonious MVAR model to best explain variability and cross‐correlational structures in the data. For each participant, the MVAR coefficients and PDC were estimated on individual epochs and epochs for which the MVAR model had PC lower than 70% were discarded from further analysis (mean across participants: 3.9 ± 4.7%).
Time‐varying PDC was then computed from the frequency‐transformed A ( k ) parameters as
| (3) |
where is the spectral representation of the coefficient matrix A ( k ) and quantifies the interaction from element j to i at frequency and time t. The square exponents enhance the accuracy and stability of the estimates (Astolfi et al., 2006) and the denominator allows the normalization of outgoing connections by the inflows (the normalization denominator represents all incoming connections, from m = 1 to N), which improves the accuracy and physiological plausibility of the results (Plomp, Quairiaux, Michel, & Astolfi, 2014).
As a final step, single‐trial, scaled PDC estimates (from 0 to 1) were multiplied by the spectral power (SP) of each node. For each trial and node, SP was computed in the 6–80 Hz frequency range using a multitaper Hanning window function with a sliding window of 5 ms and a window length of 250 ms. The obtained SP were scaled (from 0 to 1) and multiplied by PDC at the single epoch level. This yielded a weighted version of PDC (wPDC) which embeds information about the predominant frequencies of interaction and whose physiological plausibility has been previously validated in animal models (Plomp et al., 2014, p. 2014).
Single‐trial estimates of wPDC were then averaged separately across conditions resulting in a set of individual matrices (node × node × time × frequency) summarizing the time‐varying directed interactions among all nodes in the Relevant and Irrelevant conditions.
2.8. Statistical analysis: wPDC
Statistical analysis of wPDC as a function of the Relevant and Irrelevant conditions was restricted to a time window of interest (from −50 ms to 500 ms from stimulus onset, discarding a number of time frames equivalent to the model order) and performed by means of a nonparametric, cluster‐based permutation test which controlled over the false‐positive rate in a multiple comparison setting (Maris & Oostenveld, 2007; Park et al., 2016). The general approach is as follows: for the contrast Relevant minus Irrelevant, a paired t test across participants is computed for each time–frequency point of each cell of the wPDC matrix. The resulting statistic is then thresholded (here at p < .05) and adjacent significant time–frequency points are combined to form clusters. For each cluster, a new statistic is then obtained as the sum of all T values in the time‐frequency points that define the cluster. This procedure was repeated (n = 5,000) while shuffling conditions across participants and retaining the maximum cluster‐forming T value obtained. The proportion of surrogate clusters with maximum T larger than the one observed defines the corrected p value (maximum T statistic). The permutation test was performed to identify clusters of significant differences in wPDC between conditions (p < .05) in the 6–80 Hz frequency range.
We summarized results from the thresholded wPDC matrix as follows. First, we separately summed all significant interactions across nodes in the Relevant and Irrelevant condition and we combined them into a single matrix, summarizing global network dynamics and frequency distribution as a function of whether the Gabor stimulus was attended or ignored (Figure 4a). As a second step, we computed the summed outflow for each node in the condition showing the larger number of significant interactions (the Irrelevant condition). The summed outflow was calculated as the sum of significant outgoing wPDC values from each node at each time point, averaged across a frequency band of interest (6–16 Hz, see Figure 4b). In a final step, we assessed the direction of information flow across time from the two predominant drivers in the Irrelevant condition (left and right SPL, see Figure 4c). Three directions of interest were defined according to the relative position in the axial plane of each receiver node with respect to the two parietal drivers: an “interhemispheric” direction, assessing the degree of cross‐interaction between the two nodes of interest, a “feedback” and a “feedforward” direction, summarizing the amount of parietal driving toward posterior and anterior nodes, respectively. Only cortical nodes were included in this summary.
Figure 4.
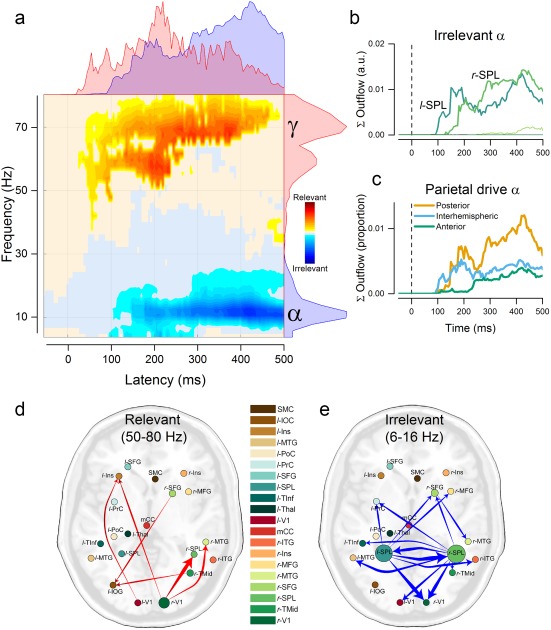
Time‐varying directed connectivity results. (a) Time–frequency plot summarizing the difference in global network dynamics across conditions. The summed strength of all interactions that showed significant attentional modulation (p < .05, cluster‐based correction for multiple comparisons) is shown in the yellow‐red color scale for the Relevant > Irrelevant comparison and in the cyan‐blue color scale for the Irrelevant > Relevant comparison. Marginal plots on the right represent time‐collapsed frequency distributions of significant interactions. Marginal plots on the top are frequency‐collapsed distributions of interactions over time. Marginal distributions are plotted separately for the Relevant (red) and Irrelevant (blue) condition. (b) Sum of the total α outflow (6–16 Hz) in time from each node in the Irrelevant condition. (c) Direction of α interactions from parietal nodes over time. (d) Average of significantly increased interactions in the γ‐band during the Relevant condition. (e) α‐band connections with average strength below 1% of the total network are not shown [Color figure can be viewed at http://wileyonlinelibrary.com]
2.9. Phase‐amplitude coupling (PAC)
Several algorithms have been proposed to extract phase‐amplitude coupling measures based on different approaches (Dvorak & Fenton, 2014). Here we used the raw modulation index (MIraw) (Canolty & Knight, 2010; Onslow, Bogacz, & Jones, 2011; Penny, Duzel, Miller, & Ojemann, 2008) which has better statistical properties than the normalized MI (Penny et al., 2008) and because within‐condition normalization or surrogate statistics is not suitable for comparing PAC between experimental conditions. The MIraw was computed for two nodes of interest (left and right V1). Source activity in the two nodes was filtered at a set of frequencies in the α‐ (6–16 Hz, in steps of 1 Hz) and γ‐band (50–80 Hz, in steps of 2 Hz) via convolution with complex Morlet Wavelets (width = 7) (Lachaux, Rodriguez, Martinerie, Varela, & others, 1999; Onslow et al., 2011). To avoid edge artifacts, filtering was applied on a time window of interest (from 0 to 500 ms after stimulus onset) plus additional buffer windows of 500 ms before and after. The instantaneous low‐frequency phase (Φα) and high‐frequency amplitude (A γ) were extracted from the filtered waves and a composite signal
| (4) |
was created at each time point t and epoch n, for all combinations of low and high frequencies of interest. The MIraw index was then calculated separately for the two conditions as
| (5) |
where n[1, …, N] are the trials of each condition and denotes the 10% trimmed mean length of vector Z, across time bins t, which we found to be more robust and less sensitive to spurious coupling. This procedure yielded a set of individual matrices quantifying the degree of phase‐amplitude coupling among α and γ frequencies in the two conditions. Statistical testing of the difference between conditions (Relevant minus Irrelevant, see Figure 5b, left panel) was performed at the group‐level using permutations (n = 50,000) and the maximum T‐statistic applied over the whole matrix.
Figure 5.
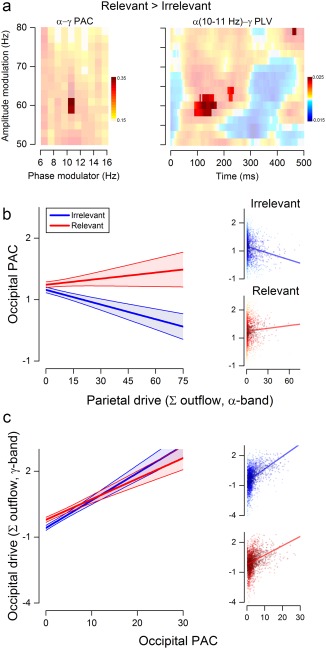
Parieto‐occipital interactions affect occipital phase amplitude coupling. (a) Differences in occipital PAC (left panel) and PLV (right panel) across conditions. PAC is shown for low‐frequency phases (6–16 Hz) and high‐frequency amplitudes (50–80 Hz) of interest. PLV is shown for low‐frequencies phases of significant PAC (10–11 Hz) and high‐frequencies amplitudes (50–80 Hz). Opaque areas represent regions of significant PAC (p < .05, maximum T‐statistic) and PLV (p(unc.) < .05, permutation‐based statistic). (b) Relationship between the summed parietal α outflow to V1 and the PAC measured at occipital sites for the Irrelevant (left panel, blue dots and line) and Relevant (middle panel, red dots and line) condition. The left panel shows the interaction Condition × Parietal α‐drive, as resulting from the mixed model fit. The separate plots on the right show the raw data for the two conditions with their regression line. (c) The left panel shows the interaction Condition × Occipital PAC as resulting from the mixed model fit. The plots on the right show the raw data for the two conditions with their regression line. In panels (b) and (c), dots are single trial values of all participants, with individual random intercepts removed. Lines and shaded areas are the estimated regression lines and 95% prediction intervals from each multilevel model. Darker colors reflect points closer to the predicted regression line [Color figure can be viewed at http://wileyonlinelibrary.com]
To generate Figure 5b (right panel), we computed the phase‐locking value ( ) (Lachaux et al., 1999; Penny et al., 2008) between all frequencies in the γ‐band and the subset of frequencies in the α‐band showing significant differences in the MIraw across conditions. The PLV was computed for each condition at each time bin t as
| (6) |
where is the instantaneous phase of the amplitude‐filtered high‐frequency signal in trial n. The difference in across conditions (Δ ) was calculated by subtracting values of the Irrelevant condition to the Relevant condition at each time point. An exploratory analysis was performed on Δ by means of permutation test (p (uncorrected) < .05, two‐tailed), shuffling the labels of conditions across participants 50,000 times.
To test whether local changes in phase‐amplitude coupling at occipital nodes were related to the incoming parietal drive in the α‐band (Section 2.1), we ran a mixed‐effects linear regression analysis using the fitlme procedure with maximum likelihood estimation in Matlab (Statistics and Machine Learning Toolbox). Mixed‐effects linear regression analysis allows the mixing of categorical and continuous variables and provides a better account of intersubject variability than canonical repeated‐measures ANOVA models. Log‐transformed, single‐trial estimates of (the absolute of at frequency tiles of significant differences, Φα = 10–11 Hz; A γ = 58–64 Hz) were modeled with the continuous predictor Parietal αdrive (the single‐trial sum of incoming α drive from parietal nodes in the time window between 0 and 500 ms poststimulus), the factor Condition (Relevant vs. Irrelevant) and their interaction (Condition × Parietal αdrive), incorporating subjects as random effect over the intercept term. With a similar approach, we also tested for linear relationships between the amount of PAC at occipital nodes and the outgoing drive in the γ‐band from these regions. In this second model, occipital single‐trial estimates of , the factor Condition (Relevant vs. Irrelevant) and their interaction (Condition × ) were used to predict the log‐transformed sum of occipital drive in the γ‐band (Occipital γdrive, 50–80 Hz).
3. RESULTS
3.1. Visually evoked potentials and power spectrum
The behavioral task is depicted in Figure 1. Participants fixated on a central spot while presented with sequences of oriented Gabors. They were instructed either to attend to each Gabor, reporting its orientation (Relevant condition), or to ignore the Gabors and report an occasional change of color in the fixation spot (Irrelevant condition). In the Relevant condition, the average orientation discrimination threshold was 0.83° of visual angle (SD = 0.37), as estimated by the adaptive staircase. Participant performed on average 80% correct (SD =9.08), and average reaction time (RT) was 613 ms (SD = 143). In the Irrelevant condition, color change was correctly detected in 87% of the cases (SD =14.78) and average RT was 485 ms (SD = 136). Thus, participants were exposed to near‐identical visual stimulation across conditions, but under different task demands.
Figure 1.
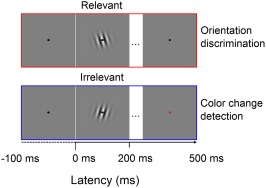
Experimental paradigm. In the Relevant condition, participants discriminate the orientation (left vs. right) of briefly presented Gabor stimuli. In the Irrelevant condition, Gabor stimuli were ignored and participants had to report an occasional color change in the fixation spot. Epochs for the EEG and connectivity analysis were time‐locked to the onset of each Gabor. Stimuli are not drawn to scale [Color figure can be viewed at http://wileyonlinelibrary.com]
We first investigated the effect of selective attention at the EEG electrode level. Based on previous reports using similar attentional manipulations, we expected an SN component, which has been extensively related to attentional selection (Daffner et al., 2012; Hillyard & Anllo‐Vento, 1998). The SN is observed in difference potentials (i.e., by subtracting the unattended to the attended condition) at posterior‐occipital electrodes. Thus, we restricted our analysis to a set of posterior‐occipital electrodes (see Figure 2a, right panel) and we subtracted the averaged evoked responses across these electrodes in the Irrelevant condition from those in the Relevant condition. Figure 2a shows the first significant positive difference across conditions at the time of early visual evoked responses (from 95 to 105 ms poststimulus, p(FDR) < .05) followed by the expected SN component, emerging at 225 ms and persisting for the rest of the epoch (first significant time window from 225 to 275 ms, second time window from 315 to 430 ms and third time window from 460 to 495 ms), consistent with previous reports (Daffner et al., 2012; Hillyard & Anllo‐Vento, 1998). For Relevant stimuli, the grand average α‐band power was reduced (6–12 Hz, peak at 10 Hz, see Figure 2b), with largest reductions at parieto‐occipital electrodes. This shows that our attentional manipulation was successful in eliciting an SN.
3.2. Source–level connectivity
To investigate brain dynamics of directed interactions as a function of selective attention, we first used fMRI to functionally localize a large‐scale network of interest. We identified peaks of task‐related activations in fMRI statistical maps using the contrasts Task vs. Rest and Irrelevant vs. Relevant (Section 2 and Figure 3). This revealed significant activations in primary visual cortex, lateral occipital and middle temporal cortex, parietal and frontal cortex, insular regions, and cingular cortex, in line with perceptual and attentional networks described and functionally characterized in previous work (Corbetta & Shulman, 2002; Sunaert, Van Hecke, Marchal, & Orban, 2000). The selection of maxima from the fMRI activation clusters resulted in a set of 20 nodes (Table 1) that were used for EEG source connectivity analysis.
The results of the source–connectivity analysis are summarized in Figure 4a. This figure shows the sum of the connectivity strengths across all nodes that significantly varied with selective attention, in the time and frequency domains. On average, increased connectivity for Irrelevant stimuli occurred with a clear peak at 10–11 Hz. Although the range of observed effects (6–16 Hz) encompassed some high θ‐ and low β‐rhythms, we will for simplicity refer to this frequency band as α band. Increased connectivity for Relevant stimuli was specifically observed in the γ‐band (50–80 Hz). Network dynamics in the γ‐band emerged rapidly after stimulus onset, at latencies of early visual evoked responses (first peak at ∼60 ms after stimulus onset) and showed a maximum at 220 ms, followed by a gradual decrease. In the Irrelevant condition, significant directed interactions in the α‐band occurred at longer latencies (from ∼ 100 ms poststimulus) and increased during the rest of the epoch.
Relevant stimuli evoked directed interactions in the γ‐band from early visual nodes to regions in the lateral‐occipital cortex, middle‐temporal cortex, right superior parietal cortex, and from a frontal node to the occipital cortex (Figure 4d). The significantly increased high‐frequency interactions in the Relevant condition almost exclusively originated from early visual areas (rV1(95.82%), rTMid(2.74%), lV1(0.06%)). A more complex pattern of significant connections was found in the Irrelevant condition with an elevated number of reciprocal interactions (Figure 4e). Figure 4b represents the sum of outflow across significant time–frequency points in the α‐band, for each sender node. This summary identified the left and right parietal cortex as the main drivers in the α‐band. Significantly increased α‐band driving from parietal cortex emerged after about 100 ms from stimulus onset, with initial peaks between 100 and 200 ms and a later peak after 400 ms, targeting a wide range of nodes.
To further characterize the dynamics of parietal driving in the Irrelevant condition, we divided receiving nodes according to their relative position in the axial plane, with respect to the parietal senders. Three main directions were defined: posterior (feedback), anterior (feedforward) and interhemispheric (between the parietal nodes), The dynamics summed outflow from parietal nodes in these three directions is summarized in Figure 4c. Parietal interactions were characterized by an initial interhemispheric coupling between the two nodes, emerging at around 100 ms from stimulus onset, followed by a predominant and gradually increasing drive to posterior regions, and a late increase in driving toward anterior regions. A consistent portion of the outgoing α drive from parietal nodes was interhemispheric or directed toward visual processing areas (interhemispheric (29.89%), rV1 (29.03%), lMTG (8.68%), rITG (7.06%), and lV1 (6.07%)). During the initial interhemispheric drive (100–200 ms), 60% of significant bidirectional interactions were directed from the left PPC (l‐PPC) to the right (r‐PPC) and 40% in the opposite direction.
3.3. Occipital phase amplitude coupling
The connectivity analysis revealed two main findings: (a) Selectively attending to stimuli increases the outflow of γ activity from early visual areas and (b) ignoring stimuli evokes distributed interactions in the α‐band, orchestrated by superior parietal areas and directed predominantly toward nodes in the primary visual cortex. Following these results, we investigated whether oscillatory influences from parietal cortex interact with local mechanisms that coordinate the routing of information carried by high‐frequency oscillations from visual areas. We tested this hypothesis by investigating the impact of parietal α drive on the degree of local PAC at early visual nodes. PAC reflects dependencies between the phase of a low‐frequency oscillation and the amplitude of the high‐frequency component of a neural signal (Szczepanski et al., 2014), and has been proposed as a mechanism of gating (Bonnefond & Jensen, 2015; Jensen & Mazaheri, 2010) and local coordination of neural processing (Dvorak & Fenton, 2014), by which low frequencies modulate the excitability of neuronal ensembles (Canolty & Knight, 2010).
In line with this idea, we hypothesized that α‐γ coupling in visual regions would be higher for Relevant stimuli, reflecting increased processing and information flow from these nodes. To test this hypothesis, we compared PAC across conditions (Section 2) for each frequency point in the range of α‐ and γ‐bands, as identified from the connectivity analysis (6–16 and 50–80 Hz; Figure 4A). As expected, we found an overall tendency for stronger α–γ coupling in the Relevant than in the Irrelevant condition with a significant difference in the PAC between phases at 10–11 Hz and amplitudes at 58–64 Hz (p < .05, two‐tailed t test, see Figure 5b, left panel). As shown by the phase locking value (PLV, see Methods) between phases at 10–11 Hz and γ amplitudes (58–64 Hz), this increased coupling emerged between 100 and 200 ms from stimulus onset (see Figure 5b, right panel), consistent with the first window of attentional modulation of connectivity, and occurred without statistically significant differences in α (p = .206, two‐tailed t test) and γ power (p = .203) between conditions.
3.4. PAC mediates γ driving from early visual nodes
Hypothesizing that phase‐amplitude coupling mediates the effective outflow of early visual areas, we predicted (a) that the amount of incoming α‐drive from parietal nodes should predict the local PAC and (b) that PAC predicts outgoing connection strengths in the γ‐band. To test this, we used two multilevel linear models (Section 2). In the first model, we modeled α‐γ occipital PAC as a function of Parietal αdrive, the Condition factor (Irrelevant vs. Relevant) and their interaction. The model revealed a significant intercept (β = 0.659 ± 0.260, p < .05, Satterthwaite approximation for degrees of freedom), a significant negative slope for the continuous predictor Parietal αdrive (β = −0.007 ± 0.001, p < .001), a significant main effect of Condition (β = 0.082 ± 0.010, p < .01) and a significant interaction between Parietal αdrive and Condition (β = 0.011 ± 0.002, p < .001). The results of this multilevel analysis showed (a) a decrease of occipital PAC with the increasing parietal drive during Irrelevant trials, (b) an overall higher PAC in the Relevant condition, and (c) that Parietal αdrive markedly decreased occipital PAC for Irrelevant trials while it increased occipital PAC on Relevant trials (Figure 5c).
Following a similar approach, in a second model, we tested the hypothesis that the amount of α–γ PAC at visual nodes could predict the degree of information flow from these regions, as indexed by the sum of occipital outgoing interactions in the γ‐band. This second model had a nonsignificant intercept (β = −0.581 ± 0.641, p > .05) and a significant positive slope for the continuous predictor occipital PAC (β = 0.124 ± 0.009, p < .001), indicating that γ interactions from early visual nodes increased as a function of the strength of local PAC. We also obtained a main effect of Condition (β = 0.368 ± 0.040, p < .001) and a significant interaction between occipital PAC and Condition (β = −0.031 ± 0.008, p < .001), revealing that, although outflow γ interactions were overall higher in the Relevant conditions, increases in the amount of occipital PAC led to larger γ outflow in the Irrelevant condition (Figure 5d). Because confidence intervals of the regression widened considerably with increased PAC values, due to fewer observations, we refrain from interpreting this interaction further.
4. DISCUSSION
Our results are compelling evidence that selective attention emerges from the interplay between frequency‐specific, large‐scale interactions and local dynamics of neuronal computation. Our main findings can be summarized as follows: (a) selective attention increases early influences from visual nodes to higher level areas in the γ‐band; (b) suppression of task‐irrelevant stimuli is orchestrated by parietal nodes through top–down driving in the extended α‐band; (c) influences from parietal nodes determine nested oscillations and signal outflow from occipital sites by changing local α–γ couplings.
The finding of predominant γ interactions in response to attended stimuli is well in agreement with the current understanding of γ activity as a marker of neuronal excitability and functional integration in large‐scale networks dedicated to perceptual processing (Bastos et al., 2015; Fries et al., 2001; Gruber et al., 1999; Jensen et al., 2007; Michalareas et al., 2016; Müller, Gruber, & Keil, 2000; Tallon‐Baudry et al., 2004; Vossel et al., 2014). Poststimulus γ oscillations in visual cortex have been shown to correlate with neuronal spikes (Belitski et al., 2008) and to foster neuronal gain mechanisms and behavioral performance (Ni et al., 2016; Womelsdorf, Fries, Mitra, & Desimone, 2006). Furthermore, recent work in primates and humans has shown that influences along feedforward projections are dominated by γ‐band synchronization, suggesting a pivotal role for high frequencies in the propagation of task‐relevant signals (Bastos et al., 2015; Bosman et al., 2012; Buffalo et al., 2011; Grothe, Neitzel, Mandon, & Kreiter, 2012; Jia, Tanabe, & Kohn, 2013; Michalareas et al., 2016; Van Kerkoerle et al., 2014). Here, we provide the first investigation of selective attention using directed functional connectivity with high temporal resolution. This allowed us to show the fast emergence of directed γ‐influences from primary visual areas, specifically for task‐relevant stimuli. These rapid interactions occurred with initial peaks at latencies of visual evoked responses (∼90 ms) and propagated in the feedforward direction, targeting regions involved in higher level visual processing (i.e., lateral occipital cortex and middle temporal gyrus (Grill‐Spector, Kourtzi, & Kanwisher, 2001; Ungerleider & Haxby, 1994)) visual attention (right parietal lobule; Corbetta & Shulman, 2002) and response selection/evaluation (left insular cortex; Corbetta, Miezin, Dobmeyer, Shulman, & Petersen, 1991; Eckert et al., 2009; Menon & Uddin, 2010). By characterizing the fast dynamics with which γ oscillations route attended information along the ascending pathway, we expand on previous work relating attention to increased γ activity (Müller et al., 2000) and synchronization (Fries et al., 2001; Fries, Womelsdorf, Oostenveld, & Desimone, 2008).
Whereas γ‐band interactions increased with attentive stimulus processing, irrelevant stimuli triggered wide‐spread influences in a range of lower frequencies extending from high θ to low β (6–16 Hz) and predominated by oscillations in the α band (10–11 Hz). Recent insights on the functional role of α activity have suggested its involvement in mediating inhibition of cortical structures activated by irrelevant events (Herrmann, Strüber, Helfrich, & Engel, 2016; Jensen & Mazaheri, 2010; Klimesch, 2012; Rihs, Michel, & Thut, 2007). Contrary to high frequencies, α oscillations are inversely related to attention and behavioral performance, their amplitude increases in regions associated with irrelevant processes and decreases in areas engaged by relevant and attended stimuli (Jensen & Mazaheri, 2010; Klimesch, 2012). Therefore, α‐band synchronization has been proposed as a mechanism to prevent local neural analyses and network propagation of stimulus information (Womelsdorf & Fries, 2008). Here we found distributed interactions centering on the α band that began at around 100 ms after stimulus onset and persisted until the end of each epoch (500 ms), thus encompassing early and later stages of perceptual processing. This result is consistent with the emergence of a stimulus‐evoked brain‐wide inhibitory drive through α oscillations that prevents multiple brain regions from receiving irrelevant and interfering information.
It is interesting to note that the time course of α interactions roughly paralleled the selection negativity (Hillyard & Anllo‐Vento, 1998) component observed at the sensor level. Our findings, therefore, suggest that the well‐known SN might result from increased parietal driving that inhibits the information transfer from visual areas.
As for the sources of such top–down inhibitory drive, our study is the first to reveal the key driving role of the posterior parietal cortex (PPC) from EEG recordings. This result is in line with the established role of PPC in coordinating shifts of spatial attention and disengagements of attention from stimuli (Posner & Petersen, 1990) and with more recent studies suggesting its top–down regulatory effect on visual selection (Bressler, Tang, Sylvester, Shulman, & Corbetta, 2008; Hung, Driver, & Walsh, 2005; Kastner & Ungerleider, 2001; Plomp, Hervais‐Adelman, Astolfi, & Michel, 2015; Yantis et al., 2002)
We show that α‐mediated inhibitory signals originated from sources in the superior portion of the PPC. These suppressive influences emerged swiftly after stimulus onset, first targeting regions of early perceptual processing and then interacting with nodes in the frontal cortex at longer latencies (Figure 4). This suggests that the PPC may have the key function to prevent irrelevant processing in a hierarchical fashion, from the inhibition of early perceptual analyses to the tracing and suppression of residual signals at later stages. We should caution that although we functionally identified these sources in a superior portion of the parietal cortex using fMRI, the low spatial resolution of EEG and potential residual mixing of signals after source reconstruction, prevent the complete separation of activity in these regions from that in neighboring loci, such as those reported by previous work (Plomp et al., 2015; Posner & Petersen, 1990) and thus, here we broadly refer to the parietal nodes as the PPC.
The first pattern of α‐band driving from parietal cortex was interhemispheric, targeting the homologous region in the contralateral hemisphere, with stronger interactions from the left to the right PPC. Selective inhibition of visual information may therefore require initial interhemispheric interactions that set the parietal system into an inhibitory state, after which PPC effectuates attentional suppression is through long‐range interactions. This interpretation is consistent with recent work showing that inhibitory interactions induced by bilateral TMS over PPC prevents the parietal system from promoting the excitability of visual areas (Silvanto, Muggleton, Lavie, & Walsh, 2008).
In addition to demonstrating the critical role and the dynamics of α‐band interactions from PPC, our results suggest a mechanism for how parietal cortex modulates activity in distal areas during selective attention. We demonstrated, for the first time, a direct link between the amount of incoming α modulation and the degree of phase‐amplitude coupling (PAC) in occipital areas. PAC reflects the coupling of the amplitude of high‐frequency oscillations to the phase of slower components (Szczepanski et al., 2014) and has been positively related to neuronal processing and communication (Canolty & Knight, 2010; Dvorak & Fenton, 2014; Voytek et al., 2010). Although some valid criticism has been raised concerning the measures and physiological meaning of cross‐frequency coupling (Aru et al., 2015), large body of work suggests that PAC serves as an information integration mechanism over multiple temporal and spatial scales (Canolty & Knight, 2010; Jensen & Colgin, 2007). During PAC, the amplitude of a fast rhythm (e.g., γ oscillations), and the potentially related degree of neuronal excitability, increases at specific phases of a slow oscillation (e.g., α rhythm). This system of nested oscillations implies that low frequencies rhythmically modulate and coordinate neuronal activity, optimizing information processing within ensembles of neurons (Dvorak & Fenton, 2014) and favoring the exchange of relevant information among distant ensembles oscillating in synchrony (Voytek et al., 2010).
Our work demonstrates a strong relationship between parietal drive in the α range, local occipital PAC, and γ‐band driving. Previous work has emphasized the potential role of PAC as a mechanism for communication within and between cortical areas under attentional demands (Sadeh, Szczepanski, Knight, & Mangun, 2014), suggesting a potential target mechanism for the influence of top–down selective modulation. In line with this view, our findings show that attentive processing of stimuli leads to increased α‐γ PAC in visual cortex, which in turn, predicts the degree of occipital outgoing γ interactions. Ignoring a stimulus, on the other hand, leads to decreased occipital α‐γ PAC, and this decrease is determined by the incoming parietal inhibitory drive. These results point to an important functional interpretation of the role of PPC in selective attention: to ignore irrelevant information, parietal inhibitory α interactions disrupt structures of information processing at target regions by decoupling fast from slow oscillations and thus, reducing the influences that these regions exert on upstream areas. This way, local PAC in V1 works as a mechanism for signal propagation to upstream areas, while PPC gates neuronal communication by adjusting occipital PAC as a function of attentional demands through directed interactions in the α‐band.
We found that selective attention operates by disrupting α–γ coupling in visual areas and that this disruption is brought about by directed α‐band influences from parietal to visual areas. Recent studies using Granger causality measures have shown similar frequency‐specific interactions in selective attention, in which slow‐wave activity (e.g., α and β) in higher order visual areas modulates lower order regions, while the reverse occurs for γ oscillations (Bastos et al., 2015; Bonnefond, Kastner, & Jensen, 2017; Van Kerkoerle et al., 2014; Michalareas et al., 2016; von Stein, Chiang, & König, 2000). Furthermore, feedback activity in the α–β range has been found to promote the feedforward propagation of visual γ‐band activity during attentional selection (Richter, Thompson, Bosman, & Fries, 2017), an evidence that corroborates the regulatory role of top–down α influences observed in our study. The critical interplay between top–down α and bottom–up γ in visual processing has been also investigated using microstimulation: the electrical stimulation of V1 causes increases of gamma activity at later stages of the visual hierarchy (V4), whereas the stimulation of V4 increases alpha power in V1 (Van Kerkoerle et al., 2014).
While EEG recordings reflect the aggregate activity over many cortical columns, recent work on the functional roles of cortical layers in attention is broadly consistent with our findings and suggests a possible laminar mechanism for attentional selection through interareal interactions. In the laminar organization of visual cortex, for instance, feedback projections to layer I and V are predominantly in the α range, whereas γ band activity is associated with feedforward communication. Spontaneous activity recorded from V1 of awake macaques has revealed that the phase of α activity at infragranular layers determines the power of γ band activity at supragranular layers (Spaak, Bonnefond, Maier, Leopold, & Jensen, 2012). It has also been shown that infragranular α phase modulates supragranular spiking activity during visual stimulation, suggesting a functional role for this coupling in visual processing (Dougherty, Cox, Ninomiya, Leopold, & Maier, 2017). Although α‐band activity is also present in other cortical layers and feedback activity is unlikely to be its only function (Haegens et al., 2015), this body of work suggests a plausible mechanism of cross‐frequency coupling in layer V that is controlled by downstream areas and modulates processing in supragranular layers, which may account for how our large‐scale findings could have come about.
Our findings provide empirical support for a recently proposed account of cross‐frequency neuronal communication (Bonnefond et al., 2017). On this theory, neuronal communication occurs through synchronization between areas at low frequencies, which in turn aligns the excitability phase of different pools of local neurons. According to this framework, neuronal ensembles exchanging task‐relevant information would oscillate coherently in the α‐band with a collective decrease in α power. The low α amplitude would allow longer windows of shared excitability among synchronized regions, favoring interactions in the γ‐band. This predicts that attentional suppression may be accompanied by two phenomena: (a) a substantial increase in α power and (b) a loss of α synchrony among local and distal neuronal pools processing task‐irrelevant signals, with a consequent reduction of their γ‐mediated interactions. Whereas our findings are broadly in line with this perspective, they tend to favor the latter mechanism as the primary mediator of attentional inhibition. It is worth emphasizing that, at the source level, occipital α power was not significantly increased by the occurrence of irrelevant stimuli, nevertheless, γ‐band interactions and occipital PAC were both decreased (Dvorak & Fenton, 2014). This suggests that attentional suppression may be the product of an induced non‐rhythmic (e.g., desynchronized) behavior in the excitability profile of neuronal ensembles and a resulting failure to establish coherent, high‐frequency interactions with other regions. Crucially, our results indicate that such desynchronization of occipital activity may be induced by parietal neurons through fast and directed interactions in the α‐band.
Although our paradigm did not allow a direct (e.g., behavioral) measure of participants' attention, similar protocols have been widely used in the fMRI (Sunaert et al., 2000) and EEG (Daffner et al., 2012; Hillyard & Anllo‐Vento, 1998) literature to investigate mechanisms of selective attention underlying the processing of task‐relevant or irrelevant stimuli. Our work shows how task‐irrelevant signals, carried by high‐frequency oscillations, dissipate rapidly after stimulus onset as a consequence of the top–down inhibitory and suppressive control of higher level areas. The gating by induced asynchrony account proposed here may represent a general mechanism by which top–down attention exerts control over sensory signals: after sensory representations are formed in response to irrelevant stimuli, top–down biases would intervene to dissolve this information locally, at the level of early sensory areas, thus minimizing its propagation and resonance into later circuits of working memory, decision‐making, and postperceptual processing. Such a mechanism, for instance, could have a key role in explaining the reduced attentional capture and disengagement of attention from those features and locations that do not match top–down goals (Becker, Folk, & Remington, 2013; Belopolsky, Schreij, & Theeuwes, 2010; Gaspelin & Luck, 2017; Geng, 2014; Pascucci & Turatto, 2015; Turatto, Bonetti, & Pascucci, 2017) and may underlie the experience‐dependent process by which attentional orienting becomes immune to learned distractors (Neo & Chua, 2006; Pascucci & Turatto, 2015; Turatto et al., 2017; Turatto & Pascucci, 2016).
An interesting question for future studies would be to extend our findings to other classical attentional task (i.e., the Posner paradigm) in which behavioral performance can be directly related to network dynamics at critical frequency bands. In a similar vein, we focused on two specific frequency bands identified in a data‐driven way. This does not exclude that in other paradigms, under different attentional manipulations, other oscillatory components may play critical roles (Siegel et al., 2008; Szczepanski et al., 2014). Moreover, here we show how parietal cortex modulates local PAC in visual areas through directed influences at the low‐frequency range. Future studies may extend these findings by investigating the role of interregional and directional PAC (Jiang, Bahramisharif, van Gerven, & Jensen, 2015), focusing on the type of long‐range cross‐frequency interactions that regulate information flow in selective attention. In conclusion, our findings support the view of selective attention as a top–down modulation of oscillatory activity (Womelsdorf & Fries, 2008) and provide first evidence of the causal role of α‐band influences from parietal cortex in biasing rhythmic synchronization and neural efficacy at target regions.
4.1. Data and code availability
The data and code generated during this study are openly available from the corresponding author on reasonable request.
ACKNOWLEDGMENTS
This work was supported by Swiss National Science Foundation grants to GP (PZ00P3_131731 and PP00P1_157420/1). The authors thank C.M. Michel for access to EEG facilities.
Pascucci D, Hervais‐Adelman A, Plomp G. Gating by induced Α–Γ asynchrony in selective attention. Hum Brain Mapp. 2018;39:3854–3870. 10.1002/hbm.24216
Funding information Swiss National Science Foundation, Grant/Award Numbers: PZ00P3_131731, PP00P1_157420/1
Contributor Information
David Pascucci, Email: david.pascucci@unifr.ch.
Gijs Plomp, Email: gijs.plomp@unifr.ch.
REFERENCES
- Anllo‐Vento, L. , Luck, S. J. , & Hillyard, S. A. (1998). Spatio‐temporal dynamics of attention to color: Evidence from human electrophysiology. Human Brain Mapping, 6(4), 216–238. [DOI] [PMC free article] [PubMed] [Google Scholar]
- Aru, J. , Aru, J. , Priesemann, V. , Wibral, M. , Lana, L. , Pipa, G. , … Vicente, R. (2015). Untangling cross‐frequency coupling in neuroscience. Current Opinion in Neurobiology, 31, 51–61. [DOI] [PubMed] [Google Scholar]
- Astolfi, L. , Cincotti, F. , Mattia, D. , De Vico Fallani, F. , Tocci, A. , Colosimo, A. , … Babiloni, F. others (2008). Tracking the time‐varying cortical connectivity patterns by adaptive multivariate estimators. IEEE Transactions on Biomedical Engineering, 55(3), 902–913. [DOI] [PubMed] [Google Scholar]
- Astolfi, L. , Cincotti, F. , Mattia, D. , Marciani, M. G. , Baccala, L. A. , Fallani, F. D. V. , … Babiloni, F. (2006). Assessing cortical functional connectivity by partial directed coherence: simulations and application to real data. IEEE Transactions on Biomedical Engineering, 53(9), 1802–1812. [DOI] [PubMed] [Google Scholar]
- Baccalá, L. A. , & Sameshima, K. (2001). Partial directed coherence: a new concept in neural structure determination. Biological Cybernetics, 84(6), 463–474. [DOI] [PubMed] [Google Scholar]
- Bach, M. (1996). The Freiburg Visual Acuity Test‐automatic measurement of visual acuity. Optometry & Vision Science, 73(1), 49–53. [DOI] [PubMed] [Google Scholar]
- Bastos, A. M. , Vezoli, J. , Bosman, C. A. , Schoffelen, J.‐M. , Oostenveld, R. , Dowdall, J. R. , … Fries, P. (2015). Visual areas exert feedforward and feedback influences through distinct frequency channels. Neuron, 85(2), 390–401. [DOI] [PubMed] [Google Scholar]
- Bauer, M. , Stenner, M.‐P. , Friston, K. J. , & Dolan, R. J. (2014). Attentional modulation of alpha/beta and gamma oscillations reflect functionally distinct processes. Journal of Neuroscience, 34(48), 16117–16125. [DOI] [PMC free article] [PubMed] [Google Scholar]
- Becker, S. I. , Folk, C. L. , & Remington, R. W. (2013). Attentional capture does not depend on feature similarity, but on target‐nontarget relations. Psychological Science, 24(5), 634–647. 10.1177/0956797612458528 [DOI] [PubMed] [Google Scholar]
- Belitski, A. , Gretton, A. , Magri, C. , Murayama, Y. , Montemurro, M. A. , Logothetis, N. K. , & Panzeri, S. (2008). Low‐frequency local field potentials and spikes in primary visual cortex convey independent visual information. Journal of Neuroscience, 28(22), 5696–5709. [DOI] [PMC free article] [PubMed] [Google Scholar]
- Belopolsky, A. V. , Schreij, D. , & Theeuwes, J. (2010). What is top‐down about contingent capture?. Attention, Perception, & Psychophysics, 72(2), 326–341. [DOI] [PubMed] [Google Scholar]
- Bonnefond, M. , & Jensen, O. (2015). Gamma activity coupled to alpha phase as a mechanism for top‐down controlled gating. PloS One, 10(6), e0128667. [DOI] [PMC free article] [PubMed] [Google Scholar]
- Bonnefond, M. , Kastner, S. , & Jensen, O. (2017). Communication between brain areas based on nested oscillations. ENeuro, 4(2), ENEURO–0153. [DOI] [PMC free article] [PubMed] [Google Scholar]
- Bosman, C. A. , Schoffelen, J. AN‐M. ATHIJS. , Brunet, N. ICOLAS. , Oostenveld, R. OBERT. , Bastos, A. NDRE M. , Womelsdorf, T. HILO. , … Fries, P. ASCAL. (2012). Attentional stimulus selection through selective synchronization between monkey visual areas. Neuron, 75(5), 875–888. [DOI] [PMC free article] [PubMed] [Google Scholar]
- Bressler, S. L. , & Seth, A. K. (2011). Wiener–Granger causality: a well established methodology. Neuroimage, 58(2), 323–329. [DOI] [PubMed] [Google Scholar]
- Bressler, S. L. , Tang, W. , Sylvester, C. M. , Shulman, G. L. , & Corbetta, M. (2008). Top‐down control of human visual cortex by frontal and parietal cortex in anticipatory visual spatial attention. Journal of Neuroscience, 28(40), 10056–10061. [DOI] [PMC free article] [PubMed] [Google Scholar]
- Brunet, D. , Murray, M. M. , & Michel, C. M. (2011). Spatiotemporal analysis of multichannel EEG: CARTOOL. Computational Intelligence and Neuroscience, 2011, 1. [DOI] [PMC free article] [PubMed] [Google Scholar]
- Buffalo, E. A. , Fries, P. , Landman, R. , Buschman, T. J. , & Desimone, R. (2011). Laminar differences in gamma and alpha coherence in the ventral stream. Proceedings of the National Academy of Sciences, 108(27), 11262–11267. [DOI] [PMC free article] [PubMed] [Google Scholar]
- Canolty, R. T. , & Knight, R. T. (2010). The functional role of cross‐frequency coupling. Trends in Cognitive Sciences, 14(11), 506–515. [DOI] [PMC free article] [PubMed] [Google Scholar]
- Carrasco, M. (2006). Covert attention increases contrast sensitivity: Psychophysical, neurophysiological and neuroimaging studies. Progress in Brain Research, 154, 33–70. [DOI] [PubMed] [Google Scholar]
- Carrasco, M. (2011). Visual attention: The past 25 years. Vision Research, 51(13), 1484–1525. [DOI] [PMC free article] [PubMed] [Google Scholar]
- Coito, A. na. , Plomp, G. IJS. , Genetti, M. ÉLANIE. , Abela, E. UGENIO. , Wiest, R. OLAND. , Seeck, M. ARGITTA. , … Vulliemoz, S. ERGE. (2015). Dynamic directed interictal connectivity in left and right temporal lobe epilepsy. Epilepsia, 56(2), 207–217. [DOI] [PubMed] [Google Scholar]
- Corbetta, M. , Miezin, F. M. , Dobmeyer, S. , Shulman, G. L. , & Petersen, S. E. (1991). Selective and divided attention during visual discriminations of shape, color, and speed: functional anatomy by positron emission tomography. The Journal of Neuroscience, 11(8), 2383–2402. [DOI] [PMC free article] [PubMed] [Google Scholar]
- Corbetta, M. , & Shulman, G. L. (2002). Control of goal‐directed and stimulus‐driven attention in the brain. Nature Reviews Neuroscience, 3(3), 201–215. [DOI] [PubMed] [Google Scholar]
- Daffner, K. R. , Zhuravleva, T. Y. , Sun, X. , Tarbi, E. C. , Haring, A. E. , Rentz, D. M. , & Holcomb, P. J. (2012). Does modulation of selective attention to features reflect enhancement or suppression of neural activity?. Biological Psychology, 89(2), 398–407. [DOI] [PMC free article] [PubMed] [Google Scholar]
- Delorme, A. , & Makeig, S. (2004). EEGLAB: an open source toolbox for analysis of single‐trial EEG dynamics including independent component analysis. Journal of Neuroscience Methods, 134(1), 9–21. [DOI] [PubMed] [Google Scholar]
- Desimone, R. , & Duncan, J. (1995). Neural mechanisms of selective visual attention. Annual Review of Neuroscience, 18(1), 193–222. [DOI] [PubMed] [Google Scholar]
- Ding, M. , Bressler, S. L. , Yang, W. , & Liang, H. (2000). Short‐window spectral analysis of cortical event‐related potentials by adaptive multivariate autoregressive modeling: data preprocessing, model validation, and variability assessment. Biological Cybernetics, 83(1), 35–45. [DOI] [PubMed] [Google Scholar]
- Dougherty, K. , Cox, M. A. , Ninomiya, T. , Leopold, D. A. , & Maier, A. (2017). Ongoing alpha activity in v1 regulates visually driven spiking responses. Cerebral Cortex, 27(2), 1113–1124. 10.1093/cercor/bhv304 [DOI] [PMC free article] [PubMed] [Google Scholar]
- Downing, P. , Liu, J. , & Kanwisher, N. (2001). Testing cognitive models of visual attention with fMRI and MEG. Neuropsychologia, 39(12), 1329–1342. [DOI] [PubMed] [Google Scholar]
- Driver, J. (2001). A selective review of selective attention research from the past century. British Journal of Psychology, 92(1), 53–78. [PubMed] [Google Scholar]
- Dvorak, D. , & Fenton, A. A. (2014). Toward a proper estimation of phase–amplitude coupling in neural oscillations. Journal of Neuroscience Methods, 225, 42–56. [DOI] [PMC free article] [PubMed] [Google Scholar]
- Eckert, M. A. , Menon, V. , Walczak, A. , Ahlstrom, J. , Denslow, S. , Horwitz, A. , & Dubno, J. R. (2009). At the heart of the ventral attention system: the right anterior insula. Human Brain Mapping, 30(8), 2530–2541. [DOI] [PMC free article] [PubMed] [Google Scholar]
- Foxe, J. J. , Simpson, G. V. , & Ahlfors, S. P. (1998). Parieto‐occipital 1 0Hz activity reflects anticipatory state of visual attention mechanisms. Neuroreport, 9(17), 3929–3933. [DOI] [PubMed] [Google Scholar]
- Foxe, J. J. , & Snyder, A. C. (2011). The role of alpha‐band brain oscillations as a sensory suppression mechanism during selective attention. Frontiers in Psychology, 2, 154. [DOI] [PMC free article] [PubMed] [Google Scholar]
- Fries, P. (2005). A mechanism for cognitive dynamics: neuronal communication through neuronal coherence. Trends in Cognitive Sciences, 9(10), 474–480. [DOI] [PubMed] [Google Scholar]
- Fries, P. (2009). Neuronal gamma‐band synchronization as a fundamental process in cortical computation. Annual Review of Neuroscience, 32(1), 209–224. [DOI] [PubMed] [Google Scholar]
- Fries, P. , Reynolds, J. H. , Rorie, A. E. , & Desimone, R. (2001). Modulation of oscillatory neuronal synchronization by selective visual attention. Science, 291(5508), 1560–1563. [DOI] [PubMed] [Google Scholar]
- Fries, P. , Womelsdorf, T. , Oostenveld, R. , & Desimone, R. (2008). The effects of visual stimulation and selective visual attention on rhythmic neuronal synchronization in macaque area V4. Journal of Neuroscience, 28(18), 4823–4835. [DOI] [PMC free article] [PubMed] [Google Scholar]
- Friston, K. J. , Holmes, A. P. , Worsley, K. J. , Poline, J.‐P. , Frith, C. D. , & Frackowiak, R. S. (1994). Statistical parametric maps in functional imaging: a general linear approach. Human Brain Mapping, 2(4), 189–210. [Google Scholar]
- Gaspelin, N. , & Luck, S. J. (2017). The role of inhibition in avoiding distraction by salient stimuli. Trends in Cognitive Sciences. [DOI] [PMC free article] [PubMed] [Google Scholar]
- Geng, J. J. (2014). Attentional mechanisms of distractor suppression. Current Directions in Psychological Science, 23(2), 147–153. [Google Scholar]
- Granger, C. W. (1969). Investigating causal relations by econometric models and cross‐spectral methods. Econometrica: Journal of the Econometric Society, 37(3), 424–438. [Google Scholar]
- Grill‐Spector, K. , Kourtzi, Z. , & Kanwisher, N. (2001). The lateral occipital complex and its role in object recognition. Vision Research, 41(10–11), 1409–1422. [DOI] [PubMed] [Google Scholar]
- Grothe, I. , Neitzel, S. D. , Mandon, S. , & Kreiter, A. K. (2012). Switching neuronal inputs by differential modulations of gamma‐band phase‐coherence. Journal of Neuroscience, 32(46), 16172–16180. [DOI] [PMC free article] [PubMed] [Google Scholar]
- Gruber, T. , Müller, M. M. , Keil, A. , & Elbert, T. (1999). Selective visual‐spatial attention alters induced gamma band responses in the human EEG. Clinical Neurophysiology, 110(12), 2074–2085. [DOI] [PubMed] [Google Scholar]
- Haegens, S. , Barczak, A. , Musacchia, G. , Lipton, M. L. , Mehta, A. D. , Lakatos, P. , & Schroeder, C. E. (2015). Laminar profile and physiology of the α rhythm in primary visual, auditory, and somatosensory regions of neocortex. Journal of Neuroscience, 35(42), 14341–14352. 10.1523/JNEUROSCI.0600-15.2015 [DOI] [PMC free article] [PubMed] [Google Scholar]
- Hanslmayr, S. , Aslan, A. , Staudigl, T. , Klimesch, W. , Herrmann, C. S. , & Bäuml, K.‐H. (2007). Prestimulus oscillations predict visual perception performance between and within subjects. Neuroimage, 37(4), 1465–1473. [DOI] [PubMed] [Google Scholar]
- Herrmann, C. S. , Strüber, D. , Helfrich, R. F. , & Engel, A. K. (2016). EEG oscillations: from correlation to causality. International Journal of Psychophysiology : Official Journal of the International Organization of Psychophysiology, 103, 12–21. [DOI] [PubMed] [Google Scholar]
- Hillyard, S. A. , & Anllo‐Vento, L. (1998). Event‐related brain potentials in the study of visual selective attention. Proceedings of the National Academy of Sciences, 95(3), 781–787. [DOI] [PMC free article] [PubMed] [Google Scholar]
- Hillyard, S. A. , Vogel, E. K. , & Luck, S. J. (1998). Sensory gain control (amplification) as a mechanism of selective attention: electrophysiological and neuroimaging evidence. Philosophical Transactions of the Royal Society B: Biological Sciences, 353(1373), 1257. [DOI] [PMC free article] [PubMed] [Google Scholar]
- Hipp, J. F. , & Siegel, M. (2013). Dissociating neuronal gamma‐band activity from cranial and ocular muscle activity in EEG. Frontiers in Human Neuroscience, 7, 10.3389/fnhum.2013.00338 [DOI] [PMC free article] [PubMed] [Google Scholar]
- Hung, J. , Driver, J. , & Walsh, V. (2005). Visual selection and posterior parietal cortex: effects of repetitive transcranial magnetic stimulation on partial report analyzed by Bundesen's theory of visual attention. Journal of Neuroscience, 25(42), 9602–9612. [DOI] [PMC free article] [PubMed] [Google Scholar]
- Jensen, O. , & Colgin, L. L. (2007). Cross‐frequency coupling between neuronal oscillations. Trends in Cognitive Sciences, 11(7), 267–269. [DOI] [PubMed] [Google Scholar]
- Jensen, O. , Kaiser, J. , & Lachaux, J.‐P. (2007). Human gamma‐frequency oscillations associated with attention and memory. Trends in Neurosciences, 30(7), 317–324. [DOI] [PubMed] [Google Scholar]
- Jensen, O. , & Mazaheri, A. (2010). Shaping functional architecture by oscillatory alpha activity: gating by inhibition. Frontiers in Human Neuroscience, 4, 186. [DOI] [PMC free article] [PubMed] [Google Scholar]
- Jia, X. , Tanabe, S. , & Kohn, A. (2013). Gamma and the coordination of spiking activity in early visual cortex. Neuron, 77(4), 762–774. [DOI] [PMC free article] [PubMed] [Google Scholar]
- Jiang, H. , Bahramisharif, A. , van Gerven, M. A. , & Jensen, O. (2015). Measuring directionality between neuronal oscillations of different frequencies. Neuroimage, 118, 359–367. [DOI] [PubMed] [Google Scholar]
- Kanwisher, N. , & Wojciulik, E. (2000). Visual attention: Insights from brain imaging. Nature Reviews Neuroscience, 1(2), 91–100. 10.1038/35039043 [DOI] [PubMed] [Google Scholar]
- Kastner, S. , & Ungerleider, L. G. (2001). The neural basis of biased competition in human visual cortex. Neuropsychologia, 39(12), 1263–1276. [DOI] [PubMed] [Google Scholar]
- Keil, A. , Müller, M. M. , Ray, W. J. , Gruber, T. , & Elbert, T. (1999). Human gamma band activity and perception of a gestalt. The Journal of Neuroscience, 19(16), 7152–7161. [DOI] [PMC free article] [PubMed] [Google Scholar]
- Keren, A. S. , Yuval‐Greenberg, S. , & Deouell, L. Y. (2010). Saccadic spike potentials in gamma‐band EEG: characterization, detection and suppression. Neuroimage, 49(3), 2248–2263. [DOI] [PubMed] [Google Scholar]
- Klimesch, W. (2012). Alpha‐band oscillations, attention, and controlled access to stored information. Trends in Cognitive Sciences, 16(12), 606–617. [DOI] [PMC free article] [PubMed] [Google Scholar]
- Klimesch, W. , Doppelmayr, M. , Russegger, H. , Pachinger, T. , & Schwaiger, J. (1998). Induced alpha band power changes in the human EEG and attention. Neuroscience Letters, 244(2), 73–76. [DOI] [PubMed] [Google Scholar]
- Lachaux, J. EAN‐P. HILIPPE. , Rodriguez, E. UGENIO. , Martinerie, J. ACQUES. , & Varela, FranciscoJ. (1999). Measuring phase synchrony in brain signals. Human Brain Mapping, 8(4), 194–208. [DOI] [PMC free article] [PubMed] [Google Scholar]
- Lakatos, P. , Karmos, G. , Mehta, A. D. , Ulbert, I. , & Schroeder, C. E. (2008). Entrainment of neuronal oscillations as a mechanism of attentional selection. Science, 320(5872), 110–113. [DOI] [PubMed] [Google Scholar]
- Lehmann, D. , & Skrandies, W. (1980). Reference‐free identification of components of checkerboard‐evoked multichannel potential fields. Electroencephalography and Clinical Neurophysiology, 48(6), 609–621. [DOI] [PubMed] [Google Scholar]
- Leistritz, L. , Pester, B. , Doering, A. , Schiecke, K. , Babiloni, F. , Astolfi, L. , & Witte, H. (2013). Time‐variant partial directed coherence for analysing connectivity: a methodological study. Phil. Trans. R. Soc. A, 371(1997), 20110616. [DOI] [PubMed] [Google Scholar]
- Maris, E. , & Oostenveld, R. (2007). Nonparametric statistical testing of EEG‐and MEG‐data. Journal of Neuroscience Methods, 164(1), 177–190. [DOI] [PubMed] [Google Scholar]
- Mathewson, K. E. , Gratton, G. , Fabiani, M. , Beck, D. M. , & Ro, T. (2009). To see or not to see: prestimulus α phase predicts visual awareness. The Journal of Neuroscience : The Official Journal of the Society for Neuroscience, 29(9), 2725–2732. [DOI] [PMC free article] [PubMed] [Google Scholar]
- Maunsell, J. H. , & Treue, S. (2006). Feature‐based attention in visual cortex. Trends in Neurosciences, 29(6), 317–322. [DOI] [PubMed] [Google Scholar]
- Menon, V. , & Uddin, L. Q. (2010). Saliency, switching, attention and control: a network model of insula function. Brain Structure and Function, 214(5–6), 655–667. [DOI] [PMC free article] [PubMed] [Google Scholar]
- Michalareas, G. , Vezoli, J. , Van Pelt, S. , Schoffelen, J.‐M. , Kennedy, H. , & Fries, P. (2016). Alpha‐beta and gamma rhythms subserve feedback and feedforward influences among human visual cortical areas. Neuron, 89(2), 384–397. [DOI] [PMC free article] [PubMed] [Google Scholar]
- Michel, C. M. , Murray, M. M. , Lantz, G. , Gonzalez, S. , Spinelli, L. , & Grave de Peralta, R. (2004). EEG source imaging. Clinical Neurophysiology, 115(10), 2195–2222. 10.1016/j.clinph.2004.06.001 [DOI] [PubMed] [Google Scholar]
- Milde, T. , Leistritz, L. , Astolfi, L. , Miltner, W. H. , Weiss, T. , Babiloni, F. , & Witte, H. (2010). A new Kalman filter approach for the estimation of high‐dimensional time‐variant multivariate AR models and its application in analysis of laser‐evoked brain potentials. Neuroimage, 50(3), 960–969. [DOI] [PubMed] [Google Scholar]
- Müller, M. M. , Gruber, T. , & Keil, A. (2000). Modulation of induced gamma band activity in the human EEG by attention and visual information processing. International Journal of Psychophysiology, 38(3), 283–299. [DOI] [PubMed] [Google Scholar]
- Neo, G. , & Chua, F. K. (2006). Capturing focused attention. Perception & Psychophysics, 68(8), 1286–1296. [DOI] [PubMed] [Google Scholar]
- Ni, J. , Wunderle, T. , Lewis, C. M. , Desimone, R. , Diester, I. , & Fries, P. (2016). Gamma‐rhythmic gain modulation. Neuron, 92(1), 240–251. [DOI] [PMC free article] [PubMed] [Google Scholar]
- O'Craven, K. M. , Downing, P. E. , & Kanwisher, N. (1999). fMRI evidence for objects as the units of attentional selection. Nature, 401(6753), 584–587. 10.1038/44134 [DOI] [PubMed] [Google Scholar]
- Onslow, A. C. , Bogacz, R. , & Jones, M. W. (2011). Quantifying phase–amplitude coupling in neuronal network oscillations. Progress in Biophysics and Molecular Biology, 105(1–2), 49–57. [DOI] [PubMed] [Google Scholar]
- Park, H. YOJIN. , Lee, DongSoo. , Kang, E. UNJOO. , Kang, H. YEJIN. , Hahm, J. ARANG. , Kim, JuneSic. , … Jensen, O. LE. (2016). Formation of visual memories controlled by gamma power phase‐locked to alpha oscillations. Scientific Reports, 6(1), 28092. [DOI] [PMC free article] [PubMed] [Google Scholar]
- Pascucci, D. , & Turatto, M. (2015). The distracting impact of repeated visible and invisible onsets on focused attention. Journal of Experimental Psychology: Human Perception and Performance, 41(3), 879. [DOI] [PubMed] [Google Scholar]
- Peirce, J. W. (2008). Generating stimuli for neuroscience using PsychoPy. Frontiers in Neuroinformatics, 2, Retrieved from https://www.ncbi.nlm.nih.gov/pmc/articles/PMC2636899/ [DOI] [PMC free article] [PubMed] [Google Scholar]
- Penny, W. D. , Duzel, E. , Miller, K. J. , & Ojemann, J. G. (2008). Testing for nested oscillation. Journal of Neuroscience Methods, 174(1), 50–61. [DOI] [PMC free article] [PubMed] [Google Scholar]
- Plomp, G. , Hervais‐Adelman, A. , Astolfi, L. , & Michel, C. M. (2015). Early recurrence and ongoing parietal driving during elementary visual processing. Scientific Reports, 5(1), 18733. [DOI] [PMC free article] [PubMed] [Google Scholar]
- Plomp, G. , Leeuwen, C. , & Ioannides, A. A. (2010). Functional specialization and dynamic resource allocation in visual cortex. Human Brain Mapping, 31(1), 1–13. [DOI] [PMC free article] [PubMed] [Google Scholar]
- Plomp, G. , Quairiaux, C. , Michel, C. M. , & Astolfi, L. (2014). The physiological plausibility of time‐varying Granger‐causal modeling: normalization and weighting by spectral power. NeuroImage, 97, 206–216. [DOI] [PubMed] [Google Scholar]
- Posner, M. I. , & Petersen, S. E. (1990). The attention system of the human brain. Annual Review of Neuroscience, 13(1), 25–42. [DOI] [PubMed] [Google Scholar]
- Ptak, R. , & Schnider, A. (2011). The attention network of the human brain: relating structural damage associated with spatial neglect to functional imaging correlates of spatial attention. Neuropsychologia, 49(11), 3063–3070. [DOI] [PubMed] [Google Scholar]
- Rajagovindan, R. , & Ding, M. (2011). From prestimulus alpha oscillation to visual‐evoked response: an inverted‐U function and its attentional modulation. Journal of Cognitive Neuroscience, 23(6), 1379–1394. [DOI] [PubMed] [Google Scholar]
- Reynolds, J. H. , & Chelazzi, L. (2004). Attentional modulation of visual processing. Annual Review of Neuroscience, 27, 611–647. [DOI] [PubMed] [Google Scholar]
- Richter, C. G. , Thompson, W. H. , Bosman, C. A. , & Fries, P. (2017). Top‐down beta enhances bottom‐up gamma. The Journal of Neuroscience, 37(28), 6698–6711. 10.1523/JNEUROSCI.3771-16.2017 [DOI] [PMC free article] [PubMed] [Google Scholar]
- Rihs, T. A. , Michel, C. M. , & Thut, G. (2007). Mechanisms of selective inhibition in visual spatial attention are indexed by α‐band EEG synchronization. European Journal of Neuroscience, 25(2), 603–610. [DOI] [PubMed] [Google Scholar]
- Rorden, C. , & Brett, M. (2000). Stereotaxic display of brain lesions. Behavioural neurology, 12(4), 191–200. [DOI] [PubMed] [Google Scholar]
- Sadeh, B. , Szczepanski, S. M. , Knight, R. T. , & Mangun, G. R. (2014). Oscillations and behavior: the role of phase–amplitude coupling in cognition. Elsevier; Retrieved from https://books.google.it/books?hl=it&lr=&id=WcBuAAAAQBAJ&oi=fnd&pg=PA268&dq=Sadeh,+Szczepanski+%26+Knight+&ots=87jA-1zJA8&sig=153a0ygzFStG4DNgziN_cK8m1Zo [Google Scholar]
- Schlogl, A. , Roberts, S. J. , & Pfurtscheller, G. (2000). A criterion for adaptive autoregressive models. In Engineering in Medicine and Biology Society, 2000. Proceedings of the 22nd Annual International Conference of the IEEE (Vol. 2, pp. 1581–1582). IEEE. Retrieved from http://ieeexplore.ieee.org/abstract/document/898046/
- Siegel, M. , Donner, T. H. , Oostenveld, R. , Fries, P. , & Engel, A. K. (2008). Neuronal synchronization along the dorsal visual pathway reflects the focus of spatial attention. Neuron . Neuron, 60(4), 709–719. [DOI] [PubMed] [Google Scholar]
- Silvanto, J. , Muggleton, N. , Lavie, N. , & Walsh, V. (2008). The perceptual and functional consequences of parietal top‐down modulation on the visual cortex. Cerebral Cortex, 19(2), 327–330. [DOI] [PMC free article] [PubMed] [Google Scholar]
- Singer, W. (1999). Neuronal synchrony: a versatile code for the definition of relations? Neuron, 24(1), 49–65. [DOI] [PubMed] [Google Scholar]
- Smith, A. T. , Singh, K. D. , & Greenlee, M. W. (2000). Attentional suppression of activity in the human visual cortex. Neuroreport, 11(2), 271–278. [DOI] [PubMed] [Google Scholar]
- Spaak, E. , Bonnefond, M. , Maier, A. , Leopold, D. A. , & Jensen, O. (2012). Layer‐specific entrainment of gamma‐band neural activity by the alpha rhythm in monkey visual cortex. Current Biology, 22(24), 2313–2318. 10.1016/j.cub.2012.10.020 [DOI] [PMC free article] [PubMed] [Google Scholar]
- Sunaert, S. , Van Hecke, P. , Marchal, G. , & Orban, G. A. (2000). Attention to speed of motion, speed discrimination, and task difficulty: an fMRI study. Neuroimage, 11(6), 612–623. [DOI] [PubMed] [Google Scholar]
- Szczepanski, S. M. , Crone, N. E. , Kuperman, R. A. , Auguste, K. I. , Parvizi, J. , & Knight, R. T. (2014). Dynamic changes in phase‐amplitude coupling facilitate spatial attention control in fronto‐parietal cortex. PLoS Biology, 12(8), e1001936. [DOI] [PMC free article] [PubMed] [Google Scholar]
- Tallon‐Baudry, C. , Bertrand, O. , Hénaff, M.‐A. , Isnard, J. , & Fischer, C. (2004). Attention modulates gamma‐band oscillations differently in the human lateral occipital cortex and fusiform gyrus. Cerebral Cortex, 15(5), 654–662. [DOI] [PubMed] [Google Scholar]
- Thut, G. , Nietzel, A. , Brandt, S. A. , & Pascual‐Leone, A. (2006). αBand electroencephalographic activity over occipital cortex indexes visuospatial attention bias and predicts visual target detection. Journal of Neuroscience, 26(37), 9494–9502. [DOI] [PMC free article] [PubMed] [Google Scholar]
- Turatto, M. , Bonetti, F. , & Pascucci, D. (2017). Filtering visual onsets via habituation: A context‐specific long‐term memory of irrelevant stimuli. Psychonomic Bulletin & Review, 1–7. [DOI] [PubMed] [Google Scholar]
- Turatto, M. , & Pascucci, D. (2016). Short‐term and long‐term plasticity in the visual‐attention system: Evidence from habituation of attentional capture. Neurobiology of Learning and Memory, 130, 159–169. [DOI] [PubMed] [Google Scholar]
- Ungerleider, L. G. , & Haxby, J. V. (1994). What”and “where”in the human brain. Current Opinion in Neurobiology, 4(2), 157–165. [DOI] [PubMed] [Google Scholar]
- Van Dijk, H. , Schoffelen, J.‐M. , Oostenveld, R. , & Jensen, O. (2008). Prestimulus oscillatory activity in the alpha band predicts visual discrimination ability. Journal of Neuroscience, 28(8), 1816–1823. [DOI] [PMC free article] [PubMed] [Google Scholar]
- Van Kerkoerle, T. , Self, M. W. , Dagnino, B. , Gariel‐Mathis, M.‐A. , Poort, J. , Van Der Togt, C. , & Roelfsema, P. R. (2014). Alpha and gamma oscillations characterize feedback and feedforward processing in monkey visual cortex. Proceedings of the National Academy of Sciences, 111(40), 14332–14341. [DOI] [PMC free article] [PubMed] [Google Scholar]
- Vanni, S. , Revonsuo, A. , & Hari, R. (1997). Modulation of the parieto‐occipital alpha rhythm during object detection. The Journal of Neuroscience, 17(18), 7141–7147. [DOI] [PMC free article] [PubMed] [Google Scholar]
- Vinck, M. , Huurdeman, L. , Bosman, C. A. , Fries, P. , Battaglia, F. P. , Pennartz, C. M. , & Tiesinga, P. H. (2015). How to detect the Granger‐causal flow direction in the presence of additive noise?. Neuroimage, 108, 301–318. [DOI] [PubMed] [Google Scholar]
- von Stein, A. , Chiang, C. , & König, P. (2000). Top‐down processing mediated by interareal synchronization. Proceedings of the National Academy of Sciences of the United States of America, 97(26), 14748–14753. [DOI] [PMC free article] [PubMed] [Google Scholar]
- Vossel, S. , Geng, J. J. , & Fink, G. R. (2014). Dorsal and ventral attention systems distinct neural circuits but collaborative roles. The Neuroscientist, 20(2), 150–159. [DOI] [PMC free article] [PubMed] [Google Scholar]
- Voytek, B. , Canolty, R. T. , Shestyuk, A. , Crone, N. E. , Parvizi, J. , & Knight, R. T. (2010). Shifts in gamma phase–amplitude coupling frequency from theta to alpha over posterior cortex during visual tasks. Frontiers in Human Neuroscience, 4, Retrieved from https://www.ncbi.nlm.nih.gov/pmc/articles/pmc2972699/ [DOI] [PMC free article] [PubMed] [Google Scholar]
- Watson, A. B. , & Pelli, D. G. (1983). QUEST: A Bayesian adaptive psychometric method. Attention, Perception, & Psychophysics, 33(2), 113–120. [DOI] [PubMed] [Google Scholar]
- Womelsdorf, T. , & Fries, P. (2008). Selective attention through selective neuronal synchronization. The Cognitive Neurosciences, IV, 289–304. [Google Scholar]
- Womelsdorf, T. , Fries, P. , Mitra, P. P. , & Desimone, R. (2006). Gamma‐band synchronization in visual cortex predicts speed of change detection. Nature, 439(7077), 733–736. [DOI] [PubMed] [Google Scholar]
- Wyart, V. , & Tallon‐Baudry, C. (2008). Neural dissociation between visual awareness and spatial attention. Journal of Neuroscience, 28(10), 2667–2679. [DOI] [PMC free article] [PubMed] [Google Scholar]
- Yantis, S. , Schwarzbach, J. , Serences, J. T. , Carlson, R. L. , Steinmetz, M. A. , Pekar, J. J. , & Courtney, S. M. (2002). Transient neural activity in human parietal cortex during spatial attention shifts. Nature Neuroscience, 5(10), 995–1002. [DOI] [PubMed] [Google Scholar]
- Yuval‐Greenberg, S. , Tomer, O. , Keren, A. S. , Nelken, I. , & Deouell, L. Y. (2008). Transient induced gamma‐band response in EEG as a manifestation of miniature saccades. Neuron, 58(3), 429–441. [DOI] [PubMed] [Google Scholar]
Associated Data
This section collects any data citations, data availability statements, or supplementary materials included in this article.
Data Availability Statement
The data and code generated during this study are openly available from the corresponding author on reasonable request.