

Abstract
Humans are adept at perceiving textures through touch. Previous neuroimaging studies have identified a distributed network of brain regions involved in the tactile perception of texture. However, it remains unclear how nodes in this network contribute to the tactile awareness of texture. To examine the hypothesis that such awareness involves the interaction of the primary somatosensory cortex with higher order cortices, we conducted a functional magnetic resonance imaging (fMRI) study utilizing the velvet hand illusion, in which an illusory velvet‐like surface is perceived between the hands. Healthy participants were subjected to a strong illusion, a weak illusion, and tactile perception of real velvet. The strong illusion induced greater activation in the primary somatosensory cortex (S1) than the weak illusion, and increases in such activation were positively correlated with the strength of the illusion. Furthermore, both actual and illusory perception of velvet induced common activation in S1. Psychophysiological interaction (PPI) analysis revealed that the strength of the illusion modulated the functional connectivity of S1 with each of the following regions: the parietal operculum, superior parietal lobule, precentral gyrus, insula, and cerebellum. The present results indicate that S1 is associated with the conscious tactile perception of textures, which may be achieved via interactions with higher order somatosensory areas.
Keywords: fMRI, functional connectivity, parietal operculum, primary somatosensory cortex, texture perception
1. INTRODUCTION
Humans can quickly become aware of an object and its properties when it is held in the hand. Previous research has suggested that the conscious perception of an object emerges in specific neural regions or cortical networks (Crick & Koch, 1990; Koch, Massimini, Boly, & Tononi, 2016). While several neuroimaging studies have aimed to elucidate the brain networks underlying conscious object perception in the visual domain (Koch et al., 2016; Lamme, Supér, Landman, Roelfsema, & Spekreijse, 2000; Rees, 2013; Silvanto, 2015; Tong, 2003), relatively little is known regarding the neural mechanisms underlying conscious object perception in non‐visual sensory modalities, such as touch.
One approach to understanding the neural networks underlying conscious object perception is the use of sensory illusions (Blankenburg, Ruff, Deichmann, Rees, & Driver, 2006; Kok, Bains, van Mourik, Norris, & de Lange, 2016; Morita et al., 2004). The present study is the first neuroscientific investigation to utilize the velvet hand illusion (VHI; Mochiyama et al., 2005; Ohka et al., 2010), a well‐known tactile illusion that is elicited when a grid of wires moves between two hands, leading to the perception of a velvet‐like object between the hands. This illusion appears to be induced by misinterpreting tactile input from the wires and the opposing hand as a velvety surface. Unlike other somatosensory illusions, the VHI can strongly induce soft and smooth texture percepts. Thus, it provides a unique opportunity to investigate the neural correlates underlying the tactile awareness of texture, a critical object property.
Many neuroimaging studies have examined the neural substrates underlying visual object illusions. In some such studies, activation was identified in higher‐order visual cortical areas, such as area V4 in color illusions (Morita et al., 2004) and area hMT+ in motion illusions (Goebel, Khorram‐Sefat, Muckli, Hacker, & Singer, 1998), supporting the notion that higher regions of the visual hierarchy are associated with the perception of illusions. In contrast, other studies have highlighted the role of the primary sensory cortices in illusions (Kok et al., 2016; Muckli, Kohler, Kriegeskorte, & Singer, 2005). For instance, the Kanizsa triangle illusion induces activation in a region of the primary visual cortex (V1) that retinotopically corresponds to the locations of illusory contours (Kok et al., 2016). In this previous study, deep‐layer activation in V1 was specific to the illusion and was not observed when the locations of illusory contours were stimulated using a checkerboard pattern. Thus, V1 activation during illusory perception cannot be solely explained by bottom‐up visual influences. This indicates that conscious object perception depends on the primary sensory cortices that receive top‐down signals from higher‐order cortices. Whether this role of the primary sensory cortices is applicable to other sensory modalities remains to be determined.
Neuroimaging studies of tactile perception have identified a distributed set of brain networks involved in the perception of real objects. Haptic texture judgments yield activation of brain regions, such as the primary somatosensory cortex (S1) in the postcentral gyrus (Post‐CG), the secondary somatosensory cortex in the parietal operculum (PO), the posterior parietal lobule (Bodegard, Geyer, Grefkes, Zilles, & Roland, 2001; Eck et al., 2016; Kitada et al., 2005; Kitada, Sasaki, Okamoto, Kochiyama, & Sadato, 2014; Roland, O'Sullivan, & Kawashima, 1998; Servos, Lederman, Wilson, & Gati, 2001; Stilla & Sathian, 2008), and the occipital cortex (Eck, Kaas, & Goebel, 2013; Sathian et al., 2011; Stilla & Sathian, 2008). As activity in the PO is associated with the magnitude of the texture percept (Eck et al., 2016; Kitada et al., 2005), the bottom‐up processing of texture information from the S1 to PO may occur (Hsiao, Johnson, & Twombly, 1993; James, Kim, & Fisher, 2007; Sathian, 2016; Sathian et al., 2011). However, how these regions interact with one another to generate tactile awareness of textures remains poorly understood. Previous studies regarding tactile illusions have demonstrated that S1 is associated with illusory mislocalization of tactile sensations (Blankenburg et al., 2006; Bufalari, Di Russo, & Aglioti, 2014; Chen, Friedman, & Roe, 2003). Other studies have also examined the neural substrates associated with conscious detection of tactile stimuli (Auksztulewicz, Spitzer, & Blankenburg, 2012; Hirvonen & Palva, 2016; Linkenkaer‐Hansen, Nikulin, Palva, Ilmoniemi, & Palva, 2004; Meador et al., 2017; Meador, Ray, Echauz, Loring, & Vachtsevanos, 2002; Monto, Palva, Voipio, & Palva, 2008). However, it remains unclear whether S1 is involved in the conscious perception of object properties.
In the present study, we investigated the neural correlates of the VHI using functional magnetic resonance imaging (fMRI). Participants were exposed to different degrees of the illusion as well as real velvet. We hypothesized that S1 is involved in the illusory perception of the velvet texture, interacting with higher order somatosensory cortices, such as the PO and posterior parietal lobule during the illusion.
2. MATERIALS AND METHODS
2.1. Participants
Forty‐eight Japanese individuals aged 19–31 years (mean ± standard deviation [SD] = 23.5 ± 3.6 years) participated in the present study. Twenty‐nine (21 male) and 20 individuals (10 male) participated in the fMRI and psychophysical experiments, respectively. One volunteer participated in both experiments (29 for fMRI + 20 for psychophysics – 1 overlap = 48 total participants). Forty‐seven participants were right‐handed, while one was ambidextrous, as assessed using the Edinburgh Handedness Inventory (Laterality Quotient = 79.9 ± 23.3, mean ± SD) (Oldfield, 1971). None of the participants reported prior loss of tactile sensation or a history of major medical or neurological illnesses such as epilepsy, significant head trauma, or a lifetime history of alcohol dependence. The research was conducted in accordance with the Declaration of Helsinki. All participants provided written informed consent prior to participation. The study protocol was approved by the local medical ethics committees at Nagoya University and the National Institute for Physiological Sciences. All methods were performed in accordance with the approved guidelines.
2.2. Experimental design and statistical analysis
We utilized a within‐subject experimental design involving four conditions, as described below. All behavioral data were analyzed using SPSS software (version 18; IBM Corporation, Armonk, NY). Bonferroni correction was applied to control for multiple comparisons. All fMRI data were analyzed using the Statistical Parametric Mapping 8 (SPM8) software package (Friston, Ashburner, Kiebel, Nichols, & Penny, 2007) (RRID: nif‐0000–00343). We applied family‐wise error (FWE) correction to control for multiple comparisons over the whole brain at the cluster level when the height threshold was set to an uncorrected level of p < .001 (Flandin & Friston, 2017).
2.3. Stimuli
The VHI can be elicited by placing the palms together over vertical and horizontal wires that move back and forth. To examine the brain networks associated with the VHI, we prepared four stimulation conditions (Figure 1a,b). During two conditions, the participants' hands were stimulated by horizontal and vertical carbon wires (3 mm in diameter) that formed a square. In these conditions, the participants felt either a strong illusion (Si) or weak illusion (Wi) in and around the square. In the REAL condition, the participants' hands were stimulated by a sheet of real velvet, while no wires were present in the Nw condition. We developed a novel MRI‐compatible apparatus that allowed us to control the speed and range of stimulation (Figure 1a).
Figure 1.
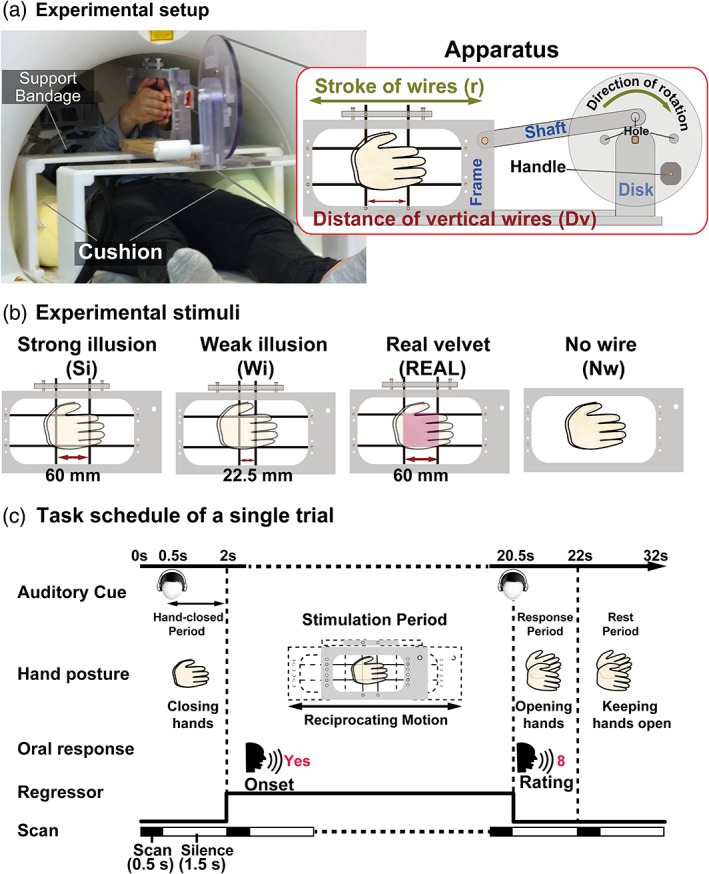
Experimental design. (a) Setup. To induce the velvet hand illusion, we developed an apparatus consisting of a disk attached to a shaft, which was connected to the frame to which the wires were attached. An experimenter rotated the disk in a visually guided manner, causing a reciprocating motion of the frame along the horizontal axis. The disk contained holes that enabled the experimenter to manipulate the extent of horizontal movement (stroke, r). The participant's arms were bound with a support bandage and placed on cushions, enabling them to close their hands easily with minimal extraneous movement. (b) Stimuli and conditions. There were four stimuli and conditions: Strong illusion (Si), weak illusion (Wi), REAL velvet (REAL), and no wire (Nw). In the Si and Wi conditions, two vertical and horizontal wires stimulated the participants' hands. In the REAL condition, a sheet of velvet was used to cover the wires. Distances between vertical wires (D v) differed among these conditions. The stroke values were set to match the area of the hands stimulated by at least one of the wires. In the Nw condition, neither velvet nor wires stimulated the hands. The mean speed of frame movement was approximately 80 mm/s in all conditions. (c) Task schedule. A single trial consisted of four periods. During the hands‐closed period, participants were presented with a 1‐s cue instructing them to close their hands. During the stimulation period, the wire frame began moving 2 s after the onset of the trial, with movement lasting for a total of 18.5 s. During the stimulation period, participants orally reported when they perceived a velvet‐like object between their hands. During the response period, participants opened their hands and orally rated the likelihood that a nonwire object was present between their hands (i.E., the strength of the object percept). During the rest period, participants kept their hands open and relaxed
2.3.1. VHI conditions
We prepared frames for the Si and Wi conditions by manipulating the distance between the two vertical wires based on previous psychophysical findings (Mochiyama et al., 2005; Ohka et al., 2010; Rajaei et al., 2012). More specifically, the intensity of the illusion is determined by two parameters: the distance between the two vertical wires (D v) and the amplitude of the horizontal movement of each wire (“stroke,” r) (Figure 1a). The degree of the illusion reaches its maximum when r and D v are identical (r/D v ≈ 1; Rajaei et al., 2012). Based on this rule, both the distance (D v) and stroke (r) were set at 60 mm (r/D v = 1) in the Si condition, whereas D v was 22.5 mm and r was 100 mm (r/D v = 4.4) in the Wi condition. The values of r and D v were determined by considering two additional factors. First, given the somatotopy of S1, it is important to stimulate the same area of the palms across all conditions. This area depends on the maximum range of stimulation, where the skin is stimulated by at least one wire (i.e., r + D v). Therefore, we matched this maximum range of stimulation between the Si (120 mm) and Wi (122.5 mm) conditions. Second, we ensured that the range of horizontal stimulation was within the distal‐proximal length of the experimenter's hands. The distance between the horizontal wires (D h) was adjusted for each participant (40, 60, or 80 mm) to ensure that the intensity of the illusion was high enough in the Si condition. The same D h was used for both the Si and Wi conditions.
2.3.2. Conditions involving real velvet (REAL) and no wire (Nw)
We designed the REAL and Nw conditions to elicit activity in brain regions involved in the tactile perception of real velvet. In the REAL condition, the values of r and D v were identical to those used in the Si condition (r = 60 mm and D v = 60 mm). For the REAL condition, we placed a sheet of plastic within the wire grid, which was then covered with a sheet of real velvet, resulting in a total thickness of 4 mm. For each participant, D h was the same in the REAL condition as in both illusion conditions. In the Nw condition, neither wires nor real velvet stimulated the participant's hands; instead, the participant kept his or her palms together in an empty frame that was moved with an r of 80 mm.
2.3.3. Stimulus presentation
The shaft of the apparatus was connected to a frame, in which the wires were strung (Figure 1a). When the experimenter manually rotated a disk using a handle, the frame oscillated horizontally. To set the r values, we placed the shaft at three different locations on the disk: 30 mm away from the center of the disk to set r to 60 mm (for the Si and REAL conditions), 40 mm away to set r to 80 mm in the Nw condition, and 50 mm away to set r to 100 mm (for the Wi conditions).
The experimenter manually rotated the disk at different angular velocities in a visually guided manner: 5.0 (1.6 × π) rad/s in the Wi condition, 7.9 (2.0 × π) rad/s in the Nw condition, and 8.5 (2.7 × π) rad/s in the Si and REAL conditions. Thus, the mean speed of horizontal wire movement was approximately 80 mm/s for all conditions (v = radius of the disk × angular velocities; 50 × 1.6 for Wi, 40 × 2.0 for Nw, and 30 × 2.7 for Si and REAL). We chose this speed because it produced the strongest illusion in our previous study (Rajaei et al., 2012).
During MRI scanning, participants wore MRI‐compatible headphones and lay in the supine position with their eyes closed (Kiyohara Optics, Tokyo, Japan). Participants' heads were fixed using foam pads and tape to minimize movement, and they were instructed to remain relaxed during scanning. We attached a customized opto‐microphone system (Kobatel Corporation, Yokohama, Japan) to the head coil to record oral responses. The participants were asked to extend their arms and hands on either side of the apparatus, which was fixed to two plastic tables placed above the participant on the scanner bed (Figure 1a). To ensure that participants could comfortably maintain this position throughout the experiment, their upper arms were bound with soft support bandages, such that the arms rested above the body. Their arms were further supported by two large cushions placed between the participant's body and each side of the interior wall of the scanner. When the arms were relaxed, the distance between each participant's hands reached up to 20 cm.
Two experimenters stood beside the scanner during the experiment. One experimenter held the handle and rotated the disk clockwise. His movements were guided by visual cues on the wall of the scanner room, which were projected using an LCD projector (CP‐X8250; Hitachi, Tokyo, Japan) located outside of the scanner room. These cues consisted of an object moving around a circle at the angular velocity at which the disk should be turned. Visual stimuli were presented to the experimenters only. Presentation software (Neurobehavioral Systems Inc., Albany, CA) was used to present visual stimuli to the experimenter and auditory cues to the participants via headphones. We also recorded the participants' hand movements using an MR‐compatible video camera, which was installed within the scanner. The other experimenter helped the experimenter to change the frames during the rest period.
2.4. Measurement of the force between the hands during the illusion
Due to technical constraints, we were unable to accurately measure the force between the hands during wire movement in the MRI scanner. To overcome this limitation, we examined the force between the hands via a psychophysical experiment conducted outside of the scanner. The experimental setup was the same as for the fMRI experiment except that the participants sat at a table on which the apparatus was installed, and each condition was repeated 5 times in total. An air pressure sensor (3.5 × 3.5 cm2; Minamoto Medical, Chiba, Japan) was attached on the thenar eminence of the right hand, such that the sensor did not come in contact with the moving wires. The pressure sensor was connected to a data acquisition device (ML846 PowerLab 4/26; ADInstruments, Dunedin, NZ) through a custom‐made force measurement interface (Minamoto Medical). Standard Windows‐based software (LabChart, ADInstruments) was used to record the force between the two hands.
2.5. Functional MRI experiment
2.5.1. Data acquisition
The present study utilized a 3 T whole‐body scanner (Verio; Siemens, Erlangen, Germany) with a 32‐element phased‐array head coil. To obtain T2*‐weighted (functional) images, we used a multiband echo‐planar imaging (EPI) sequence that collected multiple EPI slices simultaneously, reducing the repetition time (TR) per volume (Feinberg et al., 2010). Specifically, the following parameters were used to cover the whole brain: gradient‐echo EPI, TR = 2000 ms, acquisition time (TA) = 500 ms, multiband factor = 6, integrated Parallel Acquisition Techniques (iPAT) = 2, echo time (TE) = 30 ms, flip angle = 77; 42 axial slices of 3 mm in thickness with a 17% slice gap, field‐of‐view = 192 × 192 mm, in‐plane resolution = 3.0 × 3.0 mm, and 219 volumes per run. We adopted a “sparse sampling” technique (Hall et al., 1999) in which the cluster‐volume acquisition time was 500 ms, followed by a 1,500‐ms silent period. This silent period was used to reduce the influence of head motion on the functional data during oral responses. T1‐weighted high‐resolution anatomical images were also acquired for each participant using magnetization‐prepared rapid acquisition gradient echo (MP‐RAGE) sequences (TR = 1800 ms; TE = 2.97 ms; flip angle = 9°; voxel size = 1.0 × 1.0 × 1.0 mm).
2.5.2. Task
Each participant completed five runs of the task, which included each of the four conditions (Si, Wi, REAL, and Nw). A single run consisted of twelve 32‐s trials (384 s in total) (Figure 1c) proceeded by 42 s rest and followed by 12 s rest (384 + 42 + 12 = 438 s in total). Each condition was repeated three times in a single run (three repetitions × four conditions = 12 trials). The order of the four conditions in each run was pseudorandomized, such that the same conditions were not repeated in succession. In each trial, participants were presented with a 1 s auditory cue instructing them to close their hands 0.5 s after the onset of the trial (hands‐closed period). The wire frame began to move 2 s after the onset of the trial, and the movement lasted for 18.5 s (stimulation period). Within the stimulation period, participants were instructed to briefly respond (say “yes” in Japanese) during the silent period (1.5 s for each scan) immediately after they felt an object other than wires between their hands. Thus, participants responded when they began to experience the illusion in the Si and Wi conditions, and when they began to feel the velvet in the REAL condition. Following the stimulation period, participants were instructed to slowly open their hands within 1.5 s and orally report the likelihood that a non‐wire object was present between their hands on a scale ranging from 0 (no object at all) to 10 (absolutely felt an object) (response period). The response period corresponded to the 1.5 s of the silent period of fMRI data acquisition. Finally, participants kept their hands open and relaxed for 10 s (rest period). Within the rest period, the experimenters changed the frames for the next trial (32 s per trial = 2 s hands‐closed period + 18.5 s stimulation period + 1.5 s response period + 10 s rest period).
2.5.3. Data processing and analysis
The first six volumes of each fMRI run were discarded to allow the MR signal to reach a state of equilibrium. The remaining volumes were used for the subsequent analyses. To correct for head motion, functional images from each run were realigned to the first image and again realigned to the mean image after the first realignment. The T1‐weighted anatomical image was co‐registered to the mean of all realigned images. Prior to co‐registration, the T1‐weighted anatomical image was skull‐stripped to prevent non‐brain tissue from affecting the alignment between the EPI and T1 images. Each co‐registered T1‐weighted anatomical image was normalized to Montreal Neurological Institute (MNI) space using the DARTEL procedure (Ashburner, 2007). More specifically, each anatomical image was segmented into tissue class images using a unified segmentation approach. Gray and white matter images were transformed into a common coordinate space to create a study‐specific template using the DARTEL registration algorithm. The study‐specific template was then affine‐normalized to MNI space using the ICBM Probabilistic Atlases (http://www.bmap.ucla.edu/portfolio/atlases/ICBM_Probabilistic_Atlases). The parameters from DARTEL registration and normalization to MNI space were then applied to each functional image and the T1‐weighted anatomical image. The normalized functional images were filtered using a Gaussian kernel of 4 mm full‐width at half‐maximum (FWHM) in the x, y, and z axes. We then conducted mass‐univariate analysis and functional connectivity analysis, as described below.
2.6. Individual analysis
A general linear model was fitted to the fMRI data for each participant. The blood‐oxygen‐level dependent (BOLD) signal for stimulation periods was modeled using boxcar functions convolved with the canonical hemodynamic response function. A design matrix comprising the five runs was prepared for each participant. Each run included four task‐related regressors (one for each condition). The time series for each participant was high‐pass filtered at 1/128 Hz. Assuming a first‐order autoregressive model, the serial autocorrelation was estimated from the pooled active voxels with the restricted maximum likelihood procedure and was used to whiten the data. Motion‐related artifacts were minimized by incorporating the six parameters (three displacements and three rotations) from the rigid‐body realignment stage into each model. The parameter estimates for each condition in each participant were evaluated using linear contrasts.
2.7. Random‐effects group analysis
Contrast images from the individual analyses were used for the group analysis, with between‐subjects variance modeled as a random factor. The contrast images obtained from the individual analyses represent the normalized task‐related increment of the MR signal of each participant. In all analyses, the estimates for the conditions were compared using linear contrasts. The resulting set of voxel values for each contrast constituted the SPM{t}. The threshold for the SPM{t} was set to p < .001 (uncorrected). The statistical threshold for the spatial extent test on the clusters was set at p < .05, family‐wise error (FWE) corrected for multiple comparisons over the whole brain. The height threshold is sufficiently high to use the random‐field theory to control FWE rate (Flandin & Friston, 2017). Brain regions were anatomically defined and labeled in accordance with probabilistic atlases (Shattuck et al., 2008) and an anatomical MRI averaged over all participants.
We then aimed to identify brain regions exhibiting greater activation in the Si than in the Wi condition [Si – Wi]. As the strength of the illusion varied across participants, we conducted a simple regression analysis on the contrast images of (Si – Wi). We subtracted the rating of the object percept in the Wi condition from that in the Si condition for each participant and used these values as covariates. We evaluated the constant term corresponding to the group mean of (Si – Wi) ([Si – Wi]mean) and the covariate accounting for individual difference ([Si – Wi]covariate), separately. In other words, [Si – Wi]covariate and [Si – Wi]mean correspond to the slope (β) and constant term (α) in a simple regression analysis (y = βx + α + ε), respectively.
To investigate which brain regions are commonly involved in illusory perception and the perception of real velvet, we conducted a one‐sample t test for the contrast images of (REAL – Nw). We then evaluated the conjunction between illusory ([Si – Wi]mean and/or [Si – Wi]covariate) and actual velvet perception (REAL – Nw) using an inclusive masking procedure. This approach is similar to the standard conjunction analysis, as the whole brain was used as the search volume for the overlap of activation. Thus, this analysis should not have biased the statistical inference (“double dipping,” Kriegeskorte, Simmons, Bellgowan, & Baker, 2009). To examine which brain regions exhibit greater activation during illusory than actual perception, we conducted one‐sample t tests for the contrast images of (Si – REAL).
2.8. Supplementary brain activation analysis
We conducted the two supplementary brain activation analyses. First, to evaluate the hemispheric laterality of the illusion‐related brain regions, we flipped contrast images of Si – Wi in the horizontal (right–left) direction and subtracted them from the nonflipped contrast images (Kitada et al., 2006). We then evaluated the constant term by conducting the same simple regression analysis used for the main analysis. Second, we evaluated brain activity associated with the illusion by modeling the BOLD signal for the duration of the illusion. This analysis was identical to the main analysis except that the onset of the illusion was regarded as the onset of the trial in the regressors of the illusion conditions. To equally model activity associated with tactile stimulation, we used the mean onset of the illusion in the Si condition as a regressor in both the Si and Wi conditions for each participant.
2.9. Psychophysiological interaction (PPI) analysis
We conducted psychophysiological interaction (PPI) analysis (Friston et al., 1997; O'Reilly, Woolrich, Behrens, Smith, & Johansen‐Berg, 2012) to test the hypothesis that S1 interacts with higher order somatosensory cortices, such as the PO and posterior parietal lobule during illusory perception. As shown below, conventional PPI analysis utilizes activated regions as seed regions. However, mass‐univariate analysis that was used in brain activation analysis evaluates activity of each voxel separately and hence does not examine relationship between distinct regions. Moreover, while signals derived from activated regions may be biased by positive noise (Kriegeskorte et al., 2009), such signals are used as a regressor of no interest (i.e., physiological factor) to remove this effect when selecting regions exhibiting PPI effects. Thus, selecting a seed region based on the same data should not lead to biased inference.
To determine the seed region for the PPI analysis, we initially evaluated the conjunction of (Si – Wi)mean, (Si – Wi)covariate, and (REAL – Nw) in the group analysis. We selected the top peak coordinate (group maximum) in the left Post‐CG (x = −40, y = 20, z = 44), which was also the peak coordinate for (Si – Wi)covariate. We then defined the seed region of each participant as the area of overlap between voxels depicted by the contrast of Si – Wi in each participant's data (at the height threshold of p < .05 uncorrected) and an area 8 mm in diameter around the group maximum. This liberal height threshold for selecting participant‐specific activation has also been adopted in previous studies that examined functional or effective connectivity (Grol et al., 2007; Stephan, Marshall, Penny, Friston, & Fink, 2007; Vossel, Weidner, Driver, Friston, & Fink, 2012; Yang et al., 2017). Time‐series data were adjusted for effects of interest (i.e., task conditions) and extracted by taking the first eigenvariate across voxels in this region of interest (ROI). The first eigenvariate reflects the first principal component of the time course of a region's response (i.e., the principal source of variance within a region), without assuming that all voxels contribute equally (Ewbank, Henson, Rowe, Stoyanova, & Calder, 2013). Thus, the eigenvariate exhibits relatively little noise when compared with the raw MR signal. We conducted the same analysis with the seed region in the right Post‐CG, with one exception; as (Si – Wi)covariate did not reveal activation in the right Post‐CG, the peak coordinate of the conjunction of (Si – Wi)mean, and (REAL – Nw) (x = 42, y = −20, z = 58) was used as the group maximum.
We calculated the PPI terms between the seed region and psychological factors according to the following three steps. First, the extracted MR signal from each seed region was deconvolved with the canonical hemodynamic response function. The resulting time series represented an approximation of neural activity. Second, the neural time series data were centered and multiplied (dot product) by a psychological factor. We used the contrast of (Si – Wi) as a psychological factor. Finally, the interaction time series was convolved with the hemodynamic response function, representing an interaction variable at the hemodynamic level (PPI term).
The design matrix at the individual level included not only the PPI regressor but also the time series of the seed region (physiological factor), the psychological factor, and realignment parameters as regressors of no interest. We evaluated the linear contrast of the PPI regressor for each participant, and the resultant contrast image was used for subsequent group analysis (simple regression analysis using the relative strength of the object percept as a covariate). We applied the same statistical threshold utilized for other analyses.
3. RESULTS
3.1. Task performance
We confirmed that the strength of the object percept (i.e., the likelihood that a non‐wire object had been present between the participant's hands) was stronger in the Si condition than in the Wi condition (Figure 2a). One‐way repeated‐measures analysis of variance (ANOVA, four levels of conditions) revealed a significant main effect for the strength of the object percept (F [3,84] = 499.2, p < .001), and post hoc pairwise comparisons with Bonferroni correction revealed that the object percept was significantly stronger in the REAL condition than the Si condition, in the Si condition than the Wi condition, and in the Wi condition than the Nw condition (p values < .001).
Figure 2.
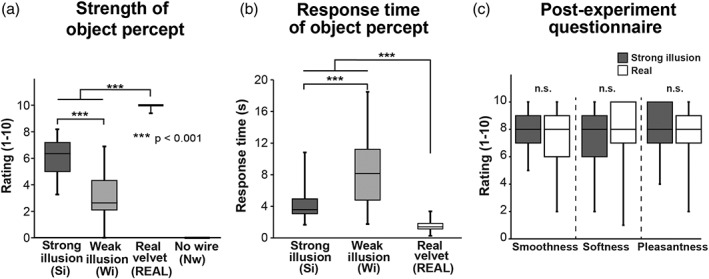
Behavioral results. Behavioral results are presented as box plots of data for 29 participants. An asterisk between bars indicates a significant difference revealed by post hoc pairwise comparisons with Bonferroni correction. (a) Ratings for the strength of the nonwire object percept between the two hands. (b) the point at which participants perceived the nonwire object between the hands (onset). The value was calculated relative to the onset of stimulation. No response time was obtained in the no wire (Nw) condition. (c) Postexperiment ratings of smooth, soft, and pleasant perceptions for illusory and actual velvet perception. N.S. Indicates a lack of statistical significance
As we obtained no response in the Nw condition, we analyzed the onset of perception in the Si, Wi, and REAL conditions. The onset was delayed in the Wi condition, relative to that in the Si condition (Figure 2b). One‐way repeated‐measures ANOVA revealed a significant main effect for the onset (F [2, 56] = 61.9, p < .001), and post hoc pair‐wise comparisons with Bonferroni correction revealed that percept onset occurred significantly later in the Wi condition than the Si condition, and in the Si condition than the REAL condition (p values < .001).
The postexperiment questionnaire on the magnitudes of smoothness, softness, and pleasantness revealed no significant differences between the Si and REAL conditions (t[28] = 2.0, p = .06 for smoothness; t[28] = −0.37, p = .72 for softness; t[29] = 0.85, p = .40 for pleasantness). This suggests that percepts of actual and illusory textures are comparable (Figure 2c).
We conducted psychophysical experiments outside of the scanner to measure the pressure between the hands during illusory and actual perception. The behavioral patterns were highly similar to the results of the fMRI experiment (5.8 ± 0.3 for Si, 3.0 ± 0.3 for Wi, 9.8 ± 0.1 for REAL, and 0 ± 0 for Nw, mean ± SEM for strength of object percept), and hand pressures were comparable among the conditions (2.1 ± 0.3 N for Si, 2.3 ± 0.3 N for Wi, 2.1 ± 0.3 N for REAL, and 2.1 ± 0.3 N for Nw). One‐way repeated‐measures ANOVA revealed no significant differences in hand pressures among the conditions (F [3, 57] = 0.3, p = .8).
3.2. fMRI results
3.2.1. Brain activity during the VHI
To identify brain regions involved in the VHI, we examined brain activity during the Si relative to that during the Wi. As the strength of the illusion (i.e., the strength of the object percept) varied across participants (Figure 2a), we conducted a simple regression analysis using the relative strength of the illusion as a covariate. Mean activity across the participants (mean, [Si – Wi]mean) and activity related to the strength of illusion (covariate, [Si – Wi]covariate) were derived from this analysis.
Analyses of [Si – Wi]mean revealed regions of significant activation in the bilateral Post‐CG, bilateral precentral gyrus (Pre‐CG), left lingual gyrus, left parahippocampal gyrus, bilateral medial prefrontal cortex, and left thalamus (Figure 3a, left and Table 1). In contrast, analyses of [Si – Wi]covariate revealed significant activation in the left Post‐CG, left superior parietal lobule (SPL), and bilateral cerebellum (Figure 3a, right and Table 1). Overlapping brain activation between (Si – Wi)covariate and (Si – Wi)mean was located in the anterior wall of the Post‐CG, presumably corresponding to area 3 in S1 (Geyer, Schleicher, & Zilles, 1999) (Figure 3b and Table 1).
Figure 3.
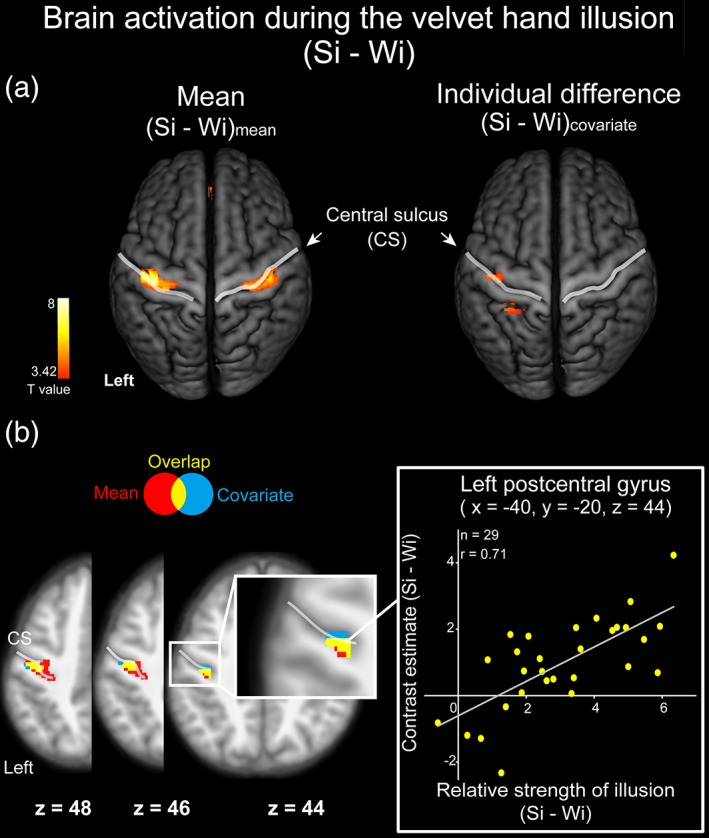
Brain activation associated with the strength of the velvet hand illusion. Brain activation during the velvet hand illusion (strong illusion relative to weak illusion, Si – Wi) in the group analysis. The statistical threshold for the spatial extent test was set at p < .05, family‐wise error (FWE)‐corrected for multiple comparisons over the whole brain when the height threshold was set at p < .001 (uncorrected). (a) Mean illusion‐related activation for all participants ([Si – Wi]mean, left) and activation that was positively correlated with the strength of the illusion across participants ([Si – Wi]covariate, right). Activation is shown on a 3‐D rendered T1‐weighted MR image averaged across all participants. (b) Overlap of activation between (Si – Wi)mean and (Si – Wi)covariate shown on horizontal sections of the T1‐weighted MR image averaged across all participants. The red‐colored area indicates (Si – Wi)mean; the blue‐colored area indicates (Si – Wi)covariate; the yellow‐colored area indicates the overlap of (Si – Wi)mean and (Si – Wi)covariate. The scatterplot shows activity for all participants at the peak coordinate of the hand area in the left‐postcentral gyrus. CS: Central sulcus
Table 1.
Brain activation related to the velvet hand illusion
| Spatial extent test | MNI coordinate | Z values | Location | ||||
|---|---|---|---|---|---|---|---|
| Cluster size (mm3) | p values | x | y | z | Hem | Area | |
| Group mean | |||||||
| (a simple regression analysis on Si − Wi, mean) (Figure 3) | |||||||
| 3,896 | <.001 | −38 | −22 | 46 | 5.56 | L | Postcentral gyrus |
| −32 | −24 | 64 | 4.11 | L | Precentral gyrus | ||
| 2,960 | <.001 | 42 | −20 | 58 | 4.4 | R | Postcentral gyrus |
| 36 | −22 | 64 | 4.36 | R | Precentral gyrus | ||
| 432 | .034 | −22 | −48 | 0 | 4.06 | L | Lingual gyrus |
| −12 | −40 | −8 | 3.85 | L | Parahippocampal gyrus | ||
| 712 | .002 | 0 | 42 | −10 | 3.95 | Medial prefrontal cortex | |
| 680 | .003 | −10 | −4 | 6 | 3.97 | L | Thalamus |
| Individual difference | |||||||
| (a simple regression analysis on Si ‐ Wi, covariate) (Figure 3) | |||||||
| 504 | .015 | −40 | −20 | 44 | 4.29 | L | Postcentral gyrus |
| 488 | .018 | −34 | −40 | 66 | 4.13 | L | Superior parietal lobule |
| 520 | .013 | −2 | −62 | −22 | 3.79 | L | Cerebellum (lobule V) |
| 408 | .044 | 20 | −48 | −22 | 5.03 | R | Cerebellum (lobule VI) |
Abbreviations: Hem, Hemisphere; R, right hemisphere; L, left hemisphere; MNI: Montreal Neurological Institute.
The statistical threshold for the spatial extent test was set at p < .05, family‐wise‐error (FWE)‐corrected for multiple comparisons over the whole brain when the height threshold was set at p < .001 (uncorrected). The x, y, and z values represent stereotaxic coordinates (mm). Z values that were transformed from SPM{t} are listed for each set of peak coordinates. Lobules in the cerebellum were determined using probabilistic maps (Diedrichsen, Balsters, Flavell, Cussans, & Ramnani, 2009).
We examined the hemispheric lateralization of brain activity revealed by the analyses of (Si – Wi) (Kitada et al., 2006). Although we observed no significant activation, the left‐lateralized activity in the Post‐CG showed a trend toward significance (p = .058 FWE‐corrected at the cluster level over the whole brain).
3.2.2. Common brain regions activated during illusory and actual object perception
We examined regions of common activation during actual and illusory velvet perception. Haptic perception of real velvet relative to the Nw condition (REAL – Nw) revealed regions of significant activation bilaterally in the Post‐CG, Pre‐CG, SPL, PO, and other regions (Supporting Information Figure S1). The conjunction analysis between (Si – Wi)mean and (REAL – Nw) revealed significant activation in the bilateral Post‐CG (corresponding to the anterior wall and crown) and Pre‐CG (Figure 4 and Table 2). The conjunction analysis between (Si – Wi)covariate and (REAL – Nw) also revealed regions of significant activation in the left Post‐CG, left Pre‐CG, left SPL, and bilateral cerebellum (Table 2).
Figure 4.
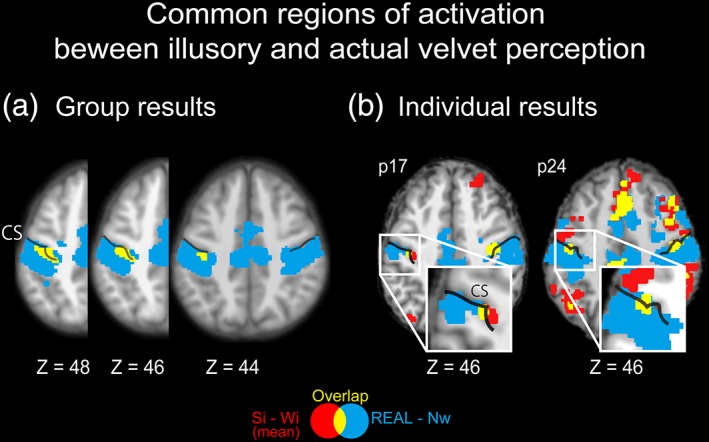
Common regions of activation between actual and illusory velvet perception. (a) Brain activation depicted as the difference between actual velvet perception (REAL) and the no wire (Nw) condition (REAL – Nw) and between the strong and weak illusion conditions [(Si – Wi)mean]. The blue‐colored and red‐colored areas indicate regions of significant activation revealed by REAL – Nw and (Si – Wi)mean, respectively. The yellow‐colored area indicates the common activation between (Si – Wi)mean and REAL – Nw. Activation is shown on horizontal sections of the T1‐weighted MR image averaged across all participants. Z indicates MNI coordinates. The statistical threshold for the spatial extent test was set at p < .05, family‐wise‐error (FWE)‐corrected for multiple comparisons over the whole brain when the height threshold was set at p < .001 (uncorrected). (b) Results for representative participants. Activation is shown on horizontal sections of the T1‐weighted MR image in each participant. The statistical threshold was the same as that utilized for the group analysis. MNI: Montreal neurological institute
Table 2.
Brain regions commonly activated during illusory and actual velvet perception
| Spatial extent test | MNI coordinate | Z values | Location | ||||
|---|---|---|---|---|---|---|---|
| Cluster size (mm3) | p values | x | y | z | Hem | Area | |
|
Conjunction analysis between illusion and actual velvet perception [(Si – Wi) mean] & [REAL – Nw] (Figure 4) | |||||||
| 3,792 | <.001 | −38 | −22 | 46 | 5.56 | L | Postcentral gyrus |
| −32 | −24 | 64 | 4.11 | L | Precentral gyrus | ||
| 2,816 | <.001 | 42 | −20 | 58 | 4.4 | R | Postcentral gyrusa |
| 36 | −22 | 64 | 4.36 | R | Precentral gyrus | ||
| [(Si – Wi) covariate] & [REAL – Nw] | |||||||
| 448 | .028 | −40 | −20 | 44 | 4.29 | L | Postcentral gyrusa |
| −38 | −18 | 54 | 3.45 | L | Precentral gyrus | ||
| 424 | .037 | −34 | −40 | 66 | 4.13 | L | Superior parietal lobule |
| 408 | .044 | 20 | −48 | −22 | 5.03 | R | Cerebellum (lobule VI) |
| 496 | .017 | −2 | −62 | −22 | 3.79 | L | Cerebellum (lobule V) |
| 12 | −64 | −18 | 3.54 | R | Cerebellum (lobule VI) | ||
Abbreviations: Hem, Hemisphere; R, left hemisphere; L, left hemisphere; MNI: Montreal Neurological Institute.
The statistical threshold for the spatial extent test was set at p < .05, family‐wise‐error (FWE)‐corrected for multiple comparisons over the whole brain when the height threshold was set at p < .001 (uncorrected). The x, y, and z values represent stereotaxic coordinates (mm). Z values that were transformed from SPM{t} are listed for each set of peak coordinates.
Indicates the seed regions used for the PPI analysis (Table 4). The seed region in the left hemisphere also corresponds to the peak coordinate of the conjunction among [Si – Wi]mean, [Si – Wi]covariate, and REAL – Nw in the postcentral gyrus.
As the onset of the VHI was not identical to the onset of the stimulation period, we conducted a supplemental analysis using a design matrix in which the onset of each trial for illusion‐related regressors was set equal to the onset of the VHI. The analysis of (Si – Wi)mean revealed several regions of significant activation, including the Post‐CG (Supporting Information Table S1). Moreover, this activation in the Post‐CG overlapped with that identified by the analysis of (REAL – Nw) (Supporting Information Table S2), supporting the results of the main analysis.
3.2.3. Activation was stronger during illusory than actual perception
We further investigated brain regions exhibiting greater activation in response to illusory perception than to the perception of actual velvet. The contrast of (Si – REAL) revealed significant activation bilaterally in the Post‐CG, Pre‐CG, SPL, PO, superior, middle, and inferior frontal gyrus, supramarginal gyrus, insula, putamen, caudate nucleus, and cerebellum. Activation was also observed in the right precuneus (Table 3).
Table 3.
Activation was greater for illusory than actual velvet perception (Si – REAL)
| Spatial extent test | MNI coordinates | Z values | Location | ||||
|---|---|---|---|---|---|---|---|
| Cluster size (mm3) | p values | x | y | z | Hem | Area | |
| 48,184 | <.001 | 42 | −22 | 56 | 4.36 | R | Postcentral gyrus |
| 24 | −4 | 48 | 5.11 | R | Middle frontal gyrus | ||
| −6 | 14 | 48 | 5.81 | L | Superior frontal gyrus | ||
| 6 | 16 | 48 | 5.95 | R | Superior frontal gyrus | ||
| 64 | −18 | 34 | 5.05 | R | Supramarginal gyrus | ||
| 50 | 6 | 30 | 5.57 | R | Precentral gyrus | ||
| 56 | 12 | 20 | 6.22 | R | Inferior frontal gyrus | ||
| 44 | −2 | 14 | 3.63 | R | Parietal operculum | ||
| 26 | 16 | 2 | 5.81 | R | Putamen | ||
| 32 | 20 | 0 | 7.3 | R | Insula | ||
| 30,520 | <.001 | −24 | −6 | 54 | 5.13 | L | Superior frontal gyrus |
| −38 | −38 | 40 | 6 | L | Supramarginal gyrus | ||
| −42 | −42 | 52 | 4.75 | L | Superior parietal lobule | ||
| −54 | −22 | 38 | 5.42 | L | Postcentral gyrus | ||
| −60 | −20 | 32 | 5.55 | L | Postcentral gyrus | ||
| −44 | 0 | 28 | 5.08 | L | Precentral gyrus | ||
| −56 | 8 | 28 | 5.53 | L | Precentral gyrus | ||
| −60 | −22 | 18 | 4.52 | L | Parietal operculum | ||
| −54 | 10 | 14 | 5.12 | L | Inferior frontal gyrus | ||
| −36 | 16 | −2 | 5.91 | L | Insula | ||
| 9,680 | <.001 | −22 | −64 | −24 | 5.87 | L | Cerebellum (lobule VI) |
| 28 | −70 | −22 | 5.03 | R | Cerebellum (lobule VI) | ||
| 2,992 | <.001 | −18 | −62 | −50 | 5.65 | L | Cerebellum (lobule VIII) |
| 5,360 | <.001 | −16 | 0 | 18 | 5.5 | L | Caudate nucleus |
| 12 | −4 | 16 | 4.6 | R | Caudate nucleus | ||
| 9,112 | <.001 | 40 | 36 | 20 | 5.32 | R | Middle frontal gyrus |
| 40 | 36 | 14 | 5.07 | R | Inferior frontal gyrus | ||
| 1,344 | <.001 | −14 | 12 | 0 | 4.01 | L | Caudate nucleus |
| −24 | 2 | −6 | 4.87 | L | Putamen | ||
| 904 | .001 | −2 | −60 | −8 | 4.21 | L | Cerebellum (lobule V) |
| 8 | −56 | −10 | 4.12 | R | Cerebellum (lobule V) | ||
| 976 | <.001 | −30 | 52 | 18 | 4.65 | L | Middle frontal gyrus |
| 672 | .005 | −38 | 32 | 20 | 4.12 | L | Middle frontal gyrus |
| 664 | .005 | 20 | −70 | 54 | 4.03 | R | Superior parietal lobule |
| 10 | −72 | 44 | 4.04 | R | Precuneus | ||
Abbreviations: Hem, Hemisphere; R, left hemisphere; L, left hemisphere; MNI: Montreal Neurological Institute.
The statistical threshold for the spatial extent test was set at p < .05, family‐wise‐error (FWE)‐corrected for multiple comparisons over the whole brain when the height threshold was set at p < .001 (uncorrected). The x, y, and z values represent stereotaxic coordinates (mm). Z values that were transformed from SPM{t} are listed for each set of peak coordinates. Lobules in the cerebellum were determined using probabilistic maps (Diedrichsen et al., 2009).
3.3. PPI analysis
We then tested the hypothesis that the illusion changes the functional connectivity between the S1 and higher order somatosensory regions. To achieve this aim, we conducted a PPI analysis with activity in the left Post‐CG as a physiological factor (seed region) and (Si – Wi) as a psychological factor. We analyzed data from a total of 25 participants after excluding data from four in whom no area met the criteria for seed selection (see Section 2 for further details). Group analyses were conducted using the relative strength of the illusion as a covariate. As the analysis of the covariate revealed no significant PPI effects accounting for individual differences, we focused the analysis on mean PPI effects across participants. This analysis revealed significant effects in the bilateral Post‐CG, bilateral Pre‐CG, left SPL, left PO, right insula, and bilateral cerebellum (Figure 5 and Table 4). The PPI analysis with activity in the right Post‐CG as a physiological factor revealed significant activation in the right Post‐CG only (Supporting Information Table S3).
Figure 5.
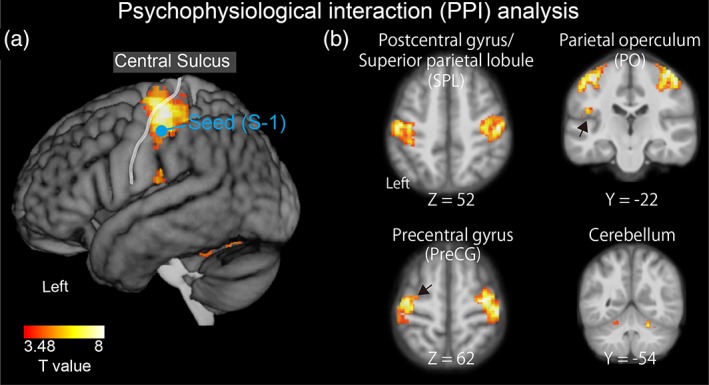
Psychophysiological interaction (PPI) analysis. The primary somatosensory cortex (S1) was chosen as the seed region, while the difference between the strong and weak illusions (Si – Wi) was chosen as the psychological factor. The blue circle shows the location of the seed region activated during the illusion (Figures 3 and 4). The statistical threshold for the spatial extent test was set at p < .05, family‐wise‐error (FWE)‐corrected for multiple comparisons over the whole brain when the height threshold was set at p < .001 (uncorrected)
Table 4.
The PPI analysis (Figure 5)
| Spatial extent test | MNI coordinate | Z values | Location | ||||
|---|---|---|---|---|---|---|---|
| Cluster size (mm3) | p values | x | y | z | Hem | Area | |
| Main PPI effect | |||||||
| 10,704 | <.001 | 48 | −20 | 56 | 5.97 | R | Postcentral gyrus |
| 34 | −16 | 62 | 5.96 | R | Precentral gyrus | ||
| 8,184 | <.001 | −42 | −24 | 56 | 5.78 | L | Postcentral gyrus |
| −34 | −10 | 66 | 4.73 | L | Precentral gyrus | ||
| −36 | −34 | 52 | 4.41 | L | Postcentral gyrus/superior parietal lobule | ||
| 544 | .004 | −46 | −22 | 22 | 4.79 | L | Parietal operculum |
| 352 | .048 | 30 | 20 | 8 | 4.36 | R | Insula |
| 832 | <.001 | −10 | −68 | −54 | 5.04 | L | Cerebellum (lobule VIII) |
| 696 | .001 | 16 | −62 | −46 | 4.9 | R | Cerebellum (lobule VIII) |
| 576 | .003 | 22 | −54 | −24 | 4.81 | R | Cerebellum (lobule VI) |
| 1,088 | <.001 | −20 | −46 | −26 | 4.37 | L | Cerebellum (lobule V) |
Abbreviations: Hem, Hemisphere; R, right hemisphere; L, left hemisphere; MNI: Montreal Neurological Institute.
The statistical threshold for the spatial extent test was set at p < .05, family‐wise‐error (FWE)‐corrected for multiple comparisons over the whole brain when the height threshold was set at p < .001 (uncorrected). The x, y, and z values represent stereotaxic coordinates (mm). Lobules in the cerebellum were determined using probabilistic maps (Diedrichsen et al., 2009).
4. DISCUSSION
In the present study, we examined the brain networks activated by the VHI. Our results demonstrated that activity in S1 and the Pre‐CG was associated with the strength of both illusory and actual velvet perception. Moreover, the strength of the VHI modulated functional connectivity between S1 and brain regions such as the Post‐CG, Pre‐CG, SPL, PO, insula, and cerebellum.
In accordance with the findings of our previous study (Rajaei et al., 2012), the present results confirmed that the strength of the illusion depends on the ratio between the range of horizontal movement for each wire (r) and the inter‐wire distance (D v). We matched not only the speed, but also the area of the hands stimulated by at least one of the wires (r + D v). A psychophysical experiment revealed that the pressure applied between the hands in all conditions was similar. Thus, it is unlikely that differences in the strength of the illusion were associated with factors other than the r/D v ratio.
Our fMRI results indicated that a distributed set of the brain regions were associated with the illusion. While regions activated for the contrast of (Si – Wi)mean reflect activity necessary to experience the illusion, those activated for the contrast of (Si – Wi)covariate reflect activity associated with changes in the strength of the illusion. Activation patterns in S1 and the Pre‐CG differed from those in other regions in two distinct ways. First, only S1 and the Pre‐CG exhibited overlapping activation during the illusory and actual conditions. Second, only these regions exhibited activation in analyses of both (Si – Wi)mean and (Si – Wi)covariate. Thus, our results support the notion that S1 and the Pre‐CG are associated with tactile awareness of velvet‐like textures.
The human S1 is involved in various aspects of conscious tactile perception, such as the detection and localization of stimuli (Auksztulewicz et al., 2012; Blankenburg et al., 2006; Hirvonen & Palva, 2016; Meador et al., 2002). However, it remains unknown whether this area is also critical for the conscious tactile perception of object properties such as textures. Previous electrophysiological studies involving monkeys have demonstrated that neurons in S1 are involved in the perception of texture (Bourgeon, Depeault, Meftah el, & Chapman, 2016; Chapman, Tremblay, Jiang, Belingard, & Meftah el, 2002; Sinclair & Burton, 1991) and vibrational frequency (Romo, Lemus, & de Lafuente, 2012). However, such studies have been unable to clarify the extent to which such activity is associated with conscious texture perception. In the present study, we extended these previous findings by demonstrating that S1 is implicated in the conscious tactile perception of textures. In contrast to previous neuroimaging findings, which highlighted the role of the PO and insula in texture perception (Kitada et al., 2005; Roland et al., 1998; Sathian et al., 2011; Stilla & Sathian, 2008), our findings highlight the role of S1 in the tactile awareness of textural properties.
Previous neuroimaging studies have revealed that V1 is associated with the conscious perception of object properties. For instance, the Kanizsa triangle illusion activates a portion of V1 corresponding to the region in which the illusory triangle is perceived (Kok et al., 2016). When V1 was transiently deactivated via transcranial magnetic stimulation, participants became unaware of visually presented objects even though they could identify their orientations and colors well above the level of chance (Boyer, Harrison, & Ro, 2005). Finally, individuals with lesions in V1 (“blindsight”) are able to unconsciously determine the location of a moving visual stimulus (Poppel, Held, & Frost, 1973; Weiskrantz, Warrington, Sanders, & Marshall, 1974) and distinguish between emotional facial expressions above the level of chance (de Gelder, Morris, & Dolan, 2005). Thus, in conjunction with these previous studies, our findings indicate that primary sensory cortices play a critical role in the awareness of object properties, regardless of the sensory modality.
The VHI can be interpreted as a failure to solve the problem of perceptual organization—how sensory inputs are grouped together or segregated from each other (Pawluk, Kitada, Abramowicz, Hamilton, & Lederman, 2011). Specifically, tactile input from the wires and opposing hands are grouped together in the illusion, and this information is perceived to originate from a textured surface that does not exist. Thus, S1 may be responsible for grouping the different tactile inputs into a single conscious percept. However, given the dominant classical view of hierarchical processing (Bodegard et al., 2001; Kitada, 2016; Sathian, 2016), it is more reasonable to speculate that regions beyond S1 contribute to this grouping. Indeed, our findings demonstrate that the strength of the illusion modulated the functional connectivity between S1 and the SPL, PO, Pre‐CG, insula, and cerebellum. This indicates that interactions between S1 and higher order cortices contribute to S1 activation during the VHI. This view is supported by the previous finding that conscious tactile detection of electrical stimuli is associated with increased recurrent processing between S1 and S2 (Auksztulewicz et al., 2012).
The PO in non‐human primates contains neurons whose receptive fields cover multiple fingers, and their orientation preferences are similar to those in humans (Fitzgerald, Lane, Thakur, & Hsiao, 2006). Therefore, it is proposed that this region is engaged in the integration of object information across different regions of the skin (Haggard, 2006). Given that the PO is critical for texture processing (Kitada et al., 2005; Roland et al., 1998; Stilla & Sathian, 2008), this region may be involved in merging tactile inputs to generate a new texture percept. Moreover, previous studies have revealed that the posterior parietal lobule is involved in tactile grouping (Cusack, 2005; Kitada, Kochiyama, Hashimoto, Naito, & Matsumura, 2003; Wacker, Spitzer, Lutzkendorf, Bernarding, & Blankenburg, 2011). For instance, Wacker et al. (2011) observed that patterned stimulation produced by dot arrays on the finger activates the posterior parietal lobule more than randomized stimulation using the same dot arrays (Wacker et al., 2011). Thus, this region may also play some role in processing texture information (Yang et al., 2017). Collectively, it is possible that the sensory inputs caused by the wires and hands are grouped together in the posterior parietal lobule and PO. These brain regions may exert top‐down modulatory influences in the anterior S1, leading to the conscious perception of velvet.
Relative to the PO and SPL, the roles of the cerebellum and Pre‐CG in tactile object processing have been less clear. Although several studies have indicated that these regions may send top‐down signals to S1 (Blakemore, Wolpert, & Frith, 1998; Bostan, Dum, & Strick, 2013; Christensen et al., 2007), further research is required to determine how these regions interact with S1 to contribute to conscious texture perception.
In the present study, we observed illusion‐related activation in brain regions other than the Post‐CG. Indeed, activation of the Pre‐CG via passive tactile stimulation has frequently been observed in previous neuroimaging studies (Kitada et al., 2003; Mancini, Haggard, Iannetti, Longo, & Sereno, 2012; Sanchez‐Panchuelo, Francis, Bowtell, & Schluppeck, 2010; Sereno & Huang, 2006). Thus, although careful interpretation is necessary due to the partial volume effect, the primary motor cortex may play a role in the tactile awareness of object textures, given that this region is densely connected with area 3b in nonhuman primates (Liao, Gharbawie, Qi, & Kaas, 2013). The present study also demonstrated that a distributed set of brain regions including the fronto‐parietal network exhibited greater activation during the illusion than during the perception of actual velvet. This result is consistent with findings observed for the cutaneous rabbit illusion in that additional regions, such as the frontal areas are involved in the illusion, relative to veridical perception (Blankenburg et al., 2006). This may be because the illusion imposes greater demands on sensory processing in these regions.
Despite our findings, one major interpretational issue remains. In the present study, we compared two illusion conditions in which the stimulation patterns were highly similar (e.g., speed), though not perfectly identical. Thus, it is possible that these subtle differences in stimulation parameters were responsible for both the illusion and activity in S1, and that there was no causality between the illusion and S1 activity. One factor against this account is the correlation between the strength of the illusion and activity in S1 (revealed by (Si – Wi)covariate), as the difference in the pattern of tactile stimulation should remain constant across participants (Figure 3b). However, this correlation was weak in the analyses using delayed‐onset regressors, possibly because such regressors modeled stimulation‐related activity less accurately and introduced unwanted between‐subject variance in the group analysis. Thus, future studies should address this issue.
5. CONCLUSIONS
In the present study, we investigated the neural correlates of the VHI, which is unique in generating an illusory tactile sensation of textured objects. Our results demonstrated that activation in the area of the Post‐CG corresponding to the anterior portion of S1 is associated with the strength of the VHI. We also observed overlapping activation in these regions during illusory and actual perception, indicating that the anterior S1 plays a critical role in the conscious haptic perception of velvet. Finally, the strength of the illusion modulated the functional connectivity between S1 and other high‐order somatosensory cortices such as the PO and SPL. These results highlight the role of S1 and its interaction with other regions in conscious haptic perception of textures, supporting the notion that the primary sensory cortex is a critical node of the brain network underlying conscious object perception.
AUTHORS CONTRIBUTIONS
Author contributions: N.R., R.K., T.M., M.O., and N.S. designed research; N.R., R.K., N.A., and H.K.T. performed research; T.K. contributed unpublished reagents/analytic tools; N.R. and R.K. analyzed data; N.R. and R.K. wrote the article.
CONFLICT OF INTERESTS
The authors declare no conflict of interest.
Supporting information
Supporting Information Figure S1. Brain activation during the perception of actual velvet
Supporting Information Table S1. Brain regions associated with the VHI (supplementary analysis with delayed regressors)
Supporting Information Table S2. Brain regions commonly activated during illusory and actual velvet perception (supplementary analysis with delayed regressors)
Supporting Information Table S3. PPI analysis with the right postcentral gyrus
ACKNOWLEDGMENTS
This work was supported by MEXT/JSPS KAKENHI (Grant number 16H01680; 25135734), HAYAO NAKAYAMA Foundation for Science and Technology and Culture, and an NAP startup grant of Nanyang Technological University to RK; MEXT/JSPS KAKENHI (Grant Number, 15K13855; 26282164) to MO, (Grant Number, 25540061) to TM, and (Grant Number, 26244031; 15H01846) to NS. The multiband EPI sequence was provided by the University of Minnesota Center for Magnetic Resonance Research.
Rajaei N, Aoki N, Takahashi HK, et al. Brain networks underlying conscious tactile perception of textures as revealed using the velvet hand illusion. Hum Brain Mapp. 2018;39:4787–4801. 10.1002/hbm.24323
Funding information
HAYAO NAKAYAMA Foundation for Science & Technology and Culture; Japan Society for the Promotion of Science (JSPS), and Ministry of Education, Culture, Sports, Science and Technology (MEXT) Japan, Grant/Award Number: KAKENHI 15H01846 KAKENHI 15K13855 KAKENHI 16H01680 KAKENHI 25135734 KAKENHI 25540061 KAKENHI 26244031 KAKENHI 26282164; Nanyang Technological University, Grant/Award Number: NAP Start up Grant
REFERENCES
- Ashburner, J. (2007). A fast diffeomorphic image registration algorithm. NeuroImage, 38, 95–113. 10.1016/j.neuroimage.2007.07.007 [DOI] [PubMed] [Google Scholar]
- Auksztulewicz, R. , Spitzer, B. , & Blankenburg, F. (2012). Recurrent neural processing and somatosensory awareness. The Journal of Neuroscience, 32, 799–805. 10.1523/JNEUROSCI.3974-11.2012 [DOI] [PMC free article] [PubMed] [Google Scholar]
- Blakemore, S. J. , Wolpert, D. M. , & Frith, C. D. (1998). Central cancellation of self‐produced tickle sensation. Nature Neuroscience, 1, 635–640. 10.1038/2870 [DOI] [PubMed] [Google Scholar]
- Blankenburg, F. , Ruff, C. C. , Deichmann, R. , Rees, G. , & Driver, J. (2006). The cutaneous rabbit illusion affects human primary sensory cortex somatotopically. PLoS Biology, 4, e69. 10.1371/journal.pbio.0040069 [DOI] [PMC free article] [PubMed] [Google Scholar]
- Bodegard, A. , Geyer, S. , Grefkes, C. , Zilles, K. , & Roland, P. E. (2001). Hierarchical processing of tactile shape in the human brain. Neuron, 31, 317–328. 10.1016/S0896-6273(01)00362-2 [DOI] [PubMed] [Google Scholar]
- Bostan, A. C. , Dum, R. P. , & Strick, P. L. (2013). Cerebellar networks with the cerebral cortex and basal ganglia. Trends in Cognitive Sciences, 17, 241–254. 10.1016/j.tics.2013.03.003 [DOI] [PMC free article] [PubMed] [Google Scholar]
- Boyer, J. L. , Harrison, S. , & Ro, T. (2005). Unconscious processing of orientation and color without primary visual cortex In Proceedings of the National Academy of Sciences of the United States of America (Vol. 102, pp. 16875–16879). 10.1073/pnas.0505332102 [DOI] [PMC free article] [PubMed] [Google Scholar]
- Bufalari, I. , Di Russo, F. , & Aglioti, S. M. (2014). Illusory and veridical mapping of tactile objects in the primary somatosensory and posterior parietal cortex. Cerebral Cortex, 24, 1867–1878. 10.1093/cercor/bht037 [DOI] [PubMed] [Google Scholar]
- Bourgeon, S. , Depeault, A. , Meftah el, M. , & Chapman, C. E. (2016). Tactile texture signals in primate primary somatosensory cortex and their relation to subjective roughness intensity. Journal of Neurophysiology, 115, 1767–1785. [DOI] [PMC free article] [PubMed] [Google Scholar]
- Chapman, C. E. , Tremblay, F. , Jiang, W. , Belingard, L. , & Meftah el, M. (2002). Central neural mechanisms contributing to the perception of tactile roughness. Behavioural Brain Research, 135, 225–233. [DOI] [PubMed] [Google Scholar]
- Chen, L. M. , Friedman, R. M. , & Roe, A. W. (2003). Optical imaging of a tactile illusion in area 3b of the primary somatosensory cortex. Science, 302, 881–885. 10.1126/science.1087846 [DOI] [PubMed] [Google Scholar]
- Christensen, M. S. , Lundbye‐Jensen, J. , Geertsen, S. S. , Petersen, T. H. , Paulson, O. B. , & Nielsen, J. B. (2007). Premotor cortex modulates somatosensory cortex during voluntary movements without proprioceptive feedback. Nature Neuroscience, 10, 417–419. 10.1038/nn1873 [DOI] [PubMed] [Google Scholar]
- Crick, F. , & Koch, C. (1990). Towards a neurobiological theory of consciousness. Seminars in Neuroscience, 2, 263–275. [Google Scholar]
- Cusack, R. (2005). The intraparietal sulcus and perceptual organization. Journal of Cognitive Neuroscience, 17, 641–651. 10.1162/0898929053467541 [DOI] [PubMed] [Google Scholar]
- de Gelder, B. , Morris, J. S. , & Dolan, R. J. (2005). Unconscious fear influences emotional awareness of faces and voices In Proceedings of the National Academy of Sciences of the United States of America (Vol. 102, pp. 18682–18687). 10.1073/pnas.0509179102 [DOI] [PMC free article] [PubMed] [Google Scholar]
- Diedrichsen, J. , Balsters, J. H. , Flavell, J. , Cussans, E. , & Ramnani, N. (2009). A probabilistic MR atlas of the human cerebellum. NeuroImage, 46, 39–46. 10.1016/j.neuroimage.2009.01.045 [DOI] [PubMed] [Google Scholar]
- Eck, J. , Kaas, A. L. , & Goebel, R. (2013). Crossmodal interactions of haptic and visual texture information in early sensory cortex. NeuroImage, 75, 123–135. 10.1016/j.neuroimage.2013.02.075 [DOI] [PubMed] [Google Scholar]
- Eck, J. , Kaas, A. L. , Mulders, J. L. , Hausfeld, L. , Kourtzi, Z. , & Goebel, R. (2016). The effect of task instruction on haptic texture processing: The neural underpinning of roughness and spatial density perception. Cerebral Cortex, 26, 384–401. 10.1093/cercor/bhu294 [DOI] [PubMed] [Google Scholar]
- Ewbank, M. P. , Henson, R. N. , Rowe, J. B. , Stoyanova, R. S. , & Calder, A. J. (2013). Different neural mechanisms within occipitotemporal cortex underlie repetition suppression across same and different‐size faces. Cerebral Cortex, 23, 1073–1084. 10.1093/cercor/bhs070 [DOI] [PMC free article] [PubMed] [Google Scholar]
- Feinberg, D. A. , Moeller, S. , Smith, S. M. , Auerbach, E. , Ramanna, S. , Gunther, M. , … Yacoub, E. (2010). Multiplexed echo planar imaging for sub‐second whole brain FMRI and fast diffusion imaging. PLoS One, 5, e15710. 10.1371/journal.pone.0015710 [DOI] [PMC free article] [PubMed] [Google Scholar]
- Fitzgerald, P. J. , Lane, J. W. , Thakur, P. H. , & Hsiao, S. S. (2006). Receptive field properties of the macaque second somatosensory cortex: Representation of orientation on different finger pads. Journal of Neuroscience, 26, 6473–6484. 10.1523/JNEUROSCI.5057-05.2006 [DOI] [PMC free article] [PubMed] [Google Scholar]
- Flandin, G. , & Friston, K. J. (2017). Analysis of family‐wise error rates in statistical parametric mapping using random field theory. Human Brain Mapping. 10.1002/hbm.23839 [Epub ahead of print]. [DOI] [PMC free article] [PubMed] [Google Scholar]
- Friston, K. J. , Ashburner, J. , Kiebel, S. J. , Nichols, T. E. , & Penny, W. D. (2007). Statistical parametric mapping In Statistical parametric mapping: The analysis of functional brain images. London, UK: Academic Press. [Google Scholar]
- Friston, K. J. , Buechel, C. , Fink, G. R. , Morris, J. , Rolls, E. , & Dolan, R. J. (1997). Psychophysiological and modulatory interactions in neuroimaging. NeuroImage, 6, 218–229. 10.1006/nimg.1997.0291 [DOI] [PubMed] [Google Scholar]
- Geyer, S. , Schleicher, A. , & Zilles, K. (1999). Areas 3a, 3b, and 1 of human primary somatosensory cortex. NeuroImage, 10, 63–83. 10.1006/nimg.1999.0440 [DOI] [PubMed] [Google Scholar]
- Goebel, R. , Khorram‐Sefat, D. , Muckli, L. , Hacker, H. , & Singer, W. (1998). The constructive nature of vision: Direct evidence from functional magnetic resonance imaging studies of apparent motion and motion imagery. European Journal of Neuroscience, 10, 1563–1573. 10.1046/j.1460-9568.1998.00181.x [DOI] [PubMed] [Google Scholar]
- Grol, M. J. , Majdandzic, J. , Stephan, K. E. , Verhagen, L. , Dijkerman, H. C. , Bekkering, H. , … Toni, I. (2007). Parieto‐frontal connectivity during visually guided grasping. The Journal of Neuroscience, 27, 11877–11887. 10.1523/JNEUROSCI.3923-07.2007 [DOI] [PMC free article] [PubMed] [Google Scholar]
- Haggard, P. (2006). Sensory neuroscience: From skin to object in the somatosensory cortex. Current Biology, 16, R884–R886. 10.1016/j.cub.2006.09.024 [DOI] [PubMed] [Google Scholar]
- Hall, D. A. , Haggard, M. P. , Akeroyd, M. A. , Palmer, A. R. , Summerfield, A. Q. , Elliott, M. R. , … Bowtell, R. W. (1999). "sparse" temporal sampling in auditory fMRI. Human Brain Mapping, 7, 213–223. [DOI] [PMC free article] [PubMed] [Google Scholar]
- Hirvonen, J. , & Palva, S. (2016). Cortical localization of phase and amplitude dynamics predicting access to somatosensory awareness. Human Brain Mapping, 37, 311–326. 10.1002/hbm.23033 [DOI] [PMC free article] [PubMed] [Google Scholar]
- Hsiao, S. S. , Johnson, K. O. , & Twombly, I. A. (1993). Roughness coding in the somatosensory system. Acta Psychologica, 84, 53–67. 10.1016/0001-6918(93)90072-Y [DOI] [PubMed] [Google Scholar]
- James, T. W. , Kim, S. , & Fisher, J. S. (2007). The neural basis of haptic object processing. Canadian Journal of Experimental Psychology, 61, 219–229. 10.1037/cjep2007023 [DOI] [PubMed] [Google Scholar]
- Kitada, R. (2016). The brain network for haptic object recognition In Kajimoto H., Saga S., & Konyo M. (Eds.), Pervasive haptics (pp. 22–37). Tokyo, Japan: Springer Japan. [Google Scholar]
- Kitada, R. , Hashimoto, T. , Kochiyama, T. , Kito, T. , Okada, T. , Matsumura, M. , … Sadato, N. (2005). Tactile estimation of the roughness of gratings yields a graded response in the human brain: An fMRI study. NeuroImage, 25, 90–100. 10.1016/j.neuroimage.2004.11.026 [DOI] [PubMed] [Google Scholar]
- Kitada, R. , Kito, T. , Saito, D. N. , Kochiyama, T. , Matsumura, M. , Sadato, N. , & Lederman, S. J. (2006). Multisensory activation of the intraparietal area when classifying grating orientation: A functional magnetic resonance imaging study. The Journal of Neuroscience, 26, 7491–7501. 10.1523/Jneurosci.0822-06.2006 [DOI] [PMC free article] [PubMed] [Google Scholar]
- Kitada, R. , Kochiyama, T. , Hashimoto, T. , Naito, E. , & Matsumura, M. (2003). Moving tactile stimuli of fingers are integrated in the intraparietal and inferior parietal cortices. Neuroreport, 14, 719–724. 10.1097/01.wnr.0000065508.53896.aa [DOI] [PubMed] [Google Scholar]
- Kitada, R. , Sasaki, A. T. , Okamoto, Y. , Kochiyama, T. , & Sadato, N. (2014). Role of the precuneus in the detection of incongruency between tactile and visual texture information: A functional MRI study. Neuropsychologia, 64, 252–262. 10.1016/j.neuropsychologia.2014.09.028 [DOI] [PubMed] [Google Scholar]
- Koch, C. , Massimini, M. , Boly, M. , & Tononi, G. (2016). Neural correlates of consciousness, progress and problems. Nature Reviews Neuroscience, 17, 307–321. 10.1038/nrn.2016.22 [DOI] [PubMed] [Google Scholar]
- Kok, P. , Bains, L. J. , van Mourik, T. , Norris, D. G. , & de Lange, F. P. (2016). Selective activation of the deep layers of the human primary visual cortex by top‐down feedback. Current Biology, 26, 371–376. 10.1016/j.cub.2015.12.038 [DOI] [PubMed] [Google Scholar]
- Kriegeskorte, N. , Simmons, W. K. , Bellgowan, P. S. , & Baker, C. I. (2009). Circular analysis in systems neuroscience: The dangers of double dipping. Nature Neuroscience, 12, 535–540. 10.1038/nn.2303 [DOI] [PMC free article] [PubMed] [Google Scholar]
- Lamme, V. A. , Super, H. , Landman, R. , Roelfsema, P. R. , & Spekreijse, H. (2000). The role of primary visual cortex (V1) in visual awareness. Vision Research, 40, 1507–1521. 10.1016/S0042-6989(99)00243-6 [DOI] [PubMed] [Google Scholar]
- Liao, C. C. , Gharbawie, O. A. , Qi, H. , & Kaas, J. H. (2013). Cortical connections to single digit representations in area 3b of somatosensory cortex in squirrel monkeys and prosimian galagos. Journal of Comparative Neurology, 521, 3768–3790. 10.1002/cne.23377 [DOI] [PMC free article] [PubMed] [Google Scholar]
- Linkenkaer‐Hansen, K. , Nikulin, V. V. , Palva, S. , Ilmoniemi, R. J. , & Palva, J. M. (2004). Prestimulus oscillations enhance psychophysical performance in humans. The Journal of Neuroscience, 24, 10186–10190. 10.1523/JNEUROSCI.2584-04.2004 [DOI] [PMC free article] [PubMed] [Google Scholar]
- Mancini, F. , Haggard, P. , Iannetti, G. D. , Longo, M. R. , & Sereno, M. I. (2012). Fine‐grained nociceptive maps in primary somatosensory cortex. The Journal of Neuroscience, 32, 17155–17162. 10.1523/JNEUROSCI.3059-12.2012 [DOI] [PMC free article] [PubMed] [Google Scholar]
- Meador, K. J. , Ray, P. G. , Echauz, J. R. , Loring, D. W. , & Vachtsevanos, G. J. (2002). Gamma coherence and conscious perception. Neurology, 59, 847–854. 10.1212/WNL.59.6.847 [DOI] [PubMed] [Google Scholar]
- Meador, K. J. , Revill, K. P. , Epstein, C. M. , Sathian, K. , Loring, D. W. , & Rorden, C. (2017). Neuroimaging somatosensory perception and masking. Neuropsychologia, 94, 44–51. 10.1016/j.neuropsychologia.2016.11.017 [DOI] [PubMed] [Google Scholar]
- Mochiyama, H. , Sano, A. , Takesue, N. , Kikuuwe, R. , Fujita, K. , Fukuda, S. , Marui, K. , & Fujimoto, H. (2005) Haptic illusions induced by moving line stimuli. Paper presented in World Haptics Conference (pp. 645–648).
- Monto, S. , Palva, S. , Voipio, J. , & Palva, J. M. (2008). Very slow EEG fluctuations predict the dynamics of stimulus detection and oscillation amplitudes in humans. The Journal of Neuroscience, 28, 8268–8272. 10.1523/JNEUROSCI.1910-08.2008 [DOI] [PMC free article] [PubMed] [Google Scholar]
- Morita, T. , Kochiyama, T. , Okada, T. , Yonekura, Y. , Matsumura, M. , & Sadato, N. (2004). The neural substrates of conscious color perception demonstrated using fMRI. NeuroImage, 21, 1665–1673. 10.1016/j.neuroimage.2003.12.019 [DOI] [PubMed] [Google Scholar]
- Muckli, L. , Kohler, A. , Kriegeskorte, N. , & Singer, W. (2005). Primary visual cortex activity along the apparent‐motion trace reflects illusory perception. PLoS Biology, 3, e265. 10.1371/journal.pbio.0030265 [DOI] [PMC free article] [PubMed] [Google Scholar]
- O'Reilly, J. X. , Woolrich, M. W. , Behrens, T. E. J. , Smith, S. M. , & Johansen‐Berg, H. (2012). Tools of the trade: Psychophysiological interactions and functional connectivity. Social Cognitive and Affective Neuroscience, 7, 604–609. 10.1093/scan/nss055 [DOI] [PMC free article] [PubMed] [Google Scholar]
- Ohka, M. , Kawabe, Y. , Chami, A. , Nader, R. , Yussof, H. B. , & Miyaoka, T. (2010). Investigation on velvet hand illusion using psychophysics and FEM analysis. International Journal on Smart Sensing and Intelligent Systems, 3, 488–503. 10.21307/ijssis-2017-404 [DOI] [Google Scholar]
- Oldfield, R. C. (1971). The assessment and analysis of handedness: The Edinburgh inventory. Neuropsychologia, 9, 97–113. 10.1016/0028-3932(71)90067-4 [DOI] [PubMed] [Google Scholar]
- Pawluk, D. , Kitada, R. , Abramowicz, A. , Hamilton, C. , & Lederman, S. J. (2011). Figure/ground segmentation via a haptic glance: Attributing initial finger contacts to objects or their supporting surfaces. IEEE Transactions on Haptics, 4, 2–13. 10.1109/TOH.2010.25 [DOI] [PubMed] [Google Scholar]
- Poppel, E. , Held, R. , & Frost, D. (1973). Residual visual function after brain wounds involving the central visual pathways in man. Nature, 243, 295–296. 10.1038/243295a0 [DOI] [PubMed] [Google Scholar]
- Rajaei, N. , Kawabe, Y. , Ohka, M. , Miyaoka, T. , Chami, A. , & Yussof, H. B. (2012). Psychophysical experiments on velvet hand illusion toward presenting virtual feeling of material. International Journal of Social Robotics, 4, 77–84. [Google Scholar]
- Rees, G. (2013). Neural correlates of consciousness. Annals of the New York Academy of Sciences, 1296, 4–10. 10.1111/nyas.12257 [DOI] [PMC free article] [PubMed] [Google Scholar]
- Roland, P. E. , O'Sullivan, B. , & Kawashima, R. (1998). Shape and roughness activate different somatosensory areas in the human brain Proceedings of the National Academy of Sciences of the United States of America (Vol. 95, pp. 3295–3300). 10.1017/S0140525X07001392 [DOI] [PMC free article] [PubMed] [Google Scholar]
- Romo, R. , Lemus, L. , & de Lafuente, V. (2012). Sense, memory, and decision‐making in the somatosensory cortical network. Current Opinion in Neurobiology, 22, 914–919. 10.1016/j.conb.2012.08.002 [DOI] [PubMed] [Google Scholar]
- Sanchez‐Panchuelo, R. M. , Francis, S. , Bowtell, R. , & Schluppeck, D. (2010). Mapping human somatosensory cortex in individual subjects with 7T functional MRI. Journal of Neurophysiology, 103, 2544–2556. 10.1152/jn.01017.2009 [DOI] [PMC free article] [PubMed] [Google Scholar]
- Sathian, K. (2016). Analysis of haptic information in the cerebral cortex. Journal of Neurophysiology, 116, 1795–1806. 10.1152/jn.00546.2015 [DOI] [PMC free article] [PubMed] [Google Scholar]
- Sathian, K. , Lacey, S. , Stilla, R. , Gibson, G. O. , Deshpande, G. , Hu, X. , … Glielmi, C. (2011). Dual pathways for haptic and visual perception of spatial and texture information. NeuroImage, 57, 462–475. 10.1016/j.neuroimage.2011.05.001 [DOI] [PMC free article] [PubMed] [Google Scholar]
- Sereno, M. I. , & Huang, R. S. (2006). A human parietal face area contains aligned head‐centered visual and tactile maps. Nature Neuroscience, 9, 1337–1343. 10.1038/nn1777 [DOI] [PubMed] [Google Scholar]
- Servos, P. , Lederman, S. , Wilson, D. , & Gati, J. (2001). fMRI‐derived cortical maps for haptic shape, texture, and hardness. Cognitive Brain Research, 12, 307–313. 10.1016/S0926-6410(01)00041-6 [DOI] [PubMed] [Google Scholar]
- Shattuck, D. W. , Mirza, M. , Adisetiyo, V. , Hojatkashani, C. , Salamon, G. , Narr, K. L. , … Toga, A. W. (2008). Construction of a 3D probabilistic atlas of human cortical structures. NeuroImage, 39, 1064–1080. 10.1016/j.neuroimage.2007.09.031 [DOI] [PMC free article] [PubMed] [Google Scholar]
- Silvanto, J. (2015). Why is "blindsight" blind? A new perspective on primary visual cortex, recurrent activity and visual awareness. Consciousness and Cognition, 32, 15–32. 10.1016/j.concog.2014.08.001 [DOI] [PubMed] [Google Scholar]
- Sinclair, R. J. , & Burton, H. (1991). Neuronal activity in the primary somatosensory cortex in monkeys (Macaca mulatta) during active touch of textured surface gratings: Responses to groove width, applied force, and velocity of motion. Journal of Neurophysiology, 66, 153–169. [DOI] [PubMed] [Google Scholar]
- Stephan, K. E. , Marshall, J. C. , Penny, W. D. , Friston, K. J. , & Fink, G. R. (2007). Inter‐hemispheric integration of visual processing during task‐driven lateralization. The Journal of Neuroscience, 27, 3512–3522. 10.1523/JNEUROSCI.4766-06.2007 [DOI] [PMC free article] [PubMed] [Google Scholar]
- Stilla, R. , & Sathian, K. (2008). Selective visuo‐haptic processing of shape and texture. Human Brain Mapping, 29, 1123–1138. 10.1002/hbm.20456 [DOI] [PMC free article] [PubMed] [Google Scholar]
- Tong, F. (2003). Primary visual cortex and visual awareness. Nature Reviews Neuroscience, 4, 219–229. 10.1038/nrn1055 [DOI] [PubMed] [Google Scholar]
- Vossel, S. , Weidner, R. , Driver, J. , Friston, K. J. , & Fink, G. R. (2012). Deconstructing the architecture of dorsal and ventral attention systems with dynamic causal modeling. The Journal of Neuroscience, 32, 10637–10648. 10.1523/JNEUROSCI.0414-12.2012 [DOI] [PMC free article] [PubMed] [Google Scholar]
- Wacker, E. , Spitzer, B. , Lutzkendorf, R. , Bernarding, J. , & Blankenburg, F. (2011). Tactile motion and pattern processing assessed with high‐field FMRI. PLoS One, 6, e24860 10.1371/journal.pone.0024860 [DOI] [PMC free article] [PubMed] [Google Scholar]
- Weiskrantz, L. , Warrington, E. K. , Sanders, M. D. , & Marshall, J. (1974). Visual capacity in the hemianopic field following a restricted occipital ablation. Brain, 97, 709–728. [DOI] [PubMed] [Google Scholar]
- Yang, J. , Kitada, R. , Kochiyama, T. , Yu, Y. , Makita, K. , Araki, Y. , … Sadato, N. (2017). Brain networks involved in tactile speed classification of moving dot patterns: The effects of speed and dot periodicity. Scientific Reports, 7, 40931 10.1038/srep40931 [DOI] [PMC free article] [PubMed] [Google Scholar]
Associated Data
This section collects any data citations, data availability statements, or supplementary materials included in this article.
Supplementary Materials
Supporting Information Figure S1. Brain activation during the perception of actual velvet
Supporting Information Table S1. Brain regions associated with the VHI (supplementary analysis with delayed regressors)
Supporting Information Table S2. Brain regions commonly activated during illusory and actual velvet perception (supplementary analysis with delayed regressors)
Supporting Information Table S3. PPI analysis with the right postcentral gyrus