

ABSTRACT
Excessive alcohol intake can alter the gut microbiota, which may underlie the pathophysiology of alcohol-related diseases. We examined gut microbiota composition and functions in patients with alcohol overconsumption for >10 years, compared to a control group of patients with a history of no or low alcohol intake. Faecal microbiota composition was assessed by 16S rRNA sequencing. Gut microbiota functions were evaluated by quantification of short-chain fatty acids (SCFAs) and predictive metagenome profiling (PICRUSt). Twenty-four patients, mean age 64.8 years (19 males), with alcohol overconsumption, and 18 control patients, mean age 58.2 years (14 males) were included. The two groups were comparable regarding basic clinical variables. Nutritional assessment revealed lower total score on the screening tool Mini Nutritional Assessment, lower muscle mass as assessed by handgrip strength, and lower plasma vitamin C levels in the alcohol overconsumption group. Bacteria from phylum Proteobacteria were found in higher relative abundance, while bacteria from genus Faecalibacterium were found in lower relative abundance in the group of alcohol overconsumers. The group also had higher levels of the genera Sutterella, Holdemania and Clostridium, and lower concentration and percentage of butyric acid. When applying PICRUSt to predict the metagenomic composition, we found that genes related to invasion of epithelial cells were more common in the group of alcohol overconsumers. We conclude that gut microbiota composition and functions in patients with alcohol overconsumption differ from patients with low consumption of alcohol, and seem to be skewed into a putative pro-inflammatory direction.
KEYWORDS: Clostridium, Faecalibacterium, Holdemania, Nutritional screening, PICRUSt, Proteobacteria, short-chain fatty acids, Sutterella
Introduction
Chronic alcohol overconsumption is an important cause of impaired health, 1 and changes in gut microbiota have been suggested as a key factor in the development of alcohol-related morbidity.2,3 However, as pointed out in a recent review by Hillemacher et al., 4 clinical studies of gut microbiota in alcohol-dependent humans have hitherto been sparse.
The gut microbiota may be evaluated either by assessing its composition or by measuring its functions. The composition seems to be host-specific, develops from birth and throughout the lifespan, 5 and is affected by external factors like diet, surgery and the use of antibiotics.6 Alcohol consumption may also influence the composition, 7 consequently affecting gut microbiota functions. Assessing microbial metabolites, such as short-chain fatty acids (SCFAs), may offer a way to evaluate such functions. SCFAs are products of fermentation of unabsorbed food residues (mainly carbohydrates) within the colon, and around 95% of the SCFAs are absorbed and used as an energy source for the host.8 SCFAs may also play an important role in the communication between the gut microbiota and other parts of the body.8–10 Although the excretion of SCFAs is complex, the production seems to be regulated and is dependent on bacteria.8 Thus, assessment of SCFAs is a recognized measure of gut microbiota function.
Using 13C-D-xylose breath tests, our group has previously demonstrated differences between patients with high and low alcohol consumption, findings that suggest small intestinal malabsorption and alterations of colonic microbiota as a consequence of alcohol overconsumption.11 In the present study, we aimed to explore these observations further, by investigating gut microbiota composition and functions in subjects with chronic alcohol overconsumption.
Results
Participants
Data were available from 24 patients with chronic alcohol overconsumption and 18 patients in the control group. The groups were similar regarding age and gender (Table 1). We found no significant difference in pancreatic, renal or hepatic function tests as assessed by faecal or blood samples. The group of active alcohol overconsumers had an average alcohol consumption of 118.9 g/day, versus 2.5 g/day in the control group. All control patients and half of the patients in the group of alcohol overconsumers were included during Hospital admittance. The rest were included from the substance abuse-project accounted for in the Patients and Methods section. The main reasons for patients not being eligible for inclusion from this group are summarized in Figure 1. Among patients included during Hospital admittance, the most common diagnoses or symptoms leading to admittance were atrial fibrillation, transitory ischemic attack and chest pain. Twenty-six patients (11 alcohol overconsumers and 15 control patients) were initially included in the study, but had to be excluded due to lack of faecal sample.
Table 1.
Baseline characteristics and nutritional screening results for patients with ongoing alcohol overconsumption (n = 24) and control patients (n = 18).
| Alcohol overconsumers |
Control Group |
|||
|---|---|---|---|---|
| Variable | (n = 24) | (n = 18) | P-value | |
| Male | n (%) | 19 (79) | 14 (77) | |
| Age (years) | mean (range) | 64.8 (43–85) | 58.2 (34–78) | 0.076 |
| BMI (kg/m2) | mean (SD) | 27.0 (4.4) | 28.4 (4.0) | 0.232 |
| Muscle mass (kg) | mean (SD) | 26.3 (5.9) | 27.2 (5.5) | 0.614 |
| Handgrip strength (kg) | mean (SD) | 29.8 (10.8) | 38.1 (10.4) | 0.019 |
| Alcohol intake (g/day) | mean (SD) | 118.9 (93.4) | 2.5 (2.9) | <0.001 |
| Vitamin A (μmol/L) | mean (SD) | 2.4 (1.0) | 2.3 (0.4) | 0.729 |
| Vitamin B1 (nmol/L) | mean (SD) | 183.1 (66.5) | 158.8 (30.9) | 0.139 |
| Folate (nmol/L) | mean (SD) | 23.5 (10.9) | 19.8 (6.2) | 0.176 |
| Vitamin B12 (pmol/L) | mean (SD) | 458.0 (286.3) | 473.7 (250.7) | 0.854 |
| Vitamin C (µmol/L) | mean (SD) | 38.9 (22.7) | 60.7 (20.1) | 0.004 |
| Vitamin D (nmol/L) | mean (SD) | 50.6 (26.3) | 55.2 (23.4) | 0.568 |
| MNA 1 (total score) | mean (SD) | 24.3 (3.3) | 26.9 (2.4) | 0.006 |
| Sodium (mmol/L) | mean (SD) | 137.8 (4.9) | 141.4 (1.7) | 0.002 |
| Magnesium (mmol/L) | mean (SD) | 0.78 (0.2) | 0.86 (0.1) | 0.029 |
| MCV (fL) | mean (SD) | 98.5 (7.2) | 90.9 (3.4) | <0.001 |
| Pancreas insufficiency2 | n (%) | 2 (11) | 3 (12.5) | 1.000 |
1MNA: Mini Nutritional Assessment. 2Patients with fecal elastase <200 μg elastase/g feces.
Figure 1.
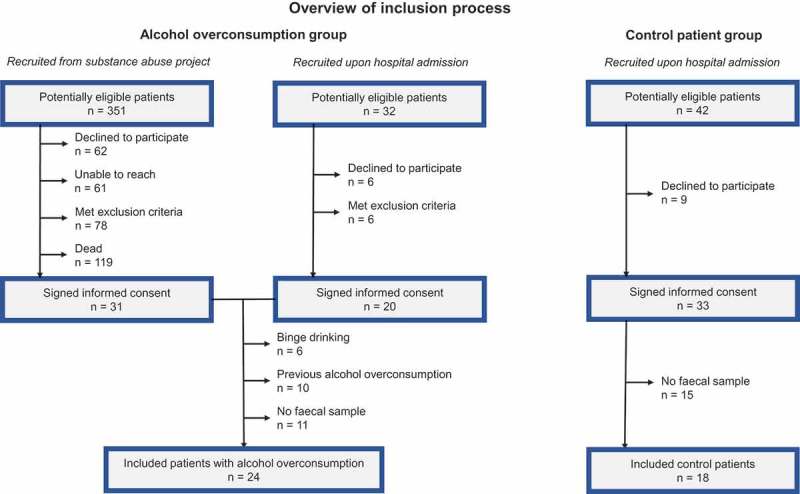
Flow chart of inclusion process.
There was no significant difference between the groups regarding weight, height, BMI, muscle mass or body fat (Table 1). Low muscle mass index was common in both groups (91 vs 78%), while handgrip strength was significantly lower among alcohol overconsumers. This group scored significantly lower on the MNA test compared to the control group. Sub-scores for “reduced appetite,” “few daily meals” and “depression” were the main reasons for the higher MNA scores in the control group (data not shown). Alcohol overconsumers had significantly lower levels of vitamin C, magnesium and sodium, and higher MCV compared to the control group (Table 1). Vitamin C deficiency defined as plasma level <30 µmol/L, was found exclusively in the group of patients with alcohol overconsumption (30%), while one patient in this group had vitamin A deficiency (<0.7 µmol/L). Vitamin B supplements were frequently used, and deficiency of thiamine (<70 nmol/L), folate (<6 nmol/L) or B12 (<160 pmol/L) was not present. Vitamin D deficiency defined as 25(OH) Vitamin D< 50 nmol/L was present among 44%, and there were no differences between the groups.
The use of medication, such as beta-blockers, statins, and acetyl salicylic acid was similar in the two groups. A higher proportion of alcohol overconsumers were treated with proton pump inhibitors (8, versus 2 in the control group). However, we found no difference in abundance of Proteobacteria, Holdemania, Clostridium, Faecalibacterium or Sutterella, when comparing patients with proton pump inhibitors, to those without.
Sequencing, mapping, and counting of gut microbiota composition
After sequence read filtering, 64000 reads per sample were obtained and used for operational taxonomic unit (OTU) construction. The sequencing depths achieved were sufficient to evaluate the bacterial diversity in all samples, as evaluated by rarefaction plots (data not shown).
Using the Shannon alpha-diversity measurement, we found no average difference between alcohol overconsumers and control patients (Shannon median score 5.81 and 5.74 for controls and alcohol overconsumers).
Using UniFrac values calculated from the normalized OTU count table, we found no trends using the weighted algorithm. However, the qualitative approach identified a sub-cohort of alcohol overconsumers with a different microbiome composition than control patients. In addition, testing for differences between groups showed significant differences both using the weighted (p = 0.003, Tukey’s HSD test) and unweighted (p = 0.002, Tukey’s HSD test) algorithm.
Relative abundance analysis
We focused our analyses of bacterial taxa abundance on relative abundance at the phyla and genus level. At the phylum level, four phyla dominated (Figure 2(a)). Testing for differential abundance at phylum level showed that alcohol overconsumers had a significantly higher relative abundance of Proteobacteria (Figure 2(b), median value 0.02 (IQR 0.021) and 0.009 (IQR 0.018), p = 0.013, Mann–Whitney U-test). We found no significant difference among the other phyla present (Firmicutes, Bacteroidetes, Actinobacteria). We found no dose-dependent relationship between the amount of alcohol consumption and Proteobacteria. Firmicutes: Bacteroidetes ratio was similar in the groups (median 0.88 and 0.81, respectively; p = 0.22, Mann-Whitney U test).
Figure 2.

Relative bacterial composition at the phylum level. (a) Pie charts depicting the average relative abundance for major phyla for alcohol overconsumers (n = 24) and controls (n = 18). (b) Relative abundance of Proteobacteria for alcohol overconsumers (n = 24) and controls (n = 18). The lines represent median values.
Testing for differential abundance at the genus level (including genera with an average relative abundance >0.001) we found a lower relative abundance of Faecalibacterium in the group of alcohol overconsumers, and a higher relative abundance of Sutterella, Clostridium, and Holdemania (Figure 3(a–d), Mann–Whitney U test). We found no significant correlations between the amount of alcohol consumption and these genera.
Figure 3.
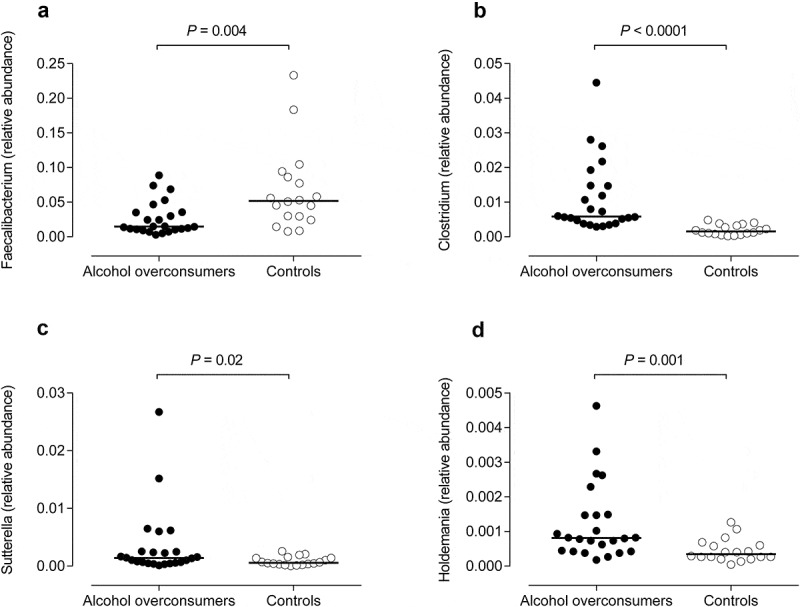
Differences in bacterial composition between alcohol overconsumers (n = 24) and controls (n = 18) at genus level. The lines represent median values. (a) Faecalibacterium levels. (b) Clostridium levels. (c) Sutterella levels. (d) Holdemania levels.
As a complementary and validating method to identify differentially expressed taxa, we applied linear discriminant analysis effect size (LEfSe)12 (Figure 4(a)). First, we generated a bar plot of the effect size of taxa with differential relative abundance between alcohol overconsumers and controls (Figure 4(a)). Of note, we found that the effect size was large for phylum Proteobacteria, and all genera previously found to have a different relative level were also identified in this test. However, this strategy yielded additional candidates with different levels of abundance, including Ruminococcaceae and Prevotella (higher in controls). Secondly, we generated a cladogram to illustrate the relationship between different taxa (Figure 4(b)). This figure also shows a higher relative abundance of Proteobacteria, and illustrated that this difference was partly due to the families Enterobactericaea and Desulfovibrionaceae. We also observed a lower relative abundance of several taxonomic groups within the Firmicutes phylum, in particular the class Clostridia. Furthermore, in this test Actinobacteria was also found to be at the lower relative expression in alcohol overconsumers relative to controls.
Figure 4.
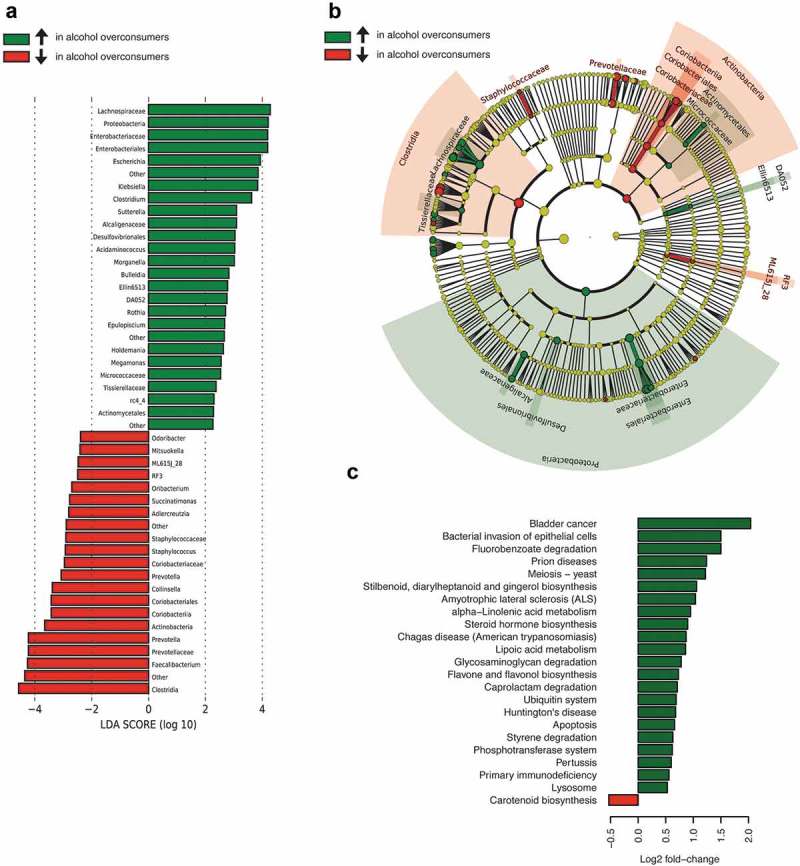
Cross-taxa validation and functional characterization of gut microbiota in alcohol overconsumers (n = 24) and controls (n = 18), where green color indicates taxa enriched (↑) in alcohol overconsumers, and red color indicates taxa depleted (↓) in alcohol overconsumers. (a) Taxa with statistical different relative levels between alcohol overconsumers (n = 24) and controls (n = 18), with effect size, across all taxa. (b) Cladogram showing phylogenetic relationships between taxa that are statistically different. (c) Barchart with KEGG orthology functional terms identified by PICRUSt as different in alcohol overconsumers (n = 24) and controls (n = 18).
Short-chain fatty acids (SCFAs)
For butyric acid, we found a lower percentage (11.9% versus 16.3%, p = 0.012, Mann Whitney U-test) and a tendency towards a lower concentration (3.9 mmol/kg vs 5.6 mmol/kg, p = 0.054, Mann Whitney U-test) in faecal samples of alcohol overconsumers, than in samples from the control patients. Concentration and percentage of the other SCFAs, and the total amount of SCFAs were similar in the two groups (Table 2). In alcohol overconsumers, Protebacterium abundance correlated inversely with butyric acid levels (Spearman`s rho = −0.61, p = 0.002), acetic acid levels (Spearman`s rho = −0.48, p = 0.02), valeric acid levels (Spearman`s rho = −0.45, p = 0.03) and total amount of SCFAs (Spearman`s rho = −0.53, p = 0.008). We found a positive correlation between Faecalibacterium abundance and concentration of butyric acid (Spearman`s rho = 0.4, p = 0.05), and an inverse correlation with iso-butyric acid (Spearman`s rho = −0.45, p = 0.03) and iso-valeric acid (Spearman`s rho = −0.49, p = 0.014). For Sutterella, Holdemania, and Clostridium, we found no significant correlations with SCFAs.
Table 2.
Concentrations of short chain fatty acids (SCFAs), measured in mmol/kg (median, min – max) and percentage of total amount (median, min – max).
| SCFA concentration (mmol/kg) | Alcohol overconsumers (n = 24) |
Control Group (n = 18) |
P-value |
|---|---|---|---|
| Acetic acid | 17.6 (6.8–44.2) | 23.0 (13.8–49.0) | 0.113 |
| % of total SCFA concentration | 60.3 (44.7–73.0) | 60.4 (49.3–74.8) | 0.811 |
| Propionic acid | 4.9 (1.7–18.9) | 6.6 (2.0–14.3) | 0.678 |
| % of total SCFA concentration | 15.7 (10.0–35.4) | 15.0 (4.1–26.0) | 0.442 |
| Iso-butyric acid | 0.6 (0.2–3.5) | 0.8 (0.14–3.3) | 0.166 |
| % of total SCFA concentration | 2.3 (0.6–4.9) | 2.1 (0.2–4.6) | 0.831 |
| Butyric acid | 4.1 (1.2–24.8) | 5.6 (3.3–20.6) | 0.054 |
| % of total SCFA concentration | 12.1 (6.9–27.9) | 16.3 (11.5–22.4) | 0.012* |
| Iso-valeric acid | 0.7 (0.25–5.0) | 1.0 (0.1–4.8) | 0.253 |
| % of total SCFA concentration | 2.8 (0.4–7.1) | 2.7 (0.2–6.8) | 0.753 |
| Valeric acid | 0.9 (0.0–4.5) | 0.96 (0.0–4.4) | 0.965 |
| % of total SCFA concentration | 3.1 (0.0–10.1) | 2.4 (0.1–6.4) | 0.307 |
| Iso-capronic acid | 0.0 (0–0) | 0.0 (0.0–0.08) | 0.429 |
| % of total SCFA concentration | 0.0 (0–0) | 0.00 (0.0–0.16) | 0.429 |
| Capronic acid | 0.1 (0.0–1.6) | 0.13 (0.0–1.1) | 0.831 |
| % of total SCFA concentration | 0.14 (0.0–1.6) | 0.2 (0.0–1.1) | 0.609 |
| Total SCFA (mmol/kg) | 32.7 (11.1–93.5) | 37.7 (20.7–92.1) | 0.168 |
Predictive metagenomic analysis
Using PICRUSt, we inferred the gene content of the microbiota based on the 16S rRNA sequences (Figure 4(c)). The inferred gene counts were merged into larger categories (level 3 KEGG orthology), based on their molecular function, involvement in disease, metabolic pathways or cellular function. Notably, we found that the gut microbiota of patients with alcohol overconsumption had relatively more bacteria containing genes for “Bacterial invasion of epithelial cells”. A closer inspection revealed that a subset of these patients had very high counts (reaching up to >4500 reads), while none of the controls had a read count >350 (median 85). The observed difference was almost entirely determined by higher levels of genes in the adhesion/invasion gene category (K13735).
Discussion
Diversity analyses indicated a difference in gut microbiota composition between patients with chronic alcohol overconsumption and controls with a history of no or low alcohol intake. At phylum level, patients with alcohol overconsumption had a higher relative abundance of Proteobacteria. They had a lower relative abundance of genus Faecalibacterium, and a higher relative abundance of the genera Clostridium, Sutterella and Holdemania. We found lower percentages and concentrations of butyric acid in alcohol overconsumers, while other SCFA-levels were similar in the groups.
Our results suggest that alcohol contributes to over-representation of Proteobacteria in the gut, consistent with previous studies on humans 2 and rodents.13 Proteobacteria seem to play an important role in the development of disease related to the gut microbiota.14 They are endotoxin (lipopolysaccharide, LPS) containing, Gram-negative, facultative anaerobic rods. Among the quantitatively dominant phyla that comprise the gut microbiota, Proteobacteria is the most unstable over time, and some researchers have proposed it as a biomarker for dysbiosis.14 In addition to serve as markers, they also possibly play a role in the development of diseases where a pro-inflammatory activation of the immune system in the intestines is vital for the pathophysiology.14,15
A high relative abundance of genus Faecalibacterium like Faecalibacterium prausnitzii is generally believed to be protective against gastrointestinal, 16 as well as extra-intestinal conditions.17 In our study, the group of alcohol overconsumers had a lower relative abundance of bacteria from genus Faecalibacterium than the control patients did, consistent with previous studies.18 Together with the increased relative abundance of Proteobacteria, this indicates a potentially more inflammatory active gut microbiota within this group.
We found higher relative abundance of genera Sutterella (Proteobacteria), Holdemania and Clostridium (both Firmicutes) in alcohol overconsumers. Previous studies have concluded that Sutterella species are possible pro-inflammatory agents.19 Leclerq et al. discovered decreasing amounts of Holdemania and Clostridium (patients with high intestinal permeability) after three weeks of sobriety in patients with previous alcohol overconsumption.20 Species from these genera may play a role in the pathophysiological development of other medical conditions, but this is presently unclear.
We found a lower percentage, and a tendency towards a lower concentration of butyric acid, in the feces of alcohol overconsumers. The concentrations and fractions of the other quantified SCFAs, and the total amount of SCFAs, were similar in the two groups. Further analyses revealed an inverse relation between Proteobacteria abundance, and concentrations of butyric acid, acetic acid, and the total amount of SCFAs. We also discovered a positive correlation between Faecalibacterium, and butyric acid levels. The composition of the gut microbiota is central for which SCFAs that are formed, and in which amount. SCFAs in general and butyric acid in particular, are important factors for the gut homeostasis, including the maintenance of the intestinal wall integrity.21,22 The formation of butyric acid within the colon partly depends on species from the phylum Firmicutes, such as Faecalibacterium prausnitzii.21 A high level of butyric acid is considered to be protective against the inflammatory activity, 23 and low levels of this SCFA has been related to conditions such as Crohn’s disease.24 The impact of alcohol use on SCFA formation has been studied far more extensively in rodents than in humans. Xie et al. discovered that feeding with alcohol led to a decreased level of butyric acid in rats.25 In a study in mice, butyrate supplementation protected against injurious effects of alcohol intake, on tight junctions and the liver.26 In the light of this, the difference in butyric acid between the groups, and the relations between SCFAs and bacterial taxa, are intriguing. These findings may represent a possible physiological link between gut microbiota composition, and the harmful effects from alcohol overconsumption. However, due to the complexity of SCFA formation and its interplay with gut microbiota and the intestinal epithelium, these results must be interpreted cautiously, especially within the limits of a cross-sectional study design.
Predictive metagenome profiling may be used to evaluate inferred functional aspects of microbiomes.27 Using PICRUSt, our study demonstrated several differences in such variables that may be of pathophysiological significance, but the findings are challenging to interpret and should be considered with caution. However, in the light of microbial differences pointing in a putative pro-inflammatory direction, the observed prevalence of genes related to bacterial invasion of epithelial cells is an intriguing functional culprit, possibly bridging microbial compositional differences and immunological consequences. In this scenario, the ability of bacteria to invade an epithelial cell and immune ‘sensing’ of potentially harmful bacteria may trigger an immune response, potentially associated with anxiety and depression.10 However, in order to examine this further, we would need to perform functional analyses on the study subjects.
When evaluating nutritional aspects, we prioritized screening in terms of function instead of quantifying food-intake, such as using food frequency questionnaires. By examining anthropometric measures including several markers for sarcopenia, quantifying vitamins and minerals, and using the screening tool MNA, we got an overview of the patients` overall nutritional risk. We found that the alcohol overconsumers had lower vitamin C-levels, sarcopenia as assessed by handgrip strength, and a lower overall MNA-score. Other biochemical and sarcopenia markers were similar in the two groups. Overall, the group of alcohol overconsumers seemed to have certain signs of an inadequate nutritional intake, and we cannot rule out that this is a factor in explaining parts of the microbiota-findings.
Strengths and limitations
The impact of long-term excessive alcohol ingestion on gut microbiota composition and functions has been sparsely studied in man, and the inclusion of a representative control group from the same clinical population as the cases, rather than recruiting healthy volunteers, is a unique feature of our study. The relatively small sample size, the lack of detailed information regarding dietary intake that might affect levels of bacteria and SCFAs, and detailed information regarding organ disease (although no patients with severe organ failures were included) that potentially might affect the gut microbiota, represent limitations of the study. Moreover, the choice of a cross-sectional design reduces the possibility of drawing causative conclusions. We also acknowledge that the recall-dependent method applied for quantification of alcohol use is a potential source of error.
Conclusion
In conclusion, there seems to be an association between chronic alcohol overconsumption, and certain compositional and functional characteristics of the gut microbiota, which in alcohol overconsumers are skewed into a putative pro-inflammatory direction. The clinical impact and causal relation between alcohol use and these alterations should be investigated further, in the form of controlled experiments and longitudinal studies.
Patients and methods
Participants
We recruited patients from Lovisenberg Diaconal Hospital during two time periods (Figure 1). First, from 2011 to 2013, a project was carried out at our hospital aiming to identify patients with potentially health-threatening substance abuse, for subsequent follow up after discharge (n = 355). The majority of this cohort of consecutively included patients had chronic alcohol overconsumption (n = 351; 259 males), and they were hence eligible for inclusion in the present study. Secondly, we asked consecutive patients admitted to the hospital during the inclusion period from September to December in 2014 to participate (n = 32; 24 males). The inclusion criteria were an ongoing or recent history of alcohol overconsumption of more than 20 or 40 g of alcohol per day for women and men.28–30 Exclusion criteria were conditions or treatments with a suspected influence on the gut microbiota. This included a history of abdominal surgery (except appendectomy), inflammatory bowel disease, gastrointestinal cancer, infectious gastroenteritis (last four weeks), or an ongoing or recent use of antibiotics (last four weeks). Patients with severe organ failure(s) or cognitive impairment were not included. From September to December 2014, we also contacted the patients in the substance abuse-project via telephone calls for inclusion, making two attempts to reach each patient: once during daytime and once in the afternoon. In this patient group, all parts of the study were conducted via the hospital outpatient clinic. In the group of admitted patients, all parts of the study were conducted during their stay at the hospital. A control group was recruited from consecutive patients admitted to the hospital from September to December 2014, with no history of alcohol overconsumption. This was specified as a present daily intake of less than 5 or 10 g per day for women or men, no history of intake of more than 20 g per day for longer periods, no history of prolonged binge drinking, and no history of daily alcohol intake. Regarding all patients, a faecal sample was required for inclusion in the present study. The study was approved by the Regional Committee for Medical Research Ethics (REK Sør-Øst; reference number 2013/2357), and conducted according to the Declaration of Helsinki. We obtained a written informed consent from all study participants.
Assessment of alcohol intake and nutritional status
We applied “Time line follow-back”31 to assess the amount of alcohol intake. The instrument was used to capture daily alcohol use (unit for unit) for a period between 2 and 4 previous weeks. These data were applied as a basis for alcohol use over time, in accordance with the patients’ recollection of alcohol intake prior to this 2–4 week period. The patients’ nutritional status was evaluated using the screening tool Mini Nutritional Assessment (MNA)32 and anthropometric measures (height, weight). Muscle mass was assessed by a Tanita BC-418 Segmental Body Composition Analyzer (TANITA Corporation, Tokyo, Japan). As a marker for muscle function, we measured the participants’ handgrip strength by a dynamometer (Kern MAP, Kern & Sohn, Balingen, Germany). Biochemical markers included vitamins A, B1, B9, B12, C and D, hepatic and renal function tests, hematological status, iron levels, and electrolytes, and were measured as part of the hospital’s routine analyses. Fecal levels of elastase were measured using a commercial kit (Human Pancreatic Elastase ELISA BS 86–01, Bioserv Diagnostics, Rostock, Germany). Based on elastase levels, patients were classified as having a normal exocrine pancreatic function (>200 μg elastase/g feces), moderate exocrine pancreatic insufficiency (100–200 μg elastase/g feces), or severe exocrine pancreatic insufficiency (<100 μg elastase/g feces).
Analysis of gut microbiota composition
Faecal samples were collected in empty plastic tubes (Sarstedt AG & Co, Nümbrecht, Germany), immediately frozen at minus 20°C, and transferred to minus 80°C within one week. Isolation of DNA, DNA sequencing and initial bioinformatics analyses were performed by Novogene (Beijing, China). Total genomic DNA was extracted using the CTAB/SDS method. DNA concentration and purity was measured on 1% agarose gels before DNA was diluted to 1 ng/μL with sterile water. All PCR reactions were carried out with Phusion® High-Fidelity PCR Master Mix (New England Biolabs, Ipswich, USA). The 16S V3-V4 region was amplified using 342F/806R as a primer set, and the resulting amplicons were visualized using SYBR green on a 2% agarose gel. Samples with a band between 400 and 450 base pairs (bp) were chosen for further experiments. Polymerase chain reaction products were mixed in equimolar ratios. Then, mixture PCR products were purified with Qiagen Gel Extraction Kit (Qiagen, Germany). Sequencing libraries were generated using TruSeq® DNA PCR-Free Sample Preparation Kit (Illumina, USA), and index codes were added. The library quality was assessed on the Qubit@ 2.0 Fluorometer (Thermo Scientific) and Agilent Bioanalyzer 2100 system. The libraries were sequenced on an Illumina HiSeq 2500 platform generating 250 bp-end reads.
Bioinformatics
After sequencing, bp-end reads were assigned to samples based on their barcode sequence, and then trimmed by cutting off the barcode and primer sequence. Paired-end reads were merged using FLASH (v1.2.7), 33 and the merged reads were quality filtered to obtain high-quality reads using QIIME (V1.7.0).34 The merged reads were compared with the gold reference database using the UCHIME algorithm35 to detect and remove chimeric reads, resulting in a set of effective reads. Using UPARSE (v7.0.1001), 36 we merged sequences with ≥97% similarity into the same Operational taxonomic unit (OTU). Representative sequences from each OTU were then used to annotate the OTUs using the RDP classifier (v2.2) and the GreenGene Database.37 OTU abundances were down-sampled to the sample with the least sequences, and analysis of alpha diversity and beta diversity were all performed using this normalized dataset. Alpha diversity was measured using Shannon metrics calculated using QIIME (v1.7.0). Beta diversity analysis was performed using both weighted and unweighted UniFrac, calculated by QIIME. These distance matrices were used for clustering in R (hclust). Relative taxa abundances were obtained by dividing the count for each taxa by the total number of reads in their respective sample.
Analysis of short chain fatty acids (SCFAs)
We investigated faecal SCFA content using methods previously described by Zijlstra et al., 38 and modified by Hoverstad et al.39 Briefly, faecal samples were vacuum distilled, and subsequently, gas chromatography of the distillates, using flame ionization detection, was used to quantify the SCFAs. We then calculated concentrations and percentages of the following SCFAs: acetic acid, propionic acid, iso-butyric acid, butyric acid, iso-valeric acid, valeric acid, iso-capronic acid, and capronic acid.
Predictive metagenomic analysis
To investigate possible functional differences between patients and controls, we applied phylogenetic investigation of communities by reconstruction of unobserved states (PICRUSt), a computational method to predict the functional composition of a metagenome using marker gene data, and a database of reference genomes.27 PICRUSt predicts which gene families are present and quantify them using the 16S data, based on similarities between the large number of sequenced bacterial genomes and those not sequenced. In the present case, we used the obtained OTUs from UPARSE as a marker gene, and re-annotated them using BLAST with the GreenGene database. The OTU count table was normalized against 16S copy number before calculating metagenomic scores for KEGG orthology (KO) terms.40 These were further merged using the “categorize_by_function.py” script (to level 3). The resulting terms approximate the metagenomes of the patients, or in other words, which genes that are present in the bacterial genomes of the gut microbiota.
Statistical analyses
Data were analyzed using SPSS version 18.0. Figures were made by using GraphPad Prism version 8. P-values of <0.05 were set as a threshold for statistical significance. Continuous, normally distributed data, including demographical data, anthropometric data, and blood samples were analyzed using Student’s t-test. Mann Whitney U-test was used to compare the test results of MNA and SCFAs, all of which had a non-normal distribution. Fischer’s exact test was used to compare fractions of patients in danger of malnutrition (MNA), and patients with pancreas insufficiency. Differences in relative abundance at the phylum- and genus level were compared using Mann Whitney U-test, and operational taxonomic units with a relative abundance of >0.001 (0.1%) were considered relevant. Correlation analyses were performed using Spearman`s rho correlation test. Due to the explorative nature of our study, we did not correct for multiple testing. However, we did perform a complementary and validating additional test using linear discriminant analysis effect size (LEfSe).12 Beta diversity was analyzed using one-way ANOVA, followed by Tukey’s HSD test for weighted (takes into account amount of the different species) and unweighted (focuses only on the presence of different species) analyses.
Funding Statement
The analyses of gut microbiota composition were supported by a research grant from the Norwegian Gastroenterological Association (NGF). Otherwise, the study was funded by Lovisenberg Diaconal Hospital; Lovisenberg Diakonale Sykehus [1]; Norsk Gastroenterologisk Forening (NGF) [2].
Data availability statement
The sequencing data are deposited in the NCBI Short Read Archive (SRA) with accession code PRJNA517050.
Author contributions
Conceptualization and experimental design: S.T.B., H.A., S.M., C.H., V.S., A.W.M., J.V.; Data collection and analysis: S.T.B., H.A.; S.M.; Biostatistics: H.A.; Data interpretation and supervision: H.A.; S.P.N; J.G.B.; C.H.; V.S.; A.W.M., J.V.; Drafting of the manuscript: S.T.B.; H.A.; J.V.; Review and editing of the manuscript: S.P.N., J.G.B., S.M., C.H., V.S., A.W.M., J.V.
Acknowledgments
We thank Gunn Helen Malmstrøm and Jennifer Twisleton Fiennes for technical help with the fecal analyses.
Disclosure of Potential Conflicts of Interests
No potential conflicts of interests were disclosed.
References
- 1.WHO Global status report on alcohol and health. World Health Organ. 2014;1:1–392. [Google Scholar]
- 2.Mutlu EA, Gillevet PM, Rangwala H, Sikaroodi M, Naqvi A, Engen PA, Kwasny M, Lau CK, Keshavarzian A. Colonic microbiome is altered in alcoholism. Am J Physiol Gastrointest Liver Physiol. 2012;302(9):G966–78. doi: 10.1152/ajpgi.00380.2011. [DOI] [PMC free article] [PubMed] [Google Scholar]
- 3.Tsuruya A, Kuwahara A, Saito Y, Yamaguchi H, Tsubo T, Suga S, Inai M, Aoki Y, Takahashi S, Tsutsumi E, et al. Ecophysiological consequences of alcoholism on human gut microbiota: implications for ethanol-related pathogenesis of colon cancer. Sci Rep. 2016;6:27923. doi: 10.1038/srep27923. [DOI] [PMC free article] [PubMed] [Google Scholar]
- 4.Hillemacher T, Bachmann O, Kahl KG, Frieling H.. Alcohol, microbiome, and their effect on psychiatric disorders. Prog Neuropsychopharmacol Biol Psychiatry. 2018;85:105–115. doi: 10.1016/j.pnpbp.2018.04.015. [DOI] [PubMed] [Google Scholar]
- 5.Sekirov I, Russell SL, Antunes LC, Finlay BB. Gut microbiota in health and disease. Physiol Rev. 2010;90(3):859–904. doi: 10.1152/physrev.00045.2009. [DOI] [PubMed] [Google Scholar]
- 6.Iebba V, Totino V, Gagliardi A, Santangelo F, Cacciotti F, Trancassini M, Mancini C, Cicerone C, Corazziari E, Pantanella F, et al. Eubiosis and dysbiosis: the two sides of the microbiota. New Microbiol. 2016;39:1–12. [PubMed] [Google Scholar]
- 7.Engen PA, Green SJPD, Voigt RMPD, Forsyth CBPD, Keshavarzian AMD. The gastrointestinal microbiome: alcohol effects on the composition of intestinal microbiota. Alcohol Res. 2015;37:223–236. [PMC free article] [PubMed] [Google Scholar]
- 8.Den Besten G, van Eunen K, Groen AK, Venema K, Reijngoud DJ, Bakker BM. The role of short-chain fatty acids in the interplay between diet, gut microbiota, and host energy metabolism. J Lipid Res. 2013;54(9):2325–2340. doi: 10.1194/jlr.R036012. [DOI] [PMC free article] [PubMed] [Google Scholar]
- 9.Kelly JR, Minuto C, Cryan JF, Clarke G, Dinan TG. Cross talk: the microbiota and neurodevelopmental disorders. Front Neurosci. 2017;11:490. [DOI] [PMC free article] [PubMed] [Google Scholar]
- 10.Cryan JF, Dinan TG. Mind-altering microorganisms: the impact of the gut microbiota on brain and behaviour. Nat Rev Neurosci. 2012;13(10):701–712. doi: 10.1038/nrn3346. [DOI] [PubMed] [Google Scholar]
- 11.Bjorkhaug ST, Skar V, Medhus AW, Tollisen A, Bramness JG, Valeur J. Chronic alcohol overconsumption may alter gut microbial metabolism: a retrospective study of 719 13C-D-xylose breath test results. Microb Ecol Health Dis. 2017;28(1):1301725. doi: 10.1080/16512235.2017.1301725. [DOI] [PMC free article] [PubMed] [Google Scholar]
- 12.Segata N, Izard J, Waldron L, Gevers D, Miropolsky L, Garrett WS, Page JE. Metagenomic biomarker discovery and explanation. Genome Biol. 2011;12(6):R60. doi: 10.1186/gb-2011-12-10-r102. [DOI] [PMC free article] [PubMed] [Google Scholar]
- 13.Bull-Otterson L, Feng W, Kirpich I, Wang Y, Qin X, Liu Y, Gobejishvili L, Joshi-Barve S, Ayvaz T, Petrosino J, et al. Metagenomic analyses of alcohol induced pathogenic alterations in the intestinal microbiome and the effect of Lactobacillus rhamnosus GG treatment. PLoS One. 2013;8(1):e53028. doi: 10.1371/journal.pone.0053028. [DOI] [PMC free article] [PubMed] [Google Scholar]
- 14.Shin NR, Whon TW, Bae JW. Proteobacteria: microbial signature of dysbiosis in gut microbiota. Trends Biotechnol. 2015;33(9):496–503. doi: 10.1016/j.tibtech.2015.06.011. [DOI] [PubMed] [Google Scholar]
- 15.Litvak Y, Byndloss MX, Tsolis RM, Baumler AJ. Dysbiotic Proteobacteria expansion: a microbial signature of epithelial dysfunction. Curr Opin Microbiol. 2017;39:1–6. doi: 10.1016/j.mib.2017.07.003. [DOI] [PubMed] [Google Scholar]
- 16.Cao Y, Shen J, Ran ZH. Association between faecalibacterium prausnitzii reduction and inflammatory bowel disease: a meta-analysis and systematic review of the literature. Gastroenterol Res Pract. 2014;2014:872725. doi: 10.1155/2014/872725. [DOI] [PMC free article] [PubMed] [Google Scholar]
- 17.Eppinga H, Sperna Weiland CJ, Thio HB, van der Woude CJ, Nijsten TE, Peppelenbosch MP, Konstantinov SR. Similar depletion of protective faecalibacterium prausnitzii in psoriasis and inflammatory bowel disease, but not in hidradenitis suppurativa. J Crohns Colitis. 2016;10(9):1067–1075. doi: 10.1093/ecco-jcc/jjw070. [DOI] [PubMed] [Google Scholar]
- 18.Dubinkina VB, Tyakht AV, Odintsova VY, Yarygin KS, Kovarsky BA, Pavlenko AV, Ischenko DS, Popenko AS, Alexeev DG, Taraskina AY, et al. Links of gut microbiota composition with alcohol dependence syndrome and alcoholic liver disease. Microbiome. 2017;5(1):141. doi: 10.1186/s40168-017-0359-2. [DOI] [PMC free article] [PubMed] [Google Scholar]
- 19.Hiippala K, Kainulainen V, Kalliomaki M, Arkkila P, Satokari R. Mucosal prevalence and interactions with the epithelium indicate commensalism of sutterella spp. Front Microbiol. 2016;7:1706. doi: 10.3389/fmicb.2016.01706. [DOI] [PMC free article] [PubMed] [Google Scholar]
- 20.Leclercq S, Matamoros S, Cani PD, Neyrinck AM, Jamar F, Starkel P, Windey K, Tremaroli V, Backhed F, Verbeke K, et al. Intestinal permeability, gut-bacterial dysbiosis, and behavioral markers of alcohol-dependence severity. Proc Natl Acad Sci U S A. 2014;111(42):E4485–93. doi: 10.1073/pnas.1415174111. [DOI] [PMC free article] [PubMed] [Google Scholar]
- 21.Morrison DJ, Preston T. Formation of short chain fatty acids by the gut microbiota and their impact on human metabolism. Gut Microbes. 2016;7(3):189–200. doi: 10.1080/19490976.2015.1134082. [DOI] [PMC free article] [PubMed] [Google Scholar]
- 22.Riviere A, Selak M, Lantin D, Leroy F, De Vuyst L. Bifidobacteria and butyrate-producing colon bacteria: importance and strategies for their stimulation in the human gut. Front Microbiol. 2016;7:979. doi: 10.3389/fmicb.2016.00979. [DOI] [PMC free article] [PubMed] [Google Scholar]
- 23.Segain JP, Raingeard de la Blétière D, Bourreille A, Leray V, Gervois N, Rosales C, Ferrier L, Bonnet C, Blottière HM, Galmiche JP. Butyrate inhibits inflammatory responses through NFkappaB inhibition: implications for Crohn’s disease. Gut. 2000;47(3):397–403. [DOI] [PMC free article] [PubMed] [Google Scholar]
- 24.Miquel S, Martin R, Rossi O, Bermudez-Humaran LG, Chatel JM, Sokol H, Thomas M, Wells JM, Langella P. Faecalibacterium prausnitzii and human intestinal health. Curr Opin Microbiol. 2013;16(3):255–261. doi: 10.1016/j.mib.2013.06.003. [DOI] [PubMed] [Google Scholar]
- 25.Xie G, Zhong W, Zheng X, Li Q, Qiu Y, Li H, Chen H, Zhou Z, Jia W. Chronic ethanol consumption alters mammalian gastrointestinal content metabolites. J Proteome Res. 2013;12(7):3297–3306. doi: 10.1021/pr400362z. [DOI] [PMC free article] [PubMed] [Google Scholar]
- 26.Cresci GA, Bush K, Nagy LE. Tributyrin supplementation protects mice from acute ethanol-induced gut injury. Alcohol Clin Exp Res. 2014;38(6):1489–1501. doi: 10.1111/acer.12428. [DOI] [PMC free article] [PubMed] [Google Scholar]
- 27.Langille MG, Zaneveld J, Caporaso JG, McDonald D, Knights D, Reyes JA, Clemente JC, Burkepile DE, Vega Thurber RL, Knight R, et al. Predictive functional profiling of microbial communities using 16S rRNA marker gene sequences. Nat Biotechnol. 2013;31(9):814–821. doi: 10.1038/nbt.2676. [DOI] [PMC free article] [PubMed] [Google Scholar]
- 28.Pequignot G, Tuyns AJ, Berta JL. Ascitic cirrhosis in relation to alcohol consumption. Int J Epidemiol. 1978;7:113–120. [DOI] [PubMed] [Google Scholar]
- 29.Tuyns AJ, Pequignot G. Greater risk of ascitic cirrhosis in females in relation to alcohol consumption. Int J Epidemiol. 1984;13:53–57. [DOI] [PubMed] [Google Scholar]
- 30.Rehm J, Gmel G, Sempos CT, Trevisan M. Alcohol-related morbidity and mortality. Alcohol Res Health. 2003;27:39–51. [PMC free article] [PubMed] [Google Scholar]
- 31.Sobell LCSM. Timeline follow-back: A technique for assessing self-reported alcohol consumption In: Litten RZAJ, editor. Measuring alcohol consumption: psychosocial and biological methods. Totowa (NJ): Humana Press; 1992. p. 41–72. [Google Scholar]
- 32.Guigoz Y. The mini nutritional assessment (mna) review of the literature–What does it tell us? J Nutr Health Aging. 2006;10(6):466–485. discussion 85–7 [PubMed] [Google Scholar]
- 33.Magoc T, Salzberg SL. FLASH: fast length adjustment of short reads to improve genome assemblies. Bioinformatics. 2011;27(21):2957–2963. doi: 10.1093/bioinformatics/btr507. [DOI] [PMC free article] [PubMed] [Google Scholar]
- 34.Caporaso JG, Kuczynski J, Stombaugh J, Bittinger K, Bushman FD, Costello EK, Fierer N, Pena AG, Goodrich JK, Gordon JI. QIIME allows analysis of high-throughput community sequencing data. Nat Methods. 2010;7(5):335–336. doi: 10.1038/nmeth.f.303. [DOI] [PMC free article] [PubMed] [Google Scholar]
- 35.Edgar RC, Haas BJ, Clemente JC, Quince C, Knight R. UCHIME improves sensitivity and speed of chimera detection. Bioinformatics. 2011;27(16):2194–2200. doi: 10.1093/bioinformatics/btr381. [DOI] [PMC free article] [PubMed] [Google Scholar]
- 36.Edgar RC. UPARSE: highly accurate OTU sequences from microbial amplicon reads. Nat Methods. 2013;10(10):996–998. doi: 10.1038/nmeth.2604. [DOI] [PubMed] [Google Scholar]
- 37.DeSantis TZ, Hugenholtz P, Larsen N, Rojas M, Brodie EL, Keller K, Huber T, Dalevi D, Hu P, Andersen GL. Greengenes, a chimera-checked 16S rRNA gene database and workbench compatible with ARB. Appl Environ Microbiol. 2006;72(7):5069–5072. doi: 10.1128/AEM.03006-05. [DOI] [PMC free article] [PubMed] [Google Scholar]
- 38.Zijlstra JB, Beukema J, Wolthers BG, Byrne BM, Groen A, Dankert J. Pretreatment methods prior to gaschromatographic analysis of volatile fatty acids from faecal samples. Clin Chim Acta. 1977. ;78(2):243–250. doi: 10.1016/0009-8981(77)90312-6. [DOI] [PubMed] [Google Scholar]
- 39.Hoverstad T, Fausa O, Bjorneklett A, Bohmer T. Short-chain fatty acids in the normal human feces. Scand J Gastroenterol. 1984;19:375–381. [PubMed] [Google Scholar]
- 40.Kanehisa M, Sato Y, Kawashima M, Furumichi M, Tanabe M. KEGG as a reference resource for gene and protein annotation. Nucleic Acids Res. 2016;44(D1):D457–D62. doi: 10.1093/nar/gkv1070. [DOI] [PMC free article] [PubMed] [Google Scholar]
Associated Data
This section collects any data citations, data availability statements, or supplementary materials included in this article.
Data Availability Statement
The sequencing data are deposited in the NCBI Short Read Archive (SRA) with accession code PRJNA517050.