

Abstract
In order to preserve postoperative language function, we recently proposed a new intraoperative method to monitor the integrity of the dorsal language pathway (arcuate fasciculus; AF) using cortico–cortical evoked potentials (CCEPs). Based on further investigations (20 patients, 21 CCEP investigations), including patients who were not suitable for awake surgery (five CCEP investigations) or those without preoperative neuroimaging data (eight CCEP investigations including four with untraceable tractography due to brain edema), we attempted to clarify the clinical impact of this new intraoperative method. We monitored the integrity of AF by stimulating the anterior perisylvian language area (AL) by recording CCEPs from the posterior perisylvian language area (PL) consecutively during both general anesthesia and awake condition. After tumor resection, single‐pulse electrical stimuli were also applied to the floor of the removal cavity to record subcortico‐cortical evoked potentials (SCEPs) at AL and PL in 12 patients (12 SCEP investigations). We demonstrated that (1) intraoperative dorsal language network monitoring was feasible even when patients were not suitable for awake surgery or without preoperative neuroimaging studies, (2) CCEP is a dynamic marker of functional connectivity or integrity of AF, and CCEP N1 amplitude could even become larger after reduction of brain edema, (3) a 50% CCEP N1 amplitude decline might be a cut‐off value to prevent permanent language dysfunction due to impairment of AF, (4) a correspondence (<2.0 ms difference) of N1 onset latencies between CCEP and the sum of SCEPs indicates close proximity of the subcortical stimulus site to AF (<3.0 mm). Hum Brain Mapp 38:1977–1991, 2017. © 2017 Wiley Periodicals, Inc.
Keywords: cortico‐cortical evoked potential, subcortico‐cortical evoked potential, electrical stimulation, dorsal language pathway, awake craniotomy
Abbreviations
- AF
arcuate fasciculus
- AG
angular gyrus
- AL
anterior perisylvian language area
- CCEP
cortico‐cortical evoked potential
- CST
cortico‐spinal tract
- DWI
diffusion‐weighted images
- ECoG
electrocorticogram
- ES
electrical stimulation
- fMRI
functional magnetic resonance imaging
- IFG
inferior frontal gyrus
- ITG
inferior temporal gyrus
- MEP
motor evoked potential
- MFG
middle frontal gyrus
- MTG
middle temporal gyrus
- PL
posterior perisylvian language area
- SCEP
subcortico‐cortical evoked potential
- SMG
supramarginal gyrus
- STG
superior temporal gyrus
- WAB
Western Aphasia Battery
INTRODUCTION
The preservation of postoperative language function is essential and challenging for neurosurgeons. As a new intraoperative monitoring method of the dorsal language pathway, we have recently proposed electrophysiological tract‐tracing using cortico–cortical evoked potentials (CCEPs) [Yamao et al., 2014]. Single‐pulse electrical stimulation (ES) was applied directly to the cortex, and CCEPs were recorded from the remote cortex through cortico–cortical connections. In an extraoperative setting, this method has successfully delineated functional cortical networks, including language, and seizure propagation [Enatsu et al., 2013b; Enatsu et al., 2015; Koubeissi et al., 2012; Kubota et al., 2013; Lacruz et al., 2007; Matsumoto et al., 2004; Matsumoto et al., 2007; Matsumoto et al., 2012; Matsuzaki et al., 2013]. In our small pilot study [Yamao et al., 2014], we demonstrated that (1) the CCEP connectivity pattern, when combined with preoperative neuroimaging studies, was able to map the anterior (AL) and posterior language area (PL) and (2) combined (high‐frequency and single‐pulse) white matter ES delineated both the function and cortical terminations of the “eloquent” dorsal language pathway (arcuate fasciculus; AF). Even in an intraoperative setting, the CCEP technique potentially has a new clinical application of mapping and monitoring of language network. However, some issues are still unclear in order to establish its clinical utility.
First, in our small pilot study, we demonstrated that the intraoperative CCEP technique was feasible and useful for patients, in the awake condition, in whom preoperative neuroimaging studies were performed fully. The recent development of diffusion tractography has enabled neurosurgeons to evaluate major white matter pathways in the preoperative state, for example, the pyramidal tract and the AF. However, as described in previous diffusion tensor tractography studies [Bizzi, 2009; Bizzi et al., 2012], the preoperative AF tract can be dislocated or interrupted due to the brain edema or infiltration of the tumor. In addition, some patients with intramedullary metastatic brain tumors or with impairment of language function are not suitable for awake surgery [Kayama, 2012]. Therefore, we need to apply this electrophysiological technique in patients with poor preoperative neuroimaging studies (i.e., untraceable tractography) or who are not suitable for awake surgery. Second, from previous motor evoked potential (MEP) studies [Kombos et al., 2009; Macdonald, 2006; Saito et al., 2015], a 50–80% amplitude decline seemed to be a cut‐off value for long‐term motor dysfunction. A small number of patients in our pilot study did not allow us to establish an appropriate cut‐off value of CCEP amplitude for prediction of the long‐term language outcome.
In order to evaluate clinical utility of CCEP, based on the further accumulation of investigations, the objective of the present study was (1) to monitor functional integrity of the AF intraoperatively, in patients with the preoperative untraceable AF tract or who are not suitable for awake surgery; that is, to demonstrate that the intraoperative CCEP connectivity pattern itself is able to delineate the AF, and (2) to establish a cut‐off value of CCEP and subcortico‐cortical evoked potential (SCEP) to prevent permanent language dysfunction due to impairment of the dorsal language pathway.
MATERIALS AND METHODS
Subjects
We enrolled 21 consecutive patients with brain tumors located within or near the perisylvian language areas in the language‐dominant left hemisphere between January 2011 and December 2013 from Kyoto University Hospital, and one patient in April 2014 from Sapporo Medical University Hospital. Three patients underwent repeated surgeries. Among 25 CCEP investigations, four investigations were excluded; in three investigations, the grid was removed due to clinical necessity and in one case, the primary purpose of surgery was biopsy. A total of 21 CCEP investigations in 20 patients (mean age 45.0 years, ranging from 16 to 72; 11 males and 9 females) were included for further analysis. Language dominance was defined by the handedness or Wada test (18 patients), which was performed using intra‐carotid infusion of propofol [Takayama et al., 2004]. The details of patient demographics are shown in Table 1; Patients 1–6 are reported elsewhere [Yamao et al., 2014].
Table 1.
Patient demographics
| Age/Sex | Tumor location | Preoperative symptoms | Tumor pathology | WAB aphasia quotient | |||
|---|---|---|---|---|---|---|---|
| before surgery | after surgery | ||||||
| 2–6 weeks | within 6 months | ||||||
| Patient 1 | 28/M | Ins, STG | seizure, right hemiparesis | anaplastic astrocytoma | 99.9 | 99.6 | n.a. |
| Patient 2 | 31/F | Ins, MTG, STG | cognitive impairment, quadrantanopsia | WHO grade II‐III astrocytoma | nla | 95.6 | n.a. |
| Patient 3 | 19/F | AG, PoCG, SMG | seizure | DNT | 100 | 100 | n.a. |
| Patient 4 | 44/F | AG, PoCG, SMG | seizure | diffuse astrocytoma | 99.5 | 80 | 100 |
| Patient 5 | 38/M | IFG | seizure | oligodendroglioma | 97.7 | 68.3 | 93 |
| Patient 6 | 36/F | SMG | asymptomatic | DNT | 100 | 100 | n.a. |
| Patient 7 | 58/M | Ins, ITG, MTG, STG | cognitive impairment | glioblastoma | 65.9 | 74.5 | n.a. |
| Patient 8 | 60/M | IFG, MFG, SFG | cognitive impairment, right hemiparesis | diffuse astrocytoma | 85.9 | 92 | n.a. |
| Patient 9 | 52/M | ITG | seizure | cavernous hemangioma | 89.6 | 93.1 | n.a. |
| Patient 10 | 16/M | IFG, MFG | seizure | glioblastoma | 92 | 94.2 | n.a. |
| Patient 11 | 34/M | IFG, MFG, SFG | cognitive impairment | glioblastoma | 91.8 | 93 | n.a. |
| Patient 12 | 72/M | Ins, ITG, MTG, STG | cognitive impairment | glioblastoma | 68 | 64.2 | n.a. |
| Patient 13 | 44/F | IFG, MFG | seizure | oligodendroglioma | 99.2 | 91.2 | 94.8 |
| Patient 14 | 27/M | ITG, MTG | headache | oligoastrocytoma | 98.2 | 99.2 | n.a. |
| Patient 15 | 70/M | AG, SMG, SPL | aphasia, right hemiparesis | glioblastoma | 87.2 | 63 | 70.4 |
| Patient 16 | 66/F | ITG, MTG | aphasia | glioblastoma | 73.2 | 65.2 | 72.1 |
| Patient 17 | 35/M | AG, SMG | seizure | metastasis | 97.2 | 100 | n.a. |
| Patient 18 | 42/F | AG, SMG | seizure | metastasis | 97.6 | 99.6 | n.a. |
| Patient 19 | 62/F | Ins, ITG, MTG, STG | aphasia | anaplastic astrocytoma | 24.8 | 66.3 | n.a. |
| Patient 20 | 66/F | AG, SMG | aphasia | glioblastoma | 65 | 58.2 | n.a. |
Normal language function by clinical examination.
AG: angular gyrus, DNT: dysembryoplastic neuroepithelial tumor, IFG: inferior frontal gyrus, Ins: insula, ITG: inferior temporal gyrus, MFG: middle frontal gyrus, MTG: middle temporal gyrus, PoCG: postcentral gyrus, SFG: superior frontal gyrus, SMG: supramarginal gyrus, SPL: superior parietal lobule, STG: superior temporal gyrus, n.a.: not available.
As a method for evaluation of clinical efficiency of intraoperative CCEP monitoring, language function was evaluated with the Japanese version of the Western Aphasia Battery (WAB) before and after surgery. Postoperative evaluation was performed within six weeks after surgery. For those who showed further language impairment at the postoperative evaluation, follow‐up evaluation was performed within six months after surgery [Yamao et al., 2014].
In 16 out of 21 investigations, awake craniotomies were performed. A craniotomy exposing the distal end of the Sylvian fissure, the frontal operculum, and the posterior part of the superior (STG) and middle temporal gyri (MTG) was performed under general anesthesia [Maldonado et al., 2011]. Five investigations (four patients; Patients 17–20) were performed under general anesthesia only, using either propofol or sevoflurane, due to metastatic tumor (Patients 17 and 18) or preoperative language dysfunction (Patients 19 and 20).
Informed consent was obtained from all patients, and the present study was approved by the ethics committees of the two institutes (C573 and 23‐161).
Language Mapping and Preservation
As reported previously [Yamao et al., 2014], we aimed to map and monitor the intraoperative dorsal language pathway by using high‐frequency (50 Hz) and single‐pulse (1 Hz) ES, in the following order:
Before surgery, we tentatively localized the language cortex and the underlying white matter pathway (AF) using functional magnetic resonance imaging (fMRI) and probabilistic diffusion tractography.
After craniotomy, under general anesthesia, strip or grid‐type subdural electrodes were placed on the ventrolateral frontal and lateral temporoparietal cortices. The area of electrode placement was determined according to the presurgical neuroimaging studies. Under general anesthesia, we applied single‐pulse ES (1 Hz, square‐wave pulse of alternating polarity, 0.3 ms duration, 10–15 mA, two sets of 30 stimuli) to cortices around the AL that was localized based on anatomical criteria or using fMRI. We considered a large CCEP response with an N1 peak in the lateral temporoparietal area (not including the postcentral gyrus) to represent the dorsal language pathway [Matsumoto et al., 2004]. Based on the CCEP distribution in the lateral temporoparietal area, namely, CCEP connectivity, we determined the stimulus site (i.e., the putative AL). The integrity of the dorsal language pathway was then evaluated by online sequential CCEPAL→PL monitoring during surgical procedures at 10–15 min intervals (the same stimulation parameters that we used to identify the CCEP connectivity, as mentioned above). To identify the bidirectional connection between the AL and PL, we applied single‐pulse ES to the electrode where a large CCEPAL→PL response was recorded in the lateral temporoparietal area, and recorded CCEPPL→AL from the ventrolateral frontal area in 13 investigations (12 patients).
In the awake craniotomy, language assessment with batteries and CCEP recordings were sequentially performed at 5–15 min intervals (the same stimulation parameters that we used to identify the CCEP connectivity, as mentioned above). High‐frequency ES (50 Hz, square‐wave pulse of alternating polarity with a pulse width of 0.3 ms, 3–5 sec, 7–15 mA) was applied to the frontal stimulus site (the putative AL) to confirm its language function. Only stimulation trials where the findings were reproducible without afterdischarges were evaluated. We strictly distinguished language impairment from the negative tongue motor response [Yamao et al., 2015].
After tumor resection, we applied high‐frequency (50 Hz) ES to the floor of the removal cavity in eight patients. We also applied single‐pulse ES to the removal floor and recorded subcortico‐cortico evoked potentials (SCEPs) from the ventorolateral frontal area and the lateral temporoparietal area in 12 patients (12 SCEP investigations). We could not perform subcortical high‐frequency or single‐pulse ES in all patients due to clinical limitations.
A 32‐channel intraoperative monitoring system (MEE 1232 Neuromaster, equipped with MS 120B electrical stimulator; Nihon‐Kohden, Tokyo, Japan) was used to deliver electric currents and to record CCEPs and raw electrocorticograms (ECoGs). The reference electrodes were placed on the skin over the contralateral mastoid process. The bandpass filter for data acquisition was set at 0.5 or 1–1500 Hz with a sampling rate of 5000 Hz.
Display and Analysis of CCEP/SCEP
The onset, peak latency, and amplitude of N1 were measured as reported previously [Matsumoto et al., 2004; Yamao et al., 2014]. In order to illustrate the distribution of each activity over the cortices, a circle map was employed based on the amplitude percentage distribution, in which the diameter of the circle at each electrode represented the percentile to the maximal amplitude of that particular activity (see Figs. 2, 3, 4). As intraoperative MRI was not performed, the placement of electrodes and the subcortical stimulus sites were identified based on operative visual inspection and neuronavigation data.
Figure 2.
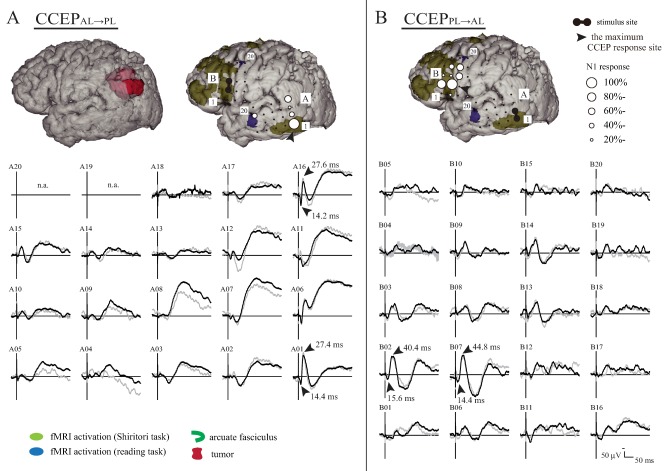
Intraoperative CCEPAL→PL (A) and CCEPPL→AL (B) distribution maps during general anesthesia (Patient 18). A: In the left‐upper panel, the preoperative AF tract was untraceable. In the right‐upper panel, the anterior and posterior perisylvian language cortices defined by fMRI using the Shiritori word generation (dark yellow) and reading task (blue) are shown in comparison with the subdural electrodes. Only the activation areas outside the pre‐ and post‐central gyri are shown for clarity. The diameter of the circle at each electrode represents the percentile to the largest amplitude at the maximum CCEPAL→PL response site (A01). Note that the frontal CCEPAL→PL stimulus (a black pair of electrodes) and temporoparietal CCEPAL→PL response site corresponded with the anterior and posterior language areas, respectively, as defined by fMRI. The lower panel shows the N1 waveform. The CCEPAL→PL is primarily distributed over the posterior part of the superior, middle, and inferior temporal gyri (the maximum is at Electrode A01 in the inferior temporal gyrus). B: In the upper panel, the CCEPPL→AL distribution with a circle map is shown. The lower panel shows the N1 waveform. Note that the frontal CCEPAL→PL stimulus site (B07) corresponded with the maximum CCEPPL→AL response site. Note that CCEP waves were displayed with the window: −30 to +300 ms for the purpose of visualization, although CCEPs were analyzed offline with analysis window: −100 to +500 ms and baseline: −100 to −5 ms. n.a.: not available due to high impedance in the recording electrode. [Color figure can be viewed at http://wileyonlinelibrary.com]
Figure 3.
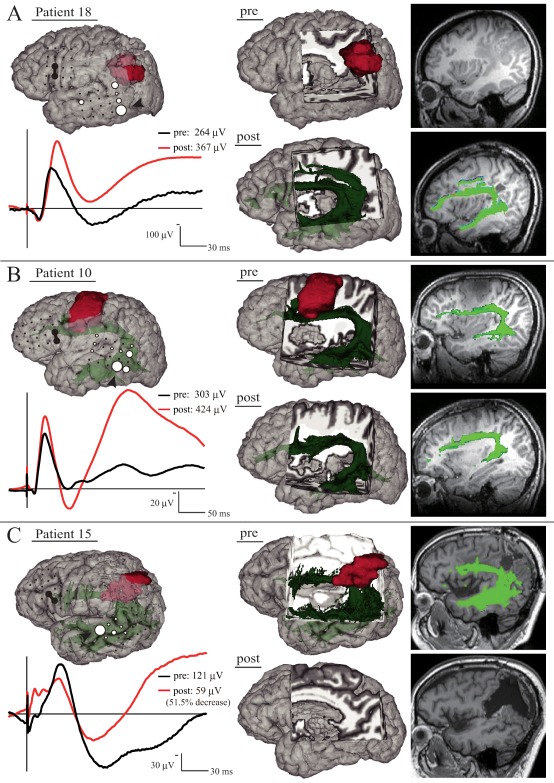
Behavior of the CCEPAL→PL N1 amplitude during tumor removal. The left‐upper panel shows CCEP distribution with a circle map in each patient under general anesthesia (A) and in the awake condition (B and C). The left‐lower panel shows the N1 waveform at the maximum CCEPAL→PL response site in each patient. The black line represents the N1 waveform immediately after the start of monitoring (A) and the awake condition (B and C), and the red line represents the waveform after tumor removal. In the right panel, 3D and 2D MRIs show the tumor (red) and the long segment of the AF (green). A: Although the preoperative AF tract was untraceable, the postoperative AF tract became traceable. B: The pre‐ and postoperative AF tract was traceable. C: N1 amplitude decreased by 51.5%. Note that the postoperative AF tract became untraceable. CCEP waves were displayed with the window: −20 to +200 ms for the purpose of visualization. Other conventions are the same as for Figure 2. [Color figure can be viewed at http://wileyonlinelibrary.com]
Figure 4.
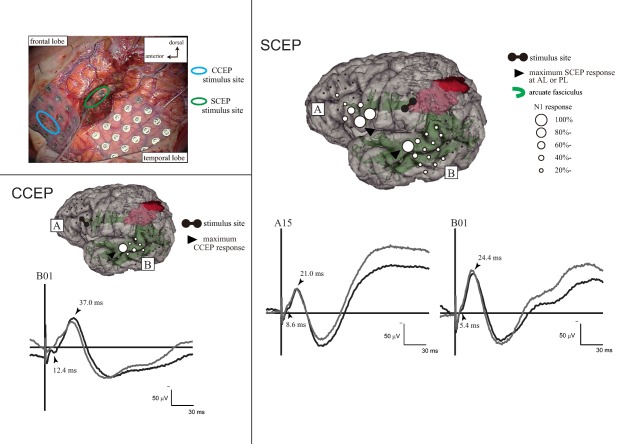
Intraoperative subcortico‐cortical evoked potentials (SCEPs) in Patient 15. Left upper panel: Stimulus site (electrode pair) at the frontal lobe (blue circle) and at the deep white matter of the tumor removal cavity (green circle, see Figure 3C). Left lower panel: Single‐pulse electrical stimulation of the AL (presumed by CCEP connectivity pattern) produced CCEPs in the temporal lobe. Right panel: SCEPs were recorded both from the AL (SCEPWM→AL, A plate) and PL (SCEPWM→PL, B plate) at and around the terminations of the AF tract. The diameter of the circle at each electrode represented the percentile to the largest amplitude (N1) at the each maximum SCEP response site. Stimulus artifacts obscured the N1 onsets to some extent in this particular patient. Theses onsets were carefully identified by visual inspection (YY, RM). At the maximum response sites, the summation of N1 onset latencies of SCEPs (SCEPWM→AL + SCEPWM→PL = 14.0 ms) was close to the N1 onset latency of CCEPAL→PL (12.4 ms). Other conventions are the same as for Figure 3. AF: arcuate fasciculus, AL: anterior language area, PL: posterior language area, WM: white matter. [Color figure can be viewed at http://wileyonlinelibrary.com]
CCEP amplitude was continually monitored in comparison with the largest CCEP amplitude recorded immediately after the patients became fully awake [Yamao et al., 2014]. In the case of patients performed under general anesthesia only, baseline CCEP amplitude was adopted immediately after sequential monitoring started.
In order to exclude the influence of intraoperative artifacts, CCEPs and SCEPs were also analyzed offline in MATLAB (Mathworks, Inc., Natick, MA) by averaging ECoGs time‐locked to the stimulus onset (analysis window: −100 to +500 ms, baseline: −100 to −5 ms).
MRI Data Acquisition and Data Analysis
Diffusion‐weighted images (DWI), fMRI, and T1 weighted anatomical images were acquired on a 3‐Tesla scanner before surgery, with DWI and T1 weighted anatomical images after surgery. Preoperative language fMRI was performed using either the Japanese “Shiritori” word generation task, reading task, or both [Yamao et al., 2014]. Due to the machine trouble of the MRI scanner or the metallic artifact of ventriculoperitoneal shunt system, no preoperative neuroimaging studies were performed in three patients (Patients 11, 19, and 20), or no postoperative neuroimaging studies in three (Patients 11, 13 and 19).
Functional data were analyzed by FMRIB Software Library (FSL; http://www.fmrib.ox.ac.uk/fsl) [Smith et al., 2004] and Statistical Parametric Mapping (SPM) 8 (Wellcome Trust Centre for Neuroimaging, London, UK; http://www.fil.ion.ucl.ac.uk/spm), as reported elsewhere [Oguri et al., 2013]. Statistical maps comparing the language task and rest were calculated at a threshold of P < 0.001 (uncorrected).
The AF was reconstructed by using placing two regions of interest (hereafter referred to as the AF tract) [Catani et al., 2005; Matsumoto et al., 2008; Wakana et al., 2007]. Probabilistic diffusion tractography was drawn using tools from FSL, as reported elsewhere [Oguri et al., 2013; Yamao et al., 2014].
The details of the MRI parameter and fMRI task are shown in the supporting information.
Validation of the CCEP Stimulus and Response Sites
As reported previously [Yamao et al., 2014], we defined the CCEP results as consistent when the distance between the stimulus/response site (either electrode between a pair) and either the fMRI activation area or the cortical termination of the AF was within 7 mm [Conner et al., 2011]. As for the CCEP/SCEP response site, electrodes showing ≥20% of the maximum response were defined as CCEP‐positive electrodes, and used to validate the results of the noninvasive test. The Fisher exact test was used to compare the consistency between the fMRI activation areas and the frontal stimulus/temporoparietal response sites. P values <0.05 were considered statistically significant. Statistical analyses were performed with JMP software (version 11, SAS Institute Inc., Cary, NC).
RESULTS
CCEP Connectivity Pattern between the Perisylvian Language Areas
Single‐pulse ES was delivered under general anesthesia to the candidate cortices for the frontal stimulus site (mean electrode pairs; five per patient, ranging from two to 10). In all investigations, CCEPs were successfully recorded from the lateral temporoparietal area. Among all 143 CCEP response sites, CCEPsAL→PL were recorded from the STG (60 sites), MTG (57 sites), and the inferior temporal gyrus (ITG, 17 sites), as well as the angular and the supramarginal gyri (AG/SMG, nine sites). The 16, 10, 3, and 1 electrodes showing ≥80% of the maximum CCEPAL→PL response were located at the STG, MTG, ITG, and AG/SMG, respectively (red circles in Fig. 1A, Table 2). In three patients (Patients 11, 19, and 20) without preoperative neuroimaging studies, frontal CCEPAL→PL stimulus sites corresponded well to those in patients with full preoperative neuroimaging studies (yellow circles in Fig. 1A).
Figure 1.
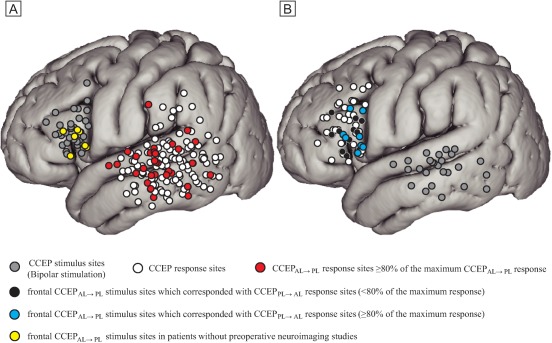
The distribution of CCEPAL→PL response sites (A) and CCEPPL→AL response sites (B) in all CCEP investigations (21 and 13, respectively) across all patients are shown in Montreal Neurological Institute (MNI) standard space. The electrodes on the MNI standard space were anatomically plotted based on visual inspection or neuronavigation during surgery. Only the response sites outside the pre‐ and post‐central gyri are shown for clarity. Stimulus sites are shown with gray circles, and response sites with white circles. Red circles denote CCEPAL→PL response sites ≥80% of the maximum CCEPAL→PL response in each investigation. Black circles denote frontal CCEPAL→PL stimulus sites that corresponded with CCEPPL→AL response sites (<80% of the maximum response). Blue circles show frontal CCEPAL→PL stimulus sites that corresponded with CCEPPL→AL response sites (≥80% of the maximum response). Yellow circles denote frontal CCEPAL→PL stimulus electrodes in Patients 11, 19, and 20 (four CCEP investigations) in whom no preoperative neuroimaging studies were performed due to MRI trouble or metallic artifact. Note their distribution well corresponds to those with preoperative neuroimaging studies. [Color figure can be viewed at http://wileyonlinelibrary.com]
Table 2.
Distribution of temporoparietal CCEPAL→PL responses sites
|
All (143 sites) |
Response sites ≥80% of maximum response (30 sites) |
|
|---|---|---|
| STG (%) | 60 (42.0) | 16 (53.3) |
| MTG (%) | 57 (39.9) | 10 (33.3) |
| ITG (%) | 17 (11.9) | 3 (10.0) |
| AG/SMG (%) | 9 (6.3) | 1 (3.3) |
AG: angular gyrus, AL: anterior language area, ITG: inferior temporal gyrus, MTG: middle temporal gyrus, PL: posterior language area, SMG: supramarginal gyrus, STG: superior temporal gyrus.
In order to evaluate the bidirectional connections between the AL and PL, single‐pulse ES was delivered at electrodes showing ≥80% of the maximum CCEPAL→PL response in the lateral temporoparietal area in 13 investigations (12 patients). Waveforms obtained from a representative case (Patient 18) are shown in Fig. 2. Among the 58 CCEPPL→AL response sites, CCEPsPL→AL were recorded from the inferior frontal gyrus (IFG) pars opecularis (24 sites), the IFG pars triangularis (20 sites), the IFG pars orbitalis (three sites), and the middle frontal gyrus (MFG, 11 sites). In all 13 investigations, the CCEPPL→AL response sites included the frontal CCEPAL→PL stimulus site: 12 and seven electrodes in IFG pars opecularis and triangularis, respectively (black and blue circles in Fig. 1B, Table 3). Of note, in eight of 13 investigations (61.5%), the electrodes showing ≥80% of the maximum CCEPPL→AL response were consistent with the frontal CCEPAL→PL stimulus site (blue circles in Fig. 1B, Tables 3 and 4).
Table 3.
Distribution of frontal CCEPPL→AL responses sites
|
All (58 sites) |
Consistency with frontal CCEPAL→PL stimulus sites (all response sites: 19 sites) |
Consistency with frontal CCEPAL→PL stimulus sites (those ≥80% of maximum response: 8 sites) |
|
|---|---|---|---|
| IFGop (%) | 24 (41.4) | 12 (63.2) | 7 (87.5) |
| IFGtr (%) | 20 (34.5) | 7 (36.8) | 1 (12.5) |
| IFGor (%) | 3 (5.2) | 0 (0) | 0 (0) |
| MFG (%) | 11 (19.0) | 0 (0) | 0 (0) |
AL: anterior language area, IFGop: inferior frontal gyrus pars opecularis, IFGor: inferior frontal gyrus pars orbitaris, IFGtr: inferior frontal gyrus pars triangularis, PL: posterior language area.
Table 4.
Intraoperative language network monitoring and functional outcome
|
Awake surgery |
Anesthetic | HFES at the frontal stimulus site |
CCEPAL→PL N1 latency (ms) |
CCEP amplitude increase (%) (–: decrease) |
Consistency with CCEPPL→AL response | The AF tract in diffusion tractography | |||
|---|---|---|---|---|---|---|---|---|---|
| Language impairment | onset | peak | before surgery | after surgery | |||||
| Patient 1 | Yes | Propofol | Yes | 7.6 | 30.8 | 7.6 | n.a. | Yes | Yes |
| Patient 2 | Yes | Propofol | Yes | 12.8 | 27.4 | −12.0 | n.a. | Yes | Yes |
| Patient 3 | Yes | Propofol | Yes | 12.8 | 29.2 | 5.5 | n.a. | Yes | Yes |
| Patient 4 | Yes | Propofol | Yes | 11.0 | 25.0 | −32.0 | n.a. | Yes | Yes |
| Patient 5 | Yes | Propofol | Yes | 9.6 | 32.0 | 15.2 | n.a. | Yes | Yes |
| Patient 6 | Yes | Propofol | Yes | 13.0 | 33.2 | 6.7 | n.a. | Yes | Yes |
| Patient 7 | Yes | Propofol | n.a.a | 12.2 | 27.6 | 3.7 | n.a. | No | Yes |
| Patient 8 | Yes | Propofol | n.a.a | 11.4 | 25.6 | 67.3 | Yesb | No | Yes |
| Patient 9 | Yes | Propofol | Yes | 11.4 | 26.2 | 68.6 | n.a. | Yes | Yes |
| Patient 10 | Yes | Propofol | Yes | 14.0 | 30.4 | 40.1 | Yes | Yes | Yes |
| Patient 11 | Yes | Propofol | n.a.a | 12.4 | 25.0 | 13.4 | Yes | n.a.c | n.a.c |
| Patient 12 | Yes | Propofol | n.a.a | 11.2 | 32.0 | 5.6 | Yes | Yes | Yes |
| Patient 13 | Yes | Propofol | n.a.a | 7.4 | 26.6 | −32.0 | Yesb | Yes | n.a.c |
| Patient 14 | Yes | Propofol | Yes | 11.2 | 31.2 | 12.0 | Yesb | Yes | Yes |
| Patient 15 | Yes | Propofol | n.a.a | 12.0 | 37.0 | −51.5 | Yes | Yes | No |
| Patient 16 | Yes | Propofol | Yes | 10.8 | 27.2 | −9.8 | Yes | Yes | Yes |
| Patient 17 | No | Sevoflurane | n.a.a | 13.8 | 24.0 | 2.2 | Yesb | No | Yes |
| Patient 18 | No | Sevoflurane | n.a.a | 14.4 | 27.4 | 39.0 | Yesb | No | Yes |
| Patient 19 | No | Sevoflurane | n.a.a | 10.0 | 21.0 | 62.2 | Yesb | n.a.c | n.a.c |
| 2nd surgery | No | Sevoflurane | n.a.a | 10.4 | 23.8 | 4.4 | Yesb | n.a.c | n.a.c |
| Patient 20 | No | Propofol | n.a.a | 8.4 | 23.0 | 32.0 | Yesb | n.a.c | Yes |
n.a.: not available due to preoperative cognitive impairment, poor awakening, or general anesthesia
Consistency with those ≥80% of the maximum CCEPPL→AL response
n.a.: not available due to MRI trouble or metallic artifact, AF: arcuate fasciculus, AL: anterior language area, HFES: high‐frequency electrical stimulation, PL: posterior language area.
In all 10 patients, who had no preoperative language impairment and were awakened fully during surgery, the frontal stimulus site was confirmed as the core AL by high‐frequency ES (Table 4); speech arrest was observed with the picture naming task in eight patients (Patients 1, 4, 5, 6, 9, 10, 14, and 16), and slowing of speech in two (Patients 2 and 3). In Patient 9, the core AL was confirmed by preoperative high‐frequency ES using chronically implanted subdural electrodes.
As for the localization of the AL and PL, there were general correspondences (62.5–90.9%) between CCEP (stimulus and response sites) and preoperative anatomical (cortical terminations of tractography) or functional (fMRI activation loci) neuroimaging findings (see details in Table 5 and Supporting Information Table). The positive rate of fMRI activation areas in the PL using the reading task was higher (90.9%) than by using the Shiritori task (62.5%), but did not reach statistical significance (P = 0.17).
Table 5.
Consistency between CCEP connectivity and preoperative neuroimaging studies
|
Tractography (the AF tract) (13 patients) |
fMRI | ||
|---|---|---|---|
|
Shiritori task (16 patients) |
Reading task (11 patients) |
||
| AL (%) |
10 (76.9) |
14 (87.5) |
10 (90.9) |
| PL (%) |
10 (76.9) |
10 (62.5) |
10 (90.9) |
AF: arcuate fasciculus, AL: anterior language area, PL: posterior language area.
Intraoperative CCEP Monitoring and Functional Outcome
In all patients, online CCEPAL→PL monitoring was performed successfully using either sevoflurane or propofol, without provoking clinical seizures or ECoG seizure patterns. Only in Patient 8, online sequential CCEPPL→AL monitoring was performed due to the tumor location near AL. In Patient 12, because the maximum CCEP response was recorded from the postcentral gyrus, CCEP monitoring was performed on the CCEP response electrodes in the temporal lobe, which was spatio‐temporally discrete from the maximum CCEP response in the postcentral gyrus.
In seven patients (Patients 7, 8, 11, and 17–20; eight investigations), the preoperative AF tract could not be traced successfully due to brain edema (Patients 7, 8, 17, and 18), MRI trouble (Patients 19 and 20), or metallic artifact (Patient 11). In addition, four of these seven patients (Patients 17–20; five investigations) underwent surgery only under general anesthesia. In all seven patients (eight investigations), online CCEPAL→PL monitoring was performed successfully. In all four patients without the preoperative AF tract due to brain edema, preoperative fMRI activation was consistent with either AL, PL, or both (Supporting Information Table). Of note, the postoperative AF tract became traceable (Fig. 3A, Table 4), and the cortical termination of the postoperative AF tract was consistent with both frontal stimulus and temporoparietal response sites. In other three patients (Patients 11, 19, and 20; four investigations) without preoperative MRI scan for neuroimaging studies, postoperative MRI scan was available only in Patient 20, and the postoperative AF tract was traceable and consistent with both frontal stimulus and temporoparietal CCEP response sites. In all seven patients, no further language dysfunction developed after surgery.
In 15 patients (16 investigations), including seven patients (Patients 7, 8, 11, and 17–20) mentioned above, N1 amplitude increased by an average of 24.1% (ranging from 2.2 to 68.6%) after tumor removal (see representative investigations in Fig. 3A,B). As for the N1 latencies, the onset latency changed by an average of −0.3 ms (ranging from −3.4 to +1.8 ms), and the peak latency changed by an average of 1.6 ms (ranging from −1.4 to +7.2 ms). In all, postoperative language function was preserved, and postoperative conventional MRI revealed the reduction of brain edema or mass lesion.
Conversely, in other five patients (five investigations; Patients 2, 4, 13, 15, and 16), N1 amplitude decreased by an average of 27.5% (ranging from 9.8 to 51.5%). As for the N1 latencies, the onset latency changed by an average of 0.6 ms (ranging from −0.6 to +1.2 ms), and the peak latency changed by an average of −0.8 ms (ranging from −1.6 to 0 ms). Four patients (Patients 4, 13, 15, and 16) showed further language impairment immediately after surgery. As reported previously [Yamao et al., 2014], Patient 4 had a 32.0% decrease and showed phonemic paraphasia immediately after surgery. She had recovered fully three months after surgery. In Patient 13, the preoperative subcategory score for verbal fluency (the word recall task) was 17/20. N1 amplitude decreased from 233 to 158 μV (−32.0%) after tumor resection. Because the patient did not awaken well during surgery, we were unable to evaluate intraoperative language function. She showed a decline in verbal fluency immediately after surgery (the word recall task: 7), but recovered four months after surgery (the word recall task: 17). The repetition task score was preserved before and after surgery (the repetition task of WAB: 10/10). Unfortunately, her postoperative DWI scan was not available due to MRI machine trouble. In Patient 15, N1 amplitude decreased from 121 to 58 μV (−51.5%) after tumor resection (Fig. 3C). He had phonemic paraphasia (e.g., “Sendaku” instead of “Sentaku,” which means washing in Japanese) preoperatively, but did not show severe disturbance of repetition [the repetition task (word or sentence) of WAB: 9.2/10]. We could not apply high‐frequency ES, because he did not become fully awake during surgery. He developed further phonemic paraphasia and impairment of repetition immediately after surgery (the repetition task: 3.3). The postoperative AF tract became untraceable (Fig. 3C), and his symptoms had continued until the final follow‐up (4 months after surgery; the repetition task: 5.2). In Patient 16, N1 amplitude decreased from 446 to 403 μV (−9.8%) after left standard anterior temporal lobectomy including tumor resection. She had disturbance of naming preoperatively (the naming task: 6.2/10), but she developed further naming disturbances and semantic paraphasia (e.g., “Spoon” instead of “Fork”) during and immediately after surgery (the naming task: 2.7), and this symptom continued until the final follow‐up (six months after surgery; the naming task: 2.6). Repetition was preserved (the repetition task: 9/10), and the postoperative AF tract remained traceable.
The overall results are summarized in Tables 1 and 4, and Supporting Information Table.
Intraoperative Subcortical Stimulation Findings and the Postoperative AF Tract
In four (Patients 3, 4, 5, and 9) of eight patients, in whom high‐frequency ES was performed to the removal floor, language impairment was elicited in the picture naming task; arrest of naming in Patients 3, 4, and 9, and slowing in Patient 5. Judging from intraoperative visual inspection and postoperative neuroimaging studies, in these four patients, the distance between stimulus sites and the postoperative AF tract was within 5.0 mm (3.0, 1.4, 2.8, and 4.1 mm, respectively). In other four patients (Patients 1, 6, 10, and 14) who did not show naming impairment, the distance was over 8.0 mm (14.9, 11.2, 8.1, and 18.1 mm, respectively).
In seven of 12 patients, in whom single‐pulse ES was performed to the removal floor, SCEPs were recorded both at the ventrolateral frontal area (the putative AL) and temporoparietal area (the putative PL). As reported previously [Yamao et al., 2014], in three patients (Patients 3–5), the sum of SCEP N1 onset latencies (SCEPWM→AL + SCEPWM→PL) approximately corresponded with the CCEPAL→PL N1 onset latency (the difference of latencies; 0.8, 0.4, and 0.6 ms, respectively). A similar tendency (SCEPWM→AL + SCEPWM→PL ≈ CCEPAL→PL) for the N1 onset latencies was observed in Patient 15 [14.0 ms (sum of SCEPs) vs. 12.4 ms (CCEPAL→PL), the difference; 1.6 ms, see Fig. 4], but not in Patient 6 (9.8 ms vs. 13.0 ms, the difference; 3.2 ms), Patient 14 (17.4 ms vs. 11.2 ms, the difference; 6.2 ms), and Patient 17 (20.0 ms vs. 13.8 ms, the difference; 6.2 ms). In three patients (Patients 3–5) who showed good correspondence of N1 onset latencies between CCEP and SCEPs, the distance between the stimulus site and the AF tract was within 3.0 mm (3.0, 1.4, and 2.8 mm, respectively), while in other three patients (Patients 6, 14, and 17) without correspondence of N1 onset latencies, the distance was over 8.0 mm (11.2, 18.1, and 8.1 mm, respectively). In five of 12 patients (Patient 1, 7, 10, 16, and 18), in whom SCEPs were recorded neither at the ventrolateral frontal area, temporoparietal area, nor both, the distance was over 7.0 mm (14.9, 10.4, 8.1, 8.4, and 7.1 mm, respectively). Of note, in only four patients (Patients 3–5 and 15) who showed good correspondence of N1 onset latencies between CCEP and SCEPs, both frontal CCEPAL→PL stimulus sites and the maximum CCEPAL→PL response sites corresponded with SCEPWM→AL and SCEPWM→PL response sites (>20% of the maximum response), respectively.
The overall results are summarized in Table 6.
Table 6.
High‐frequency and single‐pulse subcortical electrical stimulation
| HFES at WM |
SCEPWM→AL N1 latency (ms) |
SCEPWM→PL N1 latency (ms) |
SCEPWM→AL + SCEPWM→PL (ms) |
CCEPAL→PL N1 latency (ms) |
The difference between N1 onset latencies (CCEPAL→PL vs. summed SCEP) (ms) | Consistency of SCEPWM→AL/SCEPWM→PL response sites with CCEP stimulus site/maximum response sitea | The distance between the WM stimulus site and the AF tract (mm) | ||||
|---|---|---|---|---|---|---|---|---|---|---|---|
| Language impairment | onset | peak | onset | peak | onset/peak | onset | peak | ||||
| Patient 1 | No | no response | no response | − | 7.6 | 30.8 | − | − | 14.9 | ||
| Patient 3 | Yes | 5.6 | 24.6 | 6.4 | 19.6 | 12.0/44.2 | 12.8 | 29.2 | 0.8 | Yes/Yes | 3.0 |
| Patient 4 | Yes | 7.2 | 19.0 | 4.2 | 12.0 | 11.4/31.0 | 11.0 | 25.0 | 0.4 | Yes/Yes | 1.4 |
| Patient 5 | Yes | 6.2 | 17.6 | 4.0 | 15.8 | 10.2/33.4 | 9.6 | 32.0 | 0.6 | Yes/Yes | 2.8 |
| Patient 6 | No | 6.6 | 22.6 | 3.2 | 18.0 | 9.8/40.6 | 13.0 | 33.2 | 3.2 | Yes/No | 11.2 |
| Patient 7 | n.a.b | no response | no response | − | 12.2 | 27.6 | − | − | 10.4 | ||
| Patient 9 | Yes | n.a.b | n.a.b | n.a.b | n.a.b | − | 11.4 | 26.2 | − | − | 4.1 |
| Patient 10 | No | 3.6 | 9.4 | no response | − | 14.0 | 30.4 | − | No/− | 8.1 | |
| Patient 14 | No | 9.6 | 41.6 | 7.8 | 30.4 | 17.4/72.0 | 11.2 | 31.2 | 6.2 | No/Yes | 18.1 |
| Patient 15 | n.a.b | 8.6 | 21.0 | 5.4 | 24.4 | 14.0/45.4 | 12.4 | 37.0 | 1.6 | Yes/Yes | n.a.c |
| Patient 16 | n.a.b | no response | no response | − | 10.8 | 27.2 | − | − | 8.4 | ||
| Patient 17 | n.a.b | 8.0 | 39.6 | 12.0 | 59.4 | 20.0/99.0 | 13.8 | 24.0 | 6.2 | No/Yes | 8.1 |
| Patient 18 | n.a.b | no response | 8.4 | 23.8 | − | 14.4 | 27.4 | − | −/No | 7.1 | |
Only patients in whom subcortical electrical stimulation was performed were shown.
Consistency with those ≥20% of the maximum SCEPWM→AL/SCEPWM→PL response.
n.a.: not available due to preoperative cognitive impairment, poor awakening, general anesthesia, or clinical limitations.
n.a.: not available because the postoperative AF tract was untraceable.
AF: arcuate fasciculus, AL: anterior language area, HFES: high‐frequency electrical stimulation, PL: posterior language area, WM: white matter.
DISCUSSION
Based on further investigations, we attempted to clarify the clinical impact of this new intraoperative method and demonstrated that (1) intraoperative dorsal language network monitoring is feasible even when patients were not suitable for awake surgery or when preoperative neuroimaging studies were incomplete, (2) CCEP is a dynamic marker of functional connectivity or integrity of the AF, and CCEP N1 amplitude could even become larger after reduction of brain edema, (3) a 50% CCEP N1 amplitude decline might be a cut‐off value to prevent permanent language dysfunction due to impairment of AF, (4) when the sum of SCEPs N1 latencies is comparable to CCEPAL→PL N1 onset latency (<2.0 ms difference), the subcortical stimulus site is close enough (<3.0 mm) to the AF.
Clinical Relevance of Intraoperative CCEP Monitoring
After propofol was used in awake craniotomy in the early 1990s [Silbergeld et al., 1992], awake surgery has become the gold standard for direct monitoring of intraoperative language functions with using direct cortical and subcortical ES [Duffau et al., 2002; Kamada et al., 2007]. Recent development of diffusion tractography has visualized the subcortical language pathway such as the AF tract [Catani et al., 2005]. However, surgeons cannot fully evaluate intraoperative neurological examinations when the patient has preoperative language dysfunction [Kayama, 2012; Nossek et al., 2013]. In a previous diffusion tensor tractography study with glioma in the ventrolateral frontal region [Bizzi et al., 2012], the AF tract was dislocated in 42%, and interrupted in 32%. In the present probabilistic diffusion tractography study, in four of 17 patients (23.5%) on whom preoperative MRI scans for neuroimaging studies were performed, the preoperative AF tract was untraceable. In addition, in three patients, no preoperative MRI scans for neuroimaging studies were performed due to MRI trouble or metallic artifact. Even in all these seven patients (Patients 7, 8, 11, and 17–20; eight investigations), intraoperative CCEP monitoring was feasible, and no patients had further language dysfunction. Of note, four (Patients 17–20; five investigations) of these seven patients underwent surgery only under general anesthesia. In five of seven patients, postoperative MRI scan for neuroimaging studies was available. In all these five patients, the postoperative AF tract became traceable, and the cortical termination of the postoperative AF tract was consistent with both frontal stimulus and temporoparietal CCEP response sites. These results suggest that even if patients are not suitable for awake surgery and/or preoperative neuroimaging studies are not performed fully, the intraoperative CCEP connectivity pattern itself is able to delineate the dorsal language network without high‐frequency ES, and CCEP monitoring is clinically useful in the preservation of language function.
In four patients (Patients 7, 8, 18, and 19) with the preoperative untraceable AF tract, intraoperative electrophysiological tract‐tracing was possible, and the postoperative AF tract became traceable. It is likely that the brain edema resulted in decreased fractional anisotropy in the preoperative state. As a result, the preoperative AF tract could not be reconstructed although the tract itself remained functional, as was the case in Bizzi [Bizzi, 2009]. Additionally, in 16 investigations including these four patients, N1 amplitude increased during surgery. This finding indicates that CCEP is a dynamic marker of functional connectivity and that the functional integrity of the AF is reversible when the brain edema is alleviated by tumor removal. Therefore, the untraceable preoperative AF tract does not always indicate the disrupted connection, and in this regard, intraoperative CCEP monitoring is considered more clinically valuable in detecting and monitoring the subcortical language pathway.
We applied single‐pulse ES to the electrode in the lateral temporoparietal area and the CCEPPL→AL response was successfully recorded from the frontal stimulus site in all 13 investigations. Although the study of CCEPPL→AL was not performed in all subjects, the connection between the two areas appears to be bidirectional in an intraoperative setting, as reported in an extraoperative setting [Matsumoto et al., 2004]. The electrodes showing ≥80% of the maximum CCEPPL→AL response were consistent with the frontal CCEPAL→PL stimulus site (blue circles in Fig. 1B, Table 4) only in eight of 13 investigations (61.5%). This is probably due to (1) the different degree of convergence between the two directions (more convergent projection from the PL to the AL but relatively more divergent projection from the AL to the PL) [Matsumoto et al., 2004], or (2) a possible functional shift of the PL outside the directly connected cortical region [Enatsu et al., 2013a]. We recognize that we did not perform high‐frequency ES in the temporoparietal area in the present study; further ES studies combined with other methodologies will help to detect PL areas. Although only a small number of investigations including our case (Patient 8) were reported [Saito et al., 2014; Tamura et al., 2016], intraoperative dorsal language network monitoring by CCEPPL→AL may be clinically useful, depending on the tumor location.
Language Outcome and Cut‐off Values of Intraoperative CCEP/SCEP Monitoring
No patients with a CCEP N1 amplitude increase had further language dysfunction after surgery in our series. A decrease in N1 amplitude by less than 50% led to transient language impairment, except for one case (Patient 16). As reported previously [Yamao et al., 2014], Patient 4 had a 32.0% decrease and showed transient phonemic paraphasia probably due to the partial resection of the SMG. Patient 13 with a 32.0% decrease had a decline in verbal fluency, but repetition was preserved. Her transient postoperative symptoms were most likely due to partial resection of the IFG or subcortical resection just beneath the cortex. In Patient 15 with a 51.5% decrease, the disturbance of repetition and phonemic paraphasia continued until the final follow‐up. The CCEP and SCEP findings provided evidence that the surgical procedure invaded the AF. The cortical language areas detected by preoperative fMRI study were spared (no activation at the removed part of the SMG where the tumor invaded), while the postoperative AF tract became untraceable. According to recent studies [Catani et al., 2005; Fridriksson et al., 2010; Hickok and Poeppel, 2004; Maldonado et al., 2011], conduction aphasia is defined as impaired repetition and phonemic errors with relatively spared spontaneous speech fluency and auditory comprehension, and is associated with damage of the AF or the left inferior parietal cortex, including the SMG. Nevertheless, only a few studies reported conduction aphasia with an isolated lesion at the AF [Poncet et al., 1987; Yamada et al., 2007]. Judging from the neuroimaging and electrophysiological findings, our rare case (Patient 15) further supports the substantial role of the AF in generating conduction aphasia.
In previous intraoperative MEP studies [Kombos et al., 2009; Macdonald, 2006; Saito et al., 2015], a 50–80% amplitude decline seemed to be the critical limit for long‐term motor dysfunction. By way of analogy to MEP, a 50% N1 amplitude decline might be an appropriate cut‐off value to preserve the dorsal language pathway, but this study did not yield a clear cut‐off value due to a limited number of participants. In Patient 15, CCEP N1 amplitude declined by 51.5% (not 100%), and SCEPs were able to be recorded both at the ventrolateral frontal area and temporoparietal area, although the postoperative AF tract became untraceable and language dysfunction continued until the final follow‐up. This suggests that (1) the AF may not be completely cut‐off, and recovery from symptoms may proceed more slowly, as previously reported in another intraoperative CCEP study (recovery in 15 months) although the details of language assessment were not available [Saito et al., 2014], and/or (2) the remaining CCEP responses may reflect those conveyed through the ventral language white matter pathway. Actually, in Patient 16 who underwent standard anterior temporal lobectomy including tumor resection, although the CCEP N1 amplitude decreased only by 9.8%, the patient developed semantic paraphasia and disturbance of naming. Her postoperative symptoms were most likely due to disturbance of the ventral language pathway, such as the inferior fronto‐occipital fasciculus [Martino et al., 2010] or the resection of the anterior temporal cortices [Shimotake et al., 2015; Visser et al., 2010; Visser and Lambon Ralph, 2011]. Further studies are warranted to define and evaluate other subcortical language pathways, including the ventral pathway.
In a previous study, combining diffusion tractography and ES [Kamada et al., 2007], 6 mm between the subcortical stimulus site and the AF might be a “safe distance” for resection. In this study, when high‐frequency ES to the floor of the removal cavity elicited language impairment (four patients), the distance between the subcortical stimulus site and the AF tract was within 5 mm. As for the comparison of N1 onset latencies between SCEPs and CCEPAL→PL, when the sum of SCEP N1 onset latencies approximately corresponded with the CCEPAL→PL N1 onset latency (within 1.0 ms, three patients), the distance was within 3 mm. In the Patient 15, in whom the surgical procedure invaded the AF and resulted in a 51.5% CCEP amplitude decrease and the postoperative untraceable AF tract, the time difference of N1 onset latencies was 1.6 ms. A 2.0 ms difference might be a clinically useful cut‐off value to identify the dorsal language pathway. In this study, SCEP investigation was performed only after completion of the tumor resection partly because a bipolar electrode probe with 5 mm tip spacing, as used in other ES studies [Duffau et al., 2002; Kamada et al., 2007; Maldonado et al., 2011], was not available for sequential stimulation during resection. Future studies should seek for its application “during” tumor resection. Neurosurgeons can screen the function of the white matter by high‐frequency ES and probe its cortical terminations by single‐pulse ES during surgery. Comparison of anatomical distribution (SCEP response sites vs. CCEP stimulus and response sites) and latencies (N1 onset latencies) would be clinically useful to identify the AF.
Finally, we need further studies to establish a solid cut‐off value to develop the CCEP monitoring as an efficient intraoperative method for preservation of the dorsal language pathway. We hope our study precedes larger, multicenter collaborative studies to establish unique intraoperative monitoring and tract‐tracing methods.
Supporting information
Supporting Information
Supporting Table Consistency of CCEP connectivity with preoperative neuroimaging studies in each patient
ACKNOWLEDGMENTS
We thank Drs. Nobuyuki Fukui, Jun Shinozaki, and Toshiya Sugino for providing the patients' data. This work was partly supported by JSPS KAKENHI Grant Number 15H01664 (RM), 15H05874 (AI), (B) 26282218 (RM), (C) 15K10361(TK), Grants‐in‐Aid for Young Scientists (B) 25861273 (TK), and Exploratory Research 26560465 (RM). Department of Epilepsy, Movement Disorders and Physiology, Kyoto University Graduate School of Medicine is an endowment department, supported with grants by GlaxoSmithKline K.K., NIHON KOHDENCORPORATION, Otsuka Pharmaceutical Co., and UCB Japan Co., Ltd.
Correction added on 31 January 2017 after first online publication.
Contributor Information
Takeharu Kunieda, Email: kuny@kuhp.kyoto-u.ac.jp.
Riki Matsumoto, Email: matsumot@kuhp.kyoto-u.ac.jp.
REFERENCES
- Bizzi A (2009): Presurgical mapping of verbal language in brain tumors with functional MR imaging and MR tractography. Neuroimaging Clin N Am 19:573–596. [DOI] [PubMed] [Google Scholar]
- Bizzi A, Nava S, Ferrè F, Castelli G, Aquino D, Ciaraffa F, Broggi G, DiMeco F, Piacentini S (2012): Aphasia induced by gliomas growing in the ventrolateral frontal region: Assessment with diffusion MR tractography, functional MR imaging and neuropsychology. Cortex 48:255–272. [DOI] [PubMed] [Google Scholar]
- Catani M, Jones DK, ffytche DH (2005): Perisylvian language networks of the human brain. Ann Neurol 57:8–16. [DOI] [PubMed] [Google Scholar]
- Conner CR, Ellmore TM, DiSano MA, Pieters TA, Potter AW, Tandon N (2011): Anatomic and electro‐physiologic connectivity of the language system: a combined DTI‐CCEP study. Comput Biol Med 41:1100–1109. [DOI] [PMC free article] [PubMed] [Google Scholar]
- Duffau H, Capelle L, Sichez N, Denvil D, Lopes M, Sichez JP, Bitar A, Fohanno D (2002): Intraoperative mapping of the subcortical language pathways using direct stimulations. An anatomo‐functional study. Brain 125:199–214. [DOI] [PubMed] [Google Scholar]
- Enatsu R, Gonzalez‐Martinez J, Bulacio J, Kubota Y, Mosher J, Burgess RC, Najm I, Nair DR (2015): Connections of the limbic network: A corticocortical evoked potentials study. Cortex 62:20–33. [DOI] [PubMed] [Google Scholar]
- Enatsu R, Kubota Y, Kakisaka Y, Bulacio J, Piao Z, O'Connor T, Horning K, Mosher J, Burgess RC, Bingaman W, Nair DR (2013a): Reorganization of posterior language area in temporal lobe epilepsy: A cortico‐cortical evoked potential study. Epilepsy Res 103:73–82. [DOI] [PubMed] [Google Scholar]
- Enatsu R, Matsumoto R, Piao Z, O'Connor T, Horning K, Burgess RC, Bulacio J, Bingaman W, Nair DR (2013b): Cortical negative motor network in comparison with sensorimotor network: A cortico‐cortical evoked potential study. Cortex 49:2080–2096. [DOI] [PubMed] [Google Scholar]
- Fridriksson J, Kjartansson O, Morgan PS, Hjaltason H, Magnusdottir S, Bonilha L, Rorden C (2010): Impaired speech repetition and left parietal lobe damage. J Neurosci 30:11057–11061. [DOI] [PMC free article] [PubMed] [Google Scholar]
- Hickok G, Poeppel D (2004): Dorsal and ventral streams: A framework for understanding aspects of the functional anatomy of language. Cognition 92:67–99. [DOI] [PubMed] [Google Scholar]
- Kamada K, Todo T, Masutani Y, Aoki S, Ino K, Morita A, Saito N (2007): Visualization of the frontotemporal language fibers by tractography combined with functional magnetic resonance imaging and magnetoencephalography. J Neurosurg 106:90–98. [DOI] [PubMed] [Google Scholar]
- Kayama T (2012): The guidelines for awake craniotomy guidelines committee of the Japan awake surgery conference. Neurol Med Chir (Tokyo) 52:119–141. [DOI] [PubMed] [Google Scholar]
- Kombos T, Picht T, Derdilopoulos A, Suess O (2009): Impact of intraoperative neurophysiological monitoring on surgery of high‐grade gliomas. J Clin Neurophysiol 26:422–425. [DOI] [PubMed] [Google Scholar]
- Koubeissi MZ, Lesser RP, Sinai A, Gaillard WD, Franaszczuk PJ, Crone NE (2012): Connectivity between perisylvian and bilateral basal temporal cortices. Cereb Cortex 22:918–925. [DOI] [PMC free article] [PubMed] [Google Scholar]
- Kubota Y, Enatsu R, Gonzalez‐Martinez J, Bulacio J, Mosher J, Burgess RC, Nair DR (2013): In vivo human hippocampal cingulate connectivity: A corticocortical evoked potentials (CCEPs) study. Clin Neurophysiol 124:1547–1556. [DOI] [PubMed] [Google Scholar]
- Lacruz ME, Garcia Seoane JJ, Valentin A, Selway R, Alarcón G (2007): Frontal and temporal functional connections of the living human brain. Eur J Neurosci 26:1357–1370. [DOI] [PubMed] [Google Scholar]
- Macdonald DB (2006): Intraoperative motor evoked potential monitoring: Overview and update. J Clin Monit Comput 20:347–377. [DOI] [PubMed] [Google Scholar]
- Maldonado IL, Moritz‐Gasser S, Duffau H (2011): Does the left superior longitudinal fascicle subserve language semantics? A brain electrostimulation study. Brain Struct Funct 216:263–274. [DOI] [PubMed] [Google Scholar]
- Martino J, Vergani F, Robles SG, Duffau H (2010): New insights into the anatomic dissection of the temporal stem with special emphasis on the inferior fronto‐occipital fasciculus: Implications in surgical approach to left mesiotemporal and temporoinsular structures. Neurosurgery 66:4–12. [DOI] [PubMed] [Google Scholar]
- Matsumoto R, Nair DR, LaPresto E, Najm I, Bingaman W, Shibasaki H, Lüders HO (2004): Functional connectivity in the human language system: A cortico‐cortical evoked potential study. Brain 127:2316–2330. [DOI] [PubMed] [Google Scholar]
- Matsumoto R, Nair DR, LaPresto E, Bingaman W, Shibasaki H, Lüders HO (2007): Functional connectivity in human cortical motor system: a cortico‐cortical evoked potential study. Brain 130:181–197. [DOI] [PubMed] [Google Scholar]
- Matsumoto R, Okada T, Mikuni N, Mitsueda‐Ono T, Taki J, Sawamoto N, Hanakawa T, Miki Y, Hashimoto N, Fukuyama H, Takahashi R, Ikeda A (2008): Hemispheric asymmetry of the arcuate fasciculus: a preliminary diffusion tensor tractography study in patients with unilateral language dominance defined by Wada test. J Neurol 255:1703–1711. [DOI] [PubMed] [Google Scholar]
- Matsumoto R, Nair DR, Ikeda A, Fumuro T, Lapresto E, Mikuni N, Bingaman W, Miyamoto S, Fukuyama H, Takahashi R, Najm I, Shibasaki H, Lüders HO (2012): Parieto‐frontal network in humans studied by cortico‐cortical evoked potential. Hum Brain Mapp 33:2856–2872. [DOI] [PMC free article] [PubMed] [Google Scholar]
- Matsuzaki N, Juhász C, Asano E (2013): Cortico‐cortical evoked potentials and stimulation‐elicited gamma activity preferentially propagate from lower‐ to higher‐order visual areas. Clin Neurophysiol 124:1290–1296. [DOI] [PMC free article] [PubMed] [Google Scholar]
- Nossek E, Matot I, Shahar T, Barzilai O, Rapoport Y, Gonen T, Sela G, Korn A, Hayat D, Ram Z (2013): Failed awake craniotomy: A retrospective analysis in 424 patients undergoing craniotomy for brain tumor. J Neurosurg 118:243–249. [DOI] [PubMed] [Google Scholar]
- Oguri T, Sawamoto N, Tabu H, Urayama S, Matsuhashi M, Matsukawa N, Ojika K, Fukuyama H (2013): Overlapping connections within the motor cortico‐basal ganglia circuit: fMRI‐tractography analysis. NeuroImage 78:353–362. [DOI] [PubMed] [Google Scholar]
- Poncet M, Habib M, Robillard A (1987): Deep left parietal lobe syndrome: Conduction aphasia and other neurobehavioural disorders due to a small subcortical lesion. J Neurol Neurosurg Psychiatry 50:709–713. [DOI] [PMC free article] [PubMed] [Google Scholar]
- Saito T, Muragaki Y, Maruyama T, Tamura M, Nitta M, Okada Y (2015): Intraoperative functional mapping and monitoring during glioma surgery. Neurol Med Chir (Tokyo) 55:1–13. [DOI] [PMC free article] [PubMed] [Google Scholar]
- Saito T, Tamura M, Muragaki Y, Maruyama T, Kubota Y, Fukuchi S, Nitta M, Chernov M, Okamoto S, Sugiyama K, Kurisu K, Sakai KL, Okada Y, Iseki H (2014): Intraoperative cortico‐cortical evoked potentials for the evaluation of language function during brain tumor resection: Initial experience with 13 cases. J Neurosurg 121:828–838. [DOI] [PubMed] [Google Scholar]
- Shimotake A, Matsumoto R, Ueno T, Kunieda T, Saito S, Hoffman P, Kikuchi T, Fukuyama H, Miyamoto S, Takahashi R, Ikeda A, Lambon Ralph MA (2015): Direct exploration of the role of the ventral anterior temporal lobe in semantic memory: Cortical stimulation and local field potential evidence from subdural grid electrodes. Cereb Cortex 25:3802–3817. [DOI] [PMC free article] [PubMed] [Google Scholar]
- Silbergeld DL, Mueller WM, Colley PS, Ojemann GA, Lettich E (1992): Use of propofol (Diprivan) for awake craniotomies: Technical note. Surg Neurol 38:271–272. [DOI] [PubMed] [Google Scholar]
- Smith SM, Jenkinson M, Woolrich MW, Beckmann CF, Behrens TE, Johansen‐Berg H, Bannister PRD, Luca M, Drobnjak I, Flitney DE, Niazy RK, Saunders J, Vickers J, Zhang Y,D, Stefano N, Brady JM, Matthews PM (2004): Advances in functional and structural MR image analysis and implementation as FSL. NeuroImage 23(Suppl 1):S208–S219. [DOI] [PubMed] [Google Scholar]
- Takayama M, Miyamoto S, Ikeda A, Mikuni N, Takahashi JB, Usui K, Satow T, Yamamoto J, Matsuhashi M, Matsumoto R, Nagamine T, Shibasaki H, Hashimoto N (2004): Intracarotid propofol test for speech and memory dominance in man. Neurology 63:510–515. [DOI] [PubMed] [Google Scholar]
- Tamura Y, Ogawa H, Kapeller C, Prueckl R, Takeuchi F, Anei R, Ritaccio A, Guger C, Kamada K (2016): Passive language mapping combining real‐time oscillation analysis with cortico‐cortical evoked potentials for awake craniotomy. J Neurosurg 125:1580–1588. [DOI] [PubMed] [Google Scholar]
- Visser M, Jefferies E, Lambon Ralph MA (2010): Semantic processing in the anterior temporal lobes: A meta‐analysis of the functional neuroimaging literature. J Cogn Neurosci 22:1083–1094. [DOI] [PubMed] [Google Scholar]
- Visser M, Lambon Ralph MA (2011): Differential contributions of bilateral ventral anterior temporal lobe and left anterior superior temporal gyrus to semantic processes. J Cogn Neurosci 23:3121–3131. [DOI] [PubMed] [Google Scholar]
- Wakana S, Caprihan A, Panzenboeck MM, Fallon JH, Perry M, Gollub RL, Hua K, Zhang J, Jiang H, Dubey P, Blitz A, van Zijl P, Mori S (2007): Reproducibility of quantitative tractography methods applied to cerebral white matter. NeuroImage 36:630–644. [DOI] [PMC free article] [PubMed] [Google Scholar]
- Yamada K, Nagakane Y, Mizuno T, Hosomi A, Nakagawa M, Nishimura T (2007): MR tractography depicting damage to the arcuate fasciculus in a patient with conduction aphasia. Neurology 68:789. [DOI] [PubMed] [Google Scholar]
- Yamao Y, Matsumoto R, Kunieda T, Arakawa Y, Kobayashi K, Usami K, Shibata S, Kikuchi T, Sawamoto N, Mikuni N, Ikeda A, Fukuyama H, Miyamoto S (2014): Intraoperative dorsal language network mapping by using single‐pulse electrical stimulation. Hum Brain Mapp 35:4345–4361. [DOI] [PMC free article] [PubMed] [Google Scholar]
- Yamao Y, Matsumoto R, Kunieda T, Shibata S, Shimotake A, Kikuchi T, Satow T, Mikuni N, Fukuyama H, Ikeda A, Miyamoto S (2015): Neural correlates of mirth and laughter: A direct electrical cortical stimulation study. Cortex 66:134–140. [DOI] [PubMed] [Google Scholar]
Associated Data
This section collects any data citations, data availability statements, or supplementary materials included in this article.
Supplementary Materials
Supporting Information
Supporting Table Consistency of CCEP connectivity with preoperative neuroimaging studies in each patient