

Abstract
Learning letter‐speech sound correspondences is a major step in reading acquisition and is severely impaired in children with dyslexia. Up to now, it remains largely unknown how quickly neural networks adopt specific functions during audiovisual integration of linguistic information when prereading children learn letter‐speech sound correspondences. Here, we simulated the process of learning letter‐speech sound correspondences in 20 prereading children (6.13–7.17 years) at varying risk for dyslexia by training artificial letter‐speech sound correspondences within a single experimental session. Subsequently, we acquired simultaneously event‐related potentials (ERP) and functional magnetic resonance imaging (fMRI) scans during implicit audiovisual presentation of trained and untrained pairs. Audiovisual integration of trained pairs correlated with individual learning rates in right superior temporal, left inferior temporal, and bilateral parietal areas and with phonological awareness in left temporal areas. In correspondence, a differential left‐lateralized parietooccipitotemporal ERP at 400 ms for trained pairs correlated with learning achievement and familial risk. Finally, a late (650 ms) posterior negativity indicating audiovisual congruency of trained pairs was associated with increased fMRI activation in the left occipital cortex. Taken together, a short (<30 min) letter‐speech sound training initializes audiovisual integration in neural systems that are responsible for processing linguistic information in proficient readers. To conclude, the ability to learn grapheme‐phoneme correspondences, the familial history of reading disability, and phonological awareness of prereading children account for the degree of audiovisual integration in a distributed brain network. Such findings on emerging linguistic audiovisual integration could allow for distinguishing between children with typical and atypical reading development. Hum Brain Mapp 38:1038–1055, 2017. © 2016 Wiley Periodicals, Inc.
Keywords: audiovisual integration, congruency, development, dyslexia, electroencephalography, functional magnetic resonance imaging, letter acquisition, neuroimaging, prereading children
Abbreviations
- ANOVA
Analysis of variance
- ARHQ
Adult reading history questionnaire
- BOLD
Blood‐oxygen‐level dependent
- EEG
Electroencephalography
- ERP
Event‐related potential
- fMRI
Functional magnetic resonance imaging
- GLM
Generalized linear model
- ITG
inferior temporal gyrus
- LMM
Linear mixed model
- MNI
Montreal Neurological Institute
- MRI
Magnetic resonance imaging
- MTG
Middle Temporal Gyrus
- POT
Parietooccipitotemporal
- RAN
Rapid automatized naming
- STG
Superior temporal gyrus
- TANOVA
Topographic analysis of variance
INTRODUCTION
Developmental dyslexia and poor reading skills comprise a major problem, such that 6–9% of children in western countries encounter difficulties in reading or spelling, despite normal intelligence and appropriate schooling [Shaywitz et al., 1990]. So far, numerous studies have shown that 34–66% of children at familial risk for dyslexia will develop future reading problems [Blomert and Willems, 2010; Pennington and Lefly, 2001; Scarborough, 1990; Snowling et al., 2003]. Early characterization of children at risk, who will develop dyslexia, is an important goal [Bach et al., 2013; Brem et al., 2013; Guttorm et al., 2005; Hoeft et al., 2007; Maurer et al., 2009; Snowling et al., 2003] and would allow for early and targeted prevention.
Learning grapheme‐phoneme correspondences forms the basis for successful reading acquisition in orthographically consistent alphabetic languages [Ziegler and Goswami, 2005]. When learning grapheme‐phoneme correspondences, children start to link orthographic (graphemes) with phonological (phonemes) information [Share, 1995]. The ability to map alphabetic symbols to speech sounds crucially depends on phonological awareness skills [Hulme et al., 2002; Melby‐Lervåg et al., 2012; Wagner and Torgesen, 1987]. From a brain perspective, diminished activation in occipitotemporal and parietotemporal brain regions is already seen in prereading children at risk for dyslexia during phonological processing [Raschle et al., 2012]. Although phonological deficits have usually been related to inadequate phonological representations of graphemes [Goswami, 2000], a recent study demonstrated deficient access to speech‐sound representations, resulting from a disrupted connection between frontal and temporal language areas in dyslexic adults [Boets et al., 2013]. However, it remains unclear whether this disruption in the adult brain causes the phonological awareness deficit that leads to reading impairments or rather reflects a consequence of reduced engagement in reading related activities, emphasizing the relevance of studying the developing brain.
Given the importance of grapheme‐phoneme correspondence learning for reading acquisition and the automation deficits seen in dyslexic children [Snowling, 1980], it has been suggested that learning letter‐speech sound correspondences and automated integration of phonological and orthographical information form the core deficit in dyslexic children and cause notorious slow reading [Blomert, 2011; Blomert and Willems, 2010]. Disruption of grapheme‐phoneme correspondence learning in dyslexia has been partly attributed to a reduced involvement of posterior occipitotemporal and inferoparietal brain regions in audiovisual integration [Blomert, 2011; Shaywitz et al., 2007]. Neurophysiological and functional magnetic resonance imaging (fMRI) studies in normal readers of transparent and semitransparent languages have provided evidence for more pronounced audiovisual integration processes for congruent than incongruent grapheme‐phoneme pairs in temporal and occipital brain areas [Raij et al., 2000; van Atteveldt et al., 2004]. Normal readers show more pronounced blood‐oxygen‐level dependent (BOLD) responses to congruent than incongruent grapheme‐phoneme pairs in implicit, passive audiovisual tasks in superior temporal brain areas, including the superior temporal gyrus (STG), the superior temporal sulcus, the Helschl's gyrus, and the planum temporale [van Atteveldt et al., 2004]. In contrast, adults and schoolchildren with dyslexia do not demonstrate the congruency effect found in normal readers, indicating a deviant interactive specialization of neural networks for automatic integration and processing of auditory and visual linguistic inputs [Blau et al., 2009, 2010].
Less transparent correspondences such as English letter‐speech sound pairs showed a reversed congruency effect, namely stronger responses in the temporal cortex for incongruent compared to congruent grapheme‐phoneme pairs [Holloway et al., 2015]. In addition, Kronschnabel et al., [2014] reported that normal adolescent readers of a semitransparent language (German) exhibit an enhanced activation for incongruent compared to congruent grapheme‐phoneme pairs in the left inferotemporal cortex, the left planum temporale and ventral opercular brain areas, while dyslexic readers showed the reversed pattern. Although the congruency effect is a well‐established concept to investigate differences in automatic audiovisual integration across different alphabetic languages and ages, the results in terms of the directionality of the congruency effect are rather mixed. The congruency effect depends at least partly on the transparency of the assessed language and is modulated by reading skills and developmental factors.
These findings have been complemented by electroencephalography (EEG) studies, providing additional evidence on the timing of audiovisual integration in the developing brain. Using audiovisual mismatch negativity and symbol‐to‐sound matching paradigms, an electrophysiological divergence has been pointed out in dyslexic children during audiovisual integration [Froyen et al., 2011; Widmann et al., 2012]. This divergence is evident in dyslexic children and adults as a reduction of the automatized electrophysiological response triggered by the presentation of a deviant stimulus after 100–250 ms [Froyen et al., 2008, 2011; Zarić et al., 2014]. Furthermore, poor reading children, including dyslexics, exhibit a diminished visual occipitotemporal N1 response for words at 164–272 ms after two years of formal reading training [Brem et al., 2013; Maurer et al., 2007]. Given that this print sensitivity develops with grapheme‐phoneme correspondence learning in prereading children [Brem et al., 2010], it is likely that hampered letter‐speech sound integration in dyslexic children affects the development of print sensitivity. A later negative electrophysiological response in audiovisual tasks between 300 and 700 ms is typically seen only in children [Froyen et al., 2008] and represents a later step in audiovisual integration, which is deficient in dyslexic children [Žarić et al., 2015]. These electrophysiological findings provide evidence for deficient visual processing and audiovisual integration in dyslexia supporting hitherto existing knowledge from magnetic resonance imaging (MRI) studies. Therefore, combining MRI and EEG allows for exploiting the advantages of both modalities providing a high spatial and temporal resolution of the cognitive processes occurring in the brain [Mulert et al., 2004].
Given that the disruption of grapheme‐phoneme binding is considered a core deficit in dyslexia [Aravena et al., 2013; Shaywitz et al., 2007], we aimed to simulate explicit grapheme‐phoneme correspondence learning within a group of kindergarten children at varying risk for dyslexia and to examine how neural networks become attuned to audiovisual integration processes at the very beginning of reading acquisition. Using simultaneous EEG‐fMRI recordings, we compared neurobiological responses to congruent and incongruent grapheme‐phoneme pairs after a short, computerized training of single grapheme‐phoneme correspondences mimicking the initial step of reading acquisition. To verify that training enhances audiovisual integration, we compared the processing of trained and untrained grapheme‐phoneme correspondences and examined how individual learning performance modulates the corresponding activation patterns. In addition, we aimed to clarify how individual differences in learning grapheme‐phoneme correspondences correlate with precursor skills of reading such as phonological awareness, letter knowledge, and rapid automatized naming (RAN). Such an interrelation allows for a better understanding of the development of audiovisual integration, as well as early identification of children with an audiovisual binding deficit, who are likely to experience problems with reading acquisition.
MATERIALS AND METHODS
Participants
A total of 30 kindergarten children participated in a behavioural session, a training session, and completed two parts of an audiovisual target detection task in a simultaneous EEG‐fMRI session. 10 children had to be excluded from analyses due to excessive motion affecting the MRI and EEG data quality (for cut‐off criteria see EEG and MRI data acquisition). The remaining 20 native German‐speaking children at risk for dyslexia were included in the current analysis (11 males, three left‐handed, 6.77 ± 0.26 years old). Parents completed the Adult Reading History Questionnaire (ARHQ) and the highest parental value was used to determine familial risk by applying a cut‐off score of greater than 0.3 [Lefly and Pennington, 2000]. In addition, reading skills of parents and affected siblings were assessed using a 1‐minute word and pseudoword reading fluency test [SLRT II; Moll and Landerl, 2014]. ARHQ scores correlated negatively with parental word (r = −0.60, P < 0.001) and pseudoword (r = −0.58, P < 0.001) reading skills, corroborating self‐reported risk for dyslexia [Supporting Information Fig. 1S; Maurer, et al., 2003]. Participants either had a parent (n = 16) or a sibling (n = 2) with difficulties in learning to read, or were diagnosed with a specific language impairment (n = 2). All participants were healthy, had an average or above average non‐verbal IQ estimate, normal or corrected to normal vision and no auditory impairment. Participants' parents received a description of the study and gave written informed consent. The study was approved by the research ethics committee of the canton of Zurich and neighbouring cantons in Switzerland.
Behavioural Assessment
The behavioural assessment was performed on average 14.5 ± 10.3 days before the imaging session. The subtest “block design” of the Wechsler Intelligence Scale for Children [WISC‐IV; Wechsler, 2011] was used to assess spatial problem‐solving as an intelligence estimate. In addition, we tested for letter‐speech sound knowledge in upper and lower case letters, initial reading skills (20 simple and short German one‐ or two‐syllable words in two to five upper case letters), vocabulary [Marburger Sprachverständnistest für Kinder; Elben and Lohaus, 2000], non‐word repetition [phonological processing; Mottier Test; Wild and Fleck, 2013], RAN of objects and phonological awareness including synthesis of onset and rime, phoneme synthesis, rhyming, and phoneme categorization [Test zur Erfassung der phonologischen Bewusstheit und der Benennungsgeschwindigkeit –TEPHOBE; Mayer, 2011].
As seen in Table 1, upper and lower case letter‐speech sound knowledge was limited to an average of 10.75 and 6.85 respectively, as expected, a few months before school enrolment. Because formal reading instruction in Switzerland starts in first grade and based on the mean performance in the word reading test (3.9 ± 4.6 of 20 simple words), kindergarten children were classified as prereaders.
Table 1.
Descriptive statistics of sample
| Sex (female/male) | 9/11 |
| Handedness (left/right) | 3/17 |
| Age in years | 6.77 ± 0.26 |
| Maximum parental ARHQ scorea | 0.52 ± 0.18 |
| Spatial problem‐solving (WISC) IQ estimate | 108.75 ± 13.85 |
| Upper case letter‐speech sound knowledgeb | 10.75 ± 6.02 |
| Lower case letter‐speech sound knowledgeb | 6.85 ± 5.41 |
| Reading skills (20 upper case letter words)b | 3.90 ± 4.62 |
| Passive vocabularyc | 59.90 ± 27.15 |
| Vocabulary – word meaningc | 47.70 ± 28.19 |
| Non‐word repetition (Mottier)c | 32.40 ± 23.04 |
| Phonological awareness (TEPHOBE)c | 52.39 ± 21.99 |
| RAN objectsc | 29.81 ± 20.50 |
Values are mean ± standard deviation.
The higher ARHQ score of both parents represents the maximum score per child and scores greater than 0.3 indicate a positive history of reading disability.
Raw values.
Percentile scores based on age‐matched norms.
Artificial Letter Training
During a computerized artificial letter training, participants learned the correspondences of six false font characters with familiar phonemes of their native language using the GraphoGame platform [Lyytinen et al., 2007, 2009]. Two sets of artificial letters were created out of six characters of the Latin alphabet (Swiss school font, Fig. 1A). Participants were randomly assigned to train one of these two sets of grapheme‐phoneme pairs, matched for visual and phonological complexity, using adaptive randomization to control for sex and to provide a balanced assignment to the two sets (set 1: n = 9, 5 males; set 2: n = 11, 6 males). All participants received the training one to five days before the EEG‐fMRI session (2.55 ± 1.28 days). During the training, participants were passively exposed to the graphemes of the untrained set, to control for visual familiarity (Supporting Information Fig. 2S).
Figure 1.
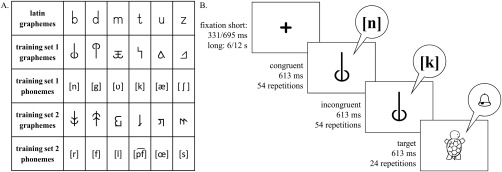
Artificial letter training and implicit audiovisual task. A. Two sets of false font characters were created based on letters of the Latin alphabet. During the artificial letter training participants learned one of the grapheme‐phoneme training sets, while the other set served as a control condition. B. Each trial of the implicit audiovisual task began with the presentation of a fixation cross for 331 or 695 ms followed by a stimulus or target presentation for 613 ms. After 15 trials, a long fixation period of 6 or 12 s was presented.
Participants were instructed to listen to a phoneme presented over headphones and select the correct false font character from a varying number of distractors ranging from one to three. At the beginning, each false font character was shortly introduced with its corresponding phoneme. All participants completed 131 test trials. To achieve successful learning, items with a high error rate were trained in additional trials (92.1 ± 41.8 trials; Supporting Information). Therefore, mean accuracy and training duration varied between participants and lower training duration indicated faster learning. To account for the varying number of distractors per trial, accuracy was calculated using a weighting factor consisting of the number of actually presented items proportional to the maximum possible number of presented items (Supporting Information). At the EEG‐fMRI session, trained correspondences were shortly repeated (4.97 ± 0.91 min) and accuracy was assessed for all grapheme‐phoneme correspondences.
Experimental Design
An audiovisual target detection task adapted from Kronschnabel et al., [2014] was conducted in four separate parts. The first part consisted of the six trained graphemes and phonemes. The second part comprised the control conditions, in which the unknown set of graphemes and phonemes was presented. Participants completed two additional parts including real letters and speech sounds, and digits and spoken number names respectively that will be described elsewhere. Five subjects repeated the second part in a separate session due to insufficient data quality in the first session. All stimuli were presented in an auditory and visual, and in a bimodal congruent and incongruent fashion, forming eight distinct conditions (four conditions for part one and two of the experiment).
Conditions were presented block‐wise using Presentation® software (Version 16.4, http://www.neurobs.com). Every run included 16 blocks (four blocks/condition). Within each block, 15 stimuli were presented randomly, while unimodal and bimodal blocks alternated pseudorandomly separated by fixation periods of 6 or 12 s. In order to ensure children's attention, they had to respond by button press to auditory, visual, and audiovisual targets (six targets/condition). The target was a drawing of an animal and a corresponding sound, presented either unimodally or bimodally. In total, 54 stimuli per condition were presented for 613 ms, each with an interstimulus interval of 331 or 695 ms (Fig. 1B). The total length of a block was 15.5 s resulting in duration of 375 s for each part.
Graphemes were presented via video goggles (VisuaStimDigital, Resonance Technology, Northridge, CA) in the centre of the field of view in black on a grey background (mean visual angle: 2.8° horizontally; 4.8° vertically). Phonemes were digitally recorded (sampling rate: 44.1 kHz; 32 bit) from a female speaker, normalized in Audacity® (± 1 dB), and presented binaural over in‐ear headphones (MR confon GmbH, Magdeburg). Precautions were taken to protect hearing and to ensure high quality auditory stimulation. To reduce acoustic noise of the MRI, a SofTone factor was implemented in the sequence, a sound‐absorbing mat was installed in the MRI bore, and sound‐absorbing over‐ear headphones were additionally padded with foam material. Furthermore, sound volume was specifically adjusted for each participant and a custom‐made head pad for the EEG net was developed to ensure children's comfort and to reduce head movement.
EEG Data Acquisition
Simultaneous EEG‐fMRI recordings were held on a Philips Achieva 3 Tesla scanner (Best, The Netherlands) using a 32‐element receive head coil and an MR‐compatible high‐density EEG system (Net Amps 400, 128‐channel EGI HydroCel Geodesic Sensor Net). The EEG data was sampled at 1 kHz using a DC‐filter with Cz as reference electrode and an electrode posterior to Cz as ground. To minimize gradient residuals, EEG data was synchronized to the MRI scanner clock and repetition time [Mandelkow et al., 2006]. Impedances were kept below 50 kΩ. EEG data was analyzed using Brain Vision Analyzer (Version: 2.0; Brainproducts GmbH, Munich, Germany). In order to correct for major artefacts, the EEG data was processed as follows: interpolation of channels with poor data quality (1.9 ± 1.5, range 0–5 channels), MR artefact removal using the average template subtraction method [Allen et al., 2000], ballistocardiogram correction using sliding average template subtraction, filtering at 0.1–30 Hz, 50 Hz noise removal (notch), downsampling to 500 Hz, correction of ocular (blinks, lateral and vertical eye movements) and residual ballistocardiogram artefacts using independent component analysis (ICA), and manual exclusion of remaining artefact segments. Furthermore, intervals with an amplitude below −200 µV and above 200 µV were excluded before epoching (−102 to 898 ms) and re‐referencing to the average reference [Lehmann and Skrandies, 1980]. Four separate condition averages were calculated for the bimodal congruent and incongruent conditions of the trained and untrained grapheme‐phoneme pairs, based on a minimum of 15 epochs per condition (40.81 ± 9.16 epochs).
MRI Data Acquisition
During each part of the experiment, we acquired 189 volumes using a T2*‐weighted whole‐brain gradient‐echo planar image sequence with the following parameters: slices/volume: 31, repetition time: 1.98 s, echo time: 30 ms, slice thickness: 3.5 mm, slice gap: 0.5 mm, flip angle: 80°, field of view: 240 × 240 mm2, in‐plane resolution: 3 × 3 mm2, SofTone factor: 3, sensitivity‐encoding (SENSE) reduction factor: 2.2. In addition, a field map and a high‐resolution T1‐weighted structural image were acquired for each participant to perform B0 field map correction and improve normalization respectively. SPM12 was used for preprocessing the fMRI data, including B0 field map correction, realignment and unwarping, slice time correction, coregistration and segmentation. Images were normalized to Montreal Neurological Institute (MNI) standard space using the deformations derived from the segmentation and a pediatric template created using the Template‐O‐Matic toolbox on average structural data with the age range 5.9–8.5 years [Wilke et al., 2008]. Voxels were resampled to 3 × 3 × 3 mm3 isotropic voxels and smoothed with a 6 mm full‐width‐half‐maximum Gaussian blurring kernel. Volumes with scan‐to‐scan motion over 1.5 mm/TR were repaired using linear interpolation between the nearest unrepaired scans as implemented in the ArtRepair toolbox [Mazaika et al., 2007]. Less than 3.5% of the scans were repaired per participant and overall motion (including individual peaks) did not exceed 5 mm. For one participant, the data of the last four blocks of the first part of the experiment were discarded due to excessive movement.
Statistical Analysis
Behavioural and training data
To evaluate the artificial letter training, the mean accuracy and training duration of the training session were calculated. The mean accuracy reflected the learning achievement of the subjects, while training duration was used to quantify their learning rate. In order to identify links between training performance and behavioural data, two‐tailed Pearson's correlation coefficients were calculated. Performance in the target detection task was inspected by calculating mean reaction times and accuracy scores for each part of the experiment. Task performance of the two parts of the experiment was compared with a two‐tailed paired sample t‐test using a 95% confidence interval.
EEG data
Topographic analysis of variance (TANOVA) on individual mean event‐related potential (ERP) data was performed using MATLAB functions (R2012b, MathWorks, Natick, MA) and used to identify differences in potential field map topography and strength between the congruency effects (congruent vs. incongruent) of trained and untrained grapheme‐phoneme pairs. In addition, adaptive segmentation was performed [Brandeis and Lehmann, 1986] and based on the global field power (GFP) of the mean ERPs over all conditions, four distinct peaks were identified (at 140, 222, 352, and 674 ms). Time windows were defined ±30 ms around the peaks (S1: 110–170 ms, S2: 192–252 ms, S4: 321–381 ms, and S6: 644–704 ms). Because the third peak (352 ms) was a component of longer duration, two additional time windows of 60 ms were added before (S3: 260–320 ms) and after (S5: 382–442 ms) S4, resulting in six distinct time windows used for further analysis (Fig. 2A).
Figure 2.
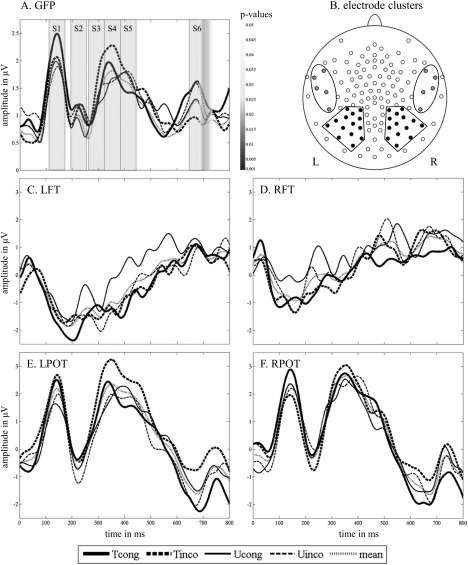
EEG data. A. GFP of the four audiovisual conditions and mean GFP curve. Grey bars indicate the analyzed time segments (S1: 110‐170 ms, S2: 192‐252 ms, S3: 260‐320 ms, S4: 321‐381 ms, S5: 382‐442 ms, and S6: 644‐704 ms). Greyscale bar shows the significant time window of the TANOVA on the congruency effect difference between trained and untrained grapheme‐phoneme pairs. B. 128‐channel map. The illustrated frontotemporal (FT) and parietooccipitotemporal (POT) electrode clusters, marked in grey and black respectively, were used in the ERP analyses. C. ERP curves of the four audiovisual conditions and their mean over the left frontotemporal electrode cluster (LFT). D. ERP curves of the four audiovisual conditions and their mean over the right frontotemporal electrode cluster (RFT). E. ERP curves of the four audiovisual conditions and their mean over the left parietooccipitotemporal electrode cluster (LPOT). F. ERP curves of the four audiovisual conditions and their mean over the right parietooccipitotemporal electrode cluster (RPOT).
Two bilateral electrode clusters were defined over parietooccipitotemporal (POT) electrodes and frontotemporal electrodes of the left and right hemisphere (Fig. 2B, Supporting Information Fig. 3S). Mean amplitude values of bilateral clusters were calculated for each condition and time window (Fig. 2C–F) and analyzed with SAS 9.4 (SAS Institute, Cary NC) using a linear mixed model (LMM) with the fixed factors hemisphere (left vs. right), condition (trained vs. untrained), and congruency (incongruent vs. congruent) and including the random intercept of each subject. Standardized residuals were calculated separately for each time window and values below −3 and above 3 were identified as outliers and excluded from further analysis [Osborne and Overbay, 2004; Roth et al., 2007]. To ensure that the assumptions of normality and homoscedasticity were met, inspection of QQ‐plots and predicted versus residual plots were undertaken respectively. For significant interactions, post hoc t‐tests were conducted. P‐values corrected for multiple comparisons using the Tukey‐Kramer method are marked respectively (Pcor). Finally, two‐tailed Pearson correlations were calculated to test whether mean amplitudes of electrode clusters were related to training measures and familial risk for dyslexia. Results are reported and considered significant if the criterion of P < 0.05 was met.
fMRI data
A random‐effect generalized linear model (GLM) was calculated with six predictors (auditory, visual, congruent, incongruent, target, and response) and six movement parameters for each participant and each part of the experiment (trained and untrained grapheme‐phonemes). In order to investigate the audiovisual integration effects after the short artificial grapheme‐phoneme training the analysis was restricted to the following four audiovisual conditions: trained congruent (Tcong), trained incongruent (Tinco), untrained congruent (Ucong), and untrained incongruent (Uinco). A 2 × 2 analysis of variance (ANOVA) was calculated to investigate the interaction of the factors condition (trained vs. untrained) and congruency (incongruent vs. congruent). To further analyze congruency effects of the trained grapheme‐phoneme pairs, a whole‐brain random effects analysis was performed using a one‐way ANOVA with four separate regressors (Tcong, Tinco, Ucong, and Uinco; P < 0.001, uncorrected). To examine whether audiovisual integration depended on the learning rate of the artificial letter training, multiple regressions of 2nd level contrasts and the training duration were performed. Additional multiple regressions were calculated in order to clarify the link between significant ERP mean value differences and the BOLD responses. For multiple regressions we used a cluster‐based family‐wise error corrected (FWE‐corr) threshold of P < 0.05 (on a voxel‐wise uncorrected threshold of P < 0.001).
RESULTS
Artificial Letter Training
The overall learning achievement (weighted accuracy: 79.9 ± 10.6%, range: 58–94%; unweighted accuracy: 83.5 ± 8.5%, range: 64–95%) and learning rate (training duration: 18.96 ± 4.95 min; range: 9.45–29.52 min) during the artificial letter training session varied between participants. However, participants who struggled to achieve a high accuracy completed additional training trials to successfully learn the grapheme‐phoneme correspondences. This resulted in a mean weighted accuracy of 71.7 ± 17.6% (range: 36–92%; unweighted accuracy: 78 ± 13.3%, range: 50–93%) at the last unit of the training session and a mean weighted accuracy of 79.1 ± 16.7% (range: 42–100%; unweighted accuracy: 83.8 ± 13.1, range: 54–100%) in the training at the beginning of the neuroimaging session.
Individual learning achievement correlated positively with the phonological awareness skills of rhyming (r = 0.51, P = 0.023) and phoneme categorization (r = 0.58, P = 0.008; Fig. 3). Moreover, learning achievement correlated positively with letter‐speech sound knowledge of upper case (r = 0.56, P = 0.01) and lower case letters (r = 0.53, P = 0.017; Fig. 3). In addition, learning rate correlated negatively with RAN (r = −0.56, P = 0.009; Fig. 3), meaning that faster learners showed better RAN performance. Finally, higher learning achievement was significantly related to faster learning rates (r = −0.45, P = 0.048; Fig. 3).
Figure 3.
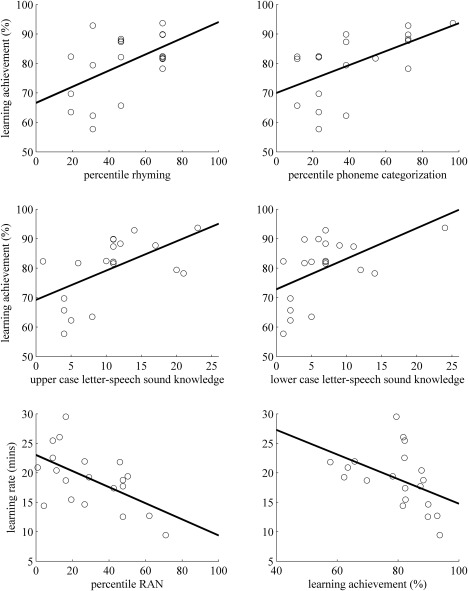
Correlations of behavioural skills with training measures. Learning achievement expressed as the mean weighted accuracy (percentage) during the training correlated positively with the achieved percentile in rhyming, in phoneme categorization, and with letter speech‐sound knowledge of upper and lower case letters (number of correctly pronounced letters). The learning rate expressed as the training duration in minutes correlated negatively with the achieved percentile of RAN and with learning achievement.
Task Performance
Performance during the audiovisual target detection task was recorded to ensure children's attention on the presented stimuli during the EEG‐fMRI session. Performance analysis revealed a mean accuracy of 92.7 ± 9.8% (reaction time: 712 ± 136 ms) in the part including the trained grapheme‐phoneme pairs, 90.4 ± 12% (reaction time: 701 ± 127 ms) in the control condition part, and no significant difference in accuracy between the two parts of the experiment (trained vs. untrained false font characters; P = 0.31). Due to technical reasons, responses were not logged during the trained condition for two subjects and during the control condition for one subject and are thus not included in task performance analysis.
EEG Results
For the mean amplitude values of the parietoocciptotemporal (POT) clusters of S1 (110–170 ms), the LMM with fixed factors hemisphere, condition, and congruency showed no significant effect. For the mean amplitude values of the frontotemporal clusters of the S2 (192–252 ms), the same LMM revealed a significant main effect of hemisphere with a stronger negativity for the left compared to the right hemisphere [F(1,132) = 11.38, P = 0.001]. Computing the LMM with the mean amplitudes of the POT clusters of S3 (260–320 ms) resulted in a significant main effect of hemisphere with a stronger positivity for the right compared to the left hemisphere [F(1,133) = 4.18, P = 0.043], while mean amplitudes of the POT clusters of S4 (321–381 ms) revealed a significant main effect of condition with a stronger positivity for trained compared to untrained grapheme‐phoneme pairs [F(1,130) = 7.43, P = 0.007].
For the time window following the peak of the long positive deflection (S5: 382–442 ms), the amplitude of the POT clusters revealed a significant interaction of hemisphere, condition, and congruency [F(1,132) = 5.80, P = 0.017]. Post hoc t‐tests showed a significantly stronger left lateralized positivity for Tinco (trained incongruent) than for Tcong [trained congruent; t(132) = 2.24, P = 0.027] and for Tinco compared to Uinco [untrained incongruent; t(132) = 2.09, P = 0.039]. Further post hoc t‐tests revealed that this left lateralized positivity was significantly stronger for the incongruency effect of trained (Tinco‐Tcong) in comparison to the incongruency effect of untrained pairs [Uinco‐Ucong; t(57) = 2.74, Pcor = 0.04; Fig. 4]. This difference between the incongruency effects of the trained and untrained grapheme‐phoneme pairs was significantly stronger over the left hemisphere [t(19) = 2.7, P = 0.015].
Figure 4.
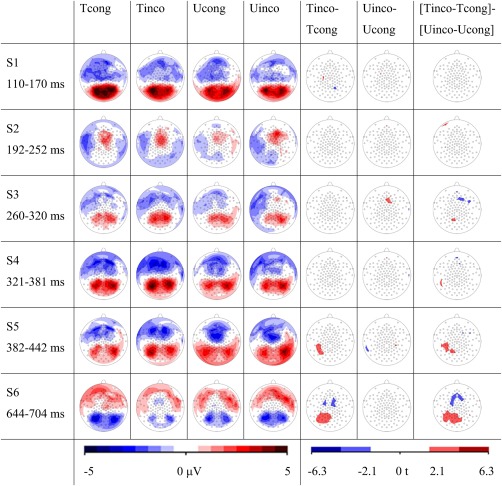
EEG results. The first four columns illustrate ERP potential field maps of the six time windows S1‐S6 for the four audiovisual conditions. The following two columns present the statistical t‐maps of the incongruency effects for the trained and untrained grapheme‐phoneme pairs. In the last column the statistical t‐maps of the differences between the incongruency effects of trained vs untrained items are shown. Statistical t‐maps illustrate electrodes with a significant difference at P < 0.05.
To examine whether amplitude differences during S5 were linked to the learning achievement, learning rate, and familial risk of the subjects, correlations were calculated. The individual learning achievement during the training session correlated positively with the difference of the mean amplitudes between the incongruency effects of the trained and untrained grapheme‐phoneme pairs ([Tinco‐Tcong]‐[Uinco‐Ucong]) over the left (r = 0.57, P = 0.009; Fig. 5) but not the right POT cluster. Therefore, higher learning achievement was significantly related to a stronger left–lateralized incongruency effect reflecting enhanced amplitude values for Tinco during S5. In addition, the same amplitude difference correlated with the maximum parental ARHQ score negatively over the left (r = −0.49, P = 0.028) but not over the right POT cluster. Hence, a reduced familial risk for dyslexia was significantly related to the intensity of this left lateralized positivity induced by the enhanced amplitude of Tinco. Correlating familial risk and learning achievement did not reveal any significant relation, meaning that the two measures contributed independently to the extent of audiovisual integration reflected by the incongruency effect of the left POT positivity.
Figure 5.
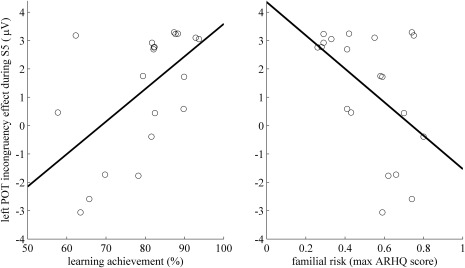
Correlations of EEG data and training measures. The difference of the mean amplitudes between the incongruency effects ([Tinco‐Tong]‐[Uinco‐Ucong]) over the left POT cluster during S5 correlated positively with learning achievement (weighted training accuracy) and negatively with familial risk (maximum parental ARHQ score).
Finally, the LMM with fixed factors hemisphere, condition, and congruency revealed a significant interaction of condition and congruency for the POT clusters of the late negativity (S6: 644–704 ms) [F(1,133) = 9.26, P = 0.003]. This interaction is evident in the corresponding t‐maps in Figure 4 and by the significant interval of the TANOVA in Figure 2A. Post hoc paired t‐tests revealed a reduced late negativity for Tinco in comparison to Tcong [t(133) = 3.21, Pcor = 0.009] and Tinco in comparison to Uinco [t(133) = 2.69, Pcor = 0.039]. Therefore, this late negative electrophysiological response was significantly reduced for incongruent trained grapheme‐phoneme correspondences. No significant correlations of training measures or familial risk with amplitude differences were found for S6.
In summary, the EEG analysis revealed distinct electrophysiological responses to trained compared to untrained grapheme‐phoneme pairs after 380 ms. During incongruent presentation of trained pairs, statistical analyses over the POT electrode clusters revealed an increased positivity around 400 ms (S5) and a decreased negativity around 650 ms (S6), signalling enhanced audiovisual integration over the left hemisphere. The modulation of the incongruency effect during S5 by learning achievement and familial risk for dyslexia reinforced the reported sensitivity of this ERP component in detecting audiovisual mismatch. Further analyses of additional time windows are reported in the Supporting Information.
fMRI Results
The whole‐brain voxel‐wise 2x2 ANOVA with within subject factors condition and congruency revealed a significant main effect of condition in the left inferior frontal gyrus (Table 2) but no region showed a congruency effect at the predefined significance level (P < 0.001, k ≥ 10). A significant interaction of condition and congruency was found in the right inferior temporal/fusiform gyrus and the right precuneus (Table 2). Of note, a similar activation was also detected in the left inferior temporal gyrus (ITG), however, with a cluster size slightly below the reported minimal activations (k = 9). Testing for the single regressors of the ANOVA against rest revealed significant activation patterns for all audiovisual conditions (Tcong, Tinco, Ucong, and Uinco) bilaterally in the STG and in the middle and inferior occipital gyrus. For Tcong and Ucong an additional activation was found in the right superior parietal lobule (Supporting Information Table 1S, Supporting Information Fig. 4S).
Table 2.
Statistics of fMRI analyses
| Brain area | Hemisphere | MNI coordinates | Voxels | T‐value | P‐value | ||
|---|---|---|---|---|---|---|---|
| x | y | z | |||||
| A. Main effect of condition | |||||||
| Inferior frontal gyrus | Left | −38 | 39 | −3 | 12 | −4.06 | <0.001 |
| B. Interaction condition x congruency | |||||||
| ITG/fusiform gyrus | Right | 43 | −12 | −27 | 12 | 4.14 | <0.001 |
| Precuneus | Right | 4 | −48 | 81 | 39 | 4.31 | <0.001 |
| C. Tcong vs Tinco | |||||||
| Insula | Right | 34 | −18 | 21 | 14 | 3.67 | <0.001 |
| Mid cingulate gyrus | Right | 4 | 0 | 27 | 10 | 3.93 | <0.001 |
| Precentral gyrus | Right | 37 | −24 | 54 | 12 | 3.59 | <0.001 |
| D. Tinco vs Tcong | |||||||
| ITG/fusiform gyrus | Right | 40 | −12 | −27 | 10 | 4.02 | <0.001 |
| E. Multiple regression: congruency effect difference and learning rate | |||||||
| ITG/fusiform gyrus | Left | −38 | −30 | −24 | 88 | −6.31 | 0.001* |
| STG/MTG | Right | 64 | −48 | 9 | 113 | −5.96 | <0.001* |
| Postcentral gyrus | Right | 13 | −42 | 69 | 335 | −6.04 | <0.001* |
| Left | −59 | −12 | 45 | 42 | −5.79 | 0.041* | |
| −5 | −33 | 81 | 64 | −5.01 | 0.005* | ||
| Suppl. motor area | Bilateral | 1 | −27 | 54 | 76 | −4.87 | 0.002* |
| F. Multiple regression: congruency effect difference and phonological awareness | |||||||
| STG | Left | −59 | −51 | 15 | 57 | 5.61 | 0.012* |
| G. Multiple regression: congruency effect difference and S6 amplitude | |||||||
| Lingual/fusiform gyrus | Left | −20 | −87 | −24 | 74 | 6.38 | 0.003* |
| Cuneus | Bilateral | 19 | −69 | 27 | 92 | 6.07 | 0.001* |
Voxel‐wise uncorrected threshold of P < 0.001, k ≥ 10.
*Cluster level FWE corrected P < 0.05.
In order to examine congruency related activation differences after the artificial letter training, the conditions were contrasted in a one way‐ANOVA. For Tcong compared to Tinco, participants showed a significantly stronger activation in the right insula, the right precentral and mid cingulate gyri. Contrasting Tinco against Tcong revealed an enhanced activation in the right inferior temporal/fusiform brain areas (Table 2). The activated cluster in the right inferior temporal/fusiform gyrus overlapped with the interaction effect (condition x congruency) found in the 2x2 ANOVA reported above. Post hoc t‐tests clarified the interaction in the right inferior temporal/fusiform gyrus by showing significantly stronger activation for Tinco compared to Tcong [t (19) = 3.4, P = 0.003], Ucong [t (19) = 2.2, P = 0.042], and Uinco [t (19) = 3.6, P = 0.002; Fig. 6A].
Figure 6.
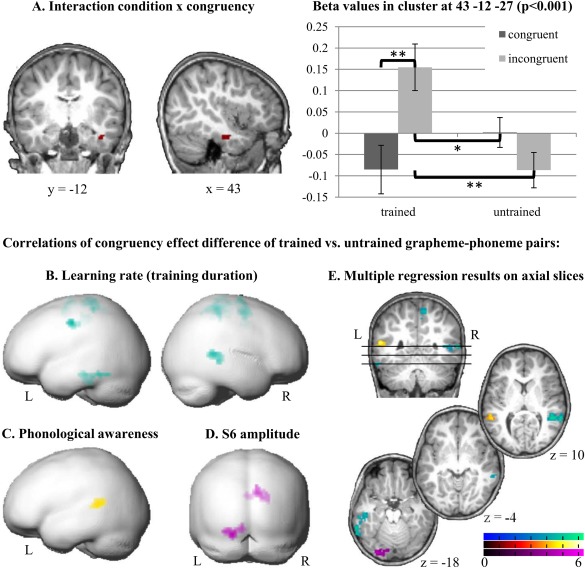
fMRI results. A. Interaction of congruency and condition in the right ITG. Activation in this region was significantly stronger for Tinco compared to Tcong, Ucong, and Uinco (P < 0.001 uncorrected). Error bars illustrate standard error of the mean. B–D. Individual BOLD contrast differences (congruency effect of trained vs. untrained grapheme‐phoneme pairs) correlated negatively with training duration (learning rate defined as faster learning) in the left ITG extending to the fusiform gyrus and the right STG/MTG (B), positively with phonological awareness in the left STG (C), and positively with the mean amplitude value of the incongruency effect over the left parietotemporal cluster of the late negativity (S6) ERP component (D). Multiple regressions are illustrated on the rendered surface of a pediatric brain template (Wilke and Holland, 2003; P < 0.001 uncorrected; cluster level FWE corrected P < 0.05). E. Brain regions showing a significant multiple regression with learning rate (cyan), phonological awareness (yellow), and S6 ERP amplitude (purple) are projected onto a pediatric structural T1 image normalized to MNI space (P < 0.001 uncorrected; cluster level FWE corrected P < 0.05).
The multiple regression of the congruency effect difference of the trained (Tcong‐Tinco) and untrained (Ucong‐Uinco) grapheme‐phoneme pairs and the learning rate during the training revealed significant negative correlations in the right STG, in a cluster extending from the left fusiform gyrus and the ITG to the middle temporal gyrus (MTG), and bilaterally in the postcentral gyrus and the supplementary motor area (Table 2; Fig. 6B,E). Therefore, shorter training duration reflecting faster learning was related to larger congruency effects in these brain regions. Additionally, a larger congruency effect difference between trained and untrained grapheme‐phoneme pairs in the left STG was significantly related to higher phonological awareness skills (Table 2; Fig. 6C,E). The analysis did not reveal any significant relation of audiovisual integration and familial risk.
EEG‐fMRI Correlations
In a further multiple regression, BOLD responses were correlated with individual mean amplitude values of the left POT cluster of the S5 and S6 ERP components. No significant correlation was found for the S5 ERP component. The mean amplitude values of the incongruency effect [Tinco‐Tcong] in S6 were significantly related to the difference [Tcong‐Tinco]‐[Ucong‐Uinco] of the BOLD responses bilaterally in the cuneus and in a left occipital cluster including parts of the lingual and fusiform gyrus (P < 0.001 uncorrected; cluster level corrected P < 0.05; Table 2; Fig. 6D,E). For trained pairs, larger congruency differences in late negativity amplitudes were associated with enhanced BOLD responses for congruent information and reduced BOLD responses for incongruent information in these regions. Note that the mean amplitude values of the incongruency effect in S6 also correlated positively with the BOLD difference [Tcong‐Tinco] within the same regions.
DISCUSSION
Within a single experimental session, we simulated the process of learning letter‐speech sound correspondences aiming to track the emergence of neural networks specialized to integrate multisensory linguistic information. Using an implicit audiovisual target detection task during simultaneous EEG‐fMRI recordings, we showed that prereading children exhibit audiovisual integration in the form of distinct neurophysiological and hemodynamic responses to congruent and incongruent trained grapheme‐phoneme pairs after less than half an hour of training. Importantly, the degree of this audiovisual integration not only depended on the familial risk for dyslexia and the phonological awareness of the preschoolers, but ultimately on the learning achievement and learning rate during the training.
Learning Rate Modulates Audiovisual Integration
The adaptive nature of the artificial, computerized training allowed for quantifying the individual grapheme‐phoneme learning rates of the participants. This learning rate modulated the level of audiovisual integration on a neurobiological level. A higher learning rate (faster learning) resulted in more pronounced congruency effects in the left ITG including anterior portions of the fusiform gyrus, right STG, bilateral supplementary motor area, and postcentral gyri. Previous studies have shown that the sensitivity to print of the left posterior temporo‐occipital visual word form system increases in preschoolers after grapheme‐phoneme correspondence, sensorimotor or writing training [Brem et al., 2010; James, 2010; Kersey and James, 2013]. In skilled readers, letter‐selective activations have been typically reported in anterior or lateral regions of the left fusiform gyrus in adults [Dehaene et al., 2005; Flowers et al., 2004; Thesen et al., 2012] and were correlated with reading accuracy in children [Blau et al., 2010]. Given that the left inferotemporal cortex is known for its involvement in grapho‐phonological processing [Kronschnabel et al., 2014; Price and Devlin, 2011], our findings of audiovisual congruency effects in this region argue for successful grapheme‐phoneme correspondence learning in prereading children and suggest a rapidly emerging interaction of areas processing visual (fusiform gyrus) and auditory (STG) linguistic information.
Considering the critical role of the STG in the integration of letters and speech sounds in both hemispheres of adults and children [Blau et al., 2009, 2010; Hashimoto and Sakai, 2004; van Atteveldt et al., 2004], the finding of decreased right STG/MTG activation in poor learners indicates that prereaders struggling to learn grapheme‐phoneme correspondences show deficient integration of audiovisual information. There is ample evidence for a diminished lateralization of language processing to the dominant left hemisphere in young children [Holland et al., 2001; Parviainen et al., 2011; Szaflarski et al., 2006], which seems to depend on the degree of specialization in phoneme perception [Conant, et al., 2014]. On the other hand, it has also been reported that the spoken language network in the posterior superior temporal regions is already left lateralized in prereaders [Monzalvo and Dehaene‐Lambertz, 2013]. Although left‐hemispheric specialization for speech might be advanced in prereaders, the neural mechanisms involved in audiovisual integration show no clear lateralization while neural refinement in the right STG/MTG apparently depends on the ability to learn grapheme‐phoneme correspondences.
Along with age, the heightened dyslexia risk of the children could also explain why the grapheme‐phoneme learning rate modulated the audiovisual STG/MTG activation predominantly in the right hemisphere. Dyslexic subjects show an enhanced involvement of the right hemisphere in language processing [Habib, 2000; Kast et al., 2011; Pekkola et al., 2006]. A recent study demonstrated that only adults with dyslexia but not normal readers seem to employ both the left as well as the right STG for phoneme discrimination [Boets et al., 2013]. The engagement of the right STG could thus reflect either beginning compensatory mechanisms or an altered processing strategy in at‐risk children with high learning rates. Alternatively, reduced gray matter volume in the right STG has been reported as a neuroanatomical precursor for developing reading problems [Richlan et al., 2013] and as a risk factor reflecting increased maternal history of reading disability [Black et al., 2012]. Therefore, the hypoactivation seen in the right STG in prereading children with low learning rates could also be explained by risk‐related neuroanatomical anomalies [Im et al., 2016] affecting learning.
Audiovisual Integration of Trained Grapheme‐Phoneme Correspondences
Incongruency of the trained audiovisual information triggered a significantly weaker late electrophysiological response over posterior regions than untrained audiovisual stimuli. In previous studies, a late ERP around 600–750 ms showed differential processing for unexpected deviant as compared to standard crossmodal stimulation in children [Froyen et al., 2009; Moll et al., 2016; Žarić et al., 2014, 2015]. This differential late frontocentral negativity was enhanced for deviant (incongruent) stimuli expressing the impact of letters on speech sound processing and thus implying a delayed integration of grapheme‐phoneme pairs in beginning as compared to experienced adult readers [Froyen et al., 2009]. Our reduced posterior negative and enhanced frontocentral negative ERP response for incongruent compared to congruent trained pairs after 600 ms is in line with these results. Moreover, we show that the late, differential, frontocentral negativity reflecting audiovisual integration processes is evident after a short grapheme‐phoneme correspondence training in prereading children.
The interrelation of the differential late negativity effect over the left POT scalp with parts of the left posterior fusiform and lingual gyrus suggests that this ERP component is at least partly driven by recurring visual processing and is reduced by incongruent auditory information. The concurrent activation of the bilateral cuneus finally corroborates the implication that the children noticed the mismatch of the auditory and visual information because the cuneus is active in the visual imagery of letters [James and Gauthier, 2006]. Of note, cortical thickness measures of regions processing low‐level sensory information in the prereading stage, including the lingual gyrus, have been reported to index reading acquisition success later on [Clark et al., 2014]. While our data suggest that this posterior region of the cortex is involved in integrating and matching audiovisual information, it needs to be clarified whether potential alterations in the microstructure of this region may impair the process of learning grapheme‐phoneme correspondences in prereaders with poor reading outcome.
Along with the above mentioned incongruency effects in the ERPs, parts of the right fusiform gyrus and ITG showed enhanced activation when processing incongruent audiovisual information for the trained pairs only. The right ITG has been identified as a source of the auditory mismatch negativity and therefore seems to be involved in sound discrimination [Waberski et al., 2001]. In addition, stronger activations for incongruent than congruent stimulation have been previously reported in experiments involving audiovisual congruency matching of vowels, suggesting that dyslexic readers show an increased demand for extracting information from both modalities during audiovisual integration [Pekkola et al., 2006]. The participants of the present study might have engaged such compensatory strategies, reflected by the reported incongruency effect, because grapheme‐phoneme correspondence training was too short for fully automatized audiovisual processing.
The enhanced POT positivity in the ERP after 380 ms for incongruent compared to congruent trained grapheme‐phoneme pairs resembles the P400 reported in studies of multisensory integration. In accordance with the present data, multisensory integration was associated with an increased central positive deflection at around 400 ms for incongruent information [Liu et al., 2009]. The enhanced POT positivity can also be contemplated as a P300, which is commonly observed over centroparietal electrodes as a response to rare, unexpected stimuli and is modulated by attentional and perceptual variables [Duncan et al., 2009]. The present finding could therefore reflect the perception of audiovisual incongruency, requiring higher attentional demands. Importantly, the differential POT positivity for incongruent compared to congruent pairs over the left hemisphere was modulated by both the overall accuracy during the training session and the familial risk for dyslexia. Prereading children responded to incongruent information with an increased, posterior positivity over the left hemisphere as a function of their achievement in learning grapheme‐phoneme correspondences. A higher familial risk for dyslexia correlated with a diminished incongruency effect, while participants at a very high familial risk even showed a congruency effect. It remains to be investigated to what extent these learning and risk specific differences in initial audiovisual integration will impact children's success in reading acquisition.
The Role of Behavioural Precursors of Reading
Deficits in phonological awareness, RAN, and reduced letter knowledge have been reported as prominent precursors of future reading problems [Blaiklock, 2004; Elbro et al., 1998; Gallagher et al., 2000; Kirby et al., 2010; Landerl et al., 2013; Tilanus et al., 2013]. In line with these accounts, we showed that in prereading children differences in the learning achievement of grapheme‐phoneme correspondences are modulated by phonological awareness (rhyming and phoneme categorization) and letter knowledge. Moreover, individual learning rates during the artificial letter training also correlated with RAN, in that better naming skills were associated with faster learning. Therefore, the short artificial letter‐speech sound training might be a novel approach to identify children with future reading problems and in need for targeted support.
Behavioural measures in prereaders also correlated with the audiovisual congruency effect of the fMRI. The audiovisual integration of congruent compared to incongruent trained grapheme‐phoneme correspondences engaged parts of the left STG significantly stronger than untrained correspondences as a function of phonological awareness. The results are nicely in line with the findings of diminished neural responses in the left STG [Raschle et al., 2014] during phonological processing in children at risk for dyslexia. Considering the involvement of posterior STG in auditory speech perception [Bonte et al., 2016; Buchsbaum et al., 2001], the stronger STG activation for congruent pairs might reflect enhanced speech sound perception due to the concurrent presentation of the corresponding symbols. Grapheme‐phoneme mapping in alphabetic languages requires high phonological awareness skills leading to a developmental reorganization in the left STG, which in older children has been shown to be related to higher reading skills [Brennan et al., 2013]. At last, we provide neural evidence that success in learning grapheme‐phoneme correspondences and audiovisual integration processes in the left STG crucially depend on phonological awareness.
Limitations
Comparing the present at‐risk sample with a low‐risk sample for dyslexia would have allowed for more robust interpretations regarding the role of risk in neural initialization of audiovisual integration. It is likely that the discussed audiovisual integration effects would have been stronger within a low‐risk sample. Nevertheless, the present approach broaches the interesting issue of how differences in the ability to learn grapheme‐phoneme correspondences modulate audiovisual integration on a neurobiological level. The at‐risk sample showed a considerable range in successfully learning grapheme‐phoneme correspondences, which allowed for analyzing risk‐dependent fine‐grained developmental differences of audiovisual integration. However, the relatively small sample size used in this study in combination with a high number of variables limited the statistical power of the reported results. Small sample sizes represent an important limitation of contemporary neuroimaging studies [Button, et al., 2013] and in particular in pediatric studies with young children. Future research would thus benefit from thorough meta‐analyses and large‐scale multimodal neuroimaging studies.
Insights From a Multimodal Approach
Here, prereading children at risk for dyslexia were tested using a simultaneous EEG‐fMRI approach, which provided novel evidence on the timing and locus of initial grapheme‐phoneme integration. This very advantage also presents the challenge of integrating information measured on different time scales and spatial dimensions. Analyzing the simultaneously acquired data revealed that both modalities exhibited distinct neural responses to congruent and incongruent trained grapheme‐phoneme correspondences, which were modulated by individual learning rates in the fMRI and by learning achievement in the EEG. While the fMRI data revealed both congruency and incongruency effects, the EEG data were characterized by a clear left lateralized sensitivity for incongruent information after 380 ms. Electrophysiological responses after 640 ms were significantly related to BOLD responses in primary visual areas and in the left posterior fusiform and lingual gyrus. Therefore, the multimodal approach allowed for inferring that the late‐occurring detection of audiovisual mismatch [Froyen et al., 2009; Moll et al., 2016; Žarić et al., 2014, 2015] is presumably driven by recurring visual imagery of graphemes [James and Gauthier, 2006]. Although the two modalities showed important differential effects, their integration enabled a unique extension of hitherto existing knowledge on initializing audiovisual integration in prereaders regarding space and time.
CONCLUSION
In summary, prereading children successfully learn and integrate a restricted set of artificial grapheme‐phoneme correspondences in less than 30 minutes. Alterations in brain responses to the learned pairs point to changes in temporal and occipital brain regions, known to be critically involved in audiovisual integration. The electrophysiological data provide additional insight into the time course of audiovisual integration at this early learning stage, whereby most pronounced differences in processing matching and non‐matching audiovisual pairs started after around 380 ms. Importantly, differences in the ability to learn grapheme‐phoneme correspondences and phonological awareness modulated the audiovisual integration in superior and inferior temporal brain regions. These findings suggest a new approach to identify children struggling to learn grapheme‐phoneme correspondences by showing initially diminished neural responses in brain networks that will be crucial in later letter‐speech sound integration and may ultimately impair the process of learning to read.
Supporting information
Supporting Information
Supporting Information Table 1.
ACKNOWLEDGMENTS
We thank all families and their children for participating in this study. In addition, we thank Anina Baur, Christian Brauchli, Margot Raith, Alexander Roth, and Maya Schneebeli for their respective contributions to recruitment, behavioural assessments, EEG‐MRI recordings, and statistical analyses. We are grateful to Ulla Richardson and Iivo Kapanen (University of Jyväskylä, Finland) for their support in developing, programming and implementing the artificial letter training.
REFERENCES
- Allen PJ, Josephs O, Turner R (2000): A method for removing imaging artifact from continuous EEG recorded during functional MRI. Neuroimage 12:230–239. [DOI] [PubMed] [Google Scholar]
- Aravena S, Snellings P, Tijms J, van der Molen MW (2013): A lab‐controlled simulation of a letter–speech sound binding deficit in dyslexia. J Exp Child Psychol 115:691–707. [DOI] [PubMed] [Google Scholar]
- Bach S, Richardson U, Brandeis D, Martin E, Brem S (2013): Print‐specific multimodal brain activation in kindergarten improves prediction of reading skills in second grade. Neuroimage 82:605–615. [DOI] [PubMed] [Google Scholar]
- Black JM, Tanaka H, Stanley L, Nagamine M, Zakerani N, Thurston A, Kesler S, Hulme C, Lyytinen H, Glover GH, Serrone C, Raman MM, Reiss AL, Hoeft F (2012): Maternal history of reading difficulty is associated with reduced language‐related gray matter in beginning readers. Neuroimage 59:3021–3032. [DOI] [PMC free article] [PubMed] [Google Scholar]
- Blaiklock KE (2004): The importance of letter knowledge in the relationship between phonological awareness and reading. J Res Reading 27:36–57. [Google Scholar]
- Blau V, van Atteveldt N, Ekkebus M, Goebel R, Blomert L (2009): Reduced Neural Integration of Letters and Speech Sounds Links Phonological and Reading Deficits in Adult Dyslexia. Curr Biol 19:503–508. [DOI] [PubMed] [Google Scholar]
- Blau V, Reithler J, van Atteveldt N, Seitz J, Gerretsen P, Goebel R, Blomert L (2010): Deviant processing of letters and speech sounds as proximate cause of reading failure: A functional magnetic resonance imaging study of dyslexic children. Brain 133:868–879. [DOI] [PubMed] [Google Scholar]
- Blomert L (2011): The neural signature of orthographic‐phonological binding in successful and failing reading development. Neuroimage 57:695–703. [DOI] [PubMed] [Google Scholar]
- Blomert L, Willems G (2010): Is there a causal link from a phonological awareness deficit to reading failure in children at familial risk for dyslexia? Dyslexia 16:300–317. [DOI] [PubMed] [Google Scholar]
- Boets B, de Beeck HPO, Vandermosten M, Scott SK, Gillebert CR, Mantini D, Bulthé J, Sunaert S, Wouters J, Ghesquière P (2013): Intact but less accessible phonetic representations in adults with dyslexia. Science 342:1251–1254. [DOI] [PMC free article] [PubMed] [Google Scholar]
- Bonte M, Ley A, Scharke W, Formisano E (2016): Developmental refinement of cortical systems for speech and voice processing. Neuroimage 128:373–384. [DOI] [PubMed] [Google Scholar]
- Brandeis D, Lehmann D (1986): Event‐related potentials of the brain and cognitive processes: Approaches and applications. Neuropsychologia 24:151–168. [DOI] [PubMed] [Google Scholar]
- Brem S, Bach S, Kucian K, Guttorm TK, Martin E, Lyytinen H, Brandeis D, Richardson U (2010): Brain sensitivity to print emerges when children learn letter–speech sound correspondences. Proc Natl Acad Sci U S A 107:7939–7944. [DOI] [PMC free article] [PubMed] [Google Scholar]
- Brem S, Bach S, Kujala JV, Maurer U, Lyytinen H, Richardson U, Brandeis D (2013): An electrophysiological study of print processing in kindergarten: The contribution of the visual N1 as a predictor of reading outcome. Dev Neuropsychol 38:567–594. [DOI] [PubMed] [Google Scholar]
- Brennan C, Cao F, Pedroarena‐Leal N, McNorgan C, Booth JR (2013): Reading acquisition reorganizes the phonological awareness network only in alphabetic writing systems. Hum Brain Mapp 34:3354–3368. [DOI] [PMC free article] [PubMed] [Google Scholar]
- Buchsbaum BR, Hickok G, Humphries C (2001): Role of left posterior superior temporal gyrus in phonological processing for speech perception and production. Cogn Sci 25:663–678. [Google Scholar]
- Button KS, Ioannidis JP, Mokrysz C, Nosek BA, Flint J, Robinson ES, Munafò MR (2013): Power failure: Why small sample size undermines the reliability of neuroscience. Nat Rev Neurosci 14:365–376. [DOI] [PubMed] [Google Scholar]
- Clark KA, Helland T, Specht K, Narr KL, Manis FR, Toga AW, Hugdahl K (2014): Neuroanatomical precursors of dyslexia identified from pre‐reading through to age 11. Brain 137:3136–3141. [DOI] [PMC free article] [PubMed] [Google Scholar]
- Conant LL, Liebenthal E, Desai A, Binder JR (2014): FMRI of phonemic perception and its relationship to reading development in elementary‐to middle‐school‐age children. Neuroimage 89:192–202. [DOI] [PMC free article] [PubMed] [Google Scholar]
- Dehaene S, Cohen L, Sigman M, Vinckier F (2005): The neural code for written words: A proposal. Trend Cogn Sci 9:335–341. [DOI] [PubMed] [Google Scholar]
- Duncan CC, Barry RJ, Connolly JF, Fischer C, Michie PT, Näätänen R, Polich J, Reinvang I, Van Petten C (2009): Event‐related potentials in clinical research: Guidelines for eliciting, recording, and quantifying mismatch negativity, P300, and N400. Clin Neurophysiol 120:1883–1908. [DOI] [PubMed] [Google Scholar]
- Elben CE, Lohaus A. 2000. Marburger Sprachverständnistest für Kinder: MSVK. Göttingen: Hogrefe, Verlag für Psychologie. [Google Scholar]
- Elbro C, Borstrøm I, Petersen DK (1998): Predicting dyslexia from kindergarten: The importance of distinctness of phonological representations of lexical items. Reading Res Quarter 33:36–60. [Google Scholar]
- Flowers D, Jones K, Noble K, VanMeter J, Zeffiro T, Wood F, Eden G (2004): Attention to single letters activates left extrastriate cortex. Neuroimage 21:829–839. [DOI] [PubMed] [Google Scholar]
- Froyen D, Van Atteveldt N, Bonte M, Blomert L (2008): Cross‐modal enhancement of the MMN to speech‐sounds indicates early and automatic integration of letters and speech‐sounds. Neurosci Lett 430:23–28. [DOI] [PubMed] [Google Scholar]
- Froyen DJ, Bonte ML, van Atteveldt N, Blomert L (2009): The long road to automation: Neurocognitive development of letter–speech sound processing. J Cogn Neurosci 21:567–580. [DOI] [PubMed] [Google Scholar]
- Froyen D, Willems G, Blomert L (2011): Evidence for a specific cross‐modal association deficit in dyslexia: An electrophysiological study of letter–speech sound processing. Dev Sci 14:635–648. [DOI] [PubMed] [Google Scholar]
- Gallagher A, Frith U, Snowling MJ (2000): Precursors of literacy delay among children at genetic risk of dyslexia. J Child Psychol Psychiatry 41:203–213. [PubMed] [Google Scholar]
- Goswami U (2000): Phonological representations, reading development and dyslexia: Towards a cross‐linguistic theoretical framework. Dyslexia 6:133–151. [DOI] [PubMed] [Google Scholar]
- Guttorm TK, Leppänen PH, Poikkeus A‐M, Eklund KM, Lyytinen P, Lyytinen H (2005): Brain event‐related potentials (ERPs) measured at birth predict later language development in children with and without familial risk for dyslexia. Cortex 41:291–303. [DOI] [PubMed] [Google Scholar]
- Habib M (2000): The neurological basis of developmental dyslexia. Brain 123:2373–2399. [DOI] [PubMed] [Google Scholar]
- Hashimoto R, Sakai KL (2004): Learning letters in adulthood: Direct visualization of cortical plasticity for forming a new link between orthography and phonology. Neuron 42:311–322. [DOI] [PubMed] [Google Scholar]
- Hoeft F, Ueno T, Reiss AL, Meyler A, Whitfield‐Gabrieli S, Glover GH, Keller TA, Kobayashi N, Mazaika P, Jo B (2007): Prediction of children's reading skills using behavioral, functional, and structural neuroimaging measures. Behav Neurosci 121:602–613. [DOI] [PubMed] [Google Scholar]
- Holland SK, Plante E, Byars AW, Strawsburg RH, Schmithorst VJ, Ball WS (2001): Normal fMRI brain activation patterns in children performing a verb generation task. Neuroimage 14:837–843. [DOI] [PubMed] [Google Scholar]
- Holloway ID, van Atteveldt N, Blomert L, Ansari D (2015): Orthographic dependency in the neural correlates of reading: Evidence from audiovisual integration in english readers. Cereb Cortex 25:1544–1553. [DOI] [PubMed] [Google Scholar]
- Hulme C, Hatcher PJ, Nation K, Brown A, Adams J, Stuart G (2002): Phoneme awareness is a better predictor of early reading skill than onset‐rime awareness. J Exp Child Psychol 82:2–28. [DOI] [PubMed] [Google Scholar]
- Im K, Raschle NM, Smith SA, Grant PE, Gaab N (2016): Atypical sulcal pattern in children with developmental dyslexia and at‐risk kindergarteners. Cereb Cortex 26:1138–1148. [DOI] [PMC free article] [PubMed] [Google Scholar]
- James KH (2010): Sensori‐motor experience leads to changes in visual processing in the developing brain. Dev Sci 13:279–288. [DOI] [PMC free article] [PubMed] [Google Scholar]
- James KH, Gauthier I (2006): Letter processing automatically recruits a sensory–motor brain network. Neuropsychologia 44:2937–2949. [DOI] [PubMed] [Google Scholar]
- Kast M, Bezzola L, Jaencke L, Meyer M (2011): Multi‐ and unisensory decoding of words and nonwords result in differential brain responses in dyslexic and nondyslexic adults. Brain Lang 119:136–148. [DOI] [PubMed] [Google Scholar]
- Kersey AJ, James KH (2013): Brain activation patterns resulting from learning letter forms through active self‐production and passive observation in young children. Front Psychol 4: [DOI] [PMC free article] [PubMed] [Google Scholar]
- Kirby JR, Georgiou GK, Martinussen R, Parrila R (2010): Naming speed and reading: From prediction to instruction. Read Res Quarter 45:341–362. [Google Scholar]
- Kronschnabel J, Brem S, Maurer U, Brandeis D (2014): The level of audiovisual print—speech integration deficits in dyslexia. Neuropsychologia 62:245–261. [DOI] [PubMed] [Google Scholar]
- Landerl K, Ramus F, Moll K, Lyytinen H, Leppänen PH, Lohvansuu K, O'Donovan M, Williams J, Bartling J, Bruder J (2013): Predictors of developmental dyslexia in European orthographies with varying complexity. J Child Psychol Psychiatry 54:686–694. [DOI] [PubMed] [Google Scholar]
- Lefly DL, Pennington BF (2000): Reliability and validity of the adult reading history questionnaire. J Learn Disabil 33:286–296. [DOI] [PubMed] [Google Scholar]
- Lehmann D, Skrandies W (1980): Reference‐free identification of components of checkerboard‐evoked multichannel potential fields. Electroencephalogr Clin Neurophysiol 48:609–621. [DOI] [PubMed] [Google Scholar]
- Liu B, Wang Z, Jin Z (2009): The integration processing of the visual and auditory information in videos of real‐world events: An ERP study. Neurosci Lett 461:7–11. [DOI] [PubMed] [Google Scholar]
- Lyytinen H, Ronimus M, Alanko A, Poikkeus A‐M, Taanila M (2007): Early identification of dyslexia and the use of computer game‐based practice to support reading acquisition. Nordic Psychol 59:109–126. [Google Scholar]
- Lyytinen H, Erskine J, Kujala J, Ojanen E, Richardson U (2009): In search of a science‐based application: A learning tool for reading acquisition. Scand J Psychol 50:668–675. [DOI] [PubMed] [Google Scholar]
- Mandelkow H, Halder P, Boesiger P, Brandeis D (2006): Synchronization facilitates removal of MRI artefacts from concurrent EEG recordings and increases usable bandwidth. Neuroimage 32:1120–1126. [DOI] [PubMed] [Google Scholar]
- Maurer U, Bucher K, Brem S, Brandeis D (2003): Altered responses to tone and phoneme mismatch in kindergartners at familial dyslexia risk. Neuroreport 14:2245–2250. [DOI] [PubMed] [Google Scholar]
- Maurer U, Brem S, Bucher K, Kranz F, Benz R, Steinhausen H‐C, Brandeis D (2007): Impaired tuning of a fast occipito‐temporal response for print in dyslexic children learning to read. Brain 130:3200–3210. [DOI] [PubMed] [Google Scholar]
- Maurer U, Bucher K, Brem S, Benz R, Kranz F, Schulz E, van der Mark S, Steinhausen H‐C, Brandeis D (2009): Neurophysiology in preschool improves behavioral prediction of reading ability throughout primary school. Biol Psychiatry 66:341–348. [DOI] [PubMed] [Google Scholar]
- Mayer A. 2011. Test zur Erfassung der phonologischen Bewusstheit und der Benennungsgeschwindigkeit (TEPHOBE). München: Ernst Reinhardt Verlag. [Google Scholar]
- Mazaika P, Whitfield‐Gabrieli S, Reiss A, Glover G (2007): Artifact repair for fMRI data from high motion clinical subjects. Organization of Human Brain Mapping International Conference; Chicago, IL.
- Melby‐Lervåg M, Lyster S‐AH, Hulme C (2012): Phonological skills and their role in learning to read: A meta‐analytic review. Psychol Bull 138:322–352. [DOI] [PubMed] [Google Scholar]
- Moll K, Landerl K. 2014. Lese‐ und Rechtschreibtest (SLRT‐II). Weiterentwicklung des Salzburger Lese‐ und Rechtschreibtests (SLRT), 2., korrigierte Auflage mit erweiterten Normen. Bern: Verlag Hans Huber. [Google Scholar]
- Moll K, Hasko S, Groth K, Bartling J, Schulte‐Körne G (2016): Letter‐sound processing deficits in children with developmental dyslexia: An ERP study. Clin Neurophysiol 127:1989–2000. [DOI] [PubMed] [Google Scholar]
- Monzalvo K, Dehaene‐Lambertz G (2013): How reading acquisition changes children's spoken language network. Brain Lang 127:356–365. [DOI] [PubMed] [Google Scholar]
- Mulert C, Jäger L, Schmitt R, Bussfeld P, Pogarell O, Möller H‐J, Juckel G, Hegerl U (2004): Integration of fMRI and simultaneous EEG: Towards a comprehensive understanding of localization and time‐course of brain activity in target detection. Neuroimage 22:83–94. [DOI] [PubMed] [Google Scholar]
- Osborne JW, Overbay A (2004): The power of outliers (and why researchers should always check for them). Pract Assess, Res Eval 9:1–12. [Google Scholar]
- Parviainen T, Helenius P, Poskiparta E, Niemi P, Salmelin R (2011): Speech perception in the child brain: Cortical timing and its relevance to literacy acquisition. Hum Brain Mapp 32:2193–2206. [DOI] [PMC free article] [PubMed] [Google Scholar]
- Pekkola J, Laasonen M, Ojanen V, Autti T, Jaaskelainen IP, Kujala T, Sams M (2006): Perception of matching and conflicting audiovisual speech in dyslexic and fluent readers: An fMRI study at 3 T. Neuroimage 29:797–807. [DOI] [PubMed] [Google Scholar]
- Pennington BF, Lefly DL (2001): Early reading development in children at family risk for dyslexia. Child Dev 72:816–833. [DOI] [PubMed] [Google Scholar]
- Price CJ, Devlin JT (2011): The interactive account of ventral occipitotemporal contributions to reading. Trend Cogn Sci 15:246–253. [DOI] [PMC free article] [PubMed] [Google Scholar]
- Raij T, Uutela K, Hari R (2000): Audiovisual integration of letters in the human brain. Neuron 28:617–625. [DOI] [PubMed] [Google Scholar]
- Raschle NM, Zuk J, Gaab N (2012): Functional characteristics of developmental dyslexia in left‐hemispheric posterior brain regions predate reading onset. Proc Natl Acad Sci U S A 109:2156–2161. [DOI] [PMC free article] [PubMed] [Google Scholar]
- Raschle NM, Stering PL, Meissner SN, Gaab N (2014): Altered neuronal response during rapid auditory processing and its relation to phonological processing in prereading children at familial risk for dyslexia. Cereb Cortex 24:2489–2501. [DOI] [PMC free article] [PubMed] [Google Scholar]
- Richlan F, Kronbichler M, Wimmer H (2013): Structural abnormalities in the dyslexic brain: A meta‐analysis of voxel‐based morphometry studies. Hum Brain Mapp 34:3055–3065. [DOI] [PMC free article] [PubMed] [Google Scholar]
- Roth A, Roesch‐Ely D, Bender S, Weisbrod M, Kaiser S (2007): Increased event‐related potential latency and amplitude variability in schizophrenia detected through wavelet‐based single trial analysis. Int J Psychophysiol 66:244–254. [DOI] [PubMed] [Google Scholar]
- Scarborough HS (1990): Very early language deficits in dyslexic children. Child Dev 61:1728–1743. [PubMed] [Google Scholar]
- Share DL (1995): Phonological recoding and self‐teaching: Sine qua non of reading acquisition. Cognition 55:151–218. [DOI] [PubMed] [Google Scholar]
- Shaywitz SE, Shaywitz BA, Fletcher JM, Escobar MD (1990): Prevalence of reading disability in boys and girls: Results of the Connecticut longitudinal study. JAMA 264:998–1002. [PubMed] [Google Scholar]
- Shaywitz BA, Skudlarski P, Holahan JM, Marchione KE, Constable RT, Fulbright RK, Zelterman D, Lacadie C, Shaywitz SE (2007): Age‐related changes in reading systems of dyslexic children. Ann Neurol 61:363–370. [DOI] [PubMed] [Google Scholar]
- Snowling MJ (1980): The development of grapheme‐phoneme correspondence in normal and dyslexic readers. J Exp Child Psychol 29:294–305. [DOI] [PubMed] [Google Scholar]
- Snowling MJ, Gallagher A, Frith U (2003): Family risk of dyslexia is continuous: Individual differences in the precursors of reading skill. Child Dev 74:358–373. [DOI] [PubMed] [Google Scholar]
- Szaflarski JP, Holland SK, Schmithorst VJ, Byars AW (2006): fMRI study of language lateralization in children and adults. Hum Brain Mapp 27:202–212. [DOI] [PMC free article] [PubMed] [Google Scholar]
- Thesen T, McDonald CR, Carlson C, Doyle W, Cash S, Sherfey J, Felsovalyi O, Girard H, Barr W, Devinsky O (2012): Sequential then interactive processing of letters and words in the left fusiform gyrus. Nat Commun 3:1284. [DOI] [PMC free article] [PubMed] [Google Scholar]
- Tilanus EA, Segers E, Verhoeven L (2013): Diagnostic profiles of children with developmental dyslexia in a transparent orthography. Res Dev Disabil 34:4194–4202. [DOI] [PubMed] [Google Scholar]
- van Atteveldt N, Formisano E, Goebel R, Blomert L (2004): Integration of letters and speech sounds in the human brain. Neuron 43:271–282. [DOI] [PubMed] [Google Scholar]
- Waberski TD, Kreitschmann‐Andermahr I, Kawohl W, Darvas F, Ryang Y, Rodewald M, Gobbelé R, Buchner H (2001): Spatio‐temporal source imaging reveals subcomponents of the human auditory mismatch negativity in the cingulum and right inferior temporal gyrus. Neurosci Lett 308:107–110. [DOI] [PubMed] [Google Scholar]
- Wagner RK, Torgesen JK (1987): The nature of phonological processing and its causal role in the acquisition of reading skills. Psychol Bull 101:192–212. [Google Scholar]
- Wechsler D. 2011. Wechsler Intelligence Scale for Children (WISC‐IV). Frankfurt am Main: Pearson Assessment & Information GmbH. [Google Scholar]
- Widmann A, Schröger E, Tervaniemi M, Pakarinen S, Kujala T (2012): Mapping symbols to sounds: Electrophysiological correlates of the impaired reading process in dyslexia. Front Psychol 3:1–12. [DOI] [PMC free article] [PubMed] [Google Scholar]
- Wild N, Fleck C (2013): Neunormierung des Mottier‐Tests für 5‐bis 17‐jährige Kinder mit Deutsch als Erst‐oder als Zweitsprache. Praxis Sprache 3:152–158. [Google Scholar]
- Wilke M, Holland SK (2003): Variability of gray and white matter during normal development: A voxel‐based MRI analysis. Neuroreport 14:1887. [DOI] [PMC free article] [PubMed] [Google Scholar]
- Wilke M, Holland SK, Altaye M, Gaser C (2008): Template‐O‐Matic: A toolbox for creating customized pediatric templates. Neuroimage 41:903–913. [DOI] [PubMed] [Google Scholar]
- Žarić G, González GF, Tijms J, van der Molen MW, Blomert L, Bonte M (2014): Reduced neural integration of letters and speech sounds in dyslexic children scales with individual differences in reading fluency. PLoS ONE 9:e110337. [DOI] [PMC free article] [PubMed] [Google Scholar]
- Žarić G, González GF, Tijms J, van der Molen MW, Blomert L, Bonte M (2015): Crossmodal deficit in dyslexic children: Practice affects the neural timing of letter‐speech sound integration. Front Hum Neurosci 9:1–14. [DOI] [PMC free article] [PubMed] [Google Scholar]
- Ziegler JC, Goswami U (2005): Reading acquisition, developmental dyslexia, and skilled reading across languages: A psycholinguistic grain size theory. Psychol Bull 131:3–29. [DOI] [PubMed] [Google Scholar]
Associated Data
This section collects any data citations, data availability statements, or supplementary materials included in this article.
Supplementary Materials
Supporting Information
Supporting Information Table 1.