

Abstract
Clinical remission of depression may be associated with emotional residual symptoms. We studied the association of emotional blunting, rumination with neural networks dynamics in remitted depressed patients and cognitive performance during an N‐Back task. Twenty‐six outpatients in remission of depression (Hamilton Depressive rating scale score <7) performed an N‐Back task during fMRI assessment. All patients had been treated by paroxetine for a minimum of 4 months. Two subgroups of patients [Nonemotionally blunted (NEB) = 14 and emotionally blunted (EB) = 12] were determined. To identify functional network maps across participants, the Network Detection using Independent Component Analysis approach was employed. Within and between Task Positive Network (TPN) and Default Mode Network (DMN) connectivity were assessed and related to variability of performance on the N‐Back task and rumination. EB and NEB patients were not different for the level of accurate responses at the N‐Back. However over the entire working memory task, the negative correlation between DMN and TPN was significantly lower in the EB than NEB group and was differently related to cognitive performance and rumination. The stronger the negative correlation between DMN and TPN was, the less variable the reaction time during 3‐Back task in NEB patients. Moreover the greater the negative correlation between DMN and TPN was, the lower the rumination score in EB patients. Emotional blunting may be associated with compromised monitoring of rumination and cognitive functioning in remitted depressed patients through altered cooperation between DMN and TPN. The study suggests clinical remission in depression is associated with biological heterogeneity. Hum Brain Mapp 38:3491–3501, 2017. © 2017 Wiley Periodicals, Inc.
Keywords: depressive disorder, neural networks, fMRI, working memory, task performance
INTRODUCTION
Major depression is a highly prevalent and costly brain disorder [Kessler et al., National Comorbidity Survey Replication, 2003]. Although several treatments are available, only 40% of depressed patients receiving antidepressant or psychotherapy achieve remission with initial treatment [Rush et al., 2006]. Further the likelihood of remission after two or more therapeutic trials substantially decreased, suggesting than major depression may lead to symptomatic sequela [Gaynes et al., 2009]. Residual symptoms may be found in patients considered to be in clinical remission [Zimmerman et al., 2012], defined as a predetermined cut‐off score (<7) on the Hamilton Rating Scale for Depression. Among residual symptoms, emotional and cognitive impairments have a great clinical significance as they may predict functional impairment and depressive relapse [Sacchetti et al., 2015]. Remitted depressed patient frequently complain about emotional changes after recovery of depression [van Rijsbergen et al., 2015]. Emotional blunting, mainly characterized by emotional detachment and lack of emotional reactivity, is frequently observed in remitted patients and is related to both residual depression and antidepressant treatment [Price and Goodwin, 2009; Price et al., 2009]. Beyond the impact on emotional life and interpersonal relationships, emotional blunting may also influence cognitive performance such as attention and working memory (WM). Dubal and Jouvent [2009] showed that subjects with persistent blunted response to pleasant stimuli, displayed greater intrasubject variability on reaction time (RT) during a sustained attention task and developed a more conservative response strategy resulting from a rapid decrease in executive resources. The neural correlates of such cognitive impact of emotional residual depressed symptoms are not well understood.
According to recent model [Menon, 2011], major depression may be viewed as a disorder of the functional connectivity and dynamic of neural networks involved in allocation of attentional resources to the internal and external world. Among these networks the Task‐Positive Network (TPN), including lateral prefrontal cortex, parietal cortex and insula, supports WM and attention directed to the external world whereas the Default Mode Network (DMN), supports internal mental activity and attention directed toward the internal world. The DMN includes the posterior cingulate cortex (PCC), medial prefrontal cortex (mPFC), and inferior parietal cortex. Task positive and task negative networks act in concert and in opposition, as they have been shown to be anticorrelated during both cognitive tasks and during resting state. The quality of cooperation between the DMN and the Task Positive Network (TPN) may explain intrasubject variability in WM performance in healthy subjects [Kelly et al., 2008].
An over‐connectivity pattern across the TPN and the DMN also contributes to rumination in acute depressed patients [Lemogne et al., 2009; Sheline et al., 2009]. Moreover rumination is linked to an increased vulnerability for major depression through abnormal interactions between key nodes of both networks [Freton et al., 2014; Nejad et al., 2013].
Yet the temporal dynamics between the TPN and DMN remained to be assessed in remitted depression in relationship with residual symptoms and rumination.
The main goal of that study was to evaluate to what extent the relationship between emotional blunting as residual symptoms, rumination, and WM performance in remitted depressed patients relates to the cooperation of two neural networks involved in allocation of attentional resources.
Here, we assessed attention to the external world using a WM task, the N‐back task that has been classically used in behavioral and fMRI studies of acute and remitted depressed patients [Harvey et al., 2005; Walsh et al., 2007]. Widely used in several recent studies of psychiatric and neurological disorders, we used the intraindividual RT variability to provide useful information about cognitive functioning [Mac Donald et al., 2006].
Using independent component analyses (ICA), we assessed within and between connectivity of the TPN and DMN in remitted depressed patients with and without emotional blunting while performing the N‐back task. To control for treatment effect, all remitted patients were treated with the SSRI Paroxetine. We hypothesized that emotional blunting in remitted depressed patients would be associated with abnormal cooperation between the DMN and TPN hence producing greater intrasubject variability of performance on the N‐back task and different regulation of rumination.
MATERIALS AND METHODS
Participants
Twenty‐eight right‐handed outpatients, in full remission according to DSM IV criteria of Major Depressive Disorder (MDD), not fulfilling DSM‐IV‐TR (Diagnostic and Statistical Manual of Mental Disorders, 4th edition, Text Revision) criteria for current MDD and for a minimum of 2 months without significant symptoms of depression, were recruited by psychiatrists (one center located in Rio de Janeiro area, Brazil). The remitted MDD patients were all treated by paroxetine for a minimum of 4 months at an appropriate dose for depression (at least 20 mg/day), in clinical remission according to a score cut‐off of 7 in the Hamilton Depression Rating Scale (HAM‐D) 17 items total score [Hamilton, 1960], with a Hospital Anxiety Depression scale (HAD; Zigmond and Snaith, 1983) depression score <7 and HAD anxiety score <7. The remitted MDD patients were not selected if they had other concomitant psychiatric disorders (documented by the Mini International Neuropsychiatric Interview) or current neurological disorders, if they had other concomitant psychotropic medication than paroxetine, if they presented contraindications for MRI (mainly claustrophobia or metallic prosthesis), a current or recent history of alcohol abuse, substance abuse disorder or dependence, within 12 months prior to study entry or if they had uncontrolled organic diseases likely to interfere with the conduct of the study.
Two patients were excluded from the statistical analysis (one because of excessive head movements and one because of absence of recorded behavioral responses in the MRI scanner) leading to a final sample of 26 patients.
Two subgroups were determined by a standard question on emotional blunting “To what extent are you experiencing emotional effects of your antidepressant? Emotional effects are variable, but might include, for example, feeling emotionally “numbed” or “blunted” in some way/lacking positive emotions or negative emotions/feeling detached from the world around you/“just not caring' about things that you used to care about.”
Fourteen patients with a score of 1 (not at all) or 2 (insignificantly) were assigned to the nonemotionally blunted (NEB) group and 12 patients with a score of 4 (moderately) or 5 (severely) were assigned to the emotionally blunted (EB) group. Patients answering “mildly” (i.e., 3) on the standard question on emotional blunting were not included in the study.
This study was conducted in accordance with the principles of the Declaration of Helsinki. Approval was obtained from the Brazilian ethics committee for Biomedical Research of the Souza Marques medical school (Rio de Janeiro). Each participant gave his/her informed written consent before entering the study.
Clinical Assessments
Depression and anxiety residual symptoms were assessed using the Portuguese version of the HAD scale [Zigmond and Snaith, 1983]. Apathy was assessed using the Brazilian care‐giver version of the Apathy Scale [Starkstein et al., 1992] validated by Guimarães et al. [2009] and adapted to a self‐questionnaire. Participants also fulfilled the Portuguese version of the Psychotropic‐Related Sexual Dysfunction Questionnaire (PRSex‐DQ) [Montejo et al., 2000], the Brazilian short‐version of the Ruminative Response Style of Treynor et al. [2003] (10‐item questionnaire) [Figueiredo‐Queirós et al., 2005] to assess rumination and the Portuguese version of Oxford Depression Questionnaire (ODQ) [Price et al., 2012] to measure emotional blunting intensity.
N‐Back Task Design
Subjects performed a letter variant version of the n‐back task [Harvey et al., 2004]. Load and mental manipulation within WM are modified by using three levels of complexity. Briefly, subjects have to indicate whether a letter presented on a screen (the “target” stimulus) matched a letter previously presented (the “cue” stimulus). To reduce visual and phonological strategies, we used phonologically closed letters with upper and lower case. Thus, only the following letters were presented b, B, d, D, g, G, p, P, t, T, v, V. Subjects had to ignore the case of the letters. Each presentation triggered a choice response to the following questions: is this letter “different from” or “identical” to a previously presented letter? Subjects responded either by pressing the right or left button whether the target was identical or different from the cue, irrespective of the case. Depending on which n‐back condition (1‐, 2‐, or 3‐back) is performed; the responses were to match the current letter with the one seen 1, 2, or 3 presentation backward. Subjects also performed a control task (0‐back) in which they had to identify a single prespecified letter (i.e., an “X” or “x”; Fig. 1). Participants underwent fMRI scanning while performing the N‐back task.
Figure 1.
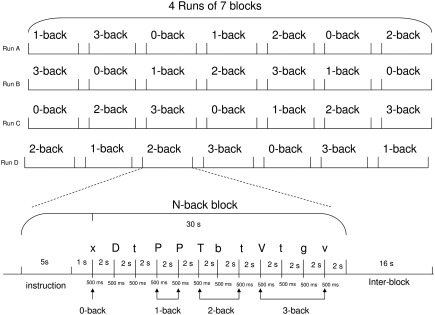
fMRI experimental design and the temporal course of an N‐Back block.
fMRI Protocol
The task encompassed four runs of seven pseudo‐randomized N‐back blocks. Each block contained a pseudo‐random sequence of 12 letters presented for 0.5 s and followed by a fixation cross for 2 s. Participants could respond during either the letter presentation or the fixation cross. A response was required for every letter presentation. Subjects indicated their response on a two‐button pad with the index and middle fingers of their right hand (index finger indicating a match). Each block lasted 30 s preceded by a 4‐s cue presentation indicating the n‐back condition. A 4‐s blank delay separated the instruction from the appearance of the first letter. Blocks were separated from one another by a 16‐s interval (i.e., resting inter‐block). The different condition blocks were also presented pseudo‐randomly. Subjects performed a practice run of seven blocks before starting the task.
fMRI Data Acquisition
Visual stimuli were generated by E‐prime 2.0 software and projected on a screen viewed through mirror glasses above the eyes.
Data images were acquired on 3‐T TRIO TIM scanner (Siemens Medical Solutions, Erlangen, Germany) with a 12‐channel head coil. A set of high‐resolution three‐dimensional T1‐weighted images were acquired (repetition time/time to echo: 2530/3.39 ms; field of view: 256 × 256 mm2; matrix: 256 × 256; flip angle: 7°; voxel size 1 × 1 × 1 mm3) for anatomical localization. fMRI series consist in 173 volumes acquired, after stabilization of the magnetization to a steady state, with T2* gradient echo‐planar sequence (repetition time/time to echo: 2200/40 milliseconds; field of view: 214 × 214 mm2; an axial matrix of 72 × 72 leading to a voxel size of 3 × 3 × 3 mm3 covering the whole brain). Axial slices were acquired parallel to the anteroposterior commisure plane.
Statistical Analyses
Clinical and behavioral data analyses
The analysis of clinical scales and task performance was conducted using the Statsoft Statistica version 10 (http://www.statsoft.fr) statistical package.
Difference in gender between both groups (EB and NEB) was analyzed with a two‐way Chi square test. Differences in clinical and demographic characteristics between the two groups of remitted MDD patients were compared using the parametric two‐sample Student t‐test or, when the population was not normally distributed (defined by the Kolmogorov‐Smirnov test), the nonparametric test Mann‐Whitney U‐test for age, education level, duration of the last depressive episode, duration since the remission for this last episode, number of previous depressive episodes, HAD depression and anxiety, apathy, PRSex‐DQ, RRS, and ODQ scores.
Difference in N‐back task performance (accuracy score and RT) were compared using an analysis of variance with a between‐group factor (EB and NEB), and 1 within‐group conditions factor (0‐, 1‐, 2‐, 3‐back).
The threshold for statistical significance was fixed at P < 0.05 (2‐tailed).
Functional data analysis
The fMRI data were pre‐processed using SPM8 (Wellcome Department of Cognitive Neurology, London, UK). For each subject, functional images were slice‐time corrected, realigned and spatially smoothed using a Gaussian kernel (8 mm at full‐width at half‐maximum). Next, functional connectivity analyses were conducted using the NetBrainWork software (https://sites.google.com/site/netbrainwork/, Laboratoire d'Imagerie Biomédicale, Paris, France). To identify functional network maps across participants, the NEDICA (Network Detection using ICA) [Perlbarg et al., 2008] approach was employed. It consists in a two‐step approach for group‐level functional networks identification. First, spatial ICA was achieved leading to a set of 40 spatial independent components (ICs) registered into the MNI standard stereotaxic space computed for each individual. Secondly, similar spatial components across individuals of both groups of participant were gathered by using a hierarchical clustering algorithm [Marrelec et al., 2008]. Each cluster is characterized by its degree of representativity (DR, ratio of subjects represented in the cluster) and its degree of unicity (DU, ratio of subjects represented by only one component in the cluster). For each resulting cluster, a t‐map was calculated with a fixed‐effect approach and stastically thresholded (P < 0.05, FDR corrected) to generate a set of group maps representing group‐level spatially structure processes. Finally, on the basis of previous reports [Buckner et al., 2008; Perlbarg and Marrelec, 2008], the DMN network was selected by visual inspection.
The TPN corresponds to voxels negatively correlated with the DMN time series. DMN and TPN t‐maps were selected for the functional connectivity analyses (Fig. 2A). Regions of interest (ROIs) were selected based on the peak voxels identified in the two t‐maps. Each region selected was composed of 40 voxels, delimited by a region‐growing algorithm [Bellec et al., 2006] from the given peak and was located at least 30 mm apart from another ROI. Similarly to previous studies, the DMN network comprised five nodes: the precuneus/PCC, the ventromedial prefrontal cortex (VMPFC), the dorsomedial prefrontal cortex (DMPFC), and the bilateral posterior part of inferior parietal lobule (i.e., Angular gyrus) [Perlbarg and Marrelec, 2008]. The TPN was partitioned into two subnetworks that show coactivation across a variety of WM tasks [Seeley et al., 2007]: the Central Executive Network (CEN) comprising important nodes in the bilateral dorsolateral prefrontal cortex (DLPFC) and the bilateral anterior part of the inferior parietal lobule (supramarginal gyrus), and the Salience Network (SN) comprising the bilateral anterior insula and the dorsal anterior cingulate cortex. The remaining regions of TPN belong to the motor network (MN) [Perlbarg and Marrelec, 2008] and were used as a control network for the analyses of correlation with the behavioral performance variability. The coordinates of regions of the DMN and the TPN selected for the analyses are shown in Table 1. fMRI time‐series were corrected from physiological noise with CORSICA approach [Perlbarg et al., 2007] and mean time‐courses within each ROIs were extracted for further analysis.
Figure 2.
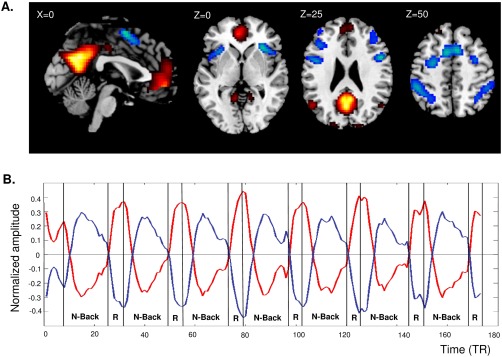
A: Group t‐maps of the DMN (warm colors) and TPN (cold colors). B: Mean activity time courses (arbitrary units) of the DMN (red) and TPN (blue) during the N‐back task. Abbreviations: DMN: default mode network; TPN: task‐positive network; R: resting interblock; TR: repetition time [Color figure can be viewed at http://wileyonlinelibrary.com]
Table 1.
Regions of default mode and TPN selected for the analyses
| Regions | MNI coordinates | ||
|---|---|---|---|
| x | y | z | |
| DMN | |||
| Medial frontal gyrus (BA9, DMPFC) | 4 | 51 | 20 |
| Medial frontal gyrus (BA10, VMPFC) | −2 | 50 | −6 |
| Posterior cingulate gyrus (BA 31) | −2 | −51 | 26 |
| Angular gyrus (BA 39, posterior IPL) Left | −46 | −64 | 33 |
| Angular gyrus (BA 39, posterior IPL) Right | 49 | −61 | 30 |
| CEN | |||
| Middle frontal gyrus (BA9, DLPFC) Left | −42 | 29 | 25 |
| Middle frontal gyrus (BA9, DLPFC) Right | 40 | 38 | 22 |
| Supramarginal gyrus (BA40, anterior IPL) Left | −41 | −38 | 40 |
| Supramarginal gyrus (BA40, anterior IPL) Right | 40 | −39 | 41 |
| SN | |||
| Anterior Insula (BA13) Left | −32 | 18 | 8 |
| Anterior Insula (BA13) Right | 33 | 22 | 3 |
| Anterior cingulate gyrus (BA32, dorsal ACC) | 12 | 12 | 43 |
| MN | |||
| Superior Frontal gyrus (BA6, SMA) | −5 | 6 | 51 |
| Precentral gyrus (BA6) Left | −28 | −3 | 49 |
| Precentral gyrus (BA6) Right | 30 | 3 | 51 |
| Inferior frontal gyrus (BA45) Left | −48 | 4 | 28 |
| Inferior frontal gyrus (BA44) Right | 50 | 9 | 21 |
BA: brodmann Area; DMPFC: dorsomedial prefrontal cortex; VMPFC: ventromedial prefrontal cortex; DLPFC: dorsolateral prefrontal cortex; IPL: inferior parietal lobule; ACC: anterior cingulate cortex; SMA: supplementary motor area.
Functional connectivity was measured by calculating Pearson correlations between the mean time‐course of each couple of ROIs [Biswal et al., 1995]. Within network interactions were defined as the mean of all correlations between ROIs within the same network (for DMN, CEN, and SN). Between network interactions (DMN‐CEN, DMN‐SN, and DMN‐MN) were defined as the mean of all correlation between a ROI belonging to one network and a ROI belonging to the another. Group differences of functional correlation indexes were inferred from the data using a fixed‐effects group approach and a Bayesian group analysis with numerical sampling scheme [Marrelec et al., 2008, 2006]. Probability of differences between groups superior to 0.95 was considered significant. To facilitate the understanding, the probability will be reported in a classically P‐value form, that is, 1‐probability.
Additionally, to determine the relationship between the functional connectivity and the experimental paradigm, the samples of the fMRI time‐series were divided into 4 WM load level task corresponding to each n‐back conditions. The mean timeseries of each network (DMN, CEN, SN, and MN) were extracted for each condition and each subject. Between network connectivity (DMN‐CEN and DMN‐SN) were calculated for each WM load level and each subject and compare with a measure of intraindividual behavioral variability, the coefficient of variation (CV: SD divided by mean) of the RT during the n‐back task [Kelly et al., 2008]. Specifically, we calculated the Pearson correlation coefficient between the default mode and TPN connectivity (correlation indexes) and the behavioral measure (CV) of each WM load‐level condition for each subject.
A post‐hoc linear regression analysis was also performed between the functional connectivity and the ruminative response style of the patients computing Pearson's correlation coefficients between the default mode and TPN correlation indexes and the Rumination Response Style (RRS) scale scores.
RESULTS
Demographic and Clinical Data
Table 2 summarizes demographic and clinical characteristics of remitted patients. No relevant difference was found between the two groups for age (t(24) = 0.3, P = 0.78), education level (t(24) = 1.02, P = 0.3), gender (χ 2 = 2.5, P = 0.12), duration of the last depressive episode (t(24) = 0.8, P = 0.4), duration since the remission for this last episode (t(24) = 1.7, P = 0.1) and number of previous depressive episodes (t(24) = 0.7, P = 0.5).
Table 2.
Demographic and clinical characteristics of the two groups of remitted patients
| Characteristics | NEB (n = 14) | EB (n = 12) | ||
|---|---|---|---|---|
| Age (years, mean ± SD) | 36.1 | ± 8.2 | 37.1 | ± 8.3 |
| Gender (n males/n females) | 9/5 | 4/8 | ||
| Education (years, mean ± SD) | 18.4 | ± 3.1 | 16.8 | ± 4.4 |
| Duration of last episode (months, mean ± SD) | 7.1 | ± 4.1 | 6 | ± 2.3 |
| Duration since remission for last episode (months, mean ± SD) | 3.9 | ± 1.5 | 5.2 | ± 2.4 |
| Number of previous depressive episodes (including the current one; mean ± SD) | 1.4 | ± 0.6 | 1.6 | ± 0.5 |
| HAD depression score (mean ± SD) | 1.4 | ± 1.2* | 2.5 | ± 0.9* |
| HAD anxiety score (mean ± SD) | 2.5 | ± 1.2 | 1.7 | ± 1.4 |
| Apathy score (mean ± SD) | 10.8 | ± 7.8 | 12.3 | ± 5.4 |
| RRS score (mean ± SD) | 17.2 | ± 5 | 20.2 | ± 4.6 |
| PRSex‐DQ score (mean ± SD) | 1.9 | ± 1.9* | 4.4 | ± 3.5* |
| ODQ total score (mean ± SD) | 9.6 | ± 9 ** | 39.3 | ± 8.4** |
HAD: hospital anxiety depression scale; RRS: ruminative response style; PRSex‐DQ: psychotropic‐related sexual dysfunction questionnaire; ODQ: Oxford depression questionnaire; SD: standard deviation; n = number of subjects.
*P for difference between NEB and EB patients <0.05.
**P for difference between NEB and EB patients <0.001.
In accordance with the standard question, the emotional blunting intensity were significantly higher in the EB patients compared with NEB patients measured by ODQ (EB: 39.3 ± 8.4; NEB: 9.6 ± 9; t(24) = 8.6, P < 0.001). In addition, the depression residual symptoms and the sexual dysfunction were significantly higher in the EB patients compared with NEB patients measured by the HAD (EB: 2.5 ± 0.9; NEB: 1.4 ± 1.2; U = 39, P = 0.02) and PRSex‐DQ (EB: 4.4 ± 3.5; NEB: 1.9 ± 1.9; t(24) = 2.3, P = 0.03), respectively.
No relevant difference was found between both patients groups for anxiety residual symptoms, apathy, or rumination symptoms (Table 2).
N‐Back Task Performance
Regarding the responses and RT during the N‐back task, there was a main effect of condition [responses: F(3,72) = 37; P = 0.02, RT: F(3,72) = 62.6; P < 0.001] explained by an decreased number of good responses and a longer RT linked to an increase of the WM load (0‐back toward 3‐back; Fig. 3). No main effect of group or condition x group interaction was found (all P > 0.7).
Figure 3.
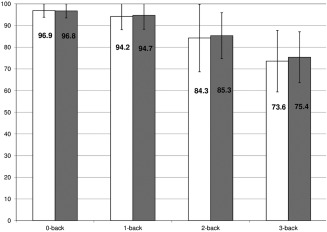
N‐back task performance: Mean of percentage (± standard deviation) of the correct responses given during the fMRI task according to the N‐back condition by nonemotional blunted (light bars) and emotional blunted groups (dark bars; RT, 0‐back: NEB = 804 ± 132 ms, EB = 782 ± 132 ms; 1‐back: NEB = 929 ± 203 ms, EB = 878 ± 174 ms; 2‐back: NEB = 1113 ± 197 ms, EB = 1071 ± 199 ms; 3‐back: NEB = 1200 ± 230 ms, EB= 1174 ± 267 ms; no difference in the coefficient of variation of RT between groups).
Abbreviations: RT: reaction time; NEB: non‐emotional blunted patients; EB: emotional blunted patients; ms: milliseconds.
Functional Connectivity Results
Task‐related functional networks
The t‐map identified as the DMN (DR = 0.91, DU = 0.93) showed increased synchronous activity during the resting inter‐blocks and decreased activity during the n‐back task blocks in all subjects. Inversely, the t‐map identified as the TPN showed increased activity during the n‐back task blocks and decreased activity during the inter‐blocks of rest (Fig. 2B).
Over the entire WM task, the functional connectivity found in the EB group within DMN (cc = 0.47), CEN (cc = 0.42), or SN (cc = 0.49) was significantly different than the NEB group (DMN, cc = 0.54; CEN, cc = 0.50; SN, cc = 0.54, all P < 0.01). In addition, the negative correlation between DMN and Task‐positive subnetworks were significantly lower in the EB (DMN‐CEN, cc = −0.27; DMN‐SN, cc = −0.29) than the NEB group (DMN‐CEN, cc = −0.32; DMN‐SN, cc = −0.34, all P < 0.01) meaning a lower functional connectivity (anticorrelation) between DMN and the subnetworks of the TPN when the EB subjects performed the N‐back task.
Relationship between functional connectivity and behavioral variability during N‐back task
A significant positive correlation was found between the functional connectivity between DMN‐TPN and the CV of the NEB patients group during the 3‐back condition (r = 0.54, t(12) = 2.24, P = 0.04). Conversely, a significant negative correlation was found between the functional connectivity between DMN‐TPN and the CV of the EB patients group during the 3‐back condition (r = −0.59, t(10) = −2.32, P = 0.04). These correlations are significantly different between patients groups (Z = 3.12, P = 0.0018).
In other words, the stronger the negative correlation between DMN and TPN was, the less variable the behavioral performance was during 3‐Back task in NEB patients. This correlation was driven by the DMN‐SN connectivity (r = 0.62, t(12) = 2.76, P = 0.017) but not by the DMN‐CEN (r = 0.32, t(12) = 1.17, P > 0.05) or DMN‐MN connectivity (r = −0.36, t(12) = −1.36, P > 0.05; Fig. 4A).
Figure 4.
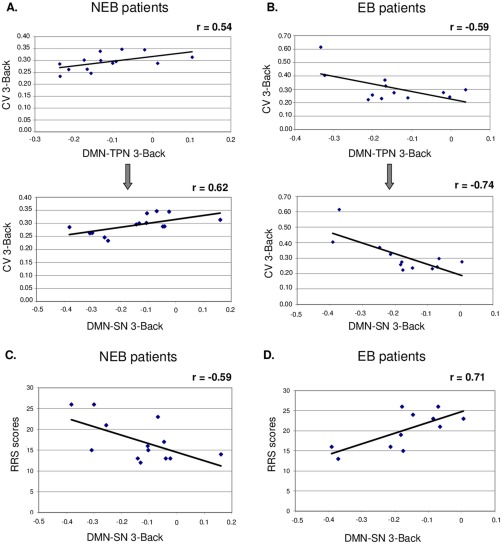
Correlations between the functional connectivity and the measure of intraindividual behavioral variability (CV) during the 3‐back condition in the NEB patients (A) and EB patients (B; upper part). Correlation between the functional connectivity during the 3‐back condition and RRS scores in the NEB patients (C) and EB patients (D; lower part).
Abbreviations: CV: coefficient of variation of the RT; NEB: nonemotional blunted patients; EB: emotional blunted patients; DMN‐TPN: functional connectivity between default mode network and task‐positive network; DMN‐SN: functional connectivity between default mode network and SN. [Color figure can be viewed at http://wileyonlinelibrary.com]
The stronger the anticorrelation between DMN and TPN was, the more variable the behavioral performance was during 3‐Back task in EB patients. Again this correlation was driven by the DMN‐SN connectivity (r = −0.74, t(10) = −3.53, P = 0.005) but not by the DMN‐CEN (r = −0.43, t(10) = −1.51, P > 0.05) or DMN‐MN connectivities (r = −0.56, t(10) = −2.1, P > 0.05; Fig. 4B).
No other significant correlation was found between the functional connectivity and another N‐back condition except between DMN‐TPN or DMN‐CEN and the CV during the 1‐back condition in the NEB group (data not shown).
Relationship between functional connectivity and rumination
A significant negative correlation was found between the functional connectivity between DMN‐SN and RRS scores in the NEB group (r = −0.59, t(11) = −2.45, P = 0.032) indicating that an increased ruminative response style is associated with a increased DMN‐SN anticorrelation (Fig. 4C).
A significant positive correlation was found between the functional connectivity between DMN‐SN and RRS scores in the EB group (r = 0.71, t(9) = 3, P = 0.014) indicating that an increased ruminative response style is associated with a decreased DMN‐SN anticorrelation (Fig. 4D).
DISCUSSION
This study aimed at assessing how emotional blunting, rumination, and WM performance in remitted depressed patients relate to the cooperation of two neural networks involved in attention regulation.
Consistent with our hypothesis, compared to NEB group, the EB patients showed a significant decreased anticorrelation between DMN and both subnetworks of TPN during the N‐back task performance. Similarly to findings of Kelly et al. [2008], the strength of the anti‐correlation between DMN and TPN was significantly positively related to less variability of behavioral performance in the NEB patients while performing the 3‐back condition. More specifically, the stronger the negative correlation between DMN and SN was, the less variable the RT was during 3‐Back task in the NEB patients. Conversely, the DMN‐SN anticorrelation and the 3‐Back RT variability were negatively correlated in the EB patients.
Several behavioral investigations have shown that measures of dispersion or intraindividual variability (IIV) can provide information about performance that is not detectable by the mean [e.g., Hervey et al., 2006]. Measures of IIV are better able to differentiate cognitively impaired patients and clinical groups (e.g., Attention‐Deficit/Hyperactivity Disorder) from healthy controls than measures of central tendency such as mean accuracy, error rates, or RT [Klein et al., 2006]. Cognitively, IIV indexes the efficiency with which attentional resources are allocated in the face of demands on cognitive control [Stuss et al., 2003]. Consistent with this interpretation we found no statistical difference between the EB and NEB patients on N‐back accuracy, RT, and RT variability.
Both groups of patients in the present study did not differ in terms of behavioral performance and clinical characteristics except for emotional blunting. Anhedonia, the loss of capacity to experience pleasure, is a core feature of depression. Anhedonia is different from emotional blunting, that is, an emotional detachment for both positive and negative emotional stimuli. To our knowledge, no previous neuroimaging studies are available on brain effect of emotional blunting during depression recovery.
We highlighted a decreased DMN and TPN coordination during an attention‐demanding task in EB compared with NEB remitted depressed patients. This difference of coordination of two neural networks between groups is not concomitant with a difference of brain activation between groups during the N‐back task (none significant group main effect or interaction between groups and condition were found with an uncorrected threshold at P < 0.001, data not shown).
This altered dynamic coupling between DMN and TPN could reflect an abnormal transition between rest and task performance. Marchetti et al. [2012] explained the abnormal switching between internally and externally oriented attention by DMN persistence and/or a TPN deficiency leading to rumination and impaired attentional control in acute depression. Consistent with this interpretation, Bartova et al. [2015] recently showed a decreased deactivation of the DMN during the N‐back task in a subgroup of adolescent‐onset remitted depressed patients. Our study extends this finding by showing the abnormal cooperation between DMN and TPN in remitted depressed patients and the relationships of this abnormal cooperation with residual emotional symptoms.
Interestingly, our results also showed a specific involvement of the DMN‐SN interplay associated to the variability of cognitive performance not found for the DMN‐CEN interplay. The SN has been associated with the capacity to segregate the most relevant among internal and environmental stimuli to guide behavior [Seeley et al., 2007]. According to the triple network model [Menon, 2011] the SN could serve to initiate dynamic switching between the CEN and DMN. Aberrant functioning of DMN, CEN, and SN could mediate pathophysiological mechanisms in acute depression [Hamilton et al., 2013; Kaiser et al., 2015].
A recent fMRI study tested the triple network model in acute depressed patients using a task designed to elicit self‐focused and externally focused thinking [Belleau et al., 2015]. In the external‐focus condition, a greater connectivity within DMN and a lesser connectivity within SN and CEN were found in depressed patients compared with controls. The authors suggested that MDD patients fail to adequately recruit the SN to switch on the CEN and to down‐regulate self‐related DMN activity when they try to engage in externally focused thinking [Belleau et al., 2015], a finding consistent with our actual results.
In EB patients, we observed that the less DMN‐SN were anticorrelated, the more the EB patients tended to have a higher score on ruminative rating scale contrary to NEB patients. These results suggest that the brain dynamics between DMN and SN could be more involved to cope with ruminative thinking and self‐referential processing rather than maintaining allocation of attentional resources toward external environment in remitted MDD patients with emotional blunting [Jacobs et al., 2014].
In this sense, a study investigating in acute depressed patients the association between DMN‐TPN interplay and rumination showed that DMN dominance on TPN was positively correlated with the maladaptive, brooding subscale of RRS and negatively correlated with the reflective pondering subscale of RRS, a more adaptive form of rumination [Hamilton et al., 2011]. However, we were not able to differentiate depression and reflective pondering subscores with the ruminative scale used in this study.
In a recent meta‐analysis, Kaiser et al. [2015] proposes a neurocognitive model in which network abnormal cooperation contributes to core cognitive and affective symptoms in acute depressed patients. This model was informed from resting state studies. Here, we showed that network dysfunction persists when the subject is engaged in a cognitive task and during partial remission of depression. Future studies using the n‐back task are needed in subjects with full depressive symptoms to disentangle the relationships between resting state, cognitive performance and dynamic coupling of neural networks in depression.
This study has some limitations. First, although the remitted MDD patients were clinically well‐characterized, our samples of both groups were relatively small. Second, the patients were not drug‐free for ethical considerations, but all were treated with the same medication (paroxetine) to avoid different pharmacological effects of antidepressant on brain activity. Third, this study did not include a control group without depressive history to interpret the results in the context of a normative sample. Fourth, there were only findings in the 3‐back condition. This is consistent with recruitment of different components of CEN and cooperation increase between networks according to the difficulty of the task (from 1 to 3 back) [see Harvey et al., 2005].
In summary, variability in the performance during the N‐Back task was differently related to functional connectivity between DMN, CEN, and SN, in EB patients compared with NEB patients. Our results suggest that the SN was involved in coping with ruminative thinking in partially remitted patients with emotional blunting rather than maintaining allocation of attentional resources toward environmental stimuli as found in NEB full remitted depressed patients. In agreement with the suggestion of Zimmerman et al. [2012] remission of depression is a heterogeneous clinical condition and our findings emphasize its biological heterogeneity in relationship with residual symptoms of depression.
CONFLICT OF INTEREST
PD was supported by Institut de Recherches Internationales Servier (IRIS). MJ and KD are employees of Servier. PF received honoraria for this study and research grants from Servier.
The authors declare no other conflict of interest. Funding of these authors had no further role in the analysis and interpretation of data, in the writing of the report and in the decision to submit the paper for publication. PD had full access to all of the data in the study and takes responsibility for the integrity of the data and the accuracy of the data analysis.
REFERENCES
- Bartova L, Meyer BM, Diers K, Rabl U, Scharinger C, Popovic A, Pail G, Kalcher K, Boubela RN, Huemer J, Mandorfer D, Windischberger C, Sitte HH, Kasper S, Praschak‐Rieder N, Moser E, Brocke B, Pezawas L (2015): Reduced default mode network suppression during a working memory task in remitted major depression. J Psychiatr Res 64:9–18. [DOI] [PMC free article] [PubMed] [Google Scholar]
- Belleau EL, Taubitz LE, Larson CL (2015): Imbalance of default mode and regulatory networks during externally focused processing in depression. Soc Cogn Affect Neurosci 10:744–751. [DOI] [PMC free article] [PubMed] [Google Scholar]
- Bellec P, Perlbarg V, Jbabdi S, Pélégrini‐Issac M, Anton JL, Doyon J, Benali H (2006): Identification of large‐scale networks in the brain using fMRI. Neuroimage 29:1231–1243. [DOI] [PubMed] [Google Scholar]
- Biswal BB, Yetkin FZ, Haughton VM, Hyde JS (1995): Functional connectivity in the motor cortex of resting human brain using echo‐planar MRI. Magn Reson Med 34:537–541. [DOI] [PubMed] [Google Scholar]
- Buckner RL, Andrews‐Hanna JR, Schacter DL (2008): The brain's default network: Anatomy, function, and relevance to disease. Ann N Y Acad Sci 1124:1–38. [DOI] [PubMed] [Google Scholar]
- Dubal S, Jouvent R (2004): Time‐on‐task effect in trait anhedonia. Eur Psychiatry 19:285–291. [DOI] [PubMed] [Google Scholar]
- Figueiredo‐Queirós MM, Fernández‐Berrocal P, Extremera N, Carral JMC, e Queirós PS (2005): Validação e fiabilidade da versão portuguesa modificada da Trait Meta‐Mood Scale. Revista de Psicologia, Educação e Cultura 9:199–216. [Google Scholar]
- Freton M, Lemogne C, Delaveau P, Guionnet S, Wright E, Wiernik E, Bertasi E, Fossati P (2014): The dark side of self‐focus: Brain activity during self‐focus in low and high brooders. Soc Cogn Affect Neurosci 9:1808–1813. [DOI] [PMC free article] [PubMed] [Google Scholar]
- Gaynes BN, Warden D, Trivedi MH, Wisniewski SR, Fava M, Rush AJ (2009): What did STAR*D teach us? Results from a large‐scale, practical, clinical trial for patients with depression. Psychiatr Serv 60:1439–1445. [DOI] [PubMed] [Google Scholar]
- Guimarães HC, Araujo Fialho PP, Amaral CV, dos Santos EL, Caramelli P (2009): Brazilian caregiver version of the Apathy Scale. Dement Neuropsychol 3:321–326. [DOI] [PMC free article] [PubMed] [Google Scholar]
- Hamilton M (1960): A rating scale for depression. J Neurol Neurosurg Psychiatr 23:56–62. [DOI] [PMC free article] [PubMed] [Google Scholar]
- Hamilton JP, Furman DJ, Chang C, Thomason ME, Dennis E, Gotlib IH (2011): Default‐mode and task‐positive network activity in major depressive disorder: Implications for adaptive and maladaptive rumination. Biol Psychiatry 70:327–333. [DOI] [PMC free article] [PubMed] [Google Scholar]
- Hamilton JP, Chen MC, Gotlib IH (2013): Neural systems approaches to understanding major depressive disorder: An intrinsic functional organization perspective. Neurobiol Dis 52:4–11. [DOI] [PMC free article] [PubMed] [Google Scholar]
- Harvey PO, Fossati P, Pochon JB, Levy R, Lebastard G, Lehéricy S, Allilaire JF, Dubois B (2005): Cognitive control and brain resources in major depression: An fMRI study using the n‐back task. Neuroimage 26:860–869. [DOI] [PubMed] [Google Scholar]
- Harvey PO, Le Bastard G, Pochon JB, Levy R, Allilaire JF, Dubois B, Fossati P (2004): Executive functions and updating of the contents of working memory in unipolar depression. J Psychiatr Res 38:567–576. [DOI] [PubMed] [Google Scholar]
- Hervey AS, Epstein JN, Curry JF, Tonev S, Eugene Arnold L, Keith Conners C, Hinshaw SP, Swanson JM, Hechtman L (2006): Reaction time distribution analysis of neuropsychological performance in an ADHD sample. Child Neuropsychol 12:125–140. [DOI] [PubMed] [Google Scholar]
- Jacobs RH, Jenkins LM, Gabriel LB, Barba A, Ryan KA, Weisenbach SL, Verges A, Baker AM, Peters AT, Crane NA, Gotlib IH, Zubieta JK, Phan KL, Langenecker SA, Welsh RC (2014): Increased coupling of intrinsic networks in remitted depressed youth predicts rumination and cognitive control. PLoS One 9:e104366. [DOI] [PMC free article] [PubMed] [Google Scholar]
- Kaiser RH, Andrews‐Hanna JR, Wager TD, Pizzagalli DA (2015): Large‐Scale Network Dysfunction in Major Depressive Disorder: A Meta‐analysis of Resting‐State Functional Connectivity. JAMA Psychiatry 72:603–611. [DOI] [PMC free article] [PubMed] [Google Scholar]
- Kelly AM, Uddin LQ, Biswal BB, Castellanos FX, Milham MP (2008): Competition between functional brain networks mediates behavioral variability. Neuroimage 39:527–537. [DOI] [PubMed] [Google Scholar]
- Kessler RC, Berglund P, Demler O, Jin R, Koretz D, Merikangas KR, Rush AJ, Walters EE, Wang PS; National Comorbidity Survey Replication (2003): The epidemiology of major depressive disorder: Results from the National Comorbidity Survey Replication (NCS‐R). JAMA 289:3095–3105. [DOI] [PubMed] [Google Scholar]
- Klein C, Wendling K, Huettner P, Ruder H, Peper M (2006): Intra‐subject variability in attention‐deficit hyperactivity disorder. Biol Psychiatry 60:1088–1097. [DOI] [PubMed] [Google Scholar]
- Lemogne C, le Bastard G, Mayberg H, Volle E, Bergouignan L, Lehéricy S, Allilaire JF, Fossati P (2009): In search of the depressive self: Extended medial prefrontal network during self‐referential processing in major depression. Soc Cogn Affect Neurosci 4:305–312. [DOI] [PMC free article] [PubMed] [Google Scholar]
- Mac Donald SW, Nyberg L, Bäckman L (2006): Intra‐individual variability in behavior: Links to brain structure, neurotransmission and neuronal activity. Trends Neurosci 29:474–480. [DOI] [PubMed] [Google Scholar]
- Marchetti I, Koster EH, Sonuga‐Barke EJ, De Raedt R (2012): The default mode network and recurrent depression: A neurobiological model of cognitive risk factors. Neuropsychol Rev 22:229–251. [DOI] [PubMed] [Google Scholar]
- Marrelec G, Bellec P, Krainik A, Duffau H, Pélégrini‐Issac M, Lehéricy S, Benali H, Doyon J (2008): Regions, systems, and the brain: Hierarchical measures of functional integration in fMRI. Med Image Anal 12:484–496. [DOI] [PubMed] [Google Scholar]
- Marrelec G, Krainik A, Duffau H, Pélégrini‐Issac M, Lehéricy S, Doyon J, Benali H (2006): Partial correlation for functional brain interactivity investigation in functional MRI. Neuroimage 32:228–237. [DOI] [PubMed] [Google Scholar]
- Menon V (2011): Large‐scale brain networks and psychopathology: A unifying triple network model. Trends Cogn Sci 15:483–506. [DOI] [PubMed] [Google Scholar]
- Montejo AL, Garcia M, Espada M, Rico‐Villademoros F, Llorca G, Izquierdo JA; y Grupo Español De Trabajo Para El Estudio De Las Disfunciones Sexuales Secundarias a Psicofármacos (2000): Propiedades psicométricas del Cuestionario de Disfunción Sexual Secundaria a Psicofármacos. Actas Esp Psiquiátr 28:141–150. [PubMed] [Google Scholar]
- Nejad AB, Fossati P, Lemogne C (2013): Self‐referential processing, rumination, and cortical midline structures in major depression. Front Hum Neurosci 7:666. [DOI] [PMC free article] [PubMed] [Google Scholar]
- Perlbarg V, Bellec P, Anton JL, Pelegrini‐Issac M, Doyon J, Benali H (2007): CORSICA: Correction of structured noise in fMRI by automatic identification of ICA components. Magn Reson Imaging 25:35–46. [DOI] [PubMed] [Google Scholar]
- Perlbarg V, Marrelec G (2008): Contribution of exploratory methods to the investigation of extended large‐scale brain networks in functional MRI: Methodologies, results, and challenges. Int J Biomed Imaging 2008:218519. [DOI] [PMC free article] [PubMed] [Google Scholar]
- Perlbarg V, Marrelec G, Doyon J, Pélégrini‐Issac M, Lehéricy S, Benali H (2008): NEDICA: Detection of group functional networks in fMRI using spatial independent component analysis 5th IEEE International Symposium on Biomedical Imaging: From Nano to Macro, Paris, France. pp. 1247–1250. [Google Scholar]
- Price J, Cole V, Goodwin GM (2009): Emotional side‐effects of selective serotonin reuptake inhibitors: qualitative study. Br J Psychiatry 195:211–217. [DOI] [PubMed] [Google Scholar]
- Price J, Cole V, Goodwin G (2012): The Oxford Questionnaire on the Emotional Side‐effects of Antidepressants (OQuESA): Development, validity, reliability and sensitivity to change. J Affect Disord 140:66–74. [DOI] [PubMed] [Google Scholar]
- Price J, Goodwin GM (2009): Emotional blunting or reduced reactivity following remission of major depression. Medicographia 31:152–156. [Google Scholar]
- Rush AJ, Trivedi MH, Wisniewski SR, Nierenberg AA, Stewart JW, Warden D, Niederehe G, Thase ME, Lavori PW, Lebowitz BD, McGrath PJ, Rosenbaum JF, Sackeim HA, Kupfer DJ, Luther J, Fava M (2006): Acute and longer‐term outcomes in depressed outpatients requiring one or several treatment steps: A STAR*D report. Am J Psychiatry 163:1905–1917. [DOI] [PubMed] [Google Scholar]
- Sacchetti E, Frank E, Siracusano A, Racagni G, Vita A, Turrina C (2015): Functional impairment in patients with major depression in clinical remission: results from the VIVAL‐D‐Rem, a nationwide, naturalistic, cross‐sectional survey. Int Clin Psychopharmacol 30:129–141. [DOI] [PubMed] [Google Scholar]
- Seeley WW, Menon V, Schatzberg AF, Keller J, Glover GH, Kenna H, Reiss AL, Greicius MD (2007): Dissociable intrinsic connectivity networks for salience processing and executive control. J Neurosci 27:2349–2356. [DOI] [PMC free article] [PubMed] [Google Scholar]
- Sheline YI, Barch DM, Price JL, Rundle MM, Vaishnavi SN, Snyder AZ, Mintun MA, Wang S, Coalson RS, Raichle ME (2009): The default mode network and self‐referential processes in depression. Proc Natl Acad Sci U S A 106:1942–1947. [DOI] [PMC free article] [PubMed] [Google Scholar]
- Starkstein SE, Mayberg HS, Preziosi TJ, Andrezejewski P, Leiguarda R, Robinson RG (1992): Reliability, validity and clinical correlate of apathy in Parkinsons's disease. J Neuropsychiatry Cli Neurosci 4:134–139. [DOI] [PubMed] [Google Scholar]
- Stuss DT, Murphy KJ, Binns MA, Alexander MP (2003): Staying on the job: the frontal lobes control individual performance variability. Brain 126:2363–2380. [DOI] [PubMed] [Google Scholar]
- Treynor W, Gonzalez R, Nolen‐Hoeksema S (2003): Rumination Reconsidered: A Psychometric Analysis. Cognit Ther Res 27:247–259. [Google Scholar]
- van Rijsbergen GD, Hollon SD, Elgersma HJ, Kok GD, Dekker J, Schene AH, Bockting CL (2015): Understanding emotion and emotional scarring in recurrent depression. Compr Psychiatry 59:54–61. [DOI] [PubMed] [Google Scholar]
- Walsh ND, Williams SC, Brammer MJ, Bullmore ET, Kim J, Suckling J, Mitterschiffthaler MT, Cleare AJ, Pich EM, Mehta MA, Fu CH (2007): A longitudinal functional magnetic resonance imaging study of verbal working memory in depression after antidepressant therapy. Biol Psychiatry 62:1236–1243. [DOI] [PubMed] [Google Scholar]
- Zigmond AS, Snaith RP (1983): The Hospital Anxiety and Depression Scale. Acta Psychiatr Scand 67:361–370. [DOI] [PubMed] [Google Scholar]
- Zimmerman M, Martinez J, Attiullah N, Friedman M, Toba C, Boerescu DA (2012): Symptom differences between depressed outpatients who are in remission according to the Hamilton Depression Rating Scale who do and do not consider themselves to be in remission. J Affect Disord 142:77–81. [DOI] [PubMed] [Google Scholar]