

Abstract
Advanced connectivity studies in toddlers with Autism Spectrum Disorder (ASD) are increasing and consistently reporting a disruption of brain connectivity. However, most of these studies compare ASD and typically developing subjects, thus providing little information on the specificity of the abnormalities detected in comparison with other developmental disorders (other‐DD). We recruited subjects aged below 36 months who received a clinical diagnosis of Neurodevelopmental Disorder (32 ASD and 16 other‐DD including intellectual disability and language disorder) according to DSM‐IV TR. Structural and diffusion MRI were acquired to perform whole brain probabilistic and anatomically constrained tractography. Network connectivity matrices were built encoding the number of streamlines (DNUM) and the tract‐averaged fractional anisotropy (DFA) values connecting each pair of cortical and subcortical regions. Network Based Statistics (NBS) was finally applied on the connectivity matrices to evaluate the network differences between the ASD and other‐DD groups. The network differences resulted in an over‐connectivity pattern (i.e., higher DNUM and DFA values) in the ASD group with a significance of P < 0.05. No contra‐comparison results were found. The over‐connectivity pattern in ASD occurred in networks primarily involving the fronto‐temporal nodes, known to be crucial for social‐skill development and basal ganglia, related to restricted and repetitive behaviours in ASD. To our knowledge, this is the first network‐based diffusion study comparing toddlers with ASD and those with other‐DD. Results indicate the detection of different connectivity patterns in ASD and other‐DD at an age when clinical differential diagnosis is often challenging. Hum Brain Mapp 38:2333–2344, 2017. © 2017 Wiley Periodicals, Inc.
Keywords: autism spectrum disorders, brain connectivity, overconnectivity, toddlers, developmental disorders
INTRODUCTION
Autism Spectrum Disorders (ASD) are a heterogeneous group of neurodevelopmental diseases affecting 1 in 68 children in the United States [CDC, 2014], characterized by impairment in socio‐communicative abilities, as well as restricted and stereotyped behaviours [American Psychiatric Association, 2013]. Although a wide consensus exists from both retrospective and prospective studies about appearance of ASD symptoms in the first 2 years of life, the age at which clinical diagnosis is generally made ranges between 3 and 4 years in industrialized countries [Chawarska et al., 2014; Salomone et al., 2015; Zwaigenbaum et al., 2013]. The rapid development of cognitive, social and communication skills in children during their first years of life reflects on dynamic changes in symptoms of ASD [Chawarska and Shic, 2009; Turner et al., 2006] and requires deep knowledge of the earliest and most predictive markers of ASD [Barbaro and Dissanayake, 2009; Bedford et al., 2016], with the final aim of identifying children at the earliest possible opportunity, given the importance of early specific tailored intervention [Barbaro and Dissanayake, 2012; Dawson, 2008; Pickles et al., 2016].
Advanced connectivity studies are emerging in the literature reporting disrupted connectivity in toddlers with ASD, detectable even before the full phenotypic expression of the disorder [Conti et al., 2015]. At such a young age, head circumference has been consistently reported to show abnormal growth patterns in ASD [Muratori et al., 2012] Specifically, normal brain size at birth is probably followed by a rapid rate of growth in the first 2–4 years of life with a later normalization of head circumference [Courchesne et al., 2011a; Sacco et al., 2015]. Brain dysmaturation occurring in this early phase of development can lead to abnormal brain connectivity, as widely reported in ASD adolescents and young adults, both in terms of functional and structural connections [Lewis and Elman, 2008]. Articles assessing structural connectivity in toddlers with ASD [Ben Bashat et al., 2007; Weinstein et al., 2011] reported a distinct connectivity pattern, that is, over‐connectivity, in ASD subjects in comparison with typical subjects, in contrast to under‐connectivity patterns widely reported in ASD adolescents and young adults [Ameis and Catani, 2015]. Recently, DTI studies assessing infants at risk for autism (having an older sibling with ASD), reported altered connectivity in subjects even younger than 24 months when the clinical picture of the disorder was not fully expressed [Elison et al., 2013; Wolff et al., 2012].
Although an increasing number of reports are consistently confirming evidence supporting an early over‐connectivity in ASD before the age of 3 years, little is known on the specificity of this finding. This information is of great value since, at such an early age, a great challenge for clinicians dealing with neurodevelopmental disorders is to differentiate infants with ASD from those with other developmental disorders (other‐DD), such as developmental delay or language disorder, in order to allow for a better tailoring of early intervention strategies [Zwaigenbaum et al., 2015]. Indeed, in the absence of univocal predictive biomarkers, early detection is informed by the presence of a constellation of behavioural signs that show significant overlap between different neurodevelopmental disorders, which makes the discriminative value of early neuropsychological assessments very heterogeneous across studies [Mitchell et al., 2011]. To date, few case‐control studies compared brain structural connectivity in pre‐school children with ASD to those with other‐DD, reporting ASD white matter abnormalities in temporal lobes [Cascio et al., 2013], increased length, volume and density of right uncinate fasciculus, right arcuate fasciculus and corpus callosum [Kumar et al., 2010]. To the best of our knowledge, only one study compared brain diffusion between toddlers with ASD and those with developmental delay, showing higher fractional anisotropy in the corpus callosum, posterior cingulate cortex and limbic lobes in the former [Xiao et al., 2014], while no studies explored differences in structural connectivity.
In the present study we applied an advanced connectome approach to investigate structural connectivity in a group of toddlers with ASD and in an age‐matched group of toddlers with other‐DD to determine the specific networks differentiating the two clinical groups.
METHODS
Participants
As part of an on‐going prospective study started in January 2012, we enrolled all children referred to our tertiary care centre for early neurodevelopmental disorders. All patients were tested by a multidisciplinary team including a senior child neuropsychiatrist, an experienced clinically trained child psychologist and a speech‐language pathologist during 5–7 days of intensive evaluation. All patients underwent brain MRI, EEG and a number of tests including the Griffiths' Mental Developmental Scale, audiometry, DNA analysis of FRA‐X, array CGH and screening tests for inborn errors of metabolism. Subjects diagnosed with ASD, according to DSM‐IV TR, also were evaluated with the Autism Diagnostic Observation Schedule‐Generic (ADOS‐G) [Lord et al., 2000] or the Autism Diagnostic Observation Schedule‐Toddler Module (ADOS‐T) [Luyster et al., 2009].
For the present study, subjects were included if they (i) received a clinical diagnosis of ASD, or other‐DD, including either intellectual disabilities or language disorders (as from the DSM‐IV‐TR), (ii) were aged 36 months or less and (iii) had no neurometabolic or genetic disorders.
The study was approved by the local Ethical Committee and written informed consent was obtained from all parents or caregivers. The research was carried out in accordance with the Code of Ethics of the World Medical Association (Declaration of Helsinki) for experiments involving humans.
MRI Protocol
Acquisition
All children received inhalational anaesthesia with a halogenated agent while spontaneously breathing. No side effects were reported. Data were acquired on a GE 1.5 T scanner. At the beginning of each experimental session, whole‐brain T1‐weighted Spoiled Gradient (SPGR) echo volumes of size 256 × 256 × 144; voxel size of 0.9766 mm × 0.9766 mm × 1 mm; TR/TE/TI, 12.28/5.14/700 ms were acquired for each subject. High angular resolution diffusion imaging (HARDI) scans were acquired using either 64 or 30 diffusion‐weighted directions. Acquisition parameters were as follows: field of view, 24 cm; TR/TE, 10,000/92 ms; slice thickness, 3 mm; acquisition matrix, 80 × 80 and a diffusion encoding gradient strength, b = 1,000 s/mm2. One low (b = 0) diffusion weighted image was acquired.
Data pre‐processing
An extensive pre‐processing procedure was performed on the diffusion‐weighted images [Pannek et al., 2012a]. Signal intensity outlier voxels (caused by cardiac pulsation, bulk head motion and other artefacts) were detected and replaced using DROP‐R [Morris et al., 2011]. DROP‐R was modified from the originally proposed method to employ a higher order model of the diffusion signal suitable for the detection and replacement of outliers in high b‐value diffusion data (HOMOR) [Pannek et al., 2012b]. Between‐volume registration to account for head movement during the scan time was performed using Fit Model to All Measurements (FMAM) [Bai and Alexander, 2008] with adjustment of the b‐matrix [Leemans and Jones, 2009; Rohde et al., 2004]. Finally, intensity inhomogeneities were removed using N3 correction [Sled et al., 1998] and the FA was estimated from the corrected diffusion data. Constrained spherical deconvolution [Tournier et al., 2007] (http://nitrc.org/projects/mrtrix) was employed to estimate the fibre orientation distribution for tractography at maximum harmonic order 6. The T1‐weighted volumes were resampled isotropically to 1 mm resolution and corrected for bias due to magnetic field inhomogeneities.
Diffusion tractography and connectivity matrices
Diffusion datasets acquired along 64 non‐collinear directions were reduced to 30‐direction datasets by extracting an optimal subset of directions using tools implemented in MRtrix3 [Tournier et al., 2012].
Diffusion weighted images were corrected for head motion and eddy current distortions using FSL eddy [Andersson and Sotiropoulos, 2016] and signal intensity inhomogeneities were removed [Zhang et al., 2001]. The single fibre response function was estimated using the “tournier” method implemented in MRtrix3 [Tournier et al., 2012]. Constrained spherical deconvolution [Tournier et al., 2007, 2012] was performed to obtain fibre orientation distributions. Diffusion and structural images were co‐registered using boundary‐based registration [Greve and Fischl, 2009]. The resulting transformation matrix was applied to the header information of structural images, with no need to resample structural images to diffusion space. Brain extraction from structural images was performed using volbrain [Manjon and Coupe, 2016]. A five‐tissue‐type (white matter, cortical grey matter, deep grey matter, CSF, other) mask was calculated from the structural images using methods implemented in MRtrix3, which make use of FSL FAST [Zhang et al., 2001] and FIRST [Patenaude et al., 2011]. Anatomically constrained tractography (ACT, [Smith et al., 2012]) was used to generate 10 million probabilistic streamlines, which were subsequently filtered to 5 million streamlines using SIFT [Smith et al., 2013].
Cortical parcellation of the structural images into 90 regions excluding the cerebellum was performed by registering [Avants et al., 2011] to an infant AAL (anatomical atlas labelling) atlas [Feng et al., 2005] (from UNC Chapel Hill, North Carolina). Connectivity matrices of size 90 × 90 were generated by encoding streamline number and average FA of connections between each pair of regions in the AAL atlas (See Fig. 1).
Figure 1.
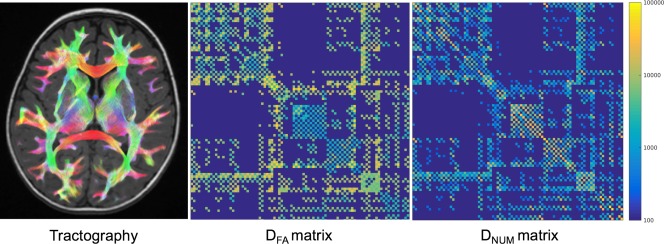
Example of whole brain tractography (left column), mean DFA connectivity matrix (central column) and mean DNUM connectivity matrix normalised between 0 and 1 using a row‐wise normalisation (right column). [Color figure can be viewed at http://wileyonlinelibrary.com]
Statistical Analysis
Only connections that were present in all participants, and that contained, on average, at least 250 streamlines were included in the analysis.
Between‐group differences
The connectivity matrices of the ASD and other‐DD groups were contrasted for a group‐wise comparison using the NBS toolbox (https://sites.google.com/site/bctnet/ comparison/nbs) for Matlab [Zalesky et al., 2010]. NBS performs a graph‐based clustering involving generalized linear model to find clusters of network connections that are significantly different between the groups. It controls the family‐wise error (FWE) rate in a weak‐sense by isolating the graph network components that significantly differ between the two groups, while performing mass‐univariate testing at every connection comprising the graph. A t‐test was used for the univariate testing at every connection of the graph to identify differences in DFA and DNUM between participant groups. A t‐statistic threshold between 2.7 and 3.8 was chosen empirically to define a set of suprathreshold edges with P < 0.05. Any connected component defined by the suprathreshold edges was identified. Five‐thousand permutations were performed, each time permuting the members of the two groups and storing the largest component at each permutation. This provided an estimate of the null distribution of the maximal network component. Finally, the P‐value was estimated for each observed component by finding the number of permutations for which the observed component was larger than the maximal component, and then normalizing by the total number of permutations. In this manner, FWE was controlled for each observed component based on its size instead of computationally intensive multiple comparisons being performed on each connection as in generic false‐discovery rate methods. In our experiments, the chosen t‐statistic thresholds were t = 3.7 for DFA, and t = 3.2 for DNUM and components with corrected P < 0.05 were retained.
High t‐thresholds ensured more confidence in the network differences and provided localised networks. In our experiments, we found that lower thresholds provided dense networks with high spatial coverage that was difficult to interpret clinically, while a threshold higher than t = 3.7 or t = 3.1 resulted in isolated connections.
Intra‐group correlations
Intra‐group correlations were done in the ASD group by relating MRI data with ADOS severity scores, calculated according to Gotham et al. [2009]. Using the list of AAL cortical regions (outlined from the network connections obtained from NBS), Mrtrix3 was used to mask the diffusion parameters (DNUM and DFA) by these AAL regions. Mrtrix3 was then used find the mean diffusion measure in that mask, leading to a mean DNUM and DFA for each of the 33 patients in each AAL region. Using the 26 ADOS severity scores, correlations between these mean diffusion measures and severity scores were performed in R statistical software for each AAL region.
RESULTS
Out of the 93 subjects enrolled from January 2012 to March 2014, 67 fulfilled our inclusion criteria and were recruited for the study. Nineteen patients were later excluded due to either low quality or incomplete MRI scans. The high incidence of incomplete MRI scans was due to the fact that the diffusion acquisitions required for the study were added at the end of the clinical scan and the decision to proceed was independently taken by the anaesthesiologist. The final cohort consisted of 48 subjects of whom 32 were diagnosed with ASD and 16 with other‐DD. All ASD subjects were diagnosed based on clinical observation, as from DSM‐IV TR criteria. Diagnosis was further supported by the results of ADOS‐G in 26/32 patients and ADOS‐toddler in 3 patients. The other‐DD group included subjects with intellectual disability (n = 10) or language disorder (n = 6) according to DSM‐IV‐TR criteria [American Psychiatric Association, 2000], in whom a co‐occurrent diagnosis of ASD had been ruled out. In all children, both in the ASD and in the other‐DD group, diagnosis was confirmed at an age of 36 months or higher (i.e., no subjects grew out of the original diagnosis).
Clinical characteristics of the participants are reported in Table 1.
Table 1.
Demographical and clinical characteristics of participants
| Characteristics | Measure | ASD (n = 32) | Other‐DD (n = 16) | P value |
|---|---|---|---|---|
| Gender (Male/Female) | Frequencies | 28/4 | 12/4 | ns |
| Age | mean (SD) | 26.1 (5.4) | 29.8 (5.8) | ns |
| Age range | months | 16‐36 | 20‐38 | |
| Non‐verbal DQ | mean (SD) | 77.1 (14.1) | 76.5 (28.0) | ns |
| ADOS score tot | mean (SD) | 14.9 (3.0) | n/a |
ASD: Autism Spectrum Disorder; Other‐DD: other Developmental Disorder; DQ: Developmental Quotient; ADOS: Autism Diagnostic Observation Schedule; SD: Standard Deviation.
Between‐Group Differences in Network Connections: Streamline Analysis
The group‐wise comparison of the network connections (NBS statistics) in terms of number of streamlines (DNUM) revealed significant differences between the groups.
Number of streamlines was increased in the ASD group, compared with the other‐DD group, in three distinct network components (Table 2 and Fig. 2). Network component 1 (P = 0.002) comprised 7 edges between 8 nodes in the left hemisphere and was centred on the left caudate (connections with left precentral gyrus and left superior, middle, inferior frontal gyri within the frontal lobe; left precuneus and middle occipital gyri within the occipital lobe; left putamen within the basal ganglia).
Table 2.
DNUM connections
| Network 1 (P = 0.002) | |
|---|---|
| Precentral_L | Caudate_L |
| Frontal_Sup_L | Caudate_L |
| Frontal_Mid_L | Caudate_L |
| Frontal_Inf_Tri_L | Caudate_L |
| Precuneus_L | Caudate_L |
| Occipital_Mid_L | Putamen_L |
| Caudate_L | Putamen_L |
| Network 2 (P = 0.005) | |
| Precentral_R | Caudate_R |
| Frontal_Sup_R | Caudate_R |
| Frontal_Mid_R | Caudate_R |
| Frontal_Inf_Tri_R | Caudate_R |
| Frontal_Inf_Orb_R | Caudate_R |
| Network 3 (P = 0.020) | |
| Parietal_Inf_L | Thalamus_L |
| SupraMarginal_R | Thalamus_L |
| Angular_L | Thalamus_L |
Figure 2.
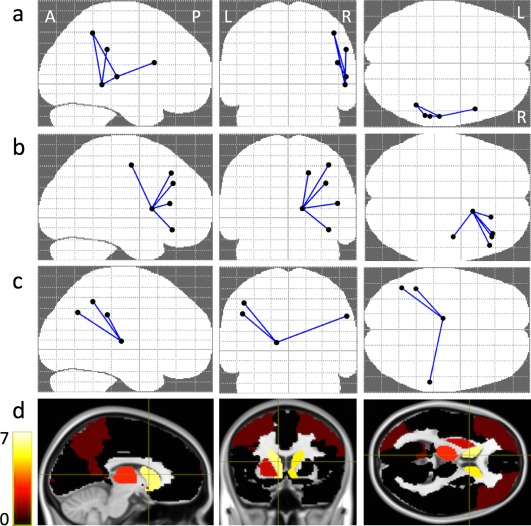
(a–c) NBS connectivity graph for DNUM in axial, coronal and sagittal views, identifying the 3 different networks (see text). (d) Color‐coded DNUM disconnectivity maps. The colours indicate the degree of disconnection of cortical/subcortical areas, “yellow” means a high degree and “black” means zero degree association. [Color figure can be viewed at http://wileyonlinelibrary.com]
Network component 2 (P = 0.005) comprised 5 edges between 6 nodes in the right hemisphere and was centred on right caudate (connections with right precentral gyrus and right middle, superior, inferior frontal gyri within the frontal lobe).
Network component 3 (P = 0.020) comprised 3 edges between 4 nodes, centred on left thalamus (connections with left inferior parietal, angular gyri and right supramarginal gyrus within the parietal lobe).
Between‐Group Differences in Network Connections: Fractional Anisotropy Analysis
The group‐wise comparison of the network connections (NBS statistics), in terms of FA values (DFA), revealed significant differences between ASD and other‐DD in three distinct network components, with higher values in ASD compared with other‐DD (Table 3 and Fig. 3). Network component 1 (P = 0.001) comprised 26 edges between 19 nodes and was centred on the left putamen (connection with left and right middle, superior, inferior frontal gyri, left anterior and middle cingulum gyri, right anterior cingulum gyrus and left olfactory gyrus within the frontal lobe; left rectus, precuneus, cuneus, middle occipital gyri and right rectus gyrus within the occipital lobe; left putamen, caudate, thalamus and right putamen within the basal ganglia; left and right parietal inferior gyri, left angular gyrus and right supramarginal gyrus within the parietal lobe; left and right insula, left middle, superior temporal gyri and right superior temporal gyrus within the temporal lobe).
Table 3.
DFA connections
| Network 1 (P = 0.001) | |
|---|---|
| Frontal_Mid_L | Frontal_Inf_Orb_L |
| Frontal_Mid_R | Frontal_Inf_Orb_R |
| Frontal_Sup_L | Frontal_Sup_Medial_L |
| Frontal_Inf_Orb_L | Frontal_Sup_Medial_L |
| Frontal_Sup_R | Frontal_Sup_Medial_R |
| Frontal_Mid_Orb_R | Frontal_Sup_Medial_R |
| Frontal_Inf_Orb_R | Frontal_Sup_Medial_R |
| Frontal_Sup_Orb_L | Frontal_Mid_Orb_L |
| Frontal_Inf_Orb_L | Frontal_Mid_Orb_L |
| Frontal_Sup_L | Rectus_L |
| Frontal_Sup_Orb_L | Rectus_L |
| Frontal_Sup_R | Rectus_R |
| Frontal_Mid_Orb_R | Rectus_R |
| Frontal_Mid_Orb_L | Insula_L |
| Frontal_Mid_Orb_L | Insula_L |
| Rectus_L | Insula_L |
| Frontal_Mid_Orb_R | Insula_R |
| Frontal_Mid_Orb_R | Cingulum_Ant_R |
| Frontal_Inf_Orb_R | Cingulum_Ant_R |
| Frontal_Sup_Medial_L | Cingulum_Mid_L |
| Cingulum_Mid_L | Cuneus_L |
| Precentral_L | Caudate_L |
| Frontal_Sup_L | Caudate_L |
| Frontal_Mid_L | Caudate_L |
| Frontal_Inf_Tri_L | Caudate_L |
| Frontal_Inf_Orb_L | Caudate_L |
| Olfactory_L | Caudate_L |
| Frontal_Mid_Orb_L | Caudate_L |
| Precuneus_L | Caudate_L |
| Precentral_R | Caudate_R |
| Frontal_Sup_R | Caudate_R |
| Frontal_Mid_R | Caudate_R |
| Frontal_Mid_Orb_R | Caudate_R |
| Frontal_Inf_Tri_R | Caudate_R |
| Frontal_Inf_Orb_R | Caudate_R |
| Rectus_R | Caudate_R |
| Frontal_Sup_Orb_L | Putamen_L |
| Frontal_Mid_Orb_L | Putamen_L |
| Frontal_Inf_Orb_L | Putamen_L |
| Olfactory_L | Putamen_L |
| Frontal_Mid_Orb_L | Putamen_L |
| Rectus_L | Putamen_L |
| Cingulum_Ant_L | Putamen_L |
| Occipital_Mid_L | Putamen_L |
| Caudate_L | Putamen_L |
| Frontal_Mid_Orb_R | Putamen_R |
| Rectus_R | Putamen_R |
| Parietal_Inf_L | Thalamus_L |
| SupraMarginal_R | Thalamus_L |
| Angular_L | Thalamus_L |
| Frontal_Inf_Oper_R | Temporal_Sup_R |
| Parietal_Inf_R | Temporal_Sup_R |
| Cingulum_Mid_L | Temporal_Mid_L |
| Angular_L | Temporal_Mid_L |
| Temporal_Sup_L | Temporal_Mid_L |
| Temporal_Pole_Sup_L | Temporal_Mid_L |
| Network 2 (P = 0.002) | |
| Frontal_Sup_Orb_R | Frontal_Mid_Orb_R |
| Frontal_Mid_R | Frontal_Mid_Orb_R |
| Frontal_Sup_Orb_R | Frontal_Inf_Tri_R |
| Frontal_Mid_Orb_R | Frontal_Inf_Tri_R |
| Frontal_Mid_R | Frontal_Inf_Orb_R |
| Frontal_Sup_R | Frontal_Sup_Medial_R |
| Frontal_Mid_Orb_R | Frontal_Sup_Medial_R |
| Frontal_Inf_Orb_R | Frontal_Sup_Medial_R |
| Frontal_Sup_R | Rectus_R |
| Frontal_Mid_Orb_R | Rectus_R |
| Frontal_Mid_Orb_R | Insula_R |
| Frontal_Mid_Orb_R | Cingulum_Ant_R |
| Frontal_Inf_Orb_R | Cingulum_Ant_R |
| Frontal_Mid_Orb_R | Caudate_R |
| Frontal_Inf_Orb_R | Caudate_R |
| Rectus_R | Caudate_R |
| Frontal_Mid_Orb_R | Putamen_R |
| Rectus_R | Putamen_R |
| Network 3 (P = 0.007) | |
| Frontal_Inf_Oper_R | Temporal_Sup_R |
| Parietal_Inf_R | Temporal_Sup_R |
| Parietal_Inf_R | Temporal_Mid_R |
| SupraMarginal_R | Temporal_Mid_R |
| Temporal_Sup_R | Temporal_Mid_R |
Figure 3.
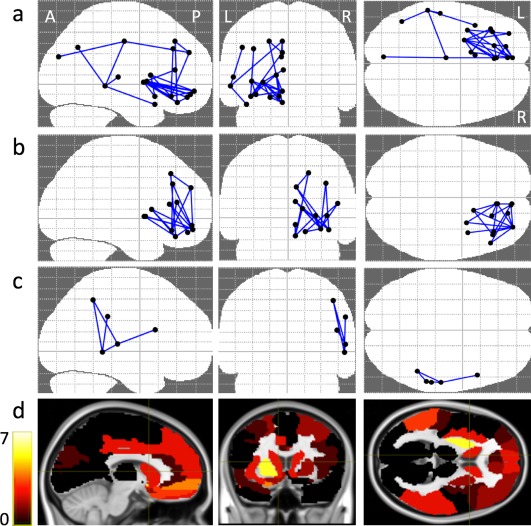
(a–c) NBS connectivity graph for DFA in axial, coronal and sagittal views, identifying the three different networks (see text). (d) Color‐coded DFA disconnectivity maps. The colours indicate the degree of disconnection of cortical/subcortical areas, “yellow” means a high degree and “black” means zero degree association. [Color figure can be viewed at http://wileyonlinelibrary.com]
Network component 2 (P = 0.002) comprised 18 edges between 13 nodes primarily distributed in the right frontal lobe and was centred on right frontal middle orbital gyrus (connections with left, right superior, middle, inferior frontal gyri and right anterior cingulum gyrus within the frontal lobe; right rectus gyrus within the occipital lobe; right insula in the temporal lobe; right putamen and caudate within the basal ganglia).
Network component 3 (P = 0.007) comprised 5 edges between 5 nodes and was centred on right middle and superior temporal (connections with right inferior frontal gyrus in the frontal lobe; right inferior parietal and supramarginal gyri within the parietal lobe; right middle, superior temporal gyri in the temporal lobe).
Intra‐Group Correlations
ADOS severity score was available in all subjects who performed the ADOS (n = 26), and were used for the analysis. Three significant correlations (P < 0.05) between diffusion indexes and severity scores were found: one positive correlation in tract connecting left superior medial frontal gyrus to left middle cingulum gyrus (P 0.023) and one negative correlation in the tract connecting right inferior frontal gyrus to right caudate (P 0.042) in DNUM analysis; one negative correlation in the tract connecting left olfactory gyrus to left caudate (P 0.034) in DFA analysis. None of the above correlation remained significant after correcting for multiple comparisons.
DISCUSSION
To our knowledge, this study is the first to employ a network‐based structural connectivity approach to assess brain connectivity differences in toddlers with ASD compared with peers with other developmental disorders (other‐DD), as the only previous study using diffusion imaging [Xiao et al., 2014] employed voxel‐based analysis, thus focussing on brain regions rather than connections.
The main finding of our study is the detection of an over‐connectivity pattern in ASD toddlers expressed by the number of streamlines or by the average fractional anisotropy of the connections for several brain networks, while no significant contra‐comparison results were found. This is in accordance with the existing literature exploring brain structural connectivity in toddlers with ASD, showing an overall tendency to brain over‐connectivity in ASD versus typically developing peers, observed at around 30 months of age, when autistic features start to be clinically detected, or even before [Conti et al., 2015]. Recently Solso et al. [2016], based on diffusion studies, reported an over‐connectivity pattern in ASD toddlers within the frontal projection of the superior cortico‐striatal tract, in the inferior frontal occipital tract, in the inferior frontal superior frontal tract and inferior longitudinal fasciculus and theorized ASD as an “early over‐connectivity disorder” in opposition to the previous “under‐connectivity theory” formulated by Just et al. [2004], mainly based on functional studies. Indeed, the over‐connectivity pattern has been widely associated to early brain overgrowth, extensively reported in the literature [Courchesne and Pierce, 2005a], with prominent and lasting effects on frontal white matter structures [Herbert et al., 2003; Radua et al., 2011]. This is increasingly interpreted as a connectivity disruption process that gives rise to recurrent patterns of under‐connectivity at a later age [Just et al., 2004], consistent with chronic altered white matter development, reduced white matter organization and integrity and possibly impaired myelination [Beaulieu, 2002; Klawiter et al., 2011].
Our analysis of fractional anisotropy as well as of the number of streamlines show higher connectivity in the ASD group within networks centred on frontal and temporal gyri and basal ganglia, thus corroborating previous reports comparing ASD and other‐DD. Indeed, Xiao et al. [2014] performed a VBM and voxel based DTI analysis comparing toddlers with ASD and those with other developmental delay, with clinical characteristics highly similar to those of our samples (in terms of age range, sample size and type of other developmental concerns). They reported higher FA values within the limbic lobe and higher volumes of the temporal lobes in ASD, supporting the hypothesis of a specific early disruption of brain maturation of these regions in ASD. Indeed, networks involving the temporal lobe and the striatum have been specifically implicated in certain symptoms of ASD such as social/emotional [Adolphs et al., 2001], and stereotypic/repetitive behaviour [Langen et al., 2014], respectively. However, it has been recently hypothesized that abnormalities of striatal function are involved not only in stereotyped routines and repetitive movements, but also in a variety of clinical manifestations typical of patients with ASD, such as altered processing of sensory stimuli, abnormal social approach and reduced response to rewarding stimuli [Fuccillo, 2016]. Functional connectivity studies have also suggested that communication between these nodes may be suboptimal in autism [Minshew and Keller, 2010; Noonan et al., 2009]. Many other studies demonstrated that social cognition mediated by the temporal lobe is among the most fundamental deficits in ASD [Ameis and Catani, 2015] .
Other nodes emerging from our analysis as being important to differentiate ASD and other‐DD are the cingulate and the caudate/putamen nuclei. Higher FA values related to cingulum in ASD versus other‐DD were also found by Xiao et al. [2014] while higher FA values in the same regions in ASD versus typical subjects have been reported in other studies investigating young children [Ben Bashat et al., 2007; Billeci et al., 2012; Weinstein et al., 2011]. This is not surprising as the cingulum is considered as a key region for socio‐communicative skill development and its alteration in ASD has been widely reported also in older subjects [Ameis et al., 2013; Hoppenbrouwers et al., 2014; Ikuta et al., 2014]. Little evidence from DTI studies exists on the basal ganglia networks, even if volumetric MRI studies indicate those regions as presenting higher volumes and being related to repetitive symptoms of ASD [Calderoni et al., 2014]. Higher FA values have been detected within the putamen in adolescents [Cheng et al., 2010] and school‐age children [Brito et al., 2009], while Langen et al. [2012] found that adults with autism had a significantly smaller total brain white matter volume, lower fractional anisotropy of white matter tracts connecting putamen to frontal cortical areas, higher mean diffusivity of white matter tracts connecting accumbens to frontal cortex. These findings however are difficult to compare with ours as they are based on older children or adults.
Lots of connections emerging from our analysis, especially in the DFA results are distributed within the frontal lobes, being part of fronto‐striatal tracts or intra‐frontal tract or fronto‐occipital tracts. This is in keeping with the early overconnectivity/disruption theory of Solso et al. [2016] who reported higher FA values and volumes in frontal fibre tracts in young children (aged 1–4 years) with ASD in comparison with typical toddlers. Other authors have reported alterations in the frontal lobe [Courchesne and Pierce, 2005b; Geschwind and Levitt, 2007; Just et al., 2012], in particular considering the pars opercularis of the inferior frontal gyrus, previously reported as hypo‐connected (lower FA values) in autistic subjects of older age [Ke et al., 2009; Lo et al., 2011].
It is of interest that postmortem studies reported an early alteration in neuronal proliferation, migration, maturation and organization in prefrontal and temporal regions of children with ASD [Stoner et al., 2014; Wegiel et al., 2010]. In particular, an increase in total neuronal number within the prefrontal cortex of ASD patients (2–16 years) has been detected [Courchesne et al., 2011b] as well as a reduction in pyramidal neuron size within the anterior mid cingulate cortex of young children with ASD that may interfere with an efficient connectivity involving this region [Uppal et al., 2014].
When correlating the diffusion indexes with clinical severity within the ASD subgroup, we found few significant correlations, which however did not hold true after correcting for multiple comparisons. This might be due to the small sample size or to the sensitivity of the scale used to assess severity. Our findings are also difficult to compare to others', as there are no other network based diffusion studies exploring correlation between diffusion indexes and ASD severity at this age. Previous diffusion studies based on voxel based techniques reported negative correlations of Fractional Anisotropy (FA) and symptom expression in fronto‐striatal temporal pathways and posterior brain pathways [Cheung et al., 2009]; other studies based on DTI [Poustka et al., 2012] reported negative correlation between FA with ASD severity in fronto‐temporal pathways.
An important limitation of our study concerns the lack of gender balance between the two clinical groups, which however reflects the epidemiological distribution of the disorders in the two groups. Indeed, sexual dimorphisms in diffusion properties have been observed in some WM tracts (e.g. left cingulum bundle, right inferior fronto‐occipital fasciculus, left inferior longitudinal fasciculus and right uncinated fasciculus) of young children with typical development [Johnson et al., 2013] as well as in the corpora callosa of preschoolers with ASD [Nordahl et al., 2015]. Future DTI investigations in larger groups evaluating separately males and females with ASD are needed in order to provide new insights into possible sex differences in structural brain connectivity. Furthermore, in our study we did not include a control group of typically developing toddlers since ethical considerations did not allow us to perform MRI scans under general anaesthesia in young children for research purposes only. Indeed, in order to perform a reliable analysis and interpretation of imaging data it is important to select controls scanned under sedation and therefore comparable with ASD patients in terms of head motion [Walker et al., 2012]. Future investigations in which subjects would be acquired during natural sleep may overcome this critical aspect [Nordahl et al., 2008].
Although the absence of a control group makes it impossible to directly investigate the differences and the peculiarities of ASD and other‐DD structural connectivity with respect to typically developing infants, some conclusions can be drawn by relating our findings to the literature comparing typically developing children with other‐DD. The few studies exploring the differences in diffusion in children with neurodevelopmental disorders other than ASD, compared with typically developing ones, are consistent in reporting an overall alteration in diffusion parameters. DTI in preschool children with developmental delay showed decreases in anisotropy in several white matter fibre tracts in the centrum semiovale, corona radiata, internal capsule, corpus callosum and frontal and parieto‐occipital subcortical white matter [Filippi et al., 2003]. A reduction in FA values within the corpus callosum was also reported in children aged 1‐9 years with developmental delay, likely reflecting an overall reduction of inter‐hemispheric connectivity [Ding et al., 2009]. Consistent with these findings, tractography studies reported reduced FA in several tracts of the other‐DD brains, including the right uncinate fasciculus, the cingulum and the inferior fronto‐occipital fasciculus [Kumar et al., 2010]. A specific abnormality of the arcuate fasciculus and particularly of its temporal bundle has been also described in children with developmental delay [Sundaram et al., 2008]. In the light of these studies that consistently reported reduced connectivity in young children with developmental delay, it is not surprising that in our study we found significant differences between other‐DD and ASD only in the direction of over‐connectivity in the latter.
CONCLUSIONS
In conclusion, our findings suggest that at an early stage, when ASD symptoms are emerging and becoming apparent, an over‐connectivity pattern represents a specific finding in toddlers with ASD, differentiating them from those with other developmental delays. More specifically, ASD over‐connectivity is observed in networks centred on temporal gyri, striatal regions, frontal and cingulum gyri, all known to be involved in social‐skills development and executive functions. Further studies, with larger cohorts and healthy control groups, are needed to confirm our findings in order to clarify their translational meaning, and ascertain the complex underpinnings of ASD at the age of onset. Moreover, correlation with multifunctional assessments (e.g., adaptive functioning, receptive language abilities and repetitive behaviour) will contribute to shed light on the structural underpinnings of the different dimensional components of neurodevelopmental disabilities.
REFERENCES
- Adolphs R, Sears L, Piven J (2001): Abnormal processing of social information from faces in autism. J Cogn Neurosci 13:232–240. [DOI] [PubMed] [Google Scholar]
- Ameis SH, Catani M (2015): Altered white matter connectivity as a neural substrate for social impairment in Autism Spectrum Disorder. Cortex 62:158–181. [DOI] [PubMed] [Google Scholar]
- Ameis SH, Fan J, Rockel C, Soorya L, Wang AT, Anagnostou E (2013): Altered cingulum bundle microstructure in autism spectrum disorder. Acta Neuropsychiatr 25:275–282. [DOI] [PubMed] [Google Scholar]
- American Psychiatric Association (2000): Diagnostic Criteria From DSM‐IV‐TR. Washington, D.C: American Psychiatric Association. 370 p. [Google Scholar]
- American Psychiatric Association (2013): Diagnostic and Statistical Manual of Mental Disorders, 5th ed Arlington, VA: American Psychiatric Publishing. [Google Scholar]
- Andersson JL, Sotiropoulos SN (2016): An integrated approach to correction for off‐resonance effects and subject movement in diffusion MR imaging. NeuroImage 125:1063–1078. [DOI] [PMC free article] [PubMed] [Google Scholar]
- Avants BB, Tustison NJ, Song G, Cook PA, Klein A, Gee JC (2011): A reproducible evaluation of ANTs similarity metric performance in brain image registration. NeuroImage 54:2033–2044. [DOI] [PMC free article] [PubMed] [Google Scholar]
- Bai Y, Alexander D (2008): Model‐based registration to correct for motion between acquisitions in diffusion MR imaging. In: IEEE Intl. Symposium on Biomedical imaging: From nano to macro. pp. 947–950.
- Barbaro J, Dissanayake C (2009): Autism spectrum disorders in infancy and toddlerhood: A review of the evidence on early signs, early identification tools, and early diagnosis. J Dev Behav Pediatrics: JDBP 30:447–459. [DOI] [PubMed] [Google Scholar]
- Barbaro J, Dissanayake C (2012): Developmental profiles of infants and toddlers with autism spectrum disorders identified prospectively in a community‐based setting. J Autism Dev Disord 42:1939–1948. [DOI] [PubMed] [Google Scholar]
- Beaulieu C (2002): The basis of anisotropic water diffusion in the nervous system ‐ a technical review. NMR Biomed 15:435–455. [DOI] [PubMed] [Google Scholar]
- Bedford R, Jones EJ, Johnson MH, Pickles A, Charman T, Gliga T (2016): Sex differences in the association between infant markers and later autistic traits. Mol Autism 7:21. [DOI] [PMC free article] [PubMed] [Google Scholar]
- Ben Bashat D, Kronfeld‐Duenias V, Zachor DA, Ekstein PM, Hendler T, Tarrasch R, Even A, Levy Y, Ben Sira L (2007): Accelerated maturation of white matter in young children with autism: A high b value DWI study. NeuroImage 37:40–47. [DOI] [PubMed] [Google Scholar]
- Billeci L, Calderoni S, Tosetti M, Catani M, Muratori F (2012): White matter connectivity in children with autism spectrum disorders: A tract‐based spatial statistics study. BMC Neurol 12:148. [DOI] [PMC free article] [PubMed] [Google Scholar]
- Brito AR, Vasconcelos MM, Domingues RC, Hygino da Cruz LC, Jr. , Rodrigues Lde S, Gasparetto EL, Calcada CA (2009): Diffusion tensor imaging findings in school‐aged autistic children. J Neuroimaging 19:337–343. [DOI] [PubMed] [Google Scholar]
- Calderoni S, Bellani M, Hardan AY, Muratori F, Brambilla P (2014): Basal ganglia and restricted and repetitive behaviours in Autism Spectrum Disorders: Current status and future perspectives. Epidemiol Psychiatric Sci 23:235–238. [DOI] [PMC free article] [PubMed] [Google Scholar]
- Cascio C, Gribbin M, Gouttard S, Smith RG, Jomier M, Field S, Graves M, Hazlett HC, Muller K, Gerig G, Piven J (2013): Fractional anisotropy distributions in 2‐ to 6‐year‐old children with autism. J Intellect Disabil Res JIDR 57:1037–1049. [DOI] [PMC free article] [PubMed] [Google Scholar]
- CDC (2014): Centers for disease control and prevention. prevalence of autism spectrum disorder among children aged 8 years — autism and developmental disabilities monitoring network, 11 sites, United States, 2010. MMWR Surveill Summ 63:1–21. [PubMed] [Google Scholar]
- Chawarska K, Shic F (2009): Looking but not seeing: Atypical visual scanning and recognition of faces in 2 and 4‐year‐old children with autism spectrum disorder. J Autism Dev Disord 39:1663–1672. [DOI] [PMC free article] [PubMed] [Google Scholar]
- Chawarska K, Shic F, Macari S, Campbell DJ, Brian J, Landa R, Hutman T, Nelson CA, Ozonoff S, Tager‐Flusberg H, Young GS, Zwaigenbaum L, Cohen IL, Charman T, Messinger DS, Klin A, Johnson S, Bryson S (2014): 18‐month predictors of later outcomes in younger siblings of children with autism spectrum disorder: A baby siblings research consortium study. J Am Acad Child Adolesc Psychiatry 53:1317–1327 e1. [DOI] [PMC free article] [PubMed] [Google Scholar]
- Cheng Y, Chou KH, Chen IY, Fan YT, Decety J, Lin CP (2010): Atypical development of white matter microstructure in adolescents with autism spectrum disorders. NeuroImage 50:873–882. [DOI] [PubMed] [Google Scholar]
- Cheung C, Chua SE, Cheung V, Khong PL, Tai KS, Wong TK, Ho TP, McAlonan GM (2009): White matter fractional anisotrophy differences and correlates of diagnostic symptoms in autism. J Child Psychol Psychiatry Allied Discipl 50:1102–1112. [DOI] [PubMed] [Google Scholar]
- Conti E, Calderoni S, Marchi V, Muratori F, Cioni G, Guzzetta A (2015): The first 1000 days of the autistic brain: A systematic review of diffusion imaging studies. Front Hum Neurosci 9:159. [DOI] [PMC free article] [PubMed] [Google Scholar]
- Courchesne E, Pierce K (2005a): Brain overgrowth in autism during a critical time in development: Implications for frontal pyramidal neuron and interneuron development and connectivity. Int J Dev Neurosci 23:153–170. [DOI] [PubMed] [Google Scholar]
- Courchesne E, Pierce K (2005b): Why the frontal cortex in autism might be talking only to itself: Local over‐connectivity but long‐distance disconnection. Curr Opin Neurobiol 15:225–230. [DOI] [PubMed] [Google Scholar]
- Courchesne E, Campbell K, Solso S (2011a): Brain growth across the life span in autism: Age‐specific changes in anatomical pathology. Brain Res 1380:138–145. [DOI] [PMC free article] [PubMed] [Google Scholar]
- Courchesne E, Mouton PR, Calhoun ME, Semendeferi K, Ahrens‐Barbeau C, Hallet MJ, Barnes CC, Pierce K (2011b): Neuron number and size in prefrontal cortex of children with autism. Jama 306:2001–2010. [DOI] [PubMed] [Google Scholar]
- Dawson G (2008): Early behavioral intervention, brain plasticity, and the prevention of autism spectrum disorder. Dev Psychopathol 20:775–803. [DOI] [PubMed] [Google Scholar]
- Ding XQ, Sun Y, Kruse B, Illies T, Zeumer H, Fiehler J, Lanfermann H (2009): Microstructural callosal abnormalities in normal‐appearing brain of children with developmental delay detected with diffusion tensor imaging. Eur Radiol 19:1537–1543. [DOI] [PubMed] [Google Scholar]
- Elison JT, Paterson SJ, Wolff JJ, Reznick JS, Sasson NJ, Gu H, Botteron KN, Dager SR, Estes AM, Evans AC, Gerig G, Hazlett HC, Schultz RT, Styner M, Zwaigenbaum L, Piven J, Network I (2013): White matter microstructure and atypical visual orienting in 7‐month‐olds at risk for autism. Am J Psychiatry 170:899–908. [DOI] [PMC free article] [PubMed] [Google Scholar]
- Feng G, Burton N, Hill B, Davidson D, Kerwin J, Scott M, Lindsay S, Baldock R (2005): JAtlasView: A Java atlas‐viewer for browsing biomedical 3D images and atlases. BMC Bioinform 6:47. [DOI] [PMC free article] [PubMed] [Google Scholar]
- Filippi CG, Lin DD, Tsiouris AJ, Watts R, Packard AM, Heier LA, Ulug AM (2003): Diffusion‐tensor MR imaging in children with developmental delay: Preliminary findings. Radiology 229:44–50. [DOI] [PubMed] [Google Scholar]
- Fuccillo MV (2016): Striatal circuits as a common node for autism pathophysiology. Front Neurosci 10:27. [DOI] [PMC free article] [PubMed] [Google Scholar]
- Geschwind DH, Levitt P (2007): Autism spectrum disorders: Developmental disconnection syndromes. Curr Opin Neurobiol 17:103–111. [DOI] [PubMed] [Google Scholar]
- Gotham K, Pickles A, Lord C (2009): Standardizing ADOS scores for a measure of severity in autism spectrum disorders. J Autism Dev Disord 39:693–705. [DOI] [PMC free article] [PubMed] [Google Scholar]
- Greve DN, Fischl B (2009): Accurate and robust brain image alignment using boundary‐based registration. NeuroImage 48:63–72. [DOI] [PMC free article] [PubMed] [Google Scholar]
- Herbert MR, Ziegler DA, Deutsch CK, O'Brien LM, Lange N, Bakardjiev A, Hodgson J, Adrien KT, Steele S, Makris N, Kennedy D, Harris GJ, Caviness VS Jr (2003): Dissociations of cerebral cortex, subcortical and cerebral white matter volumes in autistic boys. Brain 126:1182–1192. [DOI] [PubMed] [Google Scholar]
- Hoppenbrouwers M, Vandermosten M, Boets B (2014): Autism as a disconnection syndrome: A qualitative and quantitative review of diffusion tensor imaging studies. Res Autism Spect Dis 8:387–412. [Google Scholar]
- Ikuta T, Shafritz KM, Bregman J, Peters BD, Gruner P, Malhotra AK, Szeszko PR (2014): Abnormal cingulum bundle development in autism: A probabilistic tractography study. Psychiatry Res 221:63–68. [DOI] [PMC free article] [PubMed] [Google Scholar]
- Johnson RT, Yeatman JD, Wandell BA, Buonocore MH, Amaral DG, Nordahl CW (2013): Diffusion properties of major white matter tracts in young, typically developing children. NeuroImage 88C:143–154. [DOI] [PMC free article] [PubMed] [Google Scholar]
- Just MA, Cherkassky VL, Keller TA, Minshew NJ (2004): Cortical activation and synchronization during sentence comprehension in high‐functioning autism: Evidence of underconnectivity. Brain 127:1811–1821. [DOI] [PubMed] [Google Scholar]
- Just MA, Keller TA, Malave VL, Kana RK, Varma S (2012): Autism as a neural systems disorder: A theory of frontal‐posterior underconnectivity. Neurosci Biobehav Rev 36:1292–1313. [DOI] [PMC free article] [PubMed] [Google Scholar]
- Ke X, Tang T, Hong S, Hang Y, Zou B, Li H, Zhou Z, Ruan Z, Lu Z, Tao G, Liu Y (2009): White matter impairments in autism, evidence from voxel‐based morphometry and diffusion tensor imaging. Brain Res 1265:171–177. [DOI] [PubMed] [Google Scholar]
- Klawiter EC, Schmidt RE, Trinkaus K, Liang HF, Budde MD, Naismith RT, Song SK, Cross AH, Benzinger TL (2011): Radial diffusivity predicts demyelination in ex vivo multiple sclerosis spinal cords. NeuroImage 55:1454–1460. [DOI] [PMC free article] [PubMed] [Google Scholar]
- Kumar A, Sundaram SK, Sivaswamy L, Behen ME, Makki MI, Ager J, Janisse J, Chugani HT, Chugani DC (2010): Alterations in frontal lobe tracts and corpus callosum in young children with autism spectrum disorder. Cereb Cortex 20:2103–2113. [DOI] [PubMed] [Google Scholar]
- Langen M, Leemans A, Johnston P, Ecker C, Daly E, Murphy CM, Dell'acqua F, Durston S, Consortium A, Murphy DG (2012): Fronto‐striatal circuitry and inhibitory control in autism: Findings from diffusion tensor imaging tractography. Cortex 48:183–193. [DOI] [PubMed] [Google Scholar]
- Langen M, Bos D, Noordermeer SD, Nederveen H, van Engeland H, Durston S (2014): Changes in the development of striatum are involved in repetitive behavior in autism. Biol Psychiatry 76:405–411. [DOI] [PubMed] [Google Scholar]
- Leemans A, Jones DK (2009): The B‐matrix must be rotated when correcting for subject motion in DTI data. Magn Reson Med 61:1336–1349. [DOI] [PubMed] [Google Scholar]
- Lewis JD, Elman JL (2008): Growth‐related neural reorganization and the autism phenotype: A test of the hypothesis that altered brain growth leads to altered connectivity. Dev Sci 11:135–155. [DOI] [PMC free article] [PubMed] [Google Scholar]
- Lo YC, Soong WT, Gau SS, Wu YY, Lay MC, Yeh FC, Chiang WY, Kuo LW, Jaw FS, Tseng WY (2011): The loss of asymmetry and reduced interhemispheric connectivity in adolescents with autism: A study using diffusion spectrum imaging tractography. Psychiatry Res 192:60–66. [DOI] [PubMed] [Google Scholar]
- Lord C, Risi S, Lambrecht L, Cook EH, Jr. , Leventhal BL, DiLavore PC, Pickles A, Rutter M (2000): The autism diagnostic observation schedule‐generic: A standard measure of social and communication deficits associated with the spectrum of autism. J Autism Dev Disord 30:205–223. [PubMed] [Google Scholar]
- Luyster R, Gotham K, Guthrie W, Coffing M, Petrak R, Pierce K, Bishop S, Esler A, Hus V, Oti R, Richler J, Risi S, Lord C (2009): The Autism Diagnostic Observation Schedule‐toddler module: A new module of a standardized diagnostic measure for autism spectrum disorders. J Autism Dev Disord 39:1305–1320. [DOI] [PMC free article] [PubMed] [Google Scholar]
- Manjon JV, Coupe P (2016): volBrain: An online MRI brain volumetry system. Front Neuroinform 10:30. [DOI] [PMC free article] [PubMed] [Google Scholar]
- Minshew NJ, Keller TA (2010): The nature of brain dysfunction in autism: Functional brain imaging studies. Curr Opin Neurol 23:124–130. [DOI] [PMC free article] [PubMed] [Google Scholar]
- Mitchell S, Cardy JO, Zwaigenbaum L (2011): Differentiating autism spectrum disorder from other developmental delays in the first two years of life. Dev Disabil Res Rev 17:130–140. [DOI] [PubMed] [Google Scholar]
- Morris D, Nossin‐Manor R, Taylor MJ, Sled JG (2011): Preterm neonatal diffusion processing using detection and replacement of outliers prior to resampling. Magn Reson Med 66:92–101. [DOI] [PubMed] [Google Scholar]
- Muratori F, Calderoni S, Apicella F, Filippi T, Santocchi E, Calugi S, Cosenza A, Tancredi R, Narzisi A (2012): Tracing back to the onset of abnormal head circumference growth in Italian children with autism spectrum disorder. Res Autism Spectr Disord 6:442–449. [Google Scholar]
- Noonan SK, Haist F, Muller RA (2009): Aberrant functional connectivity in autism: Evidence from low‐frequency BOLD signal fluctuations. Brain Res 1262:48–63. [DOI] [PMC free article] [PubMed] [Google Scholar]
- Nordahl CW, Simon TJ, Zierhut C, Solomon M, Rogers SJ, Amaral DG (2008): Brief report: Methods for acquiring structural MRI data in very young children with autism without the use of sedation. J Autism Dev Disord 38:1581–1590. [DOI] [PMC free article] [PubMed] [Google Scholar]
- Nordahl CW, Iosif AM, Young GS, Perry LM, Dougherty R, Lee A, Li D, Buonocore MH, Simon T, Rogers S, Wandell B, Amaral DG (2015): Sex differences in the corpus callosum in preschool‐aged children with autism spectrum disorder. Mol Autism 6:26. [DOI] [PMC free article] [PubMed] [Google Scholar]
- Pannek K, Guzzetta A, Colditz PB, Rose SE (2012a): Diffusion MRI of the neonate brain: Acquisition, processing and analysis techniques. Pediatric Radiol 42:1169–1182. [DOI] [PubMed] [Google Scholar]
- Pannek K, Raffelt D, Bell C, Mathias JL, Rose SE (2012b): HOMOR: Higher order model outlier rejection for high b‐value MR diffusion data. NeuroImage 63:835–842. [DOI] [PubMed] [Google Scholar]
- Patenaude B, Smith SM, Kennedy DN, Jenkinson M (2011): A Bayesian model of shape and appearance for subcortical brain segmentation. NeuroImage 56:907–922. [DOI] [PMC free article] [PubMed] [Google Scholar]
- Pickles A, Le Couteur A, Leadbitter K, Salomone E, Cole‐Fletcher R, Tobin H, Gammer I, Lowry J, Vamvakas G, Byford S, Aldred C, Slonims V, McConachie H, Howlin P, Parr JR, Charman T, Green J (2016): Parent‐mediated social communication therapy for young children with autism (PACT): long‐term follow‐up of a randomised controlled trial. Lancet 388:2501–2509. [DOI] [PMC free article] [PubMed] [Google Scholar]
- Poustka L, Jennen‐Steinmetz C, Henze R, Vomstein K, Haffner J, Sieltjes B (2012): Fronto‐temporal disconnectivity and symptom severity in children with autism spectrum disorder. World J Biol Psychiatry 13:269–280. [DOI] [PubMed] [Google Scholar]
- Radua J, Via E, Catani M, Mataix‐Cols D (2011): Voxel‐based meta‐analysis of regional white‐matter volume differences in autism spectrum disorder versus healthy controls. Psychol Med 41:1539–1550. [DOI] [PubMed] [Google Scholar]
- Rohde GK, Barnett AS, Basser PJ, Marenco S, Pierpaoli C (2004): Comprehensive approach for correction of motion and distortion in diffusion‐weighted MRI. Magn Reson Med 51:103–114. [DOI] [PubMed] [Google Scholar]
- Sacco R, Gabriele S, Persico AM (2015): Head circumference and brain size in autism spectrum disorder: A systematic review and meta‐analysis. Psychiatry Res 234:239–251. [DOI] [PubMed] [Google Scholar]
- Salomone E, Charman T, McConachie H, Warreyn P (2015): Child's verbal ability and gender are associated with age at diagnosis in a sample of young children with ASD in Europe. Child Care Health Dev 42:141–145. [DOI] [PubMed] [Google Scholar]
- Sled JG, Zijdenbos AP, Evans AC (1998): A nonparametric method for automatic correction of intensity nonuniformity in MRI data. IEEE Trans Med Imaging 17:87–97. [DOI] [PubMed] [Google Scholar]
- Smith RE, Tournier JD, Calamante F, Connelly A (2012): Anatomically‐constrained tractography: Improved diffusion MRI streamlines tractography through effective use of anatomical information. NeuroImage 62:1924–1938. [DOI] [PubMed] [Google Scholar]
- Smith RE, Tournier JD, Calamante F, Connelly A (2013): SIFT: Spherical‐deconvolution informed filtering of tractograms. NeuroImage 67:298–312. [DOI] [PubMed] [Google Scholar]
- Solso S, Xu R, Proudfoot J, Hagler DJ, Jr ., Campbell K, Venkatraman V, Carter Barnes C, Ahrens‐Barbeau C, Pierce K, Dale A, Eyler L, Courchesne E (2016): Diffusion tensor imaging provides evidence of possible axonal overconnectivity in frontal lobes in autism spectrum disorder toddlers. Biol Psychiatry 79:676–684. [DOI] [PMC free article] [PubMed] [Google Scholar]
- Stoner R, Chow ML, Boyle MP, Sunkin SM, Mouton PR, Roy S, Wynshaw‐Boris A, Colamarino SA, Lein ES, Courchesne E (2014): Patches of disorganization in the neocortex of children with autism. N Engl J Med 370:1209–1219. [DOI] [PMC free article] [PubMed] [Google Scholar]
- Sundaram SK, Sivaswamy L, Makki MI, Behen ME, Chugani HT (2008): Absence of arcuate fasciculus in children with global developmental delay of unknown etiology: A diffusion tensor imaging study. J Pediatrics 152:250–255. [DOI] [PubMed] [Google Scholar]
- Tournier JD, Calamante F, Connelly A (2007): Robust determination of the fiber orientation distribution in diffusion MRI: Non‐negativity constrained super‐resolved spherical deconvolution. NeuroImage 35:1459–1472. [DOI] [PubMed] [Google Scholar]
- Tournier JD, Calamante F, Connelly A (2012): MRtrix: Diffusion tractography in crossing fiber regions. Int J Imaging Syst Technol 22:53–66. [Google Scholar]
- Turner LM, Stone WL, Pozdol SL, Coonrod EE (2006): Follow‐up of children with autism spectrum disorders from age 2 to age 9. Autism 10:243–265. [DOI] [PubMed] [Google Scholar]
- Uppal N, Wicinski B, Buxbaum JD, Heinsen H, Schmitz C, Hof PR (2014): Neuropathology of the anterior midcingulate cortex in young children with autism. J Neuropathol Exp Neurol 73:891–902. [DOI] [PubMed] [Google Scholar]
- Walker L, Gozzi M, Lenroot R, Thurm A, Behseta B, Swedo S, Pierpaoli C (2012): Diffusion tensor imaging in young children with autism: Biological effects and potential confounds. Biol Psychiatry 72:1043–1051. [DOI] [PMC free article] [PubMed] [Google Scholar]
- Wegiel J, Kuchna I, Nowicki K, Imaki H, Wegiel J, Marchi E, Ma SY, Chauhan A, Chauhan V, Bobrowicz TW, de Leon M, Louis LA, Cohen IL, London E, Brown WT, Wisniewski T (2010): The neuropathology of autism: Defects of neurogenesis and neuronal migration, and dysplastic changes. Acta Neuropathol 119:755–770. [DOI] [PMC free article] [PubMed] [Google Scholar]
- Weinstein M, Ben‐Sira L, Levy Y, Zachor DA, Ben Itzhak E, Artzi M, Tarrasch R, Eksteine PM, Hendler T, Ben Bashat D (2011): Abnormal white matter integrity in young children with autism. Hum Brain Mapp 32:534–543. [DOI] [PMC free article] [PubMed] [Google Scholar]
- Wolff JJ, Gu H, Gerig G, Elison JT, Styner M, Gouttard S, Botteron KN, Dager SR, Dawson G, Estes AM, Evans AC, Hazlett HC, Kostopoulos P, McKinstry RC, Paterson SJ, Schultz RT, Zwaigenbaum L, Piven J, Network I (2012): Differences in white matter fiber tract development present from 6 to 24 months in infants with autism. Am J Psychiatry 169:589–600. [DOI] [PMC free article] [PubMed] [Google Scholar]
- Xiao Z, Qiu T, Ke X, Xiao X, Xiao T, Liang F, Zou B, Huang H, Fang H, Chu K, Zhang J, Liu Y (2014): Autism spectrum disorder as early neurodevelopmental disorder: Evidence from the brain imaging abnormalities in 2‐3 years old toddlers. J Autism Dev Disord 44:1633–1640. [DOI] [PMC free article] [PubMed] [Google Scholar]
- Zalesky A, Fornito A, Bullmore ET (2010): Network‐based statistic: Identifying differences in brain networks. NeuroImage 53:1197–1207. [DOI] [PubMed] [Google Scholar]
- Zhang Y, Brady M, Smith S (2001): Segmentation of brain MR images through a hidden Markov random field model and the expectation‐maximization algorithm. IEEE Trans Med Imaging 20:45–57. [DOI] [PubMed] [Google Scholar]
- Zwaigenbaum L, Bauman ML, Choueiri R, Kasari C, Carter A, Granpeesheh D, Mailloux Z, Smith Roley S, Wagner S, Fein D, Pierce K, Buie T, Davis PA, Newschaffer C, Robins D, Wetherby A, Stone WL, Yirmiya N, Estes A, Hansen RL, McPartland JC, Natowicz MR (2015): Early intervention for children with autism spectrum disorder under 3 years of age: Recommendations for practice and research. Pediatrics 136: S60–S81. [DOI] [PMC free article] [PubMed] [Google Scholar]
- Zwaigenbaum L, Bryson S, Garon N (2013): Early identification of autism spectrum disorders. Behav Brain Res 251:133–146. [DOI] [PubMed] [Google Scholar]