

Abstract
Hippocampal connectivity has been widely described but connectivity specificities of hippocampal subfields and their changes in early AD are poorly known. The aim of this study was to highlight hippocampal subfield networks in healthy elderly (HE) and their changes in amnestic patients with mild cognitive impairment (aMCI). Thirty‐six HE and 27 aMCI patients underwent resting‐state functional MRI scans. Specific intrinsic connectivity of bilateral CA1, SUB (subiculum), and CA2/3/4/DG was identified in HE (using seeds derived from manually delineation on high‐resolution scans) and compared between HE and aMCI. Compared to the other subfields, CA1 was more strongly connected to the amygdala and occipital regions, CA2/3/4/DG to the left anterior cingulate cortex, temporal, and occipital regions, and SUB to the angular, precuneus, putamen, posterior cingulate, and frontal regions. aMCI patients showed reduced connectivity within the SUB network (with frontal and posterior cingulate regions). Our study highlighted for the first time three specific and distinct hippocampal subfield functional networks in HE, and their alterations in aMCI. These findings are important to understand AD specificities in both cognitive deficits and lesion topography, given the role of functional connectivity in these processes. Hum Brain Mapp 38:4922–4932, 2017. © 2017 Wiley Periodicals, Inc.
Keywords: hippocampal subfields, resting‐state functional connectivity, networks, aMCI patients
INTRODUCTION
The hippocampus is known to play a key role in cognitive processes, especially episodic memory [Lepage et al., 1998; Squire et al., 1992; Tulving and Markowitsch 1998; see Spaniol et al., 2009 for review] and spatial navigation [Maguire et al., 1998; Burgess et al., 2002; Ekstrom et al., 2003; see Bird and Burgess 2008 for review]. This structure is altered in several neurological and psychiatric disorders, such as Alzheimer's disease (AD), temporal lobe epilepsy, schizophrenia, post‐traumatic stress disorder, and major depression (see Geuze et al. [2005] for review).
It is acknowledged that the hippocampus is heterogeneous and can be divided in subregions with different functions, connectivity to other brain regions, and vulnerability to disease [Aggleton, 2012; Maruszak and Thuret, 2014; Small et al., 2011]. Thus, the hippocampus is made of different cytoarchitectonic subfields which include the four cornu ammonis fields (CA1–CA4), the dentate gyrus (DG), and the subiculum. Several histological studies investigated hippocampal afferent and efferent projections to the rest of the brain [Aggleton, 2012; Duvernoy, 2005], showing for example that the subiculum and CA1 are the main sources of the extrinsic projections from the hippocampus [Aggleton, 2012]. Actually, most of the hippocampal output arise from the subiculum [Aggleton and Christiansen, 2015], that is specifically connected to the anterior and posterior cingulate, retrosplenial cortex and frontal and temporal regions [Aggleton, 2012; Duvernoy, 2005]. Moreover, hippocampal subfields were described as differentially affected in AD pathology. Most imaging studies highlighted a major atrophy of the CA1 subfield in the early stages of AD (such as mild cognitive impairment (MCI)), before atrophy becomes more widespread at the dementia stage, consistent with the pathological literature (see de Flores et al. [2015a] for review).
Resting‐state fMRI (rs‐fMRI) is an imaging method used to detect brain regions showing correlated (synchronized) blood oxygen level‐dependent (BOLD) signal fluctuations over time [Biswal et al., 1995; Greicius et al., 2003], highlighting intrinsic connectivity of functional brain networks. Using this method, the hippocampus was found as functionally connected to the posterior cingulate, medial prefrontal cortex, inferior parietal lobules, and lateral temporal cortices [Allen et al., 2007; Buckner et al., 2008; Greicius et al., 2004; Wang et al., 2006]. This technique has recently been used to study how brain network connectivity changes in the course of AD. Most studies highlighted functional connectivity disruption between the hippocampus and other brain regions such as the posterior cingulate, medial prefrontal, inferior parietal, and lateral temporal cortex in AD and even in MCI patients [see Dennis and Thompson 2014; Krajcovicova et al., 2014; Sperling et al., 2010 for reviews]. However, no study to date has evaluated the specificity of hippocampal subfield intrinsic connectivity to the rest of the brain and its alteration in the early stage of AD.
The aim of this study was therefore to highlight specific hippocampal subfield networks in healthy elderly (HE) individuals and to evaluate hippocampal subfield connectivity disruption in aMCI patients using structural seeds built from manual delineations performed on high‐resolution scans. We hypothesized that among the specific hippocampal subfield networks, the subiculum network would be the most widespread. Moreover, one can hypothesize that these networks would be altered in aMCI patients.
MATERIALS AND METHODS
Participants
All participants in this study were included in the Imagerie Multimodale de la maladie d'Alzheimer à un stade Précoce (IMAP) study (Caen, France) and part of them were included in previous publications from our lab [Arenaza‐Urquijo et al., 2015; La Joie et al., 2013; Perrotin et al., 2015]. All were right‐handed, had at least 7 years of education and had no history of alcoholism, drug abuse, head trauma, or psychiatric disorder. The IMAP Study was approved by a regional ethics committee (Comité de Protection des Personnes Nord‐Ouest III) and is registered with http://ClinicalTrials.gov (number NCT01638949). All participants gave written informed consent to the study prior to the investigation.
Twenty‐seven amnestic MCI (aMCI) patients were recruited from local memory clinics and selected according to Petersen's criteria for MCI [Petersen and Morris, 2005]. Clinical diagnosis was assigned by consensus under the supervision of a senior neurologist (VdlS) and neuropsychologists. Thirty‐six healthy elderly (aged over 60) were recruited from the community by flyers and advertisements in local newspapers. They performed in the normal range on all neuropsychological tests from a cognitive battery assessing multiple domains of cognition (verbal and visual episodic memory, semantic memory, language skills, executive functions, visuospatial functions, and praxis). To avoid including healthy subjects who might be at a preclinical stage of Alzheimer's disease [Sperling et al., 2011], we only included healthy subjects found to be amyloid‐negative based on the neocortical Florbetapir SUVR using a previously published method [La Joie et al., 2012; La Joie et al., 2013]. The demographic characteristics of the samples are summarized in Table 1.
Table 1.
Demographics of the samples
| Healthy elderly | aMCI | |
|---|---|---|
| Number (women/men) | 36 (19/17) | 27 (12/15) |
| Age (years; mean ± SD) | 68.7 ± 6.1 | 74.2 ± 6.4* |
| Education (years; mean ± SD) | 12.6 ± 2.7 | 11.1 ± 3.4* |
| MMSE (mean ± SD) | 28.8 ± 0.9 | 26.3 ± 1.8* |
SD: standard deviation.
aMCI patients were compared for age, education, and MMSE with healthy elderly using 2‐sample t tests and compared for gender with a chi‐square test. *P < 0.05.
MRI Data Acquisition
Each subject underwent an MR scan at the cyceron center (Caen, France) using a Philips Achieva (Eindhoven, The Netherlands) 3T scanner. Subjects were equipped with earplugs and their head was stabilized with foam pads to minimize head motion. First, T1‐weighted structural images were acquired (repetition time (TR) = 20 ms; echo time (TE) = 4.6 ms; flip angle = 10°; 180 slices; slice thickness =1 mm; no gap; field of view = 256 × 256 mm2; matrix = 256 × 256; in‐plane resolution = 1 × 1 mm2; acquisition time = 9.4 min). Second, non‐EPI T2* images were acquired (2D‐T2*‐FFE axial; SENSE factor = 2; TR = 3,505 ms; TE = 30 ms; flip angle = 90°; 70 slices; slice thickness = 2 mm; no gap; Field of View = 256 × 256 mm2; in‐plane resolution = 2 × 2 mm2; acquisition time = 3.2 min). Then, a high‐resolution proton density weighted sequence was acquired perpendicularly to the long axis of the hippocampus in an independent group of 50 healthy participants (TR = 3,500 ms; TE = 19 ms; flip angle = 90°; 13 slices; slice thickness = 2 mm; interslices gap = 2 mm; field of view = 120 × 120 mm2; in‐plane resolution = 0.375 × 0.375 mm2, acquisition time = 7.4 min). Finally, resting‐state functional acquisitions were obtained using an interleaved 2D T2* SENSitivity Encoding EPI sequence designed to reduce geometric distortions using parallel imaging, shorter echo time, and smaller voxels (2D‐T2*‐FFE‐EPI axial, SENSitivity Encoding factor = 2; TR = 2,382 ms; TE = 30 ms; flip angle = 80°; 42 slices; slice thickness = 2.8 mm; no gap; in‐plane resolution = 2.8 × 2.8 mm2; 280 volumes). During this acquisition, which was the last of the MRI scanning session, subjects were asked to relax, lie still in the scanner, and keep their eyes closed while not falling asleep. A subsequent debriefing questionnaire was used to ensure that the participants had no difficulty staying awake throughout the duration of the resting‐state fMRI scan and that nothing particular had disturbed their attention during the scanning.
Imaging Data Handling and Transformation
Labeling of hippocampal subfields
Hippocampal subfields were manually delineated in native high resolution proton density weighted scans within an independent group of 50 healthy participants (mean age: 45.5 ± 17.9; mean education: 13.8 ± 3.9; 31F/16M) according to a protocol detailed and used in previous publications [La Joie et al., 2010; see also de Flores et al., 2015b; La Joie et al., 2013; Perrotin et al., 2015]. Briefly, three hippocampal regions were delineated: (i) the subiculum (SUB); (ii) CA1; and (iii) CA2–CA3–CA4 and DG pooled together in a unique region. Indeed, the very limited size of CA2, CA3, and CA4 with CA4 surrounded by DG makes difficult the accurate and reliable delineation of each individual subfield [La Joie et al., 2010]. Manual delineations were all performed by the same rater blind to the identity of the participants (RLJ, the same as in La Joie et al. [2010, 2013]).
Each high‐resolution scan, as well as the manually delineated subfields, was coregistered (estimate only, to avoid interpolations) to each corresponding T1‐weighed image with the SPM5 software (Statistical Parametric Mapping, Wellcome Trust Centre for Neuroimaging, London, UK) and the registration was checked visually for accuracy. Using the VBM5 toolbox, implemented in the SPM5 software, T1‐MRI were segmented and spatially normalized to the MNI space. The normalization parameters were then applied to the coregistred manually delineated subfields. Lastly, the 50 MNI normalized hippocampal subfield regions were averaged. The average image of each hippocampal subregion was then binarized in order to obtain one normalized bilateral seed for each of the three delineated regions (e.g. CA1, CA2/3/4/DG, and SUB). For this purpose, a threshold of 0.4 was used and any overlapping voxel was classified in only one subregion, that is, the one for which the voxel's value was the highest. The resulting seeds are illustrated in Figure 1.
Figure 1.
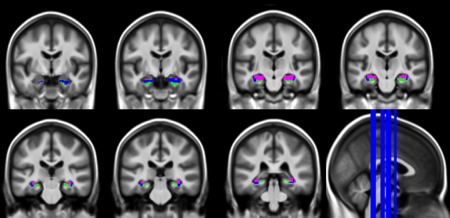
Anatomical seeds derived from manual segmentation performed on ultra‐high‐resolution scans in an independent group of 50 healthy controls. Blue: CA1; green: SUB; pink: CA2/3/4/DG. Seeds are illustrated with a 2 × 2 × 2 mm3 resolution as applied to the resting‐state fMRI data. [Color figure can be viewed at http://wileyonlinelibrary.com]
Preprocessing of resting‐state fMRI data
First, datasets were checked for the lack of artifact due to head movements (>3 mm translation or 1.5° rotation) or of abnormal variance distribution through the application of the TSDiffana routine (http://imaging.mrc-cbu.cam.ac.uk/imaging/DataDiagnostics). The first 6 volumes were discarded because of saturation effects. EPI volumes (rs‐fMRI) were then corrected for slice timing and realigned to the first volume. Data were then spatially normalized using a technique designed to reduce geometrical distortion effects [Villain et al., 2010b]. First, several coregistations (T2* scan to match the rs‐fMRI scan, T2 scan to match the rT2* scan, and T1 scan to match the rT2 scan) were performed to optimize the coregistration of the T1 scan to the rs‐fMRI scan. Then, the rs‐fMRI scan was warped to match the rT2* volume to reduce geometrical distortion effects. The T1 scan was segmented using the VBM8 “Segment” procedure with the International Consortium for Brain Mapping (ICBM)/Montreal Neurological Institute (MNI) priors and a normalization of the coregistered T1, rs‐fMRI and T2* volumes was performed using the parameters obtained from the T1 segmentation (final resolution = 2 × 2 × 2 mm3). Last, a 4 mm FWHM smooth was applied to the rs‐fMRI scan together with a bandpass filter (0.01–0.08 Hz) to the time series (as well as to the six parameters generated from realignment of head motion) to remove low‐ and high‐frequency drift components of resting fMRI data [Arenaza‐Urquijo et al., 2013; Mevel et al., 2013]. Finally, a binary mask was created from the segmented mean of the group grey matter T1 volume in conjunction with the mean non EPI‐T2* volume in the MNI space. This mask was used in further analyses to include only gray matter voxels.
The individual mean time‐courses were extracted for each of the three hippocampal seeds (CA1, CA2/3/4/DG, and SUB), and individual functional connectivity maps were computed for each seed according to the following steps: (i) regression of the six parameters generated from realignment of head motion and the white matter, cerebrospinal fluid and global time courses (together with their derivatives) was performed; and (ii) the positive correlation coefficients between the averaged time course in each seed region and the time course of each voxel across the whole grey matter using the T1‐non EPI T2* mask was computed. A Fisher's z transform and a 6.3 mm FWHM smooth were then applied to the resulting individual connectivity maps.
Statistical Analyses
Defining hippocampal subfield networks
The three individual connectivity maps (obtained from the CA1, CA2/3/4/DG, and SUB seed, respectively) of each healthy elderly were entered into a flexible factorial model in SPM8 with age, education, and gender as covariates. We first defined a whole hippocampal network (defined as the regions connected with any of the three hippocampal subregions) using a family‐wise error (FWE)‐corrected P <0.05 threshold with a cluster extent of k > 1,600 mm3. Then, connectivity maps were compared between hippocampal subregions within the whole hippocampus network. A P (uncorrected) < 0.001 with a cluster extent of k > 256 mm3 was used to achieve a corrected statistical significance of P < 0.05, determined by Monte‐Carlo simulation (see program 3dClustSim version 17.0.08).
Group differences in network strength
Three two‐sample t tests (one for each seeded hippocampal region) were used to assess group differences in functional connectivity between healthy elderly and aMCI patients. Age, education, and gender were used as covariates. Each group comparison analysis was masked by the corresponding network highlighted in healthy elderly. A P (uncorrected) < 0.001 and a cluster extent >40 mm3 for CA1 and CA2/3/4/DG and >112 mm3 for SUB, determined by Monte‐Carlo simulation (see program 3dClustSim version 17.0.08), were used to achieve a statistical significance of corrected P < 0.05 at the cluster level. Note that statistics were corrected for multiple comparisons across voxels (through Monte‐Carlo simulation and permutation testing) but not for multiple tests across hippocampal subregions (i.e., for the fact that several tests were run, one for each seeded hippocampal region).
RESULTS
Hippocampal Subfield Networks in Healthy Elderly
Hippocampal networks highlighted in healthy elderly are illustrated in Figure 2. The whole hippocampus network encompasses the whole medial temporal lobe, the posterior cingulate cortex and precuneus, ventro‐medial frontal cortex, temporal poles, middle and superior temporal neocortex, angular cortex, and part of the lateral occipital cortex, bilaterally (289,008 mm3). Within this network, CA1 showed significantly higher connectivity with a portion of the medial temporal lobe (i.e., the entorhinal and perirhinal cortex), the middle occipital cortex, and the amygdala bilaterally, relative to CA2/3/4/DG and SUB (12,288 mm3). In contrast, CA2/3/4/DG showed a higher connectivity with the left anterior cingulate cortex, left middle/superior temporal cortex, left middle occipital cortex, and amygdala bilaterally (13,560 mm3). Last, SUB showed significantly higher connectivity with a portion of the medial temporal lobe (i.e., the entorhinal and the parahippocampal cortex), the right putamen, the right orbitofrontal cortex, and the ventromedial prefrontal cortex, the angular cortex, precuneus, posterior cingulate cortex, and superior frontal cortex bilaterally (33,632 mm3).
Figure 2.
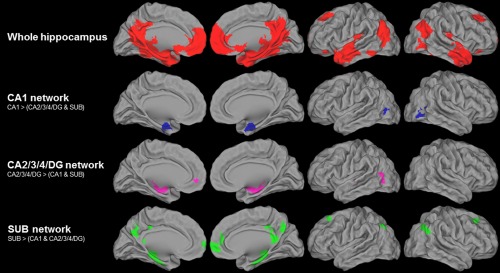
Hippocampal subfield networks in healthy elderly. Intrinsic connectivity networks of the whole hippocampus (in red, illustrated at FWE‐corrected P < 0.05; k > 200 voxels; top line), and of the hippocampal subfields CA1 (in blue, second top line), CA2/3/4/DG (in pink, third top line), and SUB (in green, lower line) within the whole hippocampus network and illustrated at P (uncorrected) < 0.001 and a k value to achieve a statistical significance of corrected P < 0.05 at the cluster level. [Color figure can be viewed at http://wileyonlinelibrary.com]
Group Differences in Connectivity
Group differences in connectivity between healthy elderly and aMCI patients are illustrated in Figure 3. No difference was found within the CA1 and CA2/3/4/DG networks. In aMCI patients, a significant decrease in connectivity was found between SUB and the posterior cingulate, right ventromedial prefrontal, and left superior frontal cortex.
Figure 3.
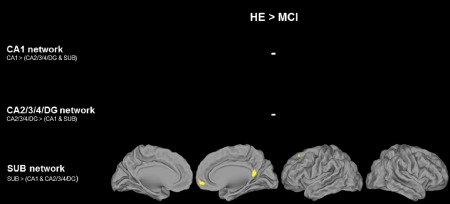
Group differences in connectivity between healthy elderly and aMCI patients. HE and aMCI patients were compared using two‐sample t tests within the respective hippocampal subfield networks (illustrated in Fig. 2), and regions of significant decrease in aMCI patients relative to controls were illustrated at P (uncorrected) < 0.001 and k value to achieve a statistical significance of corrected P < 0.05 at the cluster level. [Color figure can be viewed at http://wileyonlinelibrary.com]
Complementary Analyses
High‐resolution rs‐fMRI scans
To validate our results for the hippocampal subfield networks, especially as they were obtained from rs‐fMRI images with a resolution of 2.8 × 2.8 × 2.8 mm3, we replicated our analyses using images with higher resolution. For this purpose, we used freely available high‐resolution rs‐fMRI scans acquired at 7 T in a group of 22 healthy individuals (10 women) aged from 21 to 30 (mean: 25.1) (70 slices with 1.5 mm thickness, 1.5 mm3 isotropic voxel size, TR = 3.0 s, TE = 17 ms, FA = 70°, BW = 1,116 Hz/Px, Partial Fourier 6/8, GRAPPA acceleration with iPAT factor of 3 (36 reference lines), and 300 repetitions) [Gorgolewski et al., 2015; http://openscience.cbs.mpg.de/7t_trt]. Specific hippocampal subfield networks were evaluated using the method described above (Defining hippocampal subfield networks). The pattern of the hippocampal subfields were highly similar to those found in our main analysis from images acquired in our lab despite slight differences mainly for the CA2/3/4/DG network (Supporting Information, Fig. 1). More specifically, the CA2/3/4/DG network highlighted with high‐resolution scans encompassed more temporal neocortical regions than in the main analysis (i.e., with images with a resolution of 2.8 × 2.8 × 2.8 mm3).
Individual seeds
As the template seeds (described in Labeling of hippocampal subfields) might not perfectly reflect the individual subfield anatomy, we repeated our analyses using individual hippocampal subfield seeds. Both high‐resolution proton density weighted hippocampal scans and rs‐fMRI scans were available in the same participant for a subgroup of 27 HC. Thus, in this subgroup, hippocampal subfields were manually segmented for each of the 27 participants on the high‐resolution hippocampal proton density weighted scans, spatially transformed to match the rs‐fMRI scan and used as seeds to generate functional connectivity maps. Connectivity maps (for CA1, CA2/3/4/DG and SUB) were then compared across subfields as described above (Defining hippocampal subfield networks) to highlight the specific subfield networks. Both methods (individual vs template seeds) showed very similar networks although slight differences can be noted (Supporting Information, Fig. 2). More precisely, using individual seeds, the CA2/3/4/DG network encompassed larger clusters more extended and bilateral especially in temporo‐occipital regions, while the SUB network was less extended (i.e., the clusters were in the same location but smaller) than in the main analysis (i.e., using template seeds). These complementary analyses suggest that the use of “template” seeds seem to be relatively reliable to highlight hippocampal subfield networks.
Permutation analyses
We ran additional permutation analyses using the “randomise” command available in fsl (https://fsl.fmrib.ox.ac.uk/fsl/fslwiki/Randomise). Specific hippocampal subfield networks were evaluated in healthy individuals using repeated measures ANOVA. Networks were overall similar to those highlighted with SPM (Supporting Information, Fig. 3). Then, within these networks, we compared healthy individuals and aMCI patients using two‐sample unpaired t tests. Identically to our SPM analyses, only the SUB network showed reduced connectivity in aMCI patients (Supporting Information, Fig. 4).
Influence of atrophy
To evaluate whether group differences in connectivity were influenced by grey matter atrophy in aMCI patients, we repeated our group comparison analyses on connectivity maps controlled for age, gender, and education, but introducing grey matter volume maps as covariates using the Biological Parametric Mapping (BPM) toolbox [Casanova et al., 2007]. Grey matter (GM) volume maps corresponded to the GM segments issued from the VBM8 procedure implemented in SPM8 as described in the Methods section. GM segments were modulated to correct for nonlinear warping and smoothed at 8 mm FWHM to result in a smoothness equivalent to that of the resting‐state fMRI images. A P (uncorrected) < 0.001 and a cluster extent k > 40 mm3 for CA1 and CA2/3/4/DG and k > 112 mm3 for SUB was used to achieve a statistical significance of corrected P < 0.05, determined by Monte‐Carlo simulation (see program 3dClustSim version 17.0.08). The results remain essentially unchanged when controlling for GM volume (Supporting Information, Fig. 5) indicating that the differences in hippocampal subfield connectivity between aMCI and controls were not due to atrophy.
Influence of amyloid deposition
Florbetapir scans were available in 25/27 aMCI patients. To assess whether the presence of amyloid in aMCI influenced our findings, the functional connectivity was extracted within regions showing a reduced connectivity to SUB in aMCI patients (Fig. 3) for each of the two groups (HE and aMCI patients) and was compared using ANCOVAs with age, gender, education, and SUVR as covariates. The reduced functional connectivity in aMCI patients remained significant (P < 0.001). Then, we split the aMCI group in amyloid positive (n = 17; mean age: 74.8 ± 7.2; mean education: 11.9 ± 3.9; 8F/9M) and amyloid negative (n = 8; mean age: 72 ± 4.8; mean education: 9.2 ± 1.7; 4F/4M) using a previously published method [La Joie et al., 2012, 2013]. The functional connectivity previously extracted from both networks was compared between the three groups using Mann–Whitney tests. Nonparametric tests were used because of the small sample size. Both amyloid‐positive and ‐negative aMCI patients showed a decreased connectivity to SUB (P = 0.002 for both groups) compared to HE. No significant differences were found between amyloid‐positive and ‐negative aMCI patients (P = 0.93) (Fig. 4).
Figure 4.
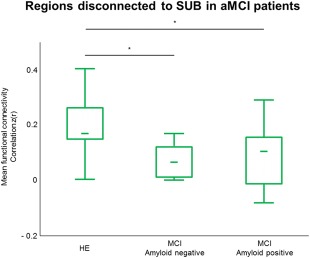
Influence of amyloid deposition on connectivity. Mean functional connectivity extracted from regions disconnected to SUB in aMCI patients (Fig. 3) and compared between HE, amyloid negative, and amyloid‐negative aMCI patients using Mann–Whitney tests. *P < 0.01. [Color figure can be viewed at http://wileyonlinelibrary.com]
DISCUSSION
In this study, we used anatomical seeds derived from manual delineations performed on high‐resolution MR scans to highlight the specific intrinsic functional connectivity of CA1, SUB, and CA2/3/4/DG in a sample of 36 HE. We also evaluated their alterations in a sample of 27 aMCI patients.
Hippocampal Subfield Connectivity
When evaluating the regions functionally connected with any of the three hippocampal subregions (corresponding to the whole hippocampal network), we found a widespread network of intrinsic connectivity encompassing the entire medial temporal lobe, the posterior cingulate cortex and precuneus, ventro‐medial frontal, temporal, and angular cortex and part of the lateral occipital cortex, bilaterally. This result is consistent with previous neuroimaging studies using the whole hippocampus as a seed [Allen et al., 2007; Wang et al., 2006]. This network is highly similar to the default mode network (DMN), a specific and anatomically defined brain system preferentially active when individuals are not focused on the external environment [Buckner et al., 2008; Greicius et al., 2004; Raichle et al., 2001]. The originality of the present work was to highlight the specificities in the intrinsic connectivity of the different hippocampal subfields. These analyses revealed that the SUB network appeared as the most extended and included regions classically described as part of the DMN (medial temporal, precuneus/posterior cingulate, angular gyrus, and medial frontal regions). By contrast, CA1 and CA2/3/4/DG belong to more restrained networks that include the hippocampal area, the middle occipital regions (mainly located in BA19 and extending to BA37), the amygdala (for both), and the anterior cingulate and the middle/superior temporal cortices (for CA2/3/4/DG).
To our knowledge, only a couple of studies used the hippocampal subfields (CA, DG, and SUB bilaterally) as seeds in intrinsic connectivity analyses [Bai et al., 2011; Wang et al., 2015] but none of them were designed to highlight hippocampal subfield network specificities. Indeed networks were assessed for each subregion but not compared, so that they were almost the same for the 3 hippocampal regions and corresponded to the network usually described for the whole hippocampus [see, e.g., Allen et al., 2007; Wang et al., 2006]. Direct statistical comparison between networks is warranted to highlight the specificities.
The specificities of the hippocampal subfield connectivity evidenced here are overall consistent with the circuitry of the hippocampus described from histological studies investigating the anatomical hippocampal afferent and efferent projections to the rest of the brain [Aggleton, 2012; Duvernoy, 2005]. More specifically, we found that both CA2/3/4/DG and CA1 were connected to middle occipital regions (mainly located in BA19 and extending to BA37). In the two main hippocampal loops described by Duvernoy [2005], the polysynaptic intrahippocampal pathway and the direct intrahippocampal pathway, the dentate gyrus (included in CA2/3/4/DG), and CA1 are the main input structures receiving projections from the superior visual system and the inferior visual system respectively. Moreover, studies performed in primates showed that visual association areas and V4 send projections to several hippocampal regions through the perirhinal and the parahippocampal cortex [Aggleton, 2012]. More specifically, it seems that the visual association areas (and in a lesser extend V4) mainly send projections to the dentate gyrus via the perirhinal cortex and the layer II of the entorhinal cortex, while V4 also reaches CA1 and the subiculum via the parahippocampal cortex and the layer III of the entorhinal cortex [Aggleton, 2012]. These descriptions suggest that the visual association areas are particularly connected to the dentate gyrus while V4 might also be connected to other subfields such as CA1 and the subiculum. In the same line, the networks highlighted in this study correspond to comparisons between the connectivity strength of the different hippocampal subfield networks. In other words, the specific networks highlighted from our analyses indicate the brain areas that are more strongly connected to one hippocampal subregion compared to the others. CA2/3/4/DG was also connected to the anterior cingulate in this study, which is more surprising as this region is more classically described as being connected to the subiculum [Duvernoy, 2005]. On the other hand, SUB was found to be the most extended functional network in this study (33,632 mm3 against 12,288 mm3 for CA1 and 13,560 mm3 for CA2/3/4/DG), and included medial frontal and parietal areas and the angular cortex (all part of the DMN). Histological studies describe the subiculum as the main output of the polysynaptic intrahippocampal and the direct intrahippocampal pathways [Duvernoy, 2005]. More precisely, the subiculum sends projections to the anterior and posterior cingulate, retrosplenial cortex and frontal and temporal regions [Aggleton, 2012; Duvernoy, 2005]. CA1 and CA3 also send projections to the rest of the brain [Aggleton, 2012; Duvernoy, 2005], but most of the hippocampal output arise from the subiculum [Aggleton and Christiansen, 2015].
These findings shed light on the specificities of hippocampal subfield intrinsic connectivity; future works would help understanding whether the subtle discrepancies with histological studies reflect methodological limitations and/or differences between structural and functional connectivity.
Altered Functional Connectivity Over the Course of AD
Within the specific networks described above, the intrinsic functional connectivity was significantly reduced in aMCI patients compared to HE between SUB and the posterior cingulate, right ventromedial prefrontal, and left superior frontal cortex, while no decreased connectivity was found within the CA1 and CA2/3/4/DG networks. Previous studies assessing changes in intrinsic connectivity in AD reported discrepant findings but decreased connectivity within the DMN, and more specifically between the hippocampus and the posterior cingulate cortex was the most consistent finding across studies [Binnewijzend et al., 2012; Cha et al., 2013; Chhatwal et al., 2013; Damoiseaux et al., 2012; Greicius et al., 2004; Jones et al., 2011; Schwindt et al., 2013; Wu et al., 2011; Zhou et al., 2008]. Additionally, previous seed‐based works reported reduced connectivity between the hippocampus and the medial prefrontal, anterior cingulate and temporal cortex, and the cuneus/precuneus in AD [Allen et al., 2007; Wang et al., 2006] while the hippocampus was described as disconnected from the inferior parietal and medial prefrontal cortex in MCI [Das et al., 2013]. Our findings are thus consistent with previous works, and additionally showed that these altered hippocampal connectivity arose from the subiculum. As the subiculum is the main output from the hippocampus, it is not surprising that the hippocampal connectivity disruption occurred in the SUB network. This altered functional connectivity might at least partly reflect the alteration of the projection fibers, such as the cingulate bundles [Fellgiebel et al., 2005] and the fornix [Acosta‐Cabronero and Nestor, 2014], which is thought to arise from the atrophy of projecting structures, that is, the hippocampus and more particularly here the subiculum. Indeed, previous works have shown that hypometabolism in the posterior cingulate and medial prefrontal cortex in MCI and AD was due to the disruption of projecting white matter fibers (e.g. the cingulum and uncinate fasciculus) itself due to atrophy of input structures (mainly, the hippocampus) [Villain et al., 2008, 2010]. Subiculum atrophy in AD and even in MCI patients has been reported in several studies [see de Flores et al., 2015a for review] including in studies on samples overlapping with the present study [de Flores et al., 2015b; La Joie et al., 2013]. Moreover, subiculum atrophy was found to be associated with decreased integrity of the fornix in early AD and aMCI [Wisse et al., 2015]. Although CA1 atrophy is usually found to be more significant and earlier than the subiculum over the course of AD, the main connectivity disruption between the hippocampus and the rest of the brain arose from the subiculum as this substructure is the main hippocampal output. In contrast, CA1 atrophy might lead to intrahippocampal disruptions; this hypothesis could be tested in future works.
We did not find any significant increase in hippocampal subfield intrinsic connectivity in aMCI patients in this study, while this has been reported in some (but not all) previous studies [Das et al., 2013; Gardini et al., 2015; Pasquini et al., 2015; Wang et al., 2011], especially in MCI patients. These discrepancies probably reflect the fact that the increases, if they exist, might be more subtle than connectivity decrease, so that methodological differences (heterogeneity in MCI patients, intrinsic connectivity measurement, and so on) might affect their detection.
We also assessed whether our findings were influenced by local atrophy, and whether β‐amyloid deposition would affect hippocampal subfield connectivity. We found that alteration of hippocampal subfield connectivity in aMCI patients was not merely the reflection of local atrophy as the results remained essentially unchanged when correcting for atrophy. We also showed that this connectivity alteration was not related to amyloid deposition as the findings remained the same when correcting for amyloid deposition, and connectivity disruption was the same in both the amyloid‐positive and the amyloid‐negative aMCI. Several studies showed a link between the presence of amyloid deposition and reduced connectivity in healthy individuals [Hedden et al., 2009; Mormino et al., 2011; Song et al., 2015] and in the course of AD [Celebi et al., 2016; Koch et al., 2015; Lim et al., 2014]. The lack of relationships here might reflect methodological differences and/or the limited sample size when splitting the aMCI into amyloid positive and amyloid negative. Future works are needed to assess this specific question, as this was not the aim of this study.
This study has some limitations. First, the spatial resolution of resting‐state fMRI scans (acquired at 2.8 mm and then resliced at 2 mm) is not optimal to assess hippocampal subfield [see, e.g., Carr et al., 2010]. Higher resolution fMRI were used in previous studies investigating hippocampal subfield connectivity but they only assessed a very limited portion of the brain [Duncan et al., 2014; Lacy and Stark, 2012; Libby et al., 2012]. The goal of this study was to highlight hippocampal subfield connectivity with the rest of the brain, and it was not possible to cover the whole brain with such high‐resolution due to time constraint. Partialling out the influence of the other subfields while assessing the connectivity of one subfield, we were able to highlight subfield‐specific networks that were consistent with knowledge from anatomy. However, our findings need replication using evolving technologies allowing to acquire full‐brain high‐resolution fMRI images with comparable signal‐to‐noise ratio.
Overall, using seed‐based correlation analysis, we highlighted for the first time three specific and distinct hippocampal subfield functional networks in healthy elders and their alterations in aMCI patients. As hippocampal subfields are thought to contribute to different aspects of memory (see Carr et al. [2010] and de Flores et al. [2015a] for reviews), and given the growing acknowledgement of the role of brain intrinsic connectivity in cognitive functions [La Joie et al., 2014; see Jeong et al., 2015 for review], it would be particularly interesting in future studies to assess the specific relationships between hippocampal subfield connectivity and memory deficits in AD but also across different hippocampus‐related disease.
Supporting information
Supporting Information Figures.
Supporting Information Table 1.
Supporting Information Table 2.
ACKNOWLEDGMENTS
The funding sources were not involved in study design, data collection, statistical analysis, results interpretation, writing of the article, or in the decision to submit the article for publication. The authors have no disclosure. The authors are grateful to E. Arenaza‐Urquijo, S. Egret, M. Fouquet, M. Gaubert, R. La Joie, M. Leblond, K. Mevel, A. Pelerin, A. Perrotin, A. Quillard, N. Villain, and the Cyceron MR‐PET staff members for their help with patients and imaging examination.
REFERENCES
- Acosta‐Cabronero J, Nestor PJ (2014): Diffusion tensor imaging in Alzheimer's disease: Insights into the limbic‐diencephalic network and methodological considerations. Front Aging Neurosci 6:266. [DOI] [PMC free article] [PubMed] [Google Scholar]
- Aggleton JP (2012): Multiple anatomical systems embedded within the primate medial temporal lobe: Implications for hippocampal function. Neurosci Biobehav Rev 36:1579–1596. [DOI] [PubMed] [Google Scholar]
- Aggleton JP, Christiansen K (2015): The subiculum: The heart of the extended hippocampal system. Prog Brain Res 219:65–82. [DOI] [PubMed] [Google Scholar]
- Allen G, Barnard H, McColl R, Hester AL, Fields JA, Weiner MF, Ringe WK, Lipton AM, Brooker M, McDonald E, Rubin CD, Cullum CM (2007): Reduced hippocampal functional connectivity in Alzheimer disease. Arch Neurol 64:1482–1487. [DOI] [PubMed] [Google Scholar]
- Arenaza‐Urquijo EM, Landeau B, La Joie R, Mevel K, Mézenge F, Perrotin A, Desgranges B, Bartrés‐Faz D, Eustache F, Chételat G (2013): Relationships between years of education and gray matter volume, metabolism and functional connectivity in healthy elders. Neuroimage 83:450–7. [DOI] [PubMed] [Google Scholar]
- Arenaza‐Urquijo EM, Gonneaud J, Fouquet M, Perrotin A, Mézenge F, Landeau B, Egret S, De la Sayette V, Desgranges B, Chételat G (2015): Interaction between years of education and APOE ɛ4 status on frontal and temporal metabolism. Neurology 85:1392–1399. [DOI] [PMC free article] [PubMed] [Google Scholar]
- Bai F, Xie C, Watson DR, Shi Y, Yuan Y, Wang Y, Yue C, Teng Y, Wu D, Zhang Z (2011): Aberrant hippocampal subregion networks associated with the classifications of aMCI subjects: A longitudinal resting‐state study. PLoS One 6:e29288. [DOI] [PMC free article] [PubMed] [Google Scholar]
- Binnewijzend M. a a, Schoonheim MM, Sanz‐Arigita E, Wink AM, van der Flier WM, Tolboom N, Adriaanse SM, Damoiseaux JS, Scheltens P, van Berckel BNM, Barkhof F (2012): Resting‐state fMRI changes in Alzheimer's disease and mild cognitive impairment. Neurobiol Aging 33:2018–2028. [DOI] [PubMed] [Google Scholar]
- Bird CM, Burgess N (2008): The hippocampus and memory: Insights from spatial processing. Nat Rev Neurosci 9:182–194. [DOI] [PubMed] [Google Scholar]
- Biswal B, Yetkin FZ, Haughton VM, Hyde JS (1995): Functional connectivity in the motor cortex of resting human brain using echo‐planar MRI. Magn Reson Med 34:537–541. [DOI] [PubMed] [Google Scholar]
- Buckner RL, Andrews‐Hanna JR, Schacter DL (2008): The brain's default network: Anatomy, function, and relevance to disease. Ann N Y Acad Sci 1124:1–38. [DOI] [PubMed] [Google Scholar]
- Burgess N, Maguire E. a, O'Keefe J (2002): The human hippocampus and spatial and episodic memory. Neuron 35:625–641. [DOI] [PubMed] [Google Scholar]
- Carr V. a, Rissman J, Wagner AD (2010): Imaging the human medial temporal lobe with high‐resolution fMRI. Neuron 65:298–308. [DOI] [PMC free article] [PubMed] [Google Scholar]
- Casanova R, Srikanth R, Baer A, Laurienti PJ, Burdette JH, Hayasaka S, Flowers L, Wood F, Maldjian J. a (2007): Biological parametric mapping: A statistical toolbox for multimodality brain image analysis. Neuroimage 34:137–143. [DOI] [PMC free article] [PubMed] [Google Scholar]
- Celebi O, Uzdogan A, Oguz KK, Has AC, Dolgun A, Cakmakli GY, Akbiyik F, Elibol B, Saka E (2016): Default mode network connectivity is linked to cognitive functioning and CSF Aβ1–42 levels in Alzheimer's disease. Arch Gerontol Geriatr 62:125–132. [DOI] [PubMed] [Google Scholar]
- Cha J, Jo HJ, Kim HJ, Seo SW, Kim H‐S, Yoon U, Park H, Na DL, Lee J‐M (2013): Functional alteration patterns of default mode networks: Comparisons of normal aging, amnestic mild cognitive impairment and Alzheimer's disease. Eur J Neurosci 37:1916–1924. [DOI] [PMC free article] [PubMed] [Google Scholar]
- Chhatwal JP, Schultz AP, Johnson K, Benzinger TLS, Jack C, Ances BM, Sullivan CA, Salloway SP, Ringman JM, Koeppe RA, Marcus DS, Thompson P, Saykin AJ, Correia S, Schofield PR, Rowe CC, Fox NC, Brickman AM, Mayeux R, McDade E, Bateman R, Fagan AM, Goate AM, Xiong C, Buckles VD, Morris JC, Sperling RA (2013): Impaired default network functional connectivity in autosomal dominant Alzheimer disease. Neurology 81:736–744. [DOI] [PMC free article] [PubMed] [Google Scholar]
- Damoiseaux JS, Prater KE, Miller BL, Greicius MD (2012): Functional connectivity tracks clinical deterioration in Alzheimer's disease. Neurobiol Aging 33:828.e19–830. [DOI] [PMC free article] [PubMed] [Google Scholar]
- Das SR, Pluta J, Mancuso L, Kliot D, Orozco S, Dickerson BC, Yushkevich P. a, Wolk D. a (2013): Increased functional connectivity within medial temporal lobe in mild cognitive impairment. Hippocampus 23:1–6. [DOI] [PMC free article] [PubMed] [Google Scholar]
- Dennis EL, Thompson PM (2014): Functional brain connectivity using fMRI in aging and Alzheimer's disease. Neuropsychol Rev 24:49–62. [DOI] [PMC free article] [PubMed] [Google Scholar]
- Duncan K, Tompary A, Davachi L (2014): Associative Encoding and Retrieval Are Predicted by Functional Connectivity in Distinct Hippocampal Area CA1 Pathways. J Neurosci 34:11188–98. [DOI] [PMC free article] [PubMed] [Google Scholar]
- Duvernoy HM (2005): The Human Hippocampus, Functional Anatomy, Vascularization and Serial Sections with MRI, 3rd ed Berlin, Germany: Springer‐Verlag. [Google Scholar]
- Ekstrom AD, Kahana MJ, Caplan JB, Fields TA, Isham EA, Newman EL, Fried I (2003): Cellular networks underlying human spatial navigation. Nature 425:184–188. [DOI] [PubMed] [Google Scholar]
- Fellgiebel A, Müller MJ, Wille P, Dellani PR, Scheurich A, Schmidt LG, Stoeter P (2005): Color‐coded diffusion‐tensor‐imaging of posterior cingulate fiber tracts in mild cognitive impairment. Neurobiol Aging 26:1193–1198. [DOI] [PubMed] [Google Scholar]
- de Flores R, La Joie R, Chételat G (2015a): Structural imaging of hippocampal subfields in healthy aging and Alzheimer's disease. Neuroscience 309:29–50. [DOI] [PubMed] [Google Scholar]
- de Flores R, La Joie R, Landeau B, Perrotin A, Mézenge F, de La Sayette V, Eustache F, Desgranges B, Chételat G (2015b): Effects of age and Alzheimer's disease on hippocampal subfields: Comparison between manual and FreeSurfer volumetry. Hum Brain Mapp 36:463–474. [DOI] [PMC free article] [PubMed] [Google Scholar]
- Gardini S, Venneri A, Sambataro F, Cuetos F, Fasano F, Marchi M, Crisi G, Caffarra P (2015): Increased functional connectivity in the default mode network in mild cognitive impairment: A maladaptive compensatory mechanism associated with poor semantic memory performance. J Alzheimers Dis 45:457–470. [DOI] [PubMed] [Google Scholar]
- Geuze E, Vermetten E, Bremner JD (2005): MR‐based in vivo hippocampal volumetrics: 2. Findings in neuropsychiatric disorders. Mol Psychiatry 10:160–184. [DOI] [PubMed] [Google Scholar]
- Gorgolewski KJ, Mendes N, Wilfling D, Wladimirow E, Gauthier CJ, Bonnen T, Ruby FJ, Trampel R, Bazin P‐L, Cozatl R, Smallwood J, Margulies DS (2015): A high resolution 7‐Tesla resting‐state fMRI test‐retest dataset with cognitive and physiological measures. Sci Data 2:140054. [DOI] [PMC free article] [PubMed] [Google Scholar]
- Greicius MD, Krasnow B, Reiss AL, Menon V (2003): Functional connectivity in the resting brain: A network analysis of the default mode hypothesis. Proc Natl Acad Sci USA 100:253–258. [DOI] [PMC free article] [PubMed] [Google Scholar]
- Greicius MD, Srivastava G, Reiss AL, Menon V (2004): Default‐mode network activity distinguishes Alzheimer's disease from healthy aging: Evidence from functional MRI. Proc Natl Acad Sci USA 101:4637–4642. [DOI] [PMC free article] [PubMed] [Google Scholar]
- Hedden T, Van Dijk KR. a, Becker JA, Mehta A, Sperling R. a, Johnson K. a, Buckner RL (2009): Disruption of functional connectivity in clinically normal older adults harboring amyloid burden. J Neurosci 29:12686–12694. [DOI] [PMC free article] [PubMed] [Google Scholar]
- Jeong W, Chung CK, Kim JS (2015): Episodic memory in aspects of large‐scale brain networks. Front Hum Neurosci 9:454. [DOI] [PMC free article] [PubMed] [Google Scholar]
- La Joie R, Fouquet M, Mézenge F, Landeau B, Villain N, Mevel K, Pélerin A, Eustache F, Desgranges B, Chételat G (2010): Differential effect of age on hippocampal subfields assessed using a new high‐resolution 3T MR sequence. Neuroimage 53:506–514. [DOI] [PubMed] [Google Scholar]
- La Joie R, Landeau B, Perrotin A, Bejanin A, Egret S, Pélerin A, Mézenge F, Belliard S, de La Sayette V, Eustache F, Desgranges B, Chételat G (2014): Intrinsic connectivity identifies the hippocampus as a main crossroad between Alzheimer's and semantic dementia‐targeted networks. Neuron 81:1417–1428. [DOI] [PubMed] [Google Scholar]
- La Joie R, Perrotin A, Barré L, Hommet C, Mézenge F, Ibazizene M, Camus V, Abbas A, Landeau B, Guilloteau D, de La Sayette V, Eustache F, Desgranges B, Chételat G (2012): Region‐specific hierarchy between atrophy, hypometabolism, and β‐amyloid (Aβ) load in Alzheimer's disease dementia. J Neurosci 32:16265–16273. [DOI] [PMC free article] [PubMed] [Google Scholar]
- La Joie R, Perrotin A, de La Sayette V, Egret S, Doeuvre L, Belliard S, Eustache F, Desgranges B, Chételat G (2013): Hippocampal subfield volumetry in mild cognitive impairment, Alzheimer's disease and semantic dementia. NeuroImage Clin 3:155–162. [DOI] [PMC free article] [PubMed] [Google Scholar]
- Lacy JW, Stark CEL (2012): Intrinsic functional connectivity of the human medial temporal lobe suggests a distinction between adjacent MTL cortices and hippocampus. Hippocampus 22:2290–302. [DOI] [PMC free article] [PubMed] [Google Scholar]
- Libby LA, Ekstrom AD, Ragland JD, Ranganath C (2012): Differential connectivity of perirhinal and parahippocampal cortices within human hippocampal subregions revealed by high‐resolution functional imaging. J Neurosci 32:6550–60. [DOI] [PMC free article] [PubMed] [Google Scholar]
- Jones DT, Machulda MM, Vemuri P, McDade EM, Zeng G, Senjem ML, Gunter JL, Przybelski SA, Avula RT, Knopman DS, Boeve BF, Petersen RC, Jack CR (2011): Age‐related changes in the default mode network are more advanced in Alzheimer disease. Neurology 77:1524–1531. [DOI] [PMC free article] [PubMed] [Google Scholar]
- Koch K, Myers NE, Göttler J, Pasquini L, Grimmer T, Förster S, Manoliu A, Neitzel J, Kurz A, Förstl H, Riedl V, Wohlschläger AM, Drzezga A, Sorg C (2015): Disrupted intrinsic networks link amyloid‐β pathology and impaired cognition in prodromal alzheimer's disease. Cereb Cortex 25:4678–4688. [DOI] [PMC free article] [PubMed] [Google Scholar]
- Krajcovicova L, Marecek R, Mikl M, Rektorova I (2014): Disruption of resting functional connectivity in Alzheimer's patients and at‐risk subjects. Curr Neurol Neurosci Rep 14:491. [DOI] [PubMed] [Google Scholar]
- Lepage M, Habib R, Tulving E (1998): Hippocampal PET activations of memory encoding and retrieval: The HIPER model. Hippocampus 8:313–322. [DOI] [PubMed] [Google Scholar]
- Lim HK, Nebes R, Snitz B, Cohen A, Mathis C, Price J, Weissfeld L, Klunk W, Aizenstein HJ (2014): Regional amyloid burden and intrinsic connectivity networks in cognitively normal elderly subjects. Brain 137:3327–3338. [DOI] [PMC free article] [PubMed] [Google Scholar]
- Maguire EA, Burgess N, Donnett JG, Frackowiak RS, Frith CD, O'Keefe J (1998): Knowing where and getting there: A human navigation network. Science 280:921–924. [DOI] [PubMed] [Google Scholar]
- Maruszak A, Thuret S (2014): Why looking at the whole hippocampus is not enough‐a critical role for anteroposterior axis, subfield and activation analyses to enhance predictive value of hippocampal changes for Alzheimer's disease diagnosis. Front Cell Neurosci 8:95. [DOI] [PMC free article] [PubMed] [Google Scholar]
- Mevel K, Landeau B, Fouquet M, La Joie R, Villain N, Mézenge F, Perrotin A, Eustache F, Desgranges B, Chételat G (2013): Age effect on the default mode network, inner thoughts, and cognitive abilities. Neurobiol Aging 34:1292–301. [DOI] [PubMed] [Google Scholar]
- Mormino EC, Smiljic A, Hayenga AO, Onami SH, Greicius MD, Rabinovici GD, Janabi M, Baker SL, Yen IV, Madison CM, Miller BL, Jagust WJ (2011): Relationships between β‐amyloid and functional connectivity in different components of the default mode network in aging. Cereb Cortex 21:2399–2407. [DOI] [PMC free article] [PubMed] [Google Scholar]
- Pasquini L, Scherr M, Tahmasian M, Meng C, Myers NE, Ortner M, Mühlau M, Kurz A, Förstl H, Zimmer C, Grimmer T, Wohlschläger AM, Riedl V, Sorg C (2015): Link between hippocampus' raised local and eased global intrinsic connectivity in AD. Alzheimers Dement 11:475–484. [DOI] [PubMed] [Google Scholar]
- Perrotin A, de Flores R, Lamberton F, Poisnel G, La Joie R, de la Sayette V, Mézenge F, Tomadesso C, Landeau B, Desgranges B, Chételat G (2015): Hippocampal subfield volumetry and 3D surface mapping in subjective cognitive decline. J Alzheimers Dis 48: S141–S150. [DOI] [PubMed] [Google Scholar]
- Petersen RC, Morris JC (2005): Mild cognitive impairment as a clinical entity and treatment target. Arch Neurol 62:1160–1163; discussion 1167. [DOI] [PubMed] [Google Scholar]
- Raichle ME, MacLeod AM, Snyder AZ, Powers WJ, Gusnard DA, Shulman GL (2001): A default mode of brain function. Proc Natl Acad Sci USA 98:676–682. [DOI] [PMC free article] [PubMed] [Google Scholar]
- Schwindt GC, Chaudhary S, Crane D, Ganda A, Masellis M, Grady CL, Stefanovic B, Black SE (2013): Modulation of the default‐mode network between rest and task in Alzheimer's Disease. Cereb Cortex 23:1685–1694. [DOI] [PubMed] [Google Scholar]
- Small S. a, Schobel S. a, Buxton RB, Witter MP, Barnes C. a (2011): A pathophysiological framework of hippocampal dysfunction in ageing and disease. Nat Rev Neurosci 12:585–601. [DOI] [PMC free article] [PubMed] [Google Scholar]
- Song Z, Insel PS, Buckley S, Yohannes S, Mezher A, Simonson A, Wilkins S, Tosun D, Mueller S, Kramer JH, Miller BL, Weiner MW (2015): Brain amyloid‐β burden is associated with disruption of intrinsic functional connectivity within the medial temporal lobe in cognitively normal elderly. J Neurosci 35:3240–3247. [DOI] [PMC free article] [PubMed] [Google Scholar]
- Spaniol J, Davidson PSR, Kim ASN, Han H, Moscovitch M, Grady CL (2009): Event‐related fMRI studies of episodic encoding and retrieval: Meta‐analyses using activation likelihood estimation. Neuropsychologia 47:1765–1779. [DOI] [PubMed] [Google Scholar]
- Sperling RA, Aisen PS, Beckett LA, Bennett DA, Craft S, Fagan AM, Iwatsubo T, Jack CR, Kaye J, Montine TJ, Park DC, Reiman EM, Rowe CC, Siemers E, Stern Y, Yaffe K, Carrillo MC, Thies B, Morrison‐Bogorad M, Wagster MV, Phelps CH (2011): Toward defining the preclinical stages of Alzheimer's disease: Recommendations from the National Institute on Aging‐Alzheimer's Association workgroups on diagnostic guidelines for Alzheimer's disease. Alzheimers Dement 7:280–292. [DOI] [PMC free article] [PubMed] [Google Scholar]
- Sperling RA, Dickerson BC, Pihlajamaki M, Vannini P, LaViolette PS, Vitolo OV, Hedden T, Becker JA, Rentz DM, Selkoe DJ, Johnson K. a (2010): Functional alterations in memory networks in early Alzheimer's disease. Neuromolecular Med 12:27–43. [DOI] [PMC free article] [PubMed] [Google Scholar]
- Squire LR, Ojemann JG, Miezin FM, Petersen SE, Videen TO, Raichle ME (1992): Activation of the hippocampus in normal humans: A functional anatomical study of memory. Proc Natl Acad Sci USA 89:1837–1841. [DOI] [PMC free article] [PubMed] [Google Scholar]
- Tulving E, Markowitsch HJ (1998): Episodic and declarative memory: Role of the hippocampus. Hippocampus 8:198–204. [DOI] [PubMed] [Google Scholar]
- Villain N, Desgranges B, Viader F, de la Sayette V, Mézenge F, Landeau B, Baron J‐C, Eustache F, Chételat G (2008): Relationships between hippocampal atrophy, white matter disruption, and gray matter hypometabolism in Alzheimer's disease. J Neurosci 28:6174–6181. [DOI] [PMC free article] [PubMed] [Google Scholar]
- Villain N, Fouquet M, Baron J‐C, Mézenge F, Landeau B, de La Sayette V, Viader F, Eustache F, Desgranges B, Chételat G (2010): Sequential relationships between grey matter and white matter atrophy and brain metabolic abnormalities in early Alzheimer's disease. Brain 133:3301–3314. [DOI] [PMC free article] [PubMed] [Google Scholar]
- Wang L, Zang Y, He Y, Liang M, Zhang X, Tian L, Wu T, Jiang T, Li K (2006): Changes in hippocampal connectivity in the early stages of Alzheimer's disease: Evidence from resting state fMRI. Neuroimage 31:496–504. [DOI] [PubMed] [Google Scholar]
- Wang Z, Yuan Y, Bai F, Shu H, You J, Li L, Zhang Z (2015): Altered functional connectivity networks of hippocampal subregions in remitted late‐onset depression: A longitudinal resting‐state study. Neurosci Bull 31:13–21. [DOI] [PMC free article] [PubMed] [Google Scholar]
- Wang Z, Liang P, Jia X, Qi Z, Yu L, Yang Y, Zhou W, Lu J, Li K (2011): Baseline and longitudinal patterns of hippocampal connectivity in mild cognitive impairment: Evidence from resting state fMRI. J Neurol Sci 309:79–85. [DOI] [PubMed] [Google Scholar]
- Wisse LEM, Reijmer YD, Ter Telgte A, Kuijf HJ, Leemans A, Luijten PR, Koek HL, Geerlings MI, Biessels GJ (2015): Hippocampal disconnection in early Alzheimer's disease: A 7 Tesla MRI study. J Alzheimers Dis [DOI] [PubMed] [Google Scholar]
- Wu X, Li R, Fleisher AS, Reiman EM, Guan X, Zhang Y, Chen K, Yao L (2011): Altered default mode network connectivity in Alzheimer's disease–a resting functional MRI and Bayesian network study. Hum Brain Mapp 32:1868–1881. [DOI] [PMC free article] [PubMed] [Google Scholar]
- Zhou Y, Dougherty JH, Hubner KF, Bai B, Cannon RL, Hutson RK (2008): Abnormal connectivity in the posterior cingulate and hippocampus in early Alzheimer's disease and mild cognitive impairment. Alzheimers Dement 4:265–270. [DOI] [PubMed] [Google Scholar]
Associated Data
This section collects any data citations, data availability statements, or supplementary materials included in this article.
Supplementary Materials
Supporting Information Figures.
Supporting Information Table 1.
Supporting Information Table 2.