

Abstract
The primary motor cortex (M1) presents a somatotopic organization of body parts, but with overlap between muscle/movement representations. This distinct but overlapping M1 organization is believed to be important for individuated control and movement coordination, respectively. Discrete peaks of greater excitability observed within M1 might underpin organization of cortical motor control. This study aimed to examine interactions between M1 representations of synergist and antagonist forearm muscles, compare regions of greater excitability during different functional tasks, and compare characteristics of M1 representation recorded using surface and fine‐wire (fw) electrodes. Transcranial magnetic stimulation (TMS) was applied over M1 for mapping the representation of 4 forearm muscles (extensor carpi radialis brevis [ECRB], extensor digitorum communis, flexor carpi radialis, and flexor digitorum superficialis) during three tasks: rest, grip, and wrist extension in 14 participants. There are three main findings. First, discrete areas of peak excitability within the M1 representation of ECRBfw were identified during grip and wrist extension suggesting that different M1 areas are involved in different motor functions. Second, M1 representations of synergist muscles presented with greater overlap of M1 representations than muscles with mainly antagonist actions, which suggests a role in muscle coordination. Third, as larger normalized map volume and overlap were observed using surface than fine‐wire electrodes, data suggest that cross‐talk from adjacent muscles compromised interpretation of recordings made with surface electrodes in response to TMS. These results provide a novel understanding of the spatial organization of M1 with evidence of “functional somatotopy.” This has important implications for cortical control of movement. Hum Brain Mapp 38:6118–6132, 2017. © 2017 Wiley Periodicals, Inc.
Keywords: motor cortex, mapping, dynamic plasticity, functional organization, grip, wrist extension, somatotopy
INTRODUCTION
Penfield and Boldrey [1937] described within the primary motor cortex (M1) a ventral‐to‐dorsal, face‐to‐leg, clear somatotopic representation of the body muscles. Since this time, development of imaging and stimulation techniques such as functional magnetic resonance imaging (fMRI) and transcranial magnetic stimulation (TMS) have enabled thorough investigation of M1 organization and function. fMRI studies have confirmed the somatotopic organization of M1, that is, a sequential and somewhat distinct spatial representation of different body parts (e.g., leg, torso, arm, and head [Long et al., 2014; Meier et al., 2008; Zeharia et al., 2012]). Although a somatotopic organization of within‐limb muscle/movement has been observed (e.g., distinct M1 area for the index and little fingers [Beisteiner et al., 2001; Raffin et al., 2015], there is extensive overlap for within‐limb representation [Cunningham et al., 2013; Marconi et al., 2007; Melgari et al., 2008; Plow et al., 2010] and violation of the strict linear somatotopy has been described [Meier et al., 2008; Strother et al., 2012]. Meier et al. [2008] described a core finger representation bracketed by forearm and wrist areas that are located ventrally and dorsally to the finger representation [Meier et al., 2008], confirming a similar organization observed previously in non‐human primates [Park et al., 2001]. This M1 organization gives rise to the term “functional somatotopy” arguing that the distinct representation of a muscle is needed for its individuated control whereas the overlap is a hallmark of potential intermuscle and interjoint coordination or functional synergies [Dechent and Frahm, 2003; Plow et al., 2010].
Horizontal cortico‐cortical connections linking adjacent M1 representations within a hemisphere have been reported in monkeys [Donoghue et al., 1992; Jacobs and Donoghue, 1991] and were suggested to enable the multijoint coordination in cats [Schneider et al., 2002], thus are deemed to be important in the overlapping nature of M1 [Schieber, 2001]. In humans, TMS studies have attempted to better understand the functional role of M1 organization in the control of different motor tasks. For instance, Devanne et al. [2002] showed greater corticospinal excitability and gain of the descending pathway controlling extensor carpi radialis (ECR) during a pointing task (involving a co‐activation of the deltoid muscle) than a simpler wrist extension task [Devanne et al., 2002]. Facilitation of ECR cortical excitability during pointing was argued to represent a proximo‐distal synergy, driven by overlap between M1 representations for both muscles [Devanne et al., 2006] and likely via the release from inhibition of the distal muscle M1 circuits by the proximal one [Devanne et al., 2002; Gagné and Schneider, 2008]. Other studies reported greater corticospinal excitability and gain of the first dorsal interosseous during grip than isolated index finger abduction [Flament et al., 1993; Kouchtir‐Devanne et al., 2012]. These studies consistently show that TMS recruitment of a given muscle representation at the level of M1 differs as a function of motor task.
Recent TMS studies have observed multiple discrete “peaks” or areas of greater excitability within the M1 representation of a given muscle (e.g., forearm [Schabrun et al., 2016, 2015b] and back muscles [Schabrun et al., 2014; Tsao et al., 2011a, 2011b]. Multiple peaks of relatively greater excitability within a single M1 representation is in line with evidence that multiple sites control a single muscle (i.e., convergence [Donoghue et al., 1992; Schieber, 2001; Schneider et al., 2001]). Although the role of such discrete peak remains unclear, they could plausibly be involved in different motor functions and participate in the elaboration of motor synergies or intermuscle/interjoint coordination between adjacent M1 representations [Humphrey and Tanji, 1991; Schabrun et al., 2015b]. There is some suggestion that organization of the motor cortex may have relevance for pathology. Chronic pain is associated with differences in mapping outcomes, for example, greater overlap of M1 representations to different muscles [Schabrun et al., 2015b; Tsao et al., 2011b], and fewer discrete peaks [Schabrun et al., 2015a, 2015b], which might explain the loss of individuated motor control in people with chronic pain [Hodges and Tucker, 2011]. Discrete peak and map overlap may inform about functional organization of M1 and its role in the cortical motor control of wrist movements. A limitation of previous works is that most reports of changes to M1 overlap or discrete peaks have used surface electromyography (EMG) electrodes. This method does not allow isolated recordings of the targeted muscle [Gallina et al., 2016] and recordings of cross‐talk from adjacent muscles could lead to overestimation of number of discrete peaks associated with a single muscle and the overlap between M1 representations.
This study aimed to (i) characterize the M1 representations of individual forearm muscles using fine‐wire EMG recordings; (ii) evaluate the interaction (e.g., overlap) between M1 representations of individual muscles at rest; (iii) determine whether the M1 representation of ECRB differs between motor tasks (rest, grip, and wrist extension); and (iv) compare the TMS map outcomes recorded by surface and fine‐wire EMG electrodes. We hypothesized that forearm muscles that act synergistically with ECRB would present with greater overlap than antagonist muscles; different motor functions would involve different areas within ECRB M1 representation; and surface electrodes would overestimate the complexity and convergence of M1 maps due to a lack of specificity.
METHODS
Participants
Fourteen right‐handed pain‐free participants (9 males; mean ± SD age: 24 ± 3 years) were recruited from community advertisements and a participant database. Participants were excluded if they had any contraindications to TMS (e.g., any history of epilepsy, pregnancy, metal in head or jaw [Rossi et al., 2009]), or if they had any major neurological, respiratory, orthopedic, or circulatory disorders. Participants gave written, informed consent for experimental procedures, which were approved by the institutional Human Research Ethics Committee and conducted in accordance with the Declaration of Helsinki.
Electromyography (EMG)
Bipolar fine‐wire electrodes threaded into a needle (two strands Teflon coated stainless steel wire, 75 µm diameter, 1 mm Teflon removed, tips bent back ∼1 and ∼2 mm to form hooks) were inserted with guidance of ultrasound imaging into 4 forearm muscles; extensor carpi radialis brevis (ECRBfw) that extend and abduct the wrist, the fascicles of the extensor digitorum communis (EDC) that extend the third finger, flexor carpi radialis (FCR), and the fascicles of flexor digitorum superficialis (FDS) that flex the third finger. Electrode location was confirmed by the assessment of the EMG signal during resisted wrist extension (ECRB), third metacarpophalangeal extension (EDC), resisted wrist flexion (FCR), and resisted third metacarpophalangeal flexion (FDS), respectively. A pair of surface electrodes was placed on the skin overlying ECRB (ECRBsurf) at a location determined by palpation of the muscle during wrist extension [Faes et al., 2006; Samani et al., 2011]. Surface electrodes were used only over ECRBsurf to allow comparison with ECRBfw which was the target muscle for TMS (see below). A ground electrode was placed over the lateral aspect of the humerus. EMG data were amplified 2,000 times, band‐pass filtered between 20 and 1,000 Hz and sampled at 2 kHz using a Power 1401 Data Acquisition System with Spike2 software (Cambridge Electronic Design, Cambridge, UK).
Transcranial Magnetic Stimulation (TMS)
A Magstim 200 stimulator (Magstim Co. Ltd, Dyfed, UK) was used to deliver single‐pulsed TMS to M1 using a figure‐of‐eight coil (7‐cm diameter). Each participant's vertex was measured and marked on the scalp prior to TMS, and also registered by a Brainsight frameless stereotaxic neuronavigation system (Rogue Research Inc., Quebec, Canada). The coil was positioned at 45° to the mid‐sagittal plane to preferentially induce current in a postero‐anterior direction within the cortex [Brasil‐Neto et al., 1992]. The scalp site that evoked the largest responses (i.e., “hotspot”) for ECRBfw was located and targeted using Brainsight software. The distance from this point to the midline and the vertex was measured and recorded. Resting motor threshold (rMT) was determined for ECRBfw and defined as the minimum stimulator intensity that evoked a response (motor evoked potential, MEP) in ECRBfw of at least 50 µV for 5 out of 10 stimuli when applied to the hotspot. Active motor threshold (aMT) was determined for ECRB during sustained wrist extension at 5% maximal voluntary contraction (MVC) and was defined as the minimum intensity that produced a MEP in ECRBfw of at least 100 µV for 5 out of 10 stimuli [Rossini et al., 2015]. MVC was measured during three repetitions of a 3 s maximal third finger extension with resistance applied over the third metacarpal and the peak root‐mean‐square (rms) EMG amplitude for 3 s was used to calculate the target of 5% MVC. ECRBfw was used as the target muscle, that is, that TMS parameters (hotspot and MT) and level of activation (% MVC) were optimized for this muscle at rest and during wrist extension. The same TMS parameters were used for grip and wrist extension tasks. The peak‐to‐peak amplitude of the nonrectified ECRBfw MEP was monitored in real‐time and the rms EMG and MEP were calculated in real‐time on different channels.
TMS Mapping
Participants sat comfortably with their right forearm resting on a table and supported in neutral position with the elbow in ∼90° flexion. The forearm was secured with an adjustable clamp immediately proximal to the wrist [Bergin et al., 2014]. This position allowed unconstrained wrist motion but prevented movement of the forearm and upper arm. Mapping was undertaken over left M1 in three tasks: (i) 120% rMT at rest, (ii) 120% aMT during 5% MVC right wrist extension, and (iii) 120% aMT during 5% MVC right grip. Those tasks were selected because they required distinct patterns of synergistic and antagonistic muscle activation. For instance, ECRB and FDS are synergists during grip but ECRB and FCR are antagonists during wrist extension. At rest, participants were instructed to maintain their hand and forearm relaxed throughout the experiment and this was monitored using visual EMG feedback of the muscles tested. For wrist extension and grip tasks, the participants were instructed to contract with sufficient intensity for the EMG to reach a target line (5% MVC) displayed in real time on a computer screen. The contraction was maintained for sufficient time to record 5 TMS (one map site) repetitions applied with intervals of 4–6 s. Participants relaxed the muscle during coil repositioning to subsequent map sites (5–10 s). For the wrist extension task, participants applied isometric force against a force transducer with the wrist in a neutral position. For the grip task, participants were instructed to lightly squeeze a grip dynamometer using the third finger and the thumb, with other fingers in contact with the grip dynamometer but not contributing to the gripping task. The grip dynamometer consisted of two parallel handlebars that were adjusted to the participants' hand size by placing the distal handlebar at the level of the proximal interphalangeal joint and the proximal handlebar sitting between the thumb and index in a position similar to a “power” grip (i.e., longitudinal axis of the object across the hand) [Jacobson and Sperling, 1976]. The isometric grip was realized only with the third finger as ECRB inserts on the head of the third metacarpophalangeal and use of other fingers rendered it more difficult to control the EMG at 5% MVC by adding variability in the performance of the grip task. Mapping began at the hotspot position and moved pseudo‐randomly over a grid marked with 1 × 1 cm squares. The map boundary was confirmed in each direction when no more than 2 out of 5 MEP trials were recorded at an edge site [Schabrun et al., 2015b]. All experiments began with the rest task followed by the wrist extension and grip, in random order between participants.
Data Analysis
The individual traces and the averaged full‐wave rectified traces at each scalp site were superimposed and from this, the onset and offset of MEP were visually identified. Visual identification has been shown as a reliable and valid method to determine onsets of EMG activity [Hodges and Bui, 1996]. The amplitude of each MEP was calculated as the rms EMG amplitude between the onset and offset of the MEP from which the background rms EMG (55–5 ms prior to stimulation and not adapted to the duration of MEP) was subtracted. A topographical map of the amplitude of responses of each forearm muscle (ECRBfw, EDC, FCR, FDS, and ECRBsurf) was produced by superimposing the MEPs over respective scalp sites. Each muscle representation was normalized to the largest peak amplitude recorded within the map and was considered as 100%. As MEPs of smaller amplitudes contributed minimally to variability in TMS maps [Uy et al., 2002], normalized values <25% of the largest peak amplitude were removed and remaining responses were rescaled from 0% to 100%. The normalized map volume was calculated for each muscle as the sum of the mean rms MEP amplitudes at all active sites (i.e., all remaining responsive sites after rescaling).
Discrete peaks were identified if the MEP amplitude at a grid site exceeded a threshold of ≥40% of the largest MEP within the map, was adjacent to at least 7 out of 8 grid sites that had a reduction in amplitude of ≥5% of peak MEP amplitude, and was separated by at least one grid site from another peak that satisfied the first two criteria [Schabrun et al., 2015b].
The center of gravity (CoG) was defined as the amplitude weighted center of the map [Uy et al., 2002; Wassermann et al., 1992] and was calculated for each muscle using the formula:
where Vi = mean MEP amplitude at each site with the coordinates Xi and Yi.
The distances between the CoG and largest peaks for an individual muscle between tasks, and between muscles within a task were calculated using Pythagoras theorem. Only the resting task was analyzed for the between‐muscle comparison and only ECRBfw muscle was analyzed for the between‐task comparison as the level of activation for muscles other than ECRBfw differed between active tasks and this would bias MEP amplitude for those muscles. Maps of each muscle were created for each participant to enable qualitative review of the cortical representations.
Inspection of the data revealed substantial variation in the location of the map relative to the grid (aligned to the vertex) between individuals. This produced high variation in parameters of the M1 map (CoG coordinate, volume, and distance) and problems with averaging of the data across the participant group. This prompted additional comparisons that aimed to more sensitively address the study objectives to investigate differences between interactions in M1 muscle representations and tasks within individual participants.
Figure 1 illustrates the analysis methods used to compare between tasks and muscles. Figure 1A depicts individual ECRBfw M1 representation during grip and wrist extension using a conventional analysis of normalized map volume and CoG. The overlap between the maps (i.e., map overlap) for each participant was calculated for (i) different muscles within a task (i.e., at rest) and (ii) different tasks (rest, grip, and wrist extension) for ECRBfw (e.g., Fig. 1B, left panel). The map overlap was quantified as the number of map sites that elicited an MEP (active sites identified as described above) in each muscle pair for a specific task (e.g., same active site shared by ECRBfw and EDC M1 representations at rest), or tasks compared for a specific muscle (e.g., same active sites shared by ECRBfw M1 representation during grip and wrist extension), as a percentage of the total number of active sites that the two muscles/tasks overlaid in M1 (see % overlap formula below). The overlap between peaks (i.e., peak overlap) was quantified as the percentage of peaks that occupied the same map site in both muscles compared for a specific task or both tasks compared for a specific muscle (Fig. 1B, right panel). The following formula was used:
where overlap refers to a grid site (active site or peak) shared by both muscles/tasks and active sites represents a grid site >0 on the map.
Figure 1.
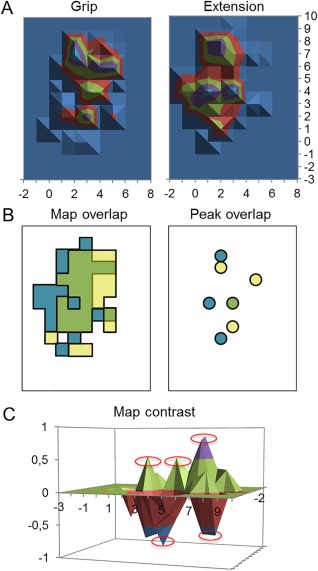
Map analyses. (A) Normalized conventional maps for grip (left panel) and wrist extension (right panel) used to calculate volume and CoG. (B) Overlap between map active sites (left panel) and discrete peaks of excitability (right panel) used to calculate percentage of map and percentage of peak overlap, respectively. Yellow represents the active sites/peaks corresponding to grip only, blue represents wrist extension only, and green represents active sites/peaks shared by both conditions. (C) Contrast of grip and wrist extension. Positive values correspond to map sites biased toward grip and negative values correspond to wrist extension. Red circles highlight discrete peaks larger than ±40% of the largest peak in each task.
Second, we performed a contrast of the M1 ECRBfw maps by subtraction of the normalized map generated during the grip task from that generated from the wrist extension task to highlight similarities/differences in the location of the discrete peaks between tasks (grip vs wrist extension) within individual participants. Each map was normalized in function of the largest peak in each task. Discrete negative (i.e., peak with greater amplitude in the wrist extension task) and positive (i.e., peak with greater amplitude in the grip task) peaks were identified according to criteria described above (Fig. 1C). A reduced number of peaks after map contrast would mean that discrete peaks shared the same M1 site in both tasks, that is, co‐localized peaks that were not specific to a task.
Statistical Analysis
Between‐muscle map comparison and interaction at rest
We undertook several analyses to determine whether (i) M1 representation of the forearm muscles differs between muscles at rest and (ii) there are differences in the interaction between M1 representations (e.g., overlap) for pairs of forearm muscles. For the first question, we used repeated measures one‐way ANOVA to compare normalized map volume and CoG coordinates (x, y) between muscles (ECRBfw, EDC, FCR, and FDS). The number of peaks was compared between muscles using a nonparametric Friedman's ANOVA. For the second question, we used repeated measures one‐way ANOVA to compare the % map overlap, % peak overlap, distance between CoG, and distance between largest peaks between the muscles pair combinations (ECRBfw–EDC, ECRBfw–FCR, and ECRBfw–FDS) to represent the between‐muscle interaction within M1.
Between‐task comparison and interaction of ECRBfw M1 maps
Several analyses were used to determine whether (i) map parameters for ECRBfw differed between tasks and (ii) the interactions between maps (e.g., overlap) differed between pair of tasks. First, we compared normalized map volume, CoG coordinates (x, y) between tasks (rest, wrist extension, and grip) using a one‐way ANOVA, and number of peaks using Friedman's ANOVA. Second, we compared % peak overlap, % map overlap, distance between CoG, and distance between largest peaks between each pair of tasks (Rest‐Grip, Rest‐Ext, and Grip‐Ext) using one‐way ANOVA.
To determine whether discrete peaks of excitability were specific to a particular active task, we used the peaks identified from the map contrasts generated from the grip‐extension maps. The total number of peaks (from grip and extension maps) and the number of peaks in the contrast map were compared with Wilcoxon‐matched pairs test.
Comparison of Maps Generated From Surface and Fine‐Wire Electrodes for Wrist Extensor Muscle
To investigate whether observations differed between EMG electrode types (surface vs fine‐wire), a one‐way ANOVA was used to compare normalized map volume and CoG coordinates (x, y) between muscles/electrode types (ECRBfw, ECRBsurf, and EDC). Further, to determine whether maps of M1 ECRB generated with surface and fine‐wire recordings present more similarities with each other than with recordings made from the adjacent/superficial wrist extensor muscle (EDC), a two‐way ANOVA was used to compared % map and peak overlap between muscle pairs (ECRBfw–EDC, ECRBfw‐s, and ECRBsurf–EDC) and between tasks (rest vs grip).
Duncan's multiple range test was used for post‐hoc testing. Significance was set at P < 0.05. Mean ± SEM are reported throughout the text and figures unless stated otherwise.
RESULTS
The rMT and aMT for ECRB were 51 ± 3% and 40 ± 2% of maximum stimulator output, respectively. No participant reported adverse effect during/following the study.
Between‐Muscle Map Comparison and Interaction at Rest
Figure 2A depicts the mean group M1 map for ECRBfw, EDC, FCR, and FDS at rest. EDC had a larger normalized map volume (9.6 ± 2.1) than ECRBfw (4.8 ± 0.7; Main effect: Muscle F (3, 39) = 4.68; P = 0.007; post hoc P = 0.001), FCR (6.3 ± 1.4; post hoc P = 0.02) and FDS (6.9 ± 1.3; post hoc P = 0.045; see Fig. 2B). The percentage of map overlap differed between muscle pairs (F (2, 26) = 5.39; P = 0.01). At rest, a smaller area of map overlap was observed for ECRBfw–FCR (35.8 ± 4.9%) than ECRBfw–EDC (47.4 ± 4.0%; P = 0.01) and ECRBfw–FDS (46.9 ± 4.2%; post hoc P = 0.01; see Fig. 1C). The percentage of sites of peak MEP overlap did not differ between muscle pairs (main effect: muscles F (2, 26) = 1.33; P = 0.28).
Figure 2.
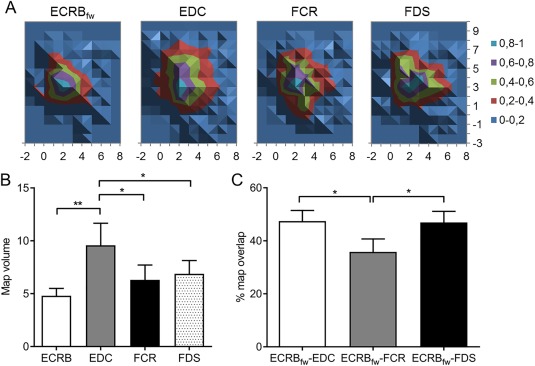
M1 representations of forearm muscles at rest: (A) Normalized averaged group maps for each muscle, (B) normalized map volume, and (C) percentage (%) of map overlap between pairs of M1 representations. ECRBfw: extensor carpi radialis brevis (fine‐wire electrode); EDC: extensor digitorum communis; FCR: flexor carpi radialis; FDS: flexor digitorum superficialis. **P < 0.01; *P < 0.05.
Between‐Task Comparison and Interaction of ECRBfw M1 Maps
Table 1 shows the map characteristics for ECRBfw for each task. No difference in the normalized map volume (main effect: task F (2, 26) = 1.70; P = 0.20), CoG coordinate (main effect: task x: F (2, 26) = 0.78; P = 0.47; y: F (2, 26) = 0.15; P = 0.86), and number of peaks (main effect: tasks χ 2(2) = 1.47; P = 0.48) were detected between tasks, as reflected in the average group map shown in Fig. 3A. Figure 3B shows the substantial interindividual variation of ECRBfw M1 map location. Although some features are consistent between tasks for a given participant, most map features (location of peaks and map size) can be observed to differ when participants are considered as individuals, except for one participant where most map features are similar for each task (S12 in Fig. 3B). As highlighted in the section Methods, additional analyses were undertaken to consider the data at an individual level.
Table 1.
ECRBfw M1 map characteristics at rest, during grip, and wrist extension
| Rest | Grip | Extension | ||||||||||
|---|---|---|---|---|---|---|---|---|---|---|---|---|
| Volume (%) | x (cm) | y (cm) | Nb of peaks | Volume (%) | x (cm) | y (cm) | Nb of peaks | Volume (%) | x (cm) | y (cm) | Nb of peaks | |
| 1 | 2.5 | 4.5 | 3.2 | 1 | 2.7 | 3.2 | 3.8 | 1 | 4.6 | 3.2 | 3.6 | 2 |
| 2 | 3.8 | 3.8 | 1.7 | 2 | 5.8 | 3.4 | 0.8 | 1 | 5.2 | 3.8 | 0.4 | 1 |
| 3 | 4.1 | 1.2 | 2.2 | 2 | 2.9 | 0.9 | 1.9 | 1 | 3.8 | 1.1 | 2.5 | 1 |
| 4 | 6.5 | 2.3 | 3.4 | 2 | 1.7 | 2.6 | 3.2 | 1 | 2.5 | 2.1 | 3.0 | 1 |
| 5 | 3.1 | 1.6 | 3.6 | 1 | 5.0 | 1.4 | 3.5 | 1 | 5.6 | 0.9 | 3.9 | 2 |
| 6 | 9.9 | 4.0 | 2.5 | 2 | 7.7 | 4.2 | 2.4 | 2 | 10.4 | 4.5 | 3.2 | 3 |
| 7 | 10.3 | 1.7 | 4.5 | 2 | 5.6 | 1.2 | 3.9 | 1 | 6.5 | 1.5 | 3.9 | 1 |
| 8 | 2.0 | 3.3 | 4.5 | 1 | 11.0 | 3.1 | 5.2 | 4 | 13.7 | 1.6 | 4.7 | 4 |
| 9 | 4.2 | 1.3 | 3.9 | 3 | 6.3 | 0.0 | 4.7 | 2 | 7.2 | 0.8 | 4.9 | 2 |
| 10 | 5.2 | 2.2 | 3.5 | 2 | 3.0 | 4.1 | 3.9 | 2 | 5.5 | 2.7 | 4.8 | 3 |
| 11 | 4.9 | 0.3 | 4.6 | 2 | 3.7 | 1.3 | 5.0 | 1 | 5.8 | 0.4 | 4.8 | 2 |
| 12 | 3.5 | 1.8 | 2.3 | 1 | 3.3 | 1.9 | 2.3 | 1 | 3.6 | 2.3 | 2.4 | 1 |
| 13 | 1.8 | 2.0 | 3.6 | 1 | 3.3 | 1.7 | 3.6 | 2 | 3.4 | 1.8 | 2.5 | 1 |
| 14 | 5.5 | 1.7 | 4.5 | 2 | 14.4 | 1.3 | 4.0 | 5 | 12.8 | 1.7 | 4.5 | 2 |
| Mean ± SEM | 4.8 ± 0.7 | 2.3 ± 0.3 | 3.4 ± 0.3 | 1.7 ± 0.2 | 5.5 ± 1.0 | 2.2 ± 0.3 | 3.5 ± 0.3 | 1.8 ± 0.3 | 6.5 ± 0.9 | 2.0 ± 0.3 | 3.5 ± 0.3 | 1.9 ± 0.3 |
ECRBfw: extensor carpi radialis brevis recorded with fine‐wired electrode; M1: primary motor cortex; SEM: standard error of the mean.
Figure 3.
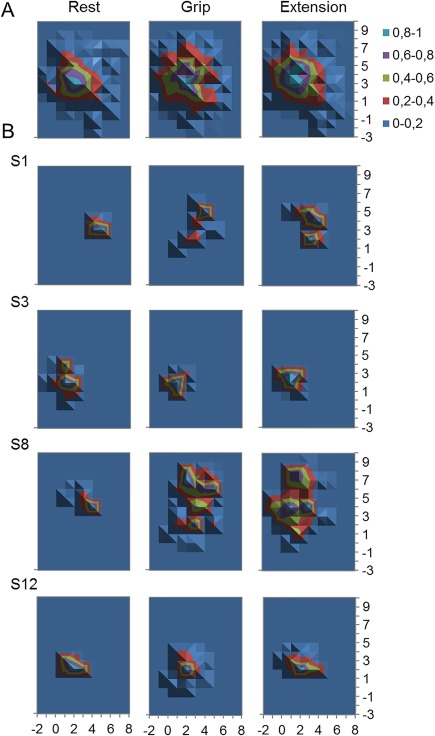
Extensor carpi radialis brevis recorded (fine‐wire electrode; ECRBfw) M1 representations during different experimental tasks: (A) Normalized averaged group map and (B) individual M1 representations for 4 representative participants to show diversity of map features (S1, S3, S8, and S12 represent different participants). Scale is normalized to peak across map.
For ECRBfw, there was a larger percentage of map overlap for Grip‐Ext (47.9 ± 4.8%) than Rest‐Grip (31.5 ± 3.8%; main effect: tasks F (1, 13) = 10.36; P = 0.0005; post hoc: P = 0.0002) and Rest‐Ext (40.2 ± 3.9%; P = 0.04; Fig.3A). Rest‐Ext percent map overlap was larger than Rest‐Grip (P = 0.02; Fig. 4A). Although narrowly missing significance, there was a tendency for a main effect of Pairs of tasks for percentage of MEP peak overlap (F (1, 13) = 3.30; P = 0.053), which was explained by a tendency toward a greater percent peak overlap in Rest‐Ext (32.1 ± 9.6%) than Rest‐Grip (14.3 ± 8.2%; P = 0.02; Fig. 4B), and by a tendency toward a greater percent peak overlap for Grip‐Ext (26.8 ± 9.7%) compared to Rest‐Grip (P = 0.09).
Figure 4.
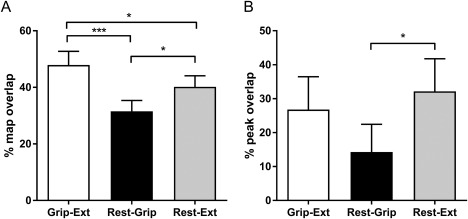
Percentage of (A) map and (B) peak overlap for Extensor carpi radialis brevis recorded (fine‐wire electrode; ECRBfw) M1 representations between different experimental tasks. Rest‐Ext: overlap of ECRBfw maps for rest and wrist extension; Rest‐Grip: overlap of ECRBfw maps for rest and grip; Grip‐Ext: overlap of ECRBfw for grip and wrist extension ECRBfw maps. ***P < 0.001; *P < 0.05.
Table 2 shows the characteristics of the largest peaks for grip and wrist extension in terms of coordinate, distance, and direction. The same location of the largest peak within the ECRBfw M1 representation for grip and wrist extension was identified in only 3 participants, and for the group the separation was 1.62 ± 0.30 cm. More than one peak was identified in maps for several participants and it is possible that discrete peaks were specific to a particular active task. This was confirmed with map contrast where individual maps show discrete peaks for each task for most participants (Fig. 5 and Table 3). Thirteen out of 14 participants displayed at least one peak that was of greater amplitude during grip and one in extension (Table 3). This supports the notion that different areas of M1 were used to specifically control ECRBfw in the different tasks. The total number of peaks for both tasks combined did not change after maps contrast (Wilcoxon match paired test: P = 0.78 ‐ before subtraction: 3.6 ± 0.5 peaks; after subtraction: 3.5 ± 0.5 peaks, Table 3), which suggests few peaks were identical in both tasks.
Table 2.
Coordinate, distance, and direction between the largest peaks before ECRBfw map contrast between grip and wrist extension
| Grip | Extension | |||||
|---|---|---|---|---|---|---|
| x | y | x | y | Distance (cm) | Direction (°) | |
| 1 | 4 | 5 | 3 | 2 | 3.2 | 71.6 |
| 2 | 4 | 2 | 3 | 1 | 1.4 | 45.0 |
| 3 | 1 | 2 | 1 | 2 | 0.0 | ‐ |
| 4 | 3 | 3 | 2 | 2 | 1.4 | 45.0 |
| 5 | 2 | 4 | 0 | 3 | 2.2 | 26.6 |
| 6 | 4 | 1 | 4 | 2 | 1.0 | −90.0 |
| 7 | 2 | 5 | 2 | 3 | 2.0 | 90.0 |
| 8 | 2 | 7 | 3 | 4 | 3.2 | 108.4 |
| 9 | −1 | 4 | 2 | 5 | 3.2 | −161.6 |
| 10 | 5 | 4 | 4 | 5 | 1.4 | −45.0 |
| 11 | 1 | 4 | 1 | 4 | 0.0 | ‐ |
| 12 | 2 | 2 | 2 | 2 | 0.0 | ‐ |
| 13 | 3 | 4 | 2 | 3 | 1.4 | 45.0 |
| 14 | 2 | 3 | 1 | 5 | 2.2 | −63.4 |
| Mean ± SEM | 2.4 ± 0.4 | 3.6 ± 0.4 | 2.1 ± 0.3 | 3.1 ± 0.4 | 1.6 ± 0.3 | 6.5 ± 25.5 |
ECRBfw: extensor carpi radialis brevis recorded with fine‐wired electrode; SEM: standard error of the mean.
Direction: 90° = toward anterior; 180°: toward medial.
Figure 5.
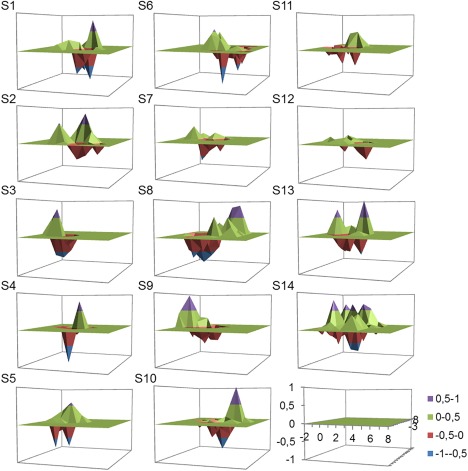
Contrast of Extensor carpi radialis brevis recorded (fine‐wire electrode; ECRBfw) maps in grip and wrist extension for all individual participants. Positive value corresponds to the map sites biased toward grip, and negative value corresponds to wrist extension. Note that all panels are presented with the same scale displayed by the lower right. S1 to S14 correspond to individual participants.
Table 3.
Number of peaks for ECRBfw M1 area during grip and wrist extension tasks before and after map contrast
| Subjects | Peaks number before contrast | Peaks number after contrast | Number of peaks summation | |||
|---|---|---|---|---|---|---|
| Grip | Extension | Grip | Extension | Before | After | |
| 1 | 1 | 2 | 1 | 2 | 3 | 3 |
| 2 | 1 | 1 | 2 | 1 | 2 | 3 |
| 3 | 1 | 1 | 1 | 1 | 2 | 2 |
| 4 | 1 | 1 | 1 | 1 | 2 | 2 |
| 5 | 1 | 2 | 1 | 2 | 3 | 3 |
| 6 | 2 | 3 | 2 | 4 | 5 | 6 |
| 7 | 1 | 1 | 1 | 1 | 2 | 2 |
| 8 | 4 | 4 | 3 | 2 | 8 | 5 |
| 9 | 2 | 2 | 1 | 2 | 4 | 3 |
| 10 | 2 | 3 | 1 | 3 | 5 | 4 |
| 11 | 1 | 2 | 1 | 2 | 3 | 3 |
| 12 | 1 | 1 | 0 | 1 | 2 | 1 |
| 13 | 2 | 1 | 2 | 2 | 3 | 4 |
| 14 | 5 | 2 | 5 | 3 | 7 | 8 |
| Mean ± SEM | 1.8 ± 0.3 | 1.9 ± 0.3 | 1.6 ± 0.3 | 1.9 ± 0.3 | 3.6 ± 0.5 | 3.5 ± 0.5 |
ECRBfw: extensor carpi radialis brevis recorded with fine‐wired electrode; M1: primary motor cortex; SEM: standard error of the mean.
Comparison of Surface and Fine‐Wire Recordings of ECBR MEP Characteristics
The ANOVA detected a significant main effect of Muscles (F (2, 18) = 5.28; P = 0.02). Normalized map volume was smaller at rest for ECRBfw (4.3 ± 0.8) than ECRBsurf (9.4 ± 1.9; Interaction Task × Muscle F (2, 18) = 4.58; P = 0.02; post hoc P = 0.0008) and EDC (10.4 ± 2.8; post hoc P = 0.0002; Fig. 6A). Furthermore, the average map (mean grip and rest) was smaller for ECRBfw (5.20 ± 0.80) than ECRBsurf (8.5 ± 1.3; main effect: muscle F (2, 18) = 5.28; P = 0.02; post hoc: P = 0.02) and EDC (8.9 ± 2.0; post hoc P = 0.01).
Figure 6.
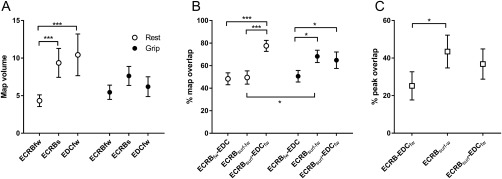
Comparison of recording techniques and extensor muscles: (A) normalized map volume for Extensor carpi radialis brevis recorded (fine‐wire electrode; ECRBfw) and ECRB surface (ECRBsurf) and extensor digitorum communis (EDC) at rest and during grip; (B) percentage of map overlap between pairs of muscles/recordings at rest and during grip; (C) percentage of peak overlap for pairs of muscles/recordings with both conditions pooled. ***P < 0.001; *P < 0.05.
At rest, there was a larger percentage of map overlap for ECRBsurf–EDC (77.5 ± 4.9%) than for ECRBfw‐surf (49.5 ± 5.9%; Interaction Task × Muscle pairs; F (2, 18)=5.88; P = 0.01; post hoc P = 0.0008) and ECRBfw–EDC (48.3 ± 5.3%; post hoc P = 0.0007). During grip, the overlap between ECRBfw and EDC was smaller (50.6 ± 5.1%) than ECRBfw‐surf (68.2 ± 5.5%; post hoc P = 0.02) and ECRBsurf and EDC (64.8 ± 7.3%; post hoc P = 0.04). The percent map overlap for ECRBfw‐surf was larger during grip than at rest (post hoc P = 0.02; Fig. 6B). The average percent map overlap (mean grip and rest) for ECRBsurf–EDC (71.2 ± 5.1%) was larger than for ECRBfw‐surf (58.8 ± 3.6%; main effect: muscle pair F (2, 18) = 9.57; P = 0.001; post hoc: P = 0.02) and ECRBfw–EDC (49.5 ± 3.5%; post hoc P = 0.0006).
Finally, although nonsignificant, there was a tendency toward a main effect for muscle pairs for percentage of MEP peak overlap (F (2, 18) = 3.23; P = 0.06). This was explained by a tendency toward a larger overlap between ECRBfw‐surf (43.5 ± 8.7%) than ECRBfw–EDC (25.2 ± 7.5%; post hoc P = 0.03; Fig. 6C).
DISCUSSION
This study tested the overlap between different M1 representations of forearm muscles at rest and the impact of different motor tasks (that require distinct patterns of synergistic action between muscles) on the ECRBfw M1 representation. Consistent with our first hypothesis, the results support the notion that synergist muscles shared more M1 sites than muscles that act primarily as antagonists. Moreover, the percentage of overlap between ECRBfw maps generated in pairs of tasks (Rest‐Grip, Rest‐Ext, and Grip‐Ext) differed between each other suggesting that motor functions induce a dynamic shift in excitability within M1. Consistent with the second hypothesis, the contrast between ECRBfw maps generated during grip and wrist extension showed that specific discrete peaks were observed in each motor task, and thus different discrete M1 regions controlling ECRBfw could be involved in different motor functions. The results also show that surface EMG electrodes introduce errors in evaluation of map characteristics: ECRBfw showed a smaller normalized map volume than ECRBsurf and EDC, and map overlap was greater between ECRBsurf and EDC, than ECRBfw and EDC, which imply contribution of EDC to the surface electrode recording of ECRBsurf (i.e., cross‐talk).
Different ECRBfw M1 Areas are Involved in Different Motor Functions
Although the precise role of the discrete large peaks within M1 maps observed in previous studies remains unclear [Schabrun et al., 2015a, 2015b, 2016], we hypothesized that these discrete peaks could serve two different roles: (i) separate peaks within a M1 muscle representation for different functions and (ii) colocalization of individual MEP peaks (a single locus within M1) for different muscles that are involved in motor synergies or interjoint/intermuscle coordination used to achieve a specific task/activity. Several findings of the present study provide support for the first hypothesis. First, the contrast of ECRBfw M1 representation during grip and wrist extension showed that 13 out of the 14 participants had MEP maps with discrete peaks of excitability that were specific to each motor task. Second, in map contrast analysis, no significant difference was found between the number of peaks before and after maps contrast. That is, no peak was cancelled by map subtraction which indicates all peaks were either (i) specific to a specific task; or (ii) if peaks were colocalized, they had an amplitude that was greater in one task. In peak overlap analysis, only 26.8 ± 9.7% of the peaks shared an identical M1 site in both motor tasks and, the average distance between the largest peak in grip and in wrist extension was as much as 1.6 ± 0.3 cm away. Third, the map overlap remained small with less than half of the M1 sites co‐localized (47.9 ± 4.8%). Similar to our results, previous TMS studies tested the impact of various motor tasks on cortical function, although quantified in a different manner using evaluation of the recruitment curve (plotting MEP amplitude to multiple stimulator outputs). Those studies have shown differences in corticospinal excitability (MEP maximal amplitude) and gain (curve slope) of the recruitment curve, and also differences in intracortical inhibition that could represent the recruitment of discrete M1 areas for different motor tasks [Devanne et al., 2002; Kouchtir‐Devanne et al., 2012]. The latter results inform about the potential intrinsic connections undertaken between M1 representations of synergist muscles at one given motor cortical locus, that is, higher corticospinal excitability was observed during more functional synergies (e.g., pointing or gripping) than movement isolated at one joint (e.g., wrist extension or index abduction) [Devanne et al., 2002; Kouchtir‐Devanne et al., 2012]. Our results present a new but complementary perspective of the control of various movements and muscles by M1 showing than distinct discrete areas of the M1 ECRBfw representation (peaks of excitability) are present in each of the tasks tested. Future studies could benefit from combined analysis of recruitment curves and mapping to test whether both methods provide convergent evidence in support of discrete peaks of excitability within M1 in different motor tasks.
Possible Intracortical Mechanisms Underlying Dynamic Shift in Excitability Within M1
The distinct peaks of excitability observed in each motor task, in addition to the larger map and peak overlap between rest and wrist extension compared to rest and grip, might be explained by a dynamic shift in excitability within M1. For instance, the more complex multijoint grip task may require greater involvement of dynamic connections with a range of different muscles representations within M1 involved in the task (as with the fingers and thumb flexors) than the simpler one joint wrist extension, leading to different areas within ECRBfw M1 representation controlling each active task. Also, a dynamic shift of excitability within M1 may also be highlighted by the finding that ECRBfw maps generated during active tasks (grip and wrist extension) overlapped more than ECRBfw maps in each of these tasks compared to rest. In line, previous TMS and fMRI studies have shown differences between the organization of M1 at rest and during active tasks [Long et al., 2014; Raffin et al., 2015] providing further evidence that performing a given movement might dynamically modify the map observed at rest or for any different motor tasks. The dynamic modification of the map overlap could be explained by several intracortical mechanisms occurring within M1 while performing a movement. Diminution in the activity of inhibitory interneuron networks and the activation of excitatory networks within M1 take place before or during a movement [Chen and Hallett, 1999; Ridding et al., 1995]. Release of inhibitory influence on corticospinal neurons is an important mechanism for releasing motor synergies. For instance, injection of bicuculline (an antagonist of GABAA inhibitory receptor) released a complex multi‐joint movement after microstimulation of a single locus in cat's M1 whereas control and microstimulation in addition of an injection of glutamate produced a simpler single joint movement [Schneider et al., 2002]. Latter results and others are in favor that M1 muscle representations are linked by horizontal cortico‐cortical connections spreading to adjacent M1 representations (for a review, see Schieber [2001]). Those connections are believed to be the neural substrate allowing performance of a large range of functional movements by undertaking dynamic connections between synergist muscle representations involved in a given motor task. That might explain the different peaks of excitability and overlap observed between grip and wrist extension tasks [Capaday, 2004; Schieber, 2001].
Colocalization of the M1 Area Controlling Synergist Muscles
The concept of “functional somatotopy” suggests that overlap between muscle representations within M1 is required to achieve optimal intermuscle/interjoint coordination [Dechent and Frahm, 2003; Plow et al., 2010]. In this study, more M1 overlap was present between maps of ECRBfw–EDC and ECRBfw–FDS than ECRBfw–FCR at rest. It is reasonable to speculate that the greater overlap between ECRBfw–EDC and ECRBfw–FDS is related to their common synergistic activity in everyday life for tasks such as reach‐to‐grasp movement (i.e., with coupled wrist extension and finger extension during reaching followed by the continuous activation of wrist extensors for stabilizing the wrist during the activation of fingers flexors during grasping [Mogk and Keir, 2003]). Although ECRB and FCR might also act as synergists (e.g., during radial deviation), they are rarely activated together at the same time during different reach‐to‐grasp tasks [Martelloni et al., 2009]. Given that ECRB and FDS are strongly co‐activated during the performance of many different grips [Mogk and Keir, 2003], M1 could benefit by having closer muscle representations to facilitate the recruitment of synergist muscles involved in functional movements [Capaday, 2004; Schieber, 2001].
M1 Organization in Training and Pathology
In addition to M1 functional organization, map overlap between M1 representations has also been used as a marker of changes in motor control following training or in pathology. Long‐term adaptation (plasticity within M1) following motor skilled acquisition/practice seems to produce a closer M1 representations of synergist muscles. A previous study found that the deltoid muscle M1 representation overlapped more with ECR M1 representation of volleyball players than runners [Tyc et al., 2005]. This greater overlap was considered to represent an enhanced potential to produce efficient proximo‐distal synergies or inter‐joint coordination needed in volleyball. Similarly, 6 weeks of darts training increased the overlap between biceps brachii and deltoid muscle M1 representations [Tyc and Boyadjian, 2011]. Overlap between M1 areas is important to consider and it appears to be flexible and would appear to require fine balance (i.e., not too much or too little) for optimal motor control. Training increases the overlap of muscles involved in the movement learned in monkeys [Nudo et al., 1996] and humans [Tyc and Boyadjian, 2011], and is interpreted as a positive modification of the motor behavior. Although the prior and actual practice of learned fine motor skills (e.g., playing music instrument, knitting) could have influenced M1 organization and explain some of the variability observed in individual map, these data are not available in this study. In other hand, people with pain [Schabrun et al., 2015a, 2015b; Tsao et al., 2011b] and with dystonia [Schabrun et al., 2009] also present with greater overlap in M1 representations which has been interpreted to reflect a decrease in individuated motor control. Future studies should test whether discrete peak of excitability might inform about the enhancement and/or compromise of motor control in training and pathology.
Cross‐Talk Recording from Surface Electrodes
Previous TMS studies that have tested the percentage of overlap between muscle representations observed a high degree of convergence/overlap within M1. For instance, Melgari et al. [2008] described between 72% and 80% overlap between pairs of forearm M1 representations [Melgari et al., 2008]. In contrast, this study reported substantially lower values that ranged between 35.8% and 47.4%. This discrepancy in overlap between‐tasks and between‐muscles at rest is likely to be explained by our use of fine‐wire EMG electrodes, which contrasts previous studies. Differences between data for surface and fine‐wire electrode recordings have important implications for interpretation. In this study, the normalized map volume for ECRBsurf was larger than for ECRBfw at rest but not during grip. More strikingly, ECRBsurf M1 normalized map volume did not differ from EDC (measured by fine‐wire). Consistent with this, the percentage of map overlap was larger between EDC and ECRBsurf (i.e., 77.5% map overlap) than for ECRBsurf and ECRBfw (49.5%) at rest. During grip, there was no difference between these pairs of recordings (68.2% and 64.8%, respectively). EDC has a greater excitability at rest than ECRBfw, and if EDC myoelectric activity contributes to the ECRBsurf recording this could explain why the map overlap was large between ECRBsurf and EDC. The finding that peak overlap was larger between ECRBsurf and ECRBfw than for ECRBfw and EDC implies that than the analysis of discrete peaks recorded with surface electrodes is less likely to be contaminated by cross‐talk than the measures of normalized map volume although the percentage of MEP peaks overlap remains weak.
Consistent with our results, Gallina et al. [2016] have shown that the cross‐talk recorded by surface electrodes at rest is an important consideration for interpretation of TMS. This cross‐talk is reduced by the use of a muscle contraction that will “isolate” the target muscle, if possible [Gallina et al., 2016]. This shortcoming of TMS using surface electrodes requires consideration when mapping M1 muscle representations, that is, the M1 map overlap is likely to be higher than if using fine‐wire electrodes.
Methodological Considerations
We acknowledge that reliability of our measures is an important consideration. Although some data are available to support the reliability of 5 measures of MEP for stable estimates of amplitude, most data only consider surface EMG recordings, and some of our measures have not yet been subjected to detailed investigation of measurement properties (e.g., map overlap and number of peaks). Thus, reliability of the map outcomes using fine‐wire electrodes are not known and future studies are warranted to provide such data, especially the standard error of measure that is recommended to calculate for experimental studies [Beaulieu et al., 2017; Schambra et al., 2015].
CONCLUSIONS
These results suggest that different M1 areas are involved in different motor functions, and those functions impact on dynamic organization within M1. Specific and independent discrete peaks of excitability within M1 representation of ECRBfw were observed during grip and wrist extension. Furthermore, at rest, M1 representations of synergist muscles have greater overlap than muscles with primarily antagonist actions. Finally, these results also suggest that cross‐talk from adjacent muscles when recording responses to TMS with surface electrodes may have important implications for interpretation of data, especially at rest.
CONFLICT OF INTEREST
None of the authors has potential conflicts of interest to be disclosed.
ACKNOWLEDGMENTS
The funders had no role in study design, data collection and analysis, decision to publish, or preparation of the manuscript. The authors do not have any interest that might be interpreted as influencing the research.
REFERENCES
- Beaulieu LD, Flamand VH, Masse‐Alarie H, Schneider C (2017): Reliability and minimal detectable change of transcranial magnetic stimulation outcomes in healthy adults: A systematic review. Brain Stimul 10:196–213. [DOI] [PubMed] [Google Scholar]
- Beisteiner R, Windischberger C, Lanzenberger R, Edward V, Cunnington R, Erdler M, Gartus A, Streibl B, Moser E, Deecke L (2001): Finger somatotopy in human motor cortex. NeuroImage 13:1016–1026. [DOI] [PubMed] [Google Scholar]
- Bergin MJ, Tucker KJ, Vicenzino B, van den Hoorn W, Hodges PW (2014): Does movement variability increase or decrease when a simple wrist task is performed during acute wrist extensor muscle pain? Eur J Appl Physiol 114:385–393. [DOI] [PubMed] [Google Scholar]
- Brasil‐Neto JP, Cohen LG, Panizza M, Nilsson J, Roth BJ, Hallett M (1992): Optimal focal transcranial magnetic activation of the human motor cortex: Effects of coil orientation, shape of the induced current pulse, and stimulus intensity. J Clin Neurophysiol 9:132–136. [PubMed] [Google Scholar]
- Capaday C (2004): The integrated nature of motor cortical function. Neuroscientist 10:207–220. [DOI] [PubMed] [Google Scholar]
- Chen R, Hallett M (1999): The time course of changes in motor cortex excitability associated with voluntary movement. Can J Neurol Sci 26:163–169. [DOI] [PubMed] [Google Scholar]
- Cunningham DA, Machado A, Yue GH, Carey JR, Plow EB (2013): Functional somatotopy revealed across multiple cortical regions using a model of complex motor task. Brain Res 1531:25–36. [DOI] [PMC free article] [PubMed] [Google Scholar]
- Dechent P, Frahm J (2003): Functional somatotopy of finger representations in human primary motor cortex. Hum Brain Mapp 18:272–283. [DOI] [PMC free article] [PubMed] [Google Scholar]
- Devanne H, Cassim F, Ethier C, Brizzi L, Thevenon A, Capaday C (2006): The comparable size and overlapping nature of upper limb distal and proximal muscle representations in the human motor cortex. Eur J Neurosci 23:2467–2476. [DOI] [PubMed] [Google Scholar]
- Devanne H, Cohen LG, Kouchtir‐Devanne N, Capaday C (2002): Integrated motor cortical control of task‐related muscles during pointing in humans. J Neurophysiol 87:3006–3017. [DOI] [PubMed] [Google Scholar]
- Donoghue JP, Leibovic S, Sanes JN (1992): Organization of the forelimb area in squirrel monkey motor cortex: Representation of digit, wrist, and elbow muscles. Exp Brain Res 89:19. [DOI] [PubMed] [Google Scholar]
- Faes M, van EN, de LJA, Degens H, Kooloos JG, Hopman MT (2006): A dynamic extensor brace reduces electromyographic activity of wrist extensor muscles in patients with lateral epicondylalgia. J Orthop Sports Phys Ther 36:170–178. [DOI] [PubMed] [Google Scholar]
- Flament D, Goldsmith P, Buckley CJ, Lemon RN (1993): Task dependence of responses in first dorsal interosseous muscle to magnetic brain stimulation in man. J Physiol 464:361–378. [DOI] [PMC free article] [PubMed] [Google Scholar]
- Gagné M, Schneider C (2008): Dynamic influence of wrist flexion and extension on the intracortical inhibition of the first dorsal interosseus muscle during precision grip. Brain Res 1195:77–88. [DOI] [PubMed] [Google Scholar]
- Gallina A, Peters S, Neva JL, Boyd LA, Garland SJ (2016): Selectivity of conventional electrodes for recording motor evoked potentials: An investigation with high‐density surface electromyography. Muscle Nerve. [DOI] [PubMed] [Google Scholar]
- Hodges PW, Bui BH (1996): A comparison of computer‐based methods for the determination of onset of muscle contraction using electromyography. Electroencephalogr Clin Neurophysiol 101:511–519. [DOI] [PubMed] [Google Scholar]
- Hodges PW, Tucker K (2011): Moving differently in pain: A new theory to explain the adaptation to pain. Pain 152:S90–S98. [DOI] [PubMed] [Google Scholar]
- Humphrey, D , Tanji J (1991): What Features of Voluntary Motor Control are Encoded in the Neuronal Discharge of Different Cortical Motor Areas. Motor Control: Concepts and Issues. New York: Wiley; pp 413–444. [Google Scholar]
- Jacobs KM, Donoghue JP (1991): Reshaping the cortical motor map by unmasking latent intracortical connections. Science 251:944–947. [DOI] [PubMed] [Google Scholar]
- Jacobson C, Sperling L (1976): Classification of the hand‐grip: A preliminary study. J Occupat Environ Med 18:395–398. [Google Scholar]
- Kouchtir‐Devanne N, Capaday C, Cassim F, Derambure P, Devanne H (2012): Task‐dependent changes of motor cortical network excitability during precision grip compared to isolated finger contraction. J Neurophysiol 107:1522–1529. [DOI] [PubMed] [Google Scholar]
- Long X, Goltz D, Margulies DS, Nierhaus T, Villringer A (2014): Functional connectivity‐based parcellation of the human sensorimotor cortex. Eur J Neurosci 39:1332–1342. [DOI] [PubMed] [Google Scholar]
- Marconi B, Pecchioli C, Koch G, Caltagirone C (2007): Functional overlap between hand and forearm motor cortical representations during motor cognitive tasks. Clin Neurophysiol 118:1767–1775. [DOI] [PubMed] [Google Scholar]
- Martelloni C, Carpaneto J, Micera S (2009): Characterization of EMG patterns from proximal arm muscles during object‐ and orientation‐specific grasps. IEEE Trans Biomed Eng 56:2529–2536. [DOI] [PubMed] [Google Scholar]
- Meier JD, Aflalo TN, Kastner S, Graziano MS (2008): Complex organization of human primary motor cortex: A high‐resolution fMRI study. J Neurophysiol 100:1800–1812. [DOI] [PMC free article] [PubMed] [Google Scholar]
- Melgari JM, Pasqualetti P, Pauri F, Rossini PM (2008): Muscles in “concert”: Study of primary motor cortex upper limb functional topography. PLoS One 3:e3069. [DOI] [PMC free article] [PubMed] [Google Scholar]
- Mogk JP, Keir PJ (2003): The effects of posture on forearm muscle loading during gripping. Ergonomics 46:956–975. [DOI] [PubMed] [Google Scholar]
- Nudo RJ, Milliken GW, Jenkins WM, Merzenich MM (1996): Use‐dependent alterations of movement representations in primary motor cortex of adult squirrel monkeys. J Neurosci 16:785–807. [DOI] [PMC free article] [PubMed] [Google Scholar]
- Park MC, Belhaj‐Saif A, Gordon M, Cheney PD (2001): Consistent features in the forelimb representation of primary motor cortex in rhesus macaques. J Neurosci 21:2784–2792. [DOI] [PMC free article] [PubMed] [Google Scholar]
- Penfield W, Boldrey E (1937): Somatic motor and sensory representation in the cerebral cortex of man as studied by electrical stimulation. Brain 60:389–443. [Google Scholar]
- Plow EB, Arora P, Pline MA, Binenstock MT, Carey JR (2010): Within‐limb somatotopy in primary motor cortex–revealed using fMRI. Cortex 46:310–321. [DOI] [PubMed] [Google Scholar]
- Raffin E, Pellegrino G, Di Lazzaro V, Thielscher A, Siebner HR (2015): Bringing transcranial mapping into shape: Sulcus‐aligned mapping captures motor somatotopy in human primary motor hand area. NeuroImage 120:164–175. [DOI] [PubMed] [Google Scholar]
- Ridding MC, Inzelberg R, Rothwell JC (1995): Changes in excitability of motor cortical circuitry in patients with Parkinson's disease. Ann Neurol 37:181–188. [DOI] [PubMed] [Google Scholar]
- Rossi S, Hallett M, Rossini PM, Pascual‐Leone A (2009): Safety, ethical considerations, and application guidelines for the use of transcranial magnetic stimulation in clinical practice and research. Clin Neurophysiol 120:2008–2039. [DOI] [PMC free article] [PubMed] [Google Scholar]
- Rossini PM, Burke D, Chen R, Cohen LG, Daskalakis Z, Di Iorio R, Di Lazzaro V, Ferreri F, Fitzgerald PB, George MS, Hallett M, Lefaucheur JP, Langguth B, Matsumoto H, Miniussi C, Nitsche MA, Pascual‐Leone A, Paulus W, Rossi S, Rothwell JC, Siebner HR, Ugawa Y, Walsh V, Ziemann U (2015): Non‐invasive electrical and magnetic stimulation of the brain, spinal cord, roots and peripheral nerves: Basic principles and procedures for routine clinical and research application. An updated report from an I.F.C.N. Committee. Clin Neurophysiol 126:1071–1107. [DOI] [PMC free article] [PubMed] [Google Scholar]
- Samani A, Fernandez‐Carnero J, Arendt‐Nielsen L, Madeleine P (2011): Interactive effects of acute experimental pain in trapezius and sored wrist extensor on the electromyography of the forearm muscles during computer work. Appl Ergon 42:735–740. [DOI] [PubMed] [Google Scholar]
- Schabrun SM, Christensen SW, Mrachacz‐Kersting N, Graven‐Nielsen T (2016): Motor cortex reorganization and impaired function in the transition to sustained muscle pain. Cereb Cortex 26:1878–1890. [DOI] [PubMed] [Google Scholar]
- Schabrun SM, Elgueta‐Cancino EL, Hodges PW (2015a): Smudging of the motor cortex is related to the severity of low back pain. Spine (Phila Pa 1976). [DOI] [PubMed] [Google Scholar]
- Schabrun SM, Hodges PW, Vicenzino B, Jones E, Chipchase LS (2015b): Novel adaptations in motor cortical maps: The relation to persistent elbow pain. Med Sci Sports Exerc 47:681–690. [DOI] [PubMed] [Google Scholar]
- Schabrun SM, Jones E, Elgueta Cancino EL, Hodges PW (2014): Targeting chronic recurrent low back pain from the top‐down and the bottom‐up: A combined transcranial direct current stimulation and peripheral electrical stimulation intervention. Brain Stimul 7:451–459. [DOI] [PubMed] [Google Scholar]
- Schabrun SM, Stinear CM, Byblow WD, Ridding MC (2009): Normalizing motor cortex representations in focal hand dystonia. Cereb Cortex 19:1968–1977. [DOI] [PubMed] [Google Scholar]
- Schambra HM, Ogden RT, Martinez‐Hernandez IE, Lin X, Chang YB, Rahman A, Edwards DJ, Krakauer JW (2015): The reliability of repeated TMS measures in older adults and in patients with subacute and chronic stroke. Front Cell Neurosci 9:335. [DOI] [PMC free article] [PubMed] [Google Scholar]
- Schieber MH (2001): Constraints on somatotopic organization in the primary motor cortex. J Neurophysiol 86:2125–2143. [DOI] [PubMed] [Google Scholar]
- Schneider C, Devanne H, Lavoie BA, Capaday C (2002): Neural mechanisms involved in the functional linking of motor cortical points. Exp Brain Res 146:86–94. [DOI] [PubMed] [Google Scholar]
- Schneider C, Zytnicki D, Capaday C (2001): Quantitative evidence for multiple widespread representations of individual muscles in the cat motor cortex. Neurosci Lett 310:183–187. [DOI] [PubMed] [Google Scholar]
- Strother L, Medendorp WP, Coros AM, Vilis T (2012): Double representation of the wrist and elbow in human motor cortex. Eur J Neurosci 36:3291–3298. [DOI] [PubMed] [Google Scholar]
- Tsao H, Danneels L, Hodges PW (2011a): Individual fascicles of the paraspinal muscles are activated by discrete cortical networks in humans. Clin Neurophysiol 122:1580–1587. [DOI] [PubMed] [Google Scholar]
- Tsao H, Danneels LA, Hodges PW (2011b): ISSLS prize winner: Smudging the motor brain in young adults with recurrent low back pain. Spine (Phila Pa 1976), 36:1721–1727. [DOI] [PubMed] [Google Scholar]
- Tyc F, Boyadjian A (2011): Plasticity of motor cortex induced by coordination and training. Clin Neurophysiol 122:153–162. [DOI] [PubMed] [Google Scholar]
- Tyc F, Boyadjian A, Devanne H (2005): Motor cortex plasticity induced by extensive training revealed by transcranial magnetic stimulation in human. Eur J Neurosci 21:259–266. [DOI] [PubMed] [Google Scholar]
- Uy J, Ridding MC, Miles TS (2002): Stability of maps of human motor cortex made with transcranial magnetic stimulation. Brain Topogr 14:293–297. [DOI] [PubMed] [Google Scholar]
- Wassermann EM, McShane LM, Hallett M, Cohen LG (1992): Noninvasive mapping of muscle representations in human motor cortex. Electroencephalogr Clin Neurophysiol 85:1–8. [DOI] [PubMed] [Google Scholar]
- Zeharia N, Hertz U, Flash T, Amedi A (2012): Negative blood oxygenation level dependent homunculus and somatotopic information in primary motor cortex and supplementary motor area. Proc Natl Acad Sci USA 109:18565–18570. [DOI] [PMC free article] [PubMed] [Google Scholar]