

Abstract
Schizophrenia is a complex disorder that may be the result of aberrant connections between specific brain regions rather than focal brain abnormalities. Here, we investigate the relationships between brain structural connectivity as described by network analysis, intelligence, symptoms, and polygenic risk scores (PGRS) for schizophrenia in a group of patients with schizophrenia and a group of healthy controls. Recently, researchers have shown an interest in the role of high centrality networks in the disorder. However, the importance of non‐central networks still remains unclear. Thus, we specifically examined network‐averaged fractional anisotropy (mean edge weight) in central and non‐central subnetworks. Connections with the highest betweenness centrality within the average network (>75% of centrality values) were selected to represent the central subnetwork. The remaining connections were assigned to the non‐central subnetwork. Additionally, we calculated graph theory measures from the average network (connections that occur in at least 2/3 of participants). Density, strength, global efficiency, and clustering coefficient were significantly lower in patients compared with healthy controls for the average network (p FDR < 0.05). All metrics across networks were significantly associated with intelligence (p FDR < 0.05). There was a tendency towards significance for a correlation between intelligence and PGRS for schizophrenia (r = −0.508, p = 0.052) that was significantly mediated by central and non‐central mean edge weight and every graph metric from the average network. These results are consistent with the hypothesis that intelligence deficits are associated with a genetic risk for schizophrenia, which is mediated via the disruption of distributed brain networks. Hum Brain Mapp 38:5919–5930, 2017. © 2017 Wiley Periodicals, Inc.
Keywords: schizophrenia, diffusion tensor MRI, connectivity, intelligence, genetics, symptoms
INTRODUCTION
Schizophrenia is a neuropsychiatric disorder characterized by delusions, hallucinations, absence of function, and cognitive impairments. It is increasingly seen as the result of aberrant connections between specific brain regions rather than focal brain abnormalities (Friston, 1998; Friston and Frith, 1995; Stephan et al., 2006, 2009). The dysconnectivity hypothesis of schizophrenia suggests that abnormal brain integration may underlie the cognitive profile and symptoms found in the disorder. There is consistent evidence supporting reduced levels of overall structural connectivity in schizophrenia using diffusion tensor MRI (DT‐MRI) with frontal, parietal, and temporal projections being the most consistently impaired in the disorder (Skudlarski et al., 2010; van den Heuvel et al., 2010; van den Heuvel and Fornito, 2014; Zalesky et al., 2011). Additionally, more specific white matter alterations in the uncinate fasciculus, corpus callosum, cingulum, and arcuate fasciculus are consistently described (reviewed in Burns et al., 2003; Ellison‐Wright and Bullmore, 2009; McIntosh et al., 2005). Even though a number of studies have discussed the importance of white matter impairments in schizophrenia, there is still no consensus on how to measure structural dysconnectivity in the disorder. One approach is to characterize how impairments in white matter microstructure affect the organization of the structural connectome using graph theory, which conceives the brain as a network composed of nodes and the connections (edges) between them (Bullmore and Sporns, 2009). Graph theory segregation measures, such as clustering coefficient and modularity, are reportedly altered in schizophrenia (Alexander‐Bloch et al., 2010; van den Heuvel et al., 2013; van den Heuvel and Fornito, 2014; Zalesky et al., 2011) suggesting a more segregated pattern of network organization. In line with this hypothesis, numerous authors have found longer path lengths and reductions in communication efficiency, proposing reduced communication between more segregated areas of the brain (reviewed in van den Heuvel and Fornito, 2014).
Nodes and edges can be associated with peripheral or more central tasks, depending on their degree of connectivity and their position within or between modules (Sporns, 2011). Nodes characterized by high degree and high centrality are termed “hubs.” Several lines of investigation have suggested that topological organization of hub nodes appear to be altered in schizophrenia. Both structural covariance and structural connectivity studies in schizophrenia suggest a less hierarchical organization, a less prominent role of high degree hub regions such as the prefrontal and parietal cortex, while nonfrontal hubs emerge more prominently (Bassett et al., 2008; Guusje Collin et al., 2013; Zhang et al., 2012). Rubinov et al. (2009) suggested that a characteristic of the disorder is a randomization of connections, an alteration of community structure which results in impaired integration and segregation, and reduced centrality of cortical hubs. Most brain imaging studies in schizophrenia focus on these effects in networks with high centrality while the remaining connections are overlooked (Collin et al., 2014; Schmidt et al., 2016). Owing to the apparent hierarchical disorganization of the brain in schizophrenia, the role of these central nodes may be displaced to other brain regions or networks. Thus, in this study, we address specifically networks based on centrality to investigate this hypothesis. Even though the cognitive and symptomatic implications of various network metrics have been addressed, there has been little discussion about the role of non‐central networks in the disorder.
Schizophrenia is associated with cognitive deficits; some correlations between intelligence and the brain's function and structure have been described in healthy participants. Although there are a small number of established associations between intelligence and brain basic structural parameters, such as fractional anisotropy (FA), the relationship between the observed white matter alterations in schizophrenia and intelligence remains unclear. However, graph theory metrics may be able to provide greater explanatory power for these cognitive deficits in schizophrenia than more traditional structural connectivity measures, such as FA (Alloza et al., 2016). There is some evidence that structural network metrics are related to intelligence and that there is a degree of shared genetic overlap between schizophrenia and these measures. For instance, Li et al. (2009) found significant correlations between intelligence and network properties in a healthy cohort of subjects. Specifically, higher intelligence scores were associated with shorter path lengths and higher global efficiency. Yeo et al. (2016) showed that global measures of increased characteristic path length and reduced overall connectivity predicted lower general intelligence in a group of patients with schizophrenia, while van den Heuvel et al. (2009) also found a strong negative correlation between characteristic path length and IQ suggesting that more efficiently connected brains tend to show higher levels of intelligence. Hence, graph theory metrics may provide an insight into the underlying brain structural substrate for intelligence.
Differences in structural connectivity are useful for establishing brain topology abnormalities in schizophrenia compared with healthy participants. However, as our aim is to shed light on the clinical manifestation of schizophrenia, we therefore examine the extent to which clinical symptoms are associated with brain extracted measures. What we know about brain connectivity and clinical symptoms is largely based on empirical studies that investigate the relationship between white matter and different symptom's scales. For instance, FA of specific white matter tracts has been significantly associated with positive symptoms in the disorder. These tracts include the internal capsule, fronto‐occipital fasciculus, superior longitudinal fasciculus, cingulum, and corpus callosum (Mitelman et al., 2007; Rotarska‐Jagiela et al., 2008; Seok et al., 2007). To date, several authors have examined the effects of graph theory metrics of connectivity on symptomatology in schizophrenia. Positive symptom severity has been associated with reduced overall connectivity, increases and decreases in structural and functional coupling, strength of temporal and frontal regions, reduced network efficiency, and reduced clustering (reviewed in van den Heuvel and Fornito, 2014). Wang et al. (2012) found significant associations between global efficiency and positive, negative, and total symptoms. However, most studies focus on functional connectivity determined using fMRI and thus, uncertainty remains regarding the relationship between structural connectivity measured in central, non‐central, and average networks and genetic risk factors.
Graph theory analysis has shown that impairments present in patients with schizophrenia are also found in their relatives suggesting a genetic basis (Clemm von Hohenberg et al., 2014; Guusje Collin et al., 2014; Skudlarski et al., 2013). Moreover, topological network properties have been found to be heritable (Thompson et al., 2013). For instance, in white matter FA, the variance explained by genetic factors has been reported to be between 75% and 90% in almost every white matter tract (Chiang et al., 2011). Moreover, in the same study, heritability of FA was associated with the level of IQ. Genome‐wide association studies (GWAS) have indicated a polygenic component of schizophrenia with hundreds of common alleles of small effect at the population level having been reported (International Schizophrenia Consortium et al., 2009; Schizophrenia Working Group of the Psychiatric Genomics Consortium, 2014). Thus far, only a small number of studies have analyzed the relationship between polygenic risk scores (PGRS), neuroimaging biomarkers, and/or cognition (Birnbaum and Weinberger, 2013; McIntosh et al., 2013; Whalley et al., 2015). Connectomic measures are, potentially, possible intermediate phenotypes between genetic liability and cognitive deficits in schizophrenia.
In this study, we investigate the relationships between brain structural connectivity described by network‐averaged FA (mean edge weight) measured in central and non‐central networks and by graph theory metrics calculated from the average network (defined as networks in which connections that occur in at least two‐thirds of participants are retained) in relation to intelligence, clinical symptoms and PGRS for schizophrenia in patients with schizophrenia and healthy controls. We will focus on graph theory metrics that have been consistently reported to be impaired in schizophrenia, namely mean edge weight, density, strength, clustering coefficient, and global efficiency in the average network. Due to the severely affected hierarchical disorganization of the brain found in schizophrenia, our aim is to investigate the roles central and non‐central network mean edge weight play in this disorder. Thus, this is the first study where intelligence, symptoms, and PGRS have been studied together in relation to networks based on their centrality. Specifically, we hypothesized that impaired structural organization of the networks (decreased mean edge weight, density, strength, clustering coefficient, and global efficiency) will be associated with lower intelligence, higher genetic risk factor for schizophrenia, and higher symptom score.
METHODS
Participants
Information about participants has been reported in detail previously (Whalley et al., 2015). Participants were recruited across Scotland as part of the Scottish Family Mental Health Study. DT‐MRI data were acquired from a total of 28 individuals diagnosed with schizophrenia and 36 healthy controls. Diagnosis of schizophrenia was confirmed using the structured clinical interview for DSM IV (SCID) administered by one of two trained psychiatrists (First et al., 2002). Exclusion criteria included any major medical or neurological conditions, or any personal history of substance misuse in the last year. Additionally, subjects were excluded if there were MRI safety considerations. A detailed description of the study was given to all recruited individuals, and all participants provided written informed consent. The study was approved by the Multicentre Research Ethics Committee for Scotland (09/MRE00/81).
Scan Acquisition
All imaging data were collected on an MAGNETOM Verio 3T MRI scanner running Syngo MR B17 software (Siemens Healthcare, Erlangen, Germany). For each subject, whole‐brain DT‐MRI data were acquired using a prototype single‐shot spin‐echo echo‐planar (EP) imaging sequence with diffusion‐encoding gradients applied in 56 directions (b = 1,000 s/mm2) and six T2‐weighted (b = 0 s/mm2) baseline scans. Fifty‐five 2.5‐mm‐thick axial slices were acquired with a field‐of‐view of 240 × 240 mm and matrix 96 × 96 giving 2.5 mm isotropic voxels. In the same session, a 3D T1‐magnetization‐prepared rapidly acquired gradient‐echo (MPRAGE) volume was acquired in the coronal plane with 160 contiguous slices and 1 mm isotropic voxel resolution.
Image Analysis
Image processing
Each 3D T1‐weighted MPRAGE volume was parcellated into 85 (Desikan‐Killiany atlas; Desikan et al., 2006) and 165 (Destrieux atlas) regions‐of‐interest (ROIs) using FreeSurfer (http://surfer.nmr.mgh.harvard.edu). The results of the segmentation procedure were then used to construct grey and white matter masks for use in network construction and to constrain the tractography output as described below. Using tools provided by the FDT package in FSL (http://fsl.fmrib.ox.ac.uk/fsl), the DT‐MRI data were preprocessed to reduce systematic imaging distortions and bulk subject motion artifacts by affine registration of all subsequent EP volumes to the first T2‐weighted EP volume (Jenkinson and Smith, 2001). Skull stripping and brain extraction were performed on the registered T2‐weighted EP volumes and applied to the FA volume calculated by DTIFIT in each subject (Basser and Pierpaoli, 1996; Smith, 2002). The neuroanatomical ROIs determined by Freesurfer were then aligned from 3D T1‐weighted volume to diffusion space using a cross‐modal nonlinear registration method. As a first step, linear registration was used to initialize the alignment of each brain‐extracted FA volume to the corresponding FreeSurfer extracted 3D T1‐weighted brain volume using a mutual information cost function and an affine transform with 12 degrees of freedom (Jenkinson and Smith, 2001). Following this initialization, a nonlinear deformation field based method (FNIRT) was used to refine local alignment (Andersson et al., 2007). FreeSurfer segmentations and anatomical labels were then aligned to diffusion space using nearest neighbour interpolation.
Tractography
Whole‐brain probabilistic tractography was performed using FSL's BedpostX/ProbTrackX algorithm (Behrens et al., 2007). Probability density functions, which describe the uncertainty in the principal directions of diffusion, were computed with a two‐fiber model per voxel (Behrens et al., 2007). Streamlines were then constructed by sampling from these distributions during tracking using 100 Markov Chain Monte Carlo iterations with a fixed step size of 0.5 mm between successive points. Tracking was initiated from all white matter voxels (Buchanan et al., 2014) and streamlines were constructed in two collinear directions until terminated by the following stopping criteria designed to minimize the amount of anatomically implausible streamlines: (i) exceeding a curvature threshold of 70°; (ii) entering a voxel with FA below 0.1 (Verstraete et al., 2011); (iii) entering an extracerebral voxel; (iv) exceeding 200 mm in length; and (v) exceeding a distance ratio metric of 10. The distance ratio metric (Bullitt et al., 2003), excludes implausibly tortuous streamlines. For instance, a streamline with a total path length 10 times longer than the distance between end points was considered to be invalid. The values of the curvature, anisotropy, and distance ratio metric constraints were set empirically and informed by visual assessment of the resulting streamlines.
Network construction
FA‐weighted networks were constructed by recording the mean FA value along streamlines connecting all ROI (network node) pairs. The endpoint of a streamline was considered to be the first grey‐matter ROI encountered when tracking from the seed location.
In this study, we assume the existence of a central subnetwork that is shared across participants (Reijmer et al., 2016). To identify this central subnetwork, the average brain network across both patients and controls was determined by including those connections which occurred in more than two‐thirds of the participants (de Reus and van den Heuvel, 2013). Connections with the highest centrality (the fraction of all shortest paths in the network that contain a given connection, also referred as “edge betweenness centrality”) within this average network (>threshold value of 75%) were selected and used to create a mask representing the central subnetwork. The remaining connections were assigned to the non‐central subnetwork mask. Therefore, connections with high values of centrality are involved in a large number of shortest paths and as a consequence contribute to the global efficiency of the network. These masks were then used as templates and applied to each participant's connectivity matrix to select central and non‐central subnetworks. As the threshold value of 75% is arbitrary, analyses were repeated for thresholds of 25% and 50% of connections with highest centrality.
Organizational properties of the different networks were then obtained using the brain connectivity toolbox (http://www.brain-connectivity-toolbox.net ). For each FA‐weighted connectivity matrix for the average network, five global network measures were computed, namely, mean edge weight (mean value of FA across the network), density (the fraction of present connections to possible connections), strength (the average sum of weights per node), clustering coefficient (fraction of triangles around a node), and global efficiency (the average of the inverse shortest path length). As a result of possible alterations in topology when extracting central and non‐central networks, only mean edge weight was computed for these subnetworks (Reijmer et al., 2016).
Polygenic Risk Score Calculation
PGRS is a method to aggregate the small effects that contribute to the liability of schizophrenia on predicting the disorder. The capacity to predict onset of schizophrenia has been established and has been reported to explain up to 7% of additive genetic liability for the disorder (Schizophrenia Working Group of the Psychiatric Genomics Consortium, 2014). PGRS for schizophrenia were created for all individuals with suitable genotype data; only genotypes passing stringent quality control were used in analyses. PGRS for schizophrenia were estimated using summary data from an independent GWAS of schizophrenia in 150,064 individuals (36,989 cases and 113,075 controls), conducted by the Psychiatric Genomics Consortium (Schizophrenia Working Group of the Psychiatric Genomics Consortium, 2014). PGRS were estimated using the PRSice software package according to previously described protocols (Euesden et al., 2015), with linkage disequilibrium and distance thresholds for clumping of r 2 = 0.2 and within a 300 kb window. Five scores were created for each individual using single‐nucleotide polymorphisms (SNPs) selected according to the significance of their association with the phenotype at nominal p value thresholds of 0.01, 0.05, 0.1, 0.5, and 1.0 (all SNPs). For the analysis, we used the threshold of 0.5 which explained the most variance in our data and has been reported to maximally capture schizophrenia liability (International Schizophrenia Consortium et al., 2009). The four multidimensional scaling factors were entered as additional “nuisance” covariates to control for population stratification, along with age.
Cognitive Testing and Medication
Participants underwent cognitive assessment using tests from the Wechsler Adult Intelligence Scale (WASI; Wechsler, 1955) using standard administration and scoring procedures. Symptom severity was assessed using the Positive and Negative Symptoms Scale (PANSS) (Kay et al., 1987). Full‐scale IQ was derived from four subtests of the WASI: vocabulary, block design, similarities, and matrix reasoning. Participants also provided information on antipsychotic medication which was transformed into chlorpromazine equivalents (CPZ) (Woods, 2003).
Statistical Analysis
Group differences were analyzed using a multivariate general linear model (GLM). Dependent variables were mean edge weight for central, non‐central, and connectivity metrics for the average networks separately. Age, sex, diagnosis, and the interaction between diagnosis and sex were entered as predictors. FA was added as additional predictor in the average network analysis. Owing to small sample size, effect sizes were then calculated using Hedges' g and based on the p value of the individual analysis of covariance (ANCOVAS). Using the whole sample, regression analyses were then performed separately for central, non‐central, and average metrics and IQ. Due to the distribution of data, PANSS positive, negative, and total symptom scores were only analyzed in the patient sample. For both models, age, gender, and CPZ were used as covariates. p values (α = 0.05) were corrected for multiple comparisons using false discovery rate (FDR; p FDR) (Benjamini and Hochberg, 1995). Analyses were repeated for varying threshold values to define the number of central connections (25%, 50%, and 75%). Analyses were also repeated for different Freesurfer brain atlases (Desikan and Destrieux). Regression models were then applied to investigate the association between risk score and case–control status in the whole sample. Connectivity metrics were dependent variables and principal components for population stratification, PGRS, age, gender, and diagnosis were used as predictors. All statistical analyses were performed with R version 3.2.3 (https://www.r-project.org).
Mediation analysis was subsequently used to examine the hypothesis that higher PGRS is related to poorer intelligence via reduced structural connectivity. We employed the PROCESS macro in SPSS 22.0 (Hayes and Rockwood, 2016) to formally quantify mediation effects using 5000 bootstrapped samples. Due to our clear directional hypothesis, a one‐tailed test of mediation was conducted (http://www.afhayes.com). Mediation effects were considered significant if the confidence interval (CI) did not include zero (Preacher and Hayes, 2008).
RESULTS
Table 1 shows the demographic data for both healthy controls and schizophrenia patients.
Table 1.
Demographic details for healthy controls and patients with schizophrenia
| HC | SZ | P value | |
|---|---|---|---|
| Age in years (SD) | 37.22 (14.99) | 38.04 (10.34) | 0.807 |
| Gender, M/F (%) | 53/47 | 57/43 | 0.733 |
| IQ (SD) | 116.11 (10.75) | 105.09 (15.89) | 0.003 |
| PANSS positive (SD) [range] | 12.30 (5.19) [7, 28] | ||
| PANSS negative (SD) [range] | 13 (7.05) [7, 35] | ||
| PANSS total (SD) [range] | 51.64 (17.33) [34, 91] | ||
| Age of onset in years (SD) | 25.25 (9.89) | ||
| Duration of illness in years (SD) | 13.58 (10.30) | ||
| CPZ (SD) | 434.97 (371.90) |
HC, healthy controls; SZ, schizophrenia; CPZ, chlorpromazine equivalents; SD, standard deviation.
Bold typeface indicates significant group difference (P < 0.05).
Average Network
Diagnosis (F (5, 54) = 703.1, p < 0.001, partial eta squared = 0.080), age (F (5, 54) = 137.64, p < 0.001, partial eta squared = 0.030), gender (F (5, 54) = 19.80, p < 0.001, partial eta squared = 0.032), and mean edge weight (FA) (F (5, 54) = 15263.7, p < 0.001, partial eta squared = 0.001) effects were significant for the average network graph theory metrics.
As indicated in Table 2, there were significant differences in network density (Hedges' g = 0.54 (0.03, 1.05), p FDR = 0.04), strength (Hedges' g = 1.08 (0.54, 1.62), p FDR < 0.001), global efficiency (Hedges' g = 1.95 (1.34, 2.56), p FDR < 0.001), and clustering coefficient (Hedges' g = 1.94 (1.33, 2.55), p FDR < 0.001) between groups. Mean edge weight showed a tendency towards significance (Hedges' g = 0.43 (−0.07, 0.93), p FDR = 0.08). All metrics were reduced in patients compared to healthy controls. Boxplots for group differences can be found in Supporting Information, Figure 1.
Table 2.
Mean ± standard deviation (SD) values of connectivity metrics in the average network for healthy controls and patients with schizophrenia
| Average | |||
|---|---|---|---|
| Metric | HC | SZ | P FDR |
| Mean edge weight | 0.44 ± 0.02 | 0.43 ± 0.02 | 0.08 |
| Density | 33.15 ± 0.92 | 32.56 ± 1.25 | 0.04 |
| Strength | 12.31 ± 0.57 | 11.88 ± 0.73 | <0.001 |
| Global efficiency | 0.30 ± 0.01 | 0.30 ± 0.01 | <0.001 |
| Clustering coefficient | 0.30 ± 0.01 | 0.30 ± 0.01 | <0.001 |
HC, healthy controls; SZ, schizophrenia.
Bold typeface indicates significant group difference (P FDR < 0.05).
Central Subnetwork
Figure 1 shows the network maps for the central (>75% of centrality values) and non‐central subnetworks across all participants. There was no significant difference in central subnetwork mean edge weight between patients with schizophrenia and healthy controls (mean HC = 0.45, SD = ± 0.02; mean SZ = 0.44, SD = ± 0.02) (Hedges' g = 0.36 95% CI (−0.14, 0.86), p > 0.05). Central mean edge weight was reduced in patients compared with healthy controls.
Figure 1.
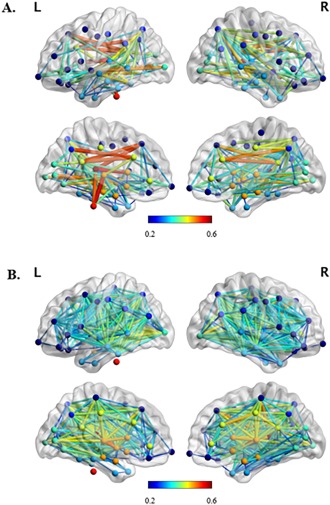
Medium view of (A) central (>75% of centrality values) and (B) non‐central subnetworks for all participants indicating node location and edge (FA) strength. The nodes which are connected by edges with the highest weights (FA > 0.5) in the central subnetwork are brainstem, left hemisphere precuneus cortex, thalamus, caudate, ventral diencephalon and superior frontal gyrus, bilateral caudal anterior division of the cingulate cortex, and isthmus division of the cingulate gyrus. Nodes are color‐coded to indicate the lobe in which they are situated. [Color figure can be viewed at http://wileyonlinelibrary.com]
Non‐central Subnetwork
There was a tendency towards significance for a difference in mean edge weight between patients with schizophrenia and healthy controls (mean HC = 0.44, SD = ± 0.02; mean SZ = 0.43, SD = ± 0.02) (Hedges' g = 0.45 95% CI (−0.06, 0.95), p = 0.07). Non‐central mean edge weight was reduced in patients compared with healthy controls.
Age, Antipsychotic Medication, and Illness Duration
There were positive significant associations between age, mean edge weight (r = −0.290, p = 0.02) and clustering coefficient (r = −0.269, p = 0.03) for the average network. However, these associations did not survive multiple comparison correction (p FDR > 0.05). Antipsychotic medication show a significant effect on mean edge weight (r = −0.262, p FDR = 0.048), strength (r = −0.287, p FDR = 0.048), global efficiency (r = −0.263, p FDR = 0.048), and clustering coefficient (r = −0.270, p FDR = 0.048) for the average network. Neither antipsychotic medication nor age had a significant effect on central mean edge weight. However, age (r = −0.313, p = 0.012) and CPZ (r = −0.271, p = 0.033) showed a significant effect on non‐central mean edge weight. There were no significant associations between network metrics and illness duration for any of the metrics (p FDR > 0.05).
IQ
Regression coefficients between IQ and the average network graph theory metrics are shown in Table 3. All metrics were significantly associated with IQ (r range 0.284–0.471). For central network, mean edge weight was significantly associated with IQ (r = 0.344, p = 0.010). For non‐central network, mean edge weight was also significantly associated with IQ (r = 0.338, p = 0.014). Medication, as CPZ equivalents, did not show any significant effect in central, non‐central, and average networks. Scatterplots with the associations between metrics and IQ can be found in Supporting Information, Figures 2 and 3.
Table 3.
Correlation matrix for IQ and connectivity metrics for the average network
| Metric | R | P FDR |
|---|---|---|
| Mean edge weight | 0.343 | 0.016 |
| Density | 0.284 | 0.045 |
| Strength | 0.471 | 0.004 |
| Global efficiency | 0.394 | 0.007 |
| Clustering coefficient | 0.434 | 0.004 |
Bold type indicates significant associations (P FDR < 0.05).
Clinical Symptoms
Table 4 shows the regression coefficients for positive, negative, and total symptom scores and central, non‐central mean edge weight, and average network connectivity metrics. Central network mean edge weight showed a tendency towards significance in relation to total symptoms (r = −0.348, p = 0.073). The addition of medication as a covariate in the model made the associations weaker and non‐significant (p > 0.05). However, medication did not have any significant effect in the regression model.
Table 4.
Correlation matrix for PANSS and connectivity metrics for central (>75% of centrality values), non‐central, and average networks
| Metric | Positive | Negative | Total | |
|---|---|---|---|---|
| Central mean edge weight | −0.282 | −0.184 | −0.348 | |
| Non‐central mean edge weight | −0.206 | −0.163 | −0.268 | |
| Average | Mean edge weight | −0.101 | −0.118 | −0.178 |
| Density | −0.195 | −0.041 | −0.092 | |
| Strength | −0.201 | −0.114 | −0.193 | |
| Global efficiency | −0.132 | −0.133 | −0.195 | |
| Clustering coefficient | −0.114 | −0.119 | −0.178 |
This table shows the associations between symptoms and metrics using CPZ as a covariate.
Polygenic Risk Score
The association between genetic risk score at a threshold of p ≤ 0.5 and case–control status in the total sample was significant (p < 0.05). The regression estimate of the genetic risk score at the threshold p ≤ 0.5 was 0.44 (adjusted R‐square = 0.057; p = 0.029).
Next, we studied the association between central and non‐central mean edge weight and average network graph theory measures and PGRS. None of the connectivity metrics was significantly associated with PGRS across networks (p FDR > 0.05). Regression analysis between IQ and PGRS at a threshold of p ≤ 0.5 showed a tendency towards significance (r = −0.742, p = 0.052). There was no significant correlation between PGRS and symptoms (p FDR > 0.05).
Mediation Analysis
We aimed to identify mediation candidates that were consistent with the hypothesis that a greater genetic predisposition for schizophrenia is partly related to lower intelligence through the disruption of brain connectivity. As indicated by the bivariate association, the correlation between IQ and PGRS (r = −0.742, p = 0.052) showed a tendency towards significance. The negative correlation between PGRS and IQ suggests a genetic liability to intelligence; mediation analysis allows us to quantify the role of topological network measures in this relationship. Given the substantial effect sizes, and the need to consider mediation in terms of zero and nonzero rather than using p values in isolation (Hayes, 2009), we tested whether the direct effect of PGRS and IQ was significantly mediated by mean edge weight and average network metrics (i.e., magnitude of change from path c to path c′; Fig. 2A). The results are shown in Figure 2B,C. A bias‐corrected bootstrap CI for the indirect effect based on 5,000 bootstrap samples served as a formal statistical test of the degree to which mean edge weight mediated the relationship between PGRS and IQ. The 30.52% reduction in magnitude (β = −0.154 to β = −0.107) identified central mean edge weight as a significant partial mediator (CI not containing zero; −0.363 to −0.055). For non‐central mean edge weight (Fig. 2C), the reduction in magnitude was 46.62% (β = −0.474 to β = −0.253) identifying also non‐central mean edge weight as a significant partial mediator (CI −0.673 to −0.050). The model was corrected for age and population stratification components. Additionally, Table 5 shows the mediation results for the metrics of the average network.
Figure 2.
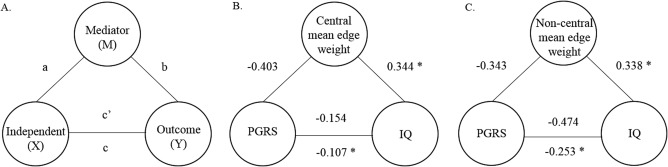
(A) Schematic representation of relationships where an independent variable (X) and an outcome (Y) are hypothesized to be explained by a mediator (M). The direct effect of X on M is a, the effect of M on Y is b, and the effect of X on Y is c. c′ denotes the effect of X on Y when M is taking into account in the model. (B) Representation of the variables analyzed in this study, where X = polygenic risk score for schizophrenia (PGRS at P ≤ 0.5), Y = IQ and M = mean edge weight (central). (C) X = polygenic risk score for schizophrenia (PGRS at P ≤ 0.5), Y = IQ and M = mean edge weight (non‐central). Asterisks represent statistically significant partial correlations.
Table 5.
Mediation analysis for the average network
| β | % | Mediation model | ||||||
|---|---|---|---|---|---|---|---|---|
| X | Y | M | c | c′ | Attenuation | F(df) | Lower CI | Upper CI |
| PGRS | IQ | Mean edge weight | −0.474 | −0.253 | 46.62 | 8.20 (2, 43) | −0.657 | −0.048 |
| PGRS | IQ | Density | −0.527 | −0.168 | 62.76 | 4.63 (2, 43) | −0.431 | −0.002 |
| PGRS | IQ | Strength | −0.288 | −0.439 | −52.43 | 14.20 (2, 43) | −0.893 | −0.142 |
| PGRS | IQ | Global efficiency | −0.376 | −0.348 | 7.44 | 9.85 (2, 43) | −0.765 | −0.117 |
| PGRS | IQ | Clustering coefficient | −0.405 | −0.326 | 19.50 | 10.66 (2, 43) | −0.705 | −0.090 |
X: independent variable; Y: outcome variable; M: mediator; c: path from X to Y; c′: path from X to Y accounting for M.
Bold type face indicates significant mediation effect (confidence intervals do not include 0; Preacher and Hayes, 2008) and after FDR correction (P FDR < 0.05).
All tests of mediation are one‐tailed and bias‐corrected.
Additional Analyses: Network Density
Using network density as a covariate did not significantly affect the results of any of the regression models described above.
Additional Analyses: Thresholds
Results for the different thresholds of centrality (25% and 50%) showed that associations between intelligence, symptoms, and mean edge weight were comparable across thresholds (data not shown).
Additional Analyses: Destrieux Atlas
Group differences using the Destrieux atlas (165 regions) as a parcellation scheme showed no significant differences between patients and controls for mean edge weight for both central and non‐central mean edge weight (p > 0.05). Graph theory metric results from the average network showed larger differences between groups and stronger associations with intelligence. Results were in the expected direction. Nevertheless, analyses showed comparable results across both atlases for central and non‐central mean edge weight and metrics from the average network (data not shown).
DISCUSSION
This study was set out to assess the ability of graph theory metrics in schizophrenia to build a coherent model from brain structure, cognition, and genetics. This is, to our knowledge, the first study reporting results for both high and low centrality networks in schizophrenia, and provides much‐needed structural MRI perspective on links between brain connectivity and intelligence in this population. We sought to investigate the evolving hypothesis that schizophrenia is a hub disease in which central connections are more severely affected in contrast to non‐central connections. Our data indicate that this may not be the case. Instead, schizophrenia may be a disorder characterized by the disruption of distributed brain regions affecting the whole brain, rather than exclusively affecting hubs. Our study supports the conceptualization of schizophrenia as a disorder characterized by impaired integration between brain regions rather than local brain abnormalities.
The network analysis reported here shows that structural connectivity abnormalities are present in the schizophrenia patient group. Specifically, most graph theory metrics from the average network were significantly reduced in the patient sample compared with healthy controls. These results are consistent with previous findings (van den Heuvel and Fornito, 2014), in particular, density, strength, global efficiency, and clustering coefficient were significantly reduced in the patient group compared with controls. The central subnetwork was principally composed of subcortical areas and regions located in the frontal and parietal lobes. Mean edge weight (FA) for central and non‐central subnetworks, was not significantly different between patients and healthy controls. Taken together, these results suggest that in schizophrenia, the structural connectome is characterized by weaker connections being less segregated and less integrated compared with healthy controls. Thus, here we have shown that differences between patients and controls can be found in the average network, suggesting the presence of more extensive impairments that are seemingly not limited to central connections.
We also found that every graph theory metric across the different networks was significantly associated with IQ. These results are likely to reflect the integrative nature of intelligence, involving distributed brain networks that comprise a wide variety of cognitive functions (Colom et al., 2010). The absence of an interaction between graph theory metrics and group indicates that the same effect occurs in healthy participants and schizophrenia patients. These results are consistent with those of Li et al. (2009) who reported that IQ was positively correlated with global efficiency and negatively with path length. Central and non‐central mean edge weight (FA) were positively associated with IQ, this is in accordance with numerous investigations assessing, for instance, relationships between intelligence and general factors of FA (Alloza et al., 2016; Chiang et al., 2009; Deary et al., 2006; Penke et al., 2010; Yu et al., 2008). Thus, in this study, we have been able to establish robust associations between intelligence and the structural connectome in schizophrenia.
The dysconnection hypothesis proposes that altered topological connectivity and abnormal integration between distinct brain regions may underlie the symptomatology found in the disorder (Stephan et al., 2006, 2009). In this study, none of the graph metrics were significantly associated with positive, negative, or total symptoms. These results suggest that symptoms may be specifically based on deficiencies in distinctive networks. For instance, positive symptoms include hallucinations, delusions, and thought disorders, while negative symptoms comprise blunted affect, alogia, anhedonia, asociality, and avolition. These processes are likely to comprise distant and unique regions (i.e., visual hallucinations could be associated with visual processing) and therefore, may not be captured by an average network or by networks based on centrality. Thus far, a number of functional studies have investigated the effects of graph theory metrics on symptomatology (Bassett et al., 2012; Skudlarski et al., 2010). One study reported that higher levels of positive and negative symptoms were associated with reduced clustering coefficient and increased path lengths (Shim et al., 2014). A further study found that local connectome organization relates to longitudinal increases in overall PANSS, in particular, these associations were driven by clustering coefficient (Collin et al., 2016). Previous studies have found negative correlations between FA (using DT‐MRI) and positive, negative, and total PANSS score (Michael et al., 2008; Skelly et al., 2008). For instance, negative correlations between FA and negative symptoms in specific white matter tracts, such as the corpus callosum, have been reported (Nakamura et al., 2012). However, the inconsistency of the findings may be the result of different methodological techniques, use of medication, and heterogeneity of the disease.
In the central and non‐central subnetworks, comparable associations were found between intelligence and mean edge weights across all thresholds. Stronger associations were found for symptoms with non‐central mean edge weight when considering the top 75% of network connections based on their centrality. A lower centrality threshold (25%–50% central connections) showed weaker correlations, probably because of a reduced specificity of the subnetwork and exclusion of some important connections.
There is an overlap between the genetic risk factor for schizophrenia and intelligence (Glahn et al., 2007; McIntosh et al., 2013; Toulopoulou et al., 2007) and thus, brain structure may be an intermediate phenotype between genetics and intelligence. In this study we have shown that central and non‐central mean edge weight significantly mediated the relationship between genetics and intelligence between 30% and 47%, respectively. Moreover, every graph theory metric from the average network significantly mediated this relationship. Thus, we propose that structural brain topology measures are potential intermediate phenotypes in this model. Although metrics were not significantly associated with PGRS, statistical significance of all paths is not a prerequisite to determining a mediation model (Hayes and Rockwood, 2016). The approach taken here detected moderate effect sizes and had the ability to formally quantify the degree and significance of the mediation. However, better‐powered studies are needed to confirm this.
These findings suggest that prominent associations and disruptions occur also in average and non‐central networks, which are not driven by medication effects and are present across different brain parcellation schemes. We hypothesize that the construction of subnetworks in schizophrenia may be affected by its inherent reduced centrality and thus, central networks may include less central connections. This is in line with a recent publication where the authors propose that schizophrenia may not be entirely, nor specifically, a hub disease (Griffa et al., 2015). Based on previous literature and the limitation of our own study, we propose that schizophrenia is a disorder characterized by the disruption of distributed brain regions affecting the whole brain rather than hubs exclusively. Our study therefore supports the conceptualization of schizophrenia as a disorder characterized by impaired integration between brain regions rather than local brain abnormalities.
LIMITATIONS
Our findings are limited by the intrinsic nature of the methodology implemented. For example, limitations associated with DT‐MRI—a technique that relies on water diffusion as an indirect marker for white matter microstructure which has not yet been able to resolve complex fiber architecture (Jones et al., 2013)—need to be acknowledged.
Other limitations include the fact that most of the patients in this study used antipsychotic medication, which may affect structural brain connectivity (Szeszko et al., 2014). Nonetheless, it should be noted that impaired white matter connectivity has also been shown in never‐medicated patients (Cheung et al., 2008; Mandl et al., 2013). Additionally, the patients were recruited from outpatient clinics, thus generalizability of the results may be less applicable to more severely affected populations. Moreover, the sample size used is small by contemporary standards raising the possibility of Type II errors. Thus interpretations of our novel but preliminary results should be taken cautiously. To further validate the results presented here, replication of this study using larger datasets is needed.
Supporting information
Supporting Information
ACKNOWLEDGMENTS
The authors would like to thank all the participants who took part in this study and the radiographers who acquired the MRI data at the Clinical Research Imaging Centre, University of Edinburgh (http://www.cric.ed.ac.uk). They are also grateful to Professor Edwin van Beek for assistance with overall co‐ordination of the study and for radiological reporting of the structural MRI scans. The investigators also acknowledge the financial support of National Health Service (NHS) Research Scotland, through the Scottish Mental Health Research Network (http://www.smhrn.org.uk) who provided assistance with subject recruitment and cognitive assessments. This work was supported by an award from the Translational Medicine Research Collaboration—a consortium made up of the Universities of Aberdeen, Dundee, Edinburgh and Glasgow, the four associated NHS Health Boards (Grampian, Tayside, Lothian, and Greater Glasgow and Clyde), Scottish Enterprise, and Pfizer, who have reviewed and approved the manuscript. The authors would also like to thank Dr Thorsten Feiweier from Siemens Healthcare for providing the prototype diffusion sequence used in this study.
REFERENCES
- Alexander‐Bloch AF, Gogtay N, Meunier D, Birn R, Clasen L, Lalonde F, Lenroot R, Giedd J, Bullmore ET (2010): Disrupted modularity and local connectivity of brain functional networks in childhood‐onset schizophrenia. Front Syst Neurosci 4:147. [DOI] [PMC free article] [PubMed] [Google Scholar]
- Alloza C, Cox SR, Duff B, Semple SI, Bastin ME, Whalley HC, Lawrie SM (2016): Information processing speed mediates the relationship between white matter and general intelligence in schizophrenia. Psychiatry Res 254:26–33. [DOI] [PubMed] [Google Scholar]
- Andersson JL, Jenkinson M, Smith S (2007): Non‐Linear Registration, aka Spatial Normalisation FMRIB Technical Report TR07JA2, Vol. 2 FMRIB Analysis Group of the University of Oxford. [Google Scholar]
- Basser PJ, Pierpaoli C (1996): Microstructural and physiological features of tissues elucidated by quantitative‐diffusion‐tensor MRI. J Magn Reson Ser B 111:209–219. [DOI] [PubMed] [Google Scholar]
- Bassett DS, Bullmore E, Verchinski BA, Mattay VS, Weinberger DR, Meyer‐Lindenberg A (2008): Hierarchical organization of human cortical networks in health and schizophrenia. J Neurosci 28:9239–9248. [DOI] [PMC free article] [PubMed] [Google Scholar]
- Bassett DS, Nelson BG, Mueller BA, Camchong J, Lim KO (2012): Altered resting state complexity in schizophrenia. NeuroImage 59:2196–2207. [DOI] [PMC free article] [PubMed] [Google Scholar]
- Behrens TEJ, Berg HJ, Jbabdi S, Rushworth MFS, Woolrich MW (2007): Probabilistic diffusion tractography with multiple fibre orientations: What can we gain? NeuroImage 34:144–155. [DOI] [PMC free article] [PubMed] [Google Scholar]
- Benjamini Y, Hochberg Y (1995): Controlling the false discovery rate: A practical and powerful approach to multiple testing. J R Stat Soc Ser B (Methodol) 57:289–300. [Google Scholar]
- Birnbaum R, Weinberger DR (2013): Functional neuroimaging and schizophrenia: A view towards effective connectivity modeling and polygenic risk. Dialog Clin Neurosci 15:279–289. [DOI] [PMC free article] [PubMed] [Google Scholar]
- Buchanan CR, Pernet CR, Gorgolewski KJ, Storkey AJ, Bastin ME (2014): Test‐retest reliability of structural brain networks from diffusion MRI. NeuroImage 86:231–243. [DOI] [PubMed] [Google Scholar]
- Bullitt E, Gerig G, Pizer SM, Lin W, Aylward SR (2003): Measuring tortuosity of the intracerebral vasculature from MRA images. IEEE Trans Med Imag 22:1163–1171. [DOI] [PMC free article] [PubMed] [Google Scholar]
- Bullmore E, Sporns O (2009): Complex brain networks: Graph theoretical analysis of structural and functional systems. Nat Rev Neurosci 10:186–198. [DOI] [PubMed] [Google Scholar]
- Burns J, Job D, Bastin ME, Whalley H, Macgillivray T, Johnstone EC, Lawrie SM (2003): Structural disconnectivity in schizophrenia: A diffusion tensor magnetic resonance imaging study. Br J Psychiatry 182:439–443. [PubMed] [Google Scholar]
- Cheung V, Cheung C, McAlonan GM, Deng Y, Wong JG, Yip L, Tai KS, Khong PL, Sham P, Chua SE (2008): A diffusion tensor imaging study of structural dysconnectivity in never‐medicated, first‐episode schizophrenia. Psychol Med 38:877–885. [DOI] [PubMed] [Google Scholar]
- Chiang M‐C, Barysheva M, Shattuck DW, Lee AD, Madsen SK, Avedissian C, Klunder AD, Toga AW, McMahon KL, Zubicaray GI, de Wright MJ, Srivastava A, Thompson PM (2009): Genetics of brain fiber architecture and intellectual performance. J Neurosci 29:2212–2224. [DOI] [PMC free article] [PubMed] [Google Scholar]
- Chiang M‐C, McMahon KL, de Zubicaray GI, Martin NG, Hickie I, Toga AW, Wright MJ, Thompson PM (2011): Genetics of white matter development: A DTI study of 705 twins and their siblings aged 12 to 29. NeuroImage 54:2308–2317. [DOI] [PMC free article] [PubMed] [Google Scholar]
- Clemm von Hohenberg C, Pasternak O, Kubicki M, Ballinger T, Vu M‐A, Swisher T, Green K, Giwerc M, Dahlben B, Goldstein JM, Woo T‐UW, Petryshen TL, Mesholam‐Gately RI, Woodberry KA, Thermenos HW, Mulert C, McCarley RW, Seidman LJ, Shenton ME (2014): White matter microstructure in individuals at clinical high risk of psychosis: A whole‐brain diffusion tensor imaging study. Schizophr Bull 40:895–903. [DOI] [PMC free article] [PubMed] [Google Scholar]
- Collin G, de Nijs J, Hulshoff Pol HE, Cahn W, van den Heuvel MP (2016): Connectome organization is related to longitudinal changes in general functioning, symptoms and IQ in chronic schizophrenia. Schizophr Res 173:166–173. [DOI] [PubMed] [Google Scholar]
- Collin G, de Reus MA, Cahn W, Hulshoff Pol HE, Kahn RS, van den Heuvel MP (2013): Disturbed grey matter coupling in schizophrenia. Eur Neuropsychopharmacol 23:46–54. [DOI] [PubMed] [Google Scholar]
- Collin G, Kahn RS, Reus D, A, M, Cahn W, Heuvel VD, P, M (2014): Impaired rich club connectivity in unaffected siblings of schizophrenia patients. Schizophr Bull 40:438–448. [DOI] [PMC free article] [PubMed] [Google Scholar]
- Colom R, Karama S, Jung RE, Haier RJ (2010): Human intelligence and brain networks. Dialog Clin Neurosci 12:489–501. [DOI] [PMC free article] [PubMed] [Google Scholar]
- de Reus MA, van den Heuvel MP (2013): Estimating false positives and negatives in brain networks. NeuroImage 70:402–409. [DOI] [PubMed] [Google Scholar]
- Deary IJ, Bastin ME, Pattie A, Clayden JD, Whalley LJ, Starr JM, Wardlaw JM (2006): White matter integrity and cognition in childhood and old age. Neurology 66:505–512. [DOI] [PubMed] [Google Scholar]
- Desikan RS, Ségonne F, Fischl B, Quinn BT, Dickerson BC, Blacker D, Buckner RL, Dale AM, Maguire RP, Hyman BT, Albert MS, Killiany RJ (2006): An automated labeling system for subdividing the human cerebral cortex on MRI scans into gyral based regions of interest. NeuroImage 31:968–980. [DOI] [PubMed] [Google Scholar]
- Ellison‐Wright I, Bullmore E (2009): Meta‐analysis of diffusion tensor imaging studies in schizophrenia. Schizophr Res 108:3–10. [DOI] [PubMed] [Google Scholar]
- Euesden J, Lewis CM, O'Reilly PF (2015): PRSice: Polygenic risk score software. Bioinformatics (Oxford, England) 31:1466–1468. [DOI] [PMC free article] [PubMed] [Google Scholar]
- First MB, Spitzer RL, Gibbon M, Williams JBW (2002): Structured Clinical Interview for DSM‐IV‐TR Axis I Disorders, Research Version, Patient Edition. (SCID‐I/P) New York: Biometrics Research. State Psychiatric Institute, New York.
- Friston KJ (1998): The disconnection hypothesis. Schizophr Res 30:115–125. [DOI] [PubMed] [Google Scholar]
- Friston KJ, Frith CD (1995): Schizophrenia: A disconnection syndrome? Clin Neurosci (New York, N.Y.) 3:89–97. [PubMed] [Google Scholar]
- Glahn DC, Almasy L, Blangero J, Burk GM, Estrada J, Peralta JM, Meyenberg N, Castro MP, Barrett J, Nicolini H, Raventós H, Escamilla MA (2007): Adjudicating neurocognitive endophenotypes for schizophrenia. Am J Med Genet B Neuropsychiatr Genet 144B:242–249. [DOI] [PubMed] [Google Scholar]
- Griffa A, Baumann PS, Ferrari C, Do KQ, Conus P, Thiran J‐P, Hagmann P (2015): Characterizing the connectome in schizophrenia with diffusion spectrum imaging. Hum Brain Mapp 36:354–366. [DOI] [PMC free article] [PubMed] [Google Scholar]
- Hayes AF (2009): Beyond Baron and Kenny: Statistical mediation analysis in the new millennium. Commun Monogr 76:408–420. [Google Scholar]
- Hayes AF, Rockwood NJ (2016): Regression‐based statistical mediation and moderation analysis in clinical research: Observations, recommendations, and implementation. Behav Res Therapy. doi: 10.1016/j.brat.2016.11.001. [DOI] [PubMed] [Google Scholar]
- International Schizophrenia Consortium , Purcell SM, Wray NR, Stone JL, Visscher PM, O'Donovan MC, Sullivan PF, Sklar P (2009): Common polygenic variation contributes to risk of schizophrenia and bipolar disorder. Nature 460:748–752. [DOI] [PMC free article] [PubMed] [Google Scholar]
- Jenkinson M, Smith S (2001): A global optimisation method for robust affine registration of brain images. Med Image Anal 5:143–156. [DOI] [PubMed] [Google Scholar]
- Jones DK, Knösche TR, Turner R (2013): White matter integrity, fiber count, and other fallacies: The do's and don'ts of diffusion MRI. NeuroImage 73:239–254. [DOI] [PubMed] [Google Scholar]
- Kay SR, Fiszbein A, Opler LA (1987): The positive and negative syndrome scale (PANSS) for schizophrenia. Schizophr Bull 13:261–276. [DOI] [PubMed] [Google Scholar]
- Li Y, Liu Y, Li J, Qin W, Li K, Yu C, Jiang T (2009): Brain anatomical network and intelligence. PLoS Comput Biol 5:e1000395. [DOI] [PMC free article] [PubMed] [Google Scholar]
- Mandl RCW, Rais M, van Baal GCM, van Haren NEM, Cahn W, Kahn RS, Pol HEH (2013): Altered white matter connectivity in never‐medicated patients with schizophrenia. Hum Brain Mapp 34:2353–2365. [DOI] [PMC free article] [PubMed] [Google Scholar]
- McIntosh AM, Gow A, Luciano M, Davies G, Liewald DC, Harris SE, Corley J, Hall J, Starr JM, Porteous DJ, Tenesa A, Visscher PM, Deary IJ (2013): Polygenic risk for schizophrenia is associated with cognitive change between childhood and old age. Biol Psychiatry 73:938–943. [DOI] [PubMed] [Google Scholar]
- McIntosh AM, Job DE, Moorhead TWJ, Harrison LK, Lawrie SM, Johnstone EC (2005): White matter density in patients with schizophrenia, bipolar disorder and their unaffected relatives. Biol Psychiatry 58:254–257. [DOI] [PubMed] [Google Scholar]
- Michael AM, Calhoun VD, Pearlson GD, Baum SA, Caprihan A (2008): Correlations of diffusion tensor imaging values and symptom scores in patients with schizophrenia. Conference proceedings: Annual International Conference of the IEEE Engineering in Medicine and Biology Society. Annual Conference. IEEE Eng Med Biol Soc 2008:5494–5497. [DOI] [PubMed] [Google Scholar]
- Mitelman SA, Torosjan Y, Newmark RE, Schneiderman JS, Chu K‐W, Brickman AM, Haznedar MM, Hazlett EA, Tang CY, Shihabuddin L, Buchsbaum MS (2007): Internal capsule, corpus callosum and long associative fibers in good and poor outcome schizophrenia: A diffusion tensor imaging survey. Schizophr Res 92:211–224. [DOI] [PubMed] [Google Scholar]
- Nakamura K, Kawasaki Y, Takahashi T, Furuichi A, Noguchi K, Seto H, Suzuki M (2012): Reduced white matter fractional anisotropy and clinical symptoms in schizophrenia: A voxel‐based diffusion tensor imaging study. Psychiatry Res Neuroimag 202:233–238. [DOI] [PubMed] [Google Scholar]
- Penke L, Maniega SM, Murray C, Gow AJ, Hernández MCV, Clayden JD, Starr JM, Wardlaw JM, Bastin ME, Deary IJ (2010): A general factor of brain white matter integrity predicts information processing speed in healthy older people. J Neurosci 30:7569–7574. [DOI] [PMC free article] [PubMed] [Google Scholar]
- Preacher KJ, Hayes AF (2008): Asymptotic and resampling strategies for assessing and comparing indirect effects in multiple mediator models. Behav Res Methods 40:879–891. [DOI] [PubMed] [Google Scholar]
- Reijmer YD, Fotiadis P, Piantoni G, Boulouis G, Kelly KE, Gurol ME, Leemans A, O'Sullivan MJ, Greenberg SM, Viswanathan A (2016): Small vessel disease and cognitive impairment: The relevance of central network connections. Hum Brain Mapp 37:2446–2454. [DOI] [PMC free article] [PubMed] [Google Scholar]
- Rotarska‐Jagiela A, Schönmeyer R, Oertel V, Haenschel C, Vogeley K, Linden DEJ (2008): The corpus callosum in schizophrenia‐volume and connectivity changes affect specific regions. NeuroImage 39:1522–1532. [DOI] [PubMed] [Google Scholar]
- Rubinov M, Knock SA, Stam CJ, Micheloyannis S, Harris AWF, Williams LM, Breakspear M (2009): Small‐world properties of nonlinear brain activity in schizophrenia. Hum Brain Mapp 30:403–416. [DOI] [PMC free article] [PubMed] [Google Scholar]
- Schizophrenia Working Group of the Psychiatric Genomics Consortium (2014): Biological insights from 108 schizophrenia‐associated genetic loci. Nature 511:421–427. [DOI] [PMC free article] [PubMed] [Google Scholar]
- Schmidt A, Crossley NA, Harrisberger F, Smieskova R, Lenz C, Riecher‐Rössler A, Lang UE, McGuire P, Fusar‐Poli P, Borgwardt S (2016): Structural network disorganization in subjects at clinical high risk for psychosis. Schizophr Bull 43:583–591. [DOI] [PMC free article] [PubMed] [Google Scholar]
- Seok J‐H, Park H‐J, Chun J‐W, Lee S‐K, Cho HS, Kwon JS, Kim J‐J (2007): White matter abnormalities associated with auditory hallucinations in schizophrenia: A combined study of voxel‐based analyses of diffusion tensor imaging and structural magnetic resonance imaging. Psychiatry Res 156:93–104. [DOI] [PubMed] [Google Scholar]
- Shim M, Kim D‐W, Lee S‐H, Im C‐H (2014): Disruptions in small‐world cortical functional connectivity network during an auditory oddball paradigm task in patients with schizophrenia. Schizophr Res 156:197–203. [DOI] [PubMed] [Google Scholar]
- Skelly LR, Calhoun V, Meda SA, Kim J, Mathalon DH, Pearlson GD (2008): Diffusion tensor imaging in schizophrenia: Relationship to symptoms. Schizophr Res 98:157–162. [DOI] [PMC free article] [PubMed] [Google Scholar]
- Skudlarski P, Jagannathan K, Anderson K, Stevens MC, Calhoun VD, Skudlarska BA, Pearlson G (2010): Brain connectivity is not only lower but different in schizophrenia: A combined anatomical and functional approach. Biol Psychiatry 68:61–69. [DOI] [PMC free article] [PubMed] [Google Scholar]
- Skudlarski P, Schretlen DJ, Thaker GK, Stevens MC, Keshavan MS, Sweeney JA, Tamminga CA, Clementz BA, O'Neil K, Pearlson GD (2013): Diffusion tensor imaging white matter endophenotypes in patients with schizophrenia or psychotic bipolar disorder and their relatives. Am J Psychiatry 170:886–898. [DOI] [PubMed] [Google Scholar]
- Smith SM (2002): Fast robust automated brain extraction. Hum Brain Mapp 17:143–155. [DOI] [PMC free article] [PubMed] [Google Scholar]
- Sporns O (2011): The non‐random brain: Efficiency, economy, and complex dynamics. Front Comput Neurosci 5, 5. [DOI] [PMC free article] [PubMed] [Google Scholar]
- Stephan KE, Baldeweg T, Friston KJ (2006): Synaptic plasticity and dysconnection in schizophrenia. Biol Psychiatry 59:929–939. [DOI] [PubMed] [Google Scholar]
- Stephan KE, Friston KJ, Frith CD (2009): Dysconnection in schizophrenia: From abnormal synaptic plasticity to failures of self‐monitoring. Schizophr Bull 35:509–527. [DOI] [PMC free article] [PubMed] [Google Scholar]
- Szeszko PR, Robinson DG, Ikuta T, Peters BD, Gallego JA, Kane J, Malhotra AK (2014): White matter changes associated with antipsychotic treatment in first‐episode psychosis. Neuropsychopharmacology 39:1324–1331. [DOI] [PMC free article] [PubMed] [Google Scholar]
- Thompson PM, Ge T, Glahn DC, Jahanshad N, Nichols TE (2013): Genetics of the connectome. NeuroImage 80:475–488. [DOI] [PMC free article] [PubMed] [Google Scholar]
- Toulopoulou T, Picchioni M, Rijsdijk F, Hua‐Hall M, Ettinger U, Sham P, Murray R (2007): Substantial genetic overlap between neurocognition and schizophrenia: Genetic modeling in twin samples. Arch Gen Psychiatry 64:1348–1355. [DOI] [PubMed] [Google Scholar]
- van den Heuvel MP, van den Mandl RCW, Stam CJ, Kahn RS, Pol HEH (2010): Aberrant frontal and temporal complex network structure in schizophrenia: A graph theoretical analysis. J Neurosci 30:15915–15926. [DOI] [PMC free article] [PubMed] [Google Scholar]
- van den Heuvel MP, Fornito A (2014): Brain networks in schizophrenia. Neuropsychol Rev 24:32–48. [DOI] [PubMed] [Google Scholar]
- van den Heuvel MP, Sporns O, Collin G, Scheewe T, Mandl RCW, Cahn W, Goñi J, Hulshoff Pol HE, Kahn RS (2013): Abnormal rich club organization and functional brain dynamics in schizophrenia. JAMA Psychiatry 70:783–792. [DOI] [PubMed] [Google Scholar]
- van den Heuvel MP, Stam CJ, Kahn RS, Hulshoff Pol HE (2009): Efficiency of functional brain networks and intellectual performance. J Neurosci 29:7619–7624. [DOI] [PMC free article] [PubMed] [Google Scholar]
- Verstraete E, Veldink JH, Mandl RCW, van den Berg LH, van den Heuvel MP (2011): Impaired structural motor connectome in amyotrophic lateral sclerosis. PLoS One 6:e24239. [DOI] [PMC free article] [PubMed] [Google Scholar]
- Wang Q, Su T‐P, Zhou Y, Chou K‐H, Chen I‐Y, Jiang T, Lin C‐P (2012): Anatomical insights into disrupted small‐world networks in schizophrenia. NeuroImage 59:1085–1093. [DOI] [PubMed] [Google Scholar]
- Wechsler D (1955): Manual for the Wechsler Adult Intelligence Scale, Vol. vi Oxford, England: Psychological Corp. [Google Scholar]
- Whalley HC, Hall L, Romaniuk L, Macdonald A, Lawrie SM, Sussmann JE, McIntosh AM (2015): Impact of cross‐disorder polygenic risk on frontal brain activation with specific effect of schizophrenia risk. Schizophr Res 161:484–489. [DOI] [PMC free article] [PubMed] [Google Scholar]
- Woods SW (2003): Chlorpromazine equivalent doses for the newer atypical antipsychotics. J Clin Psychiatry 64:663–667. [DOI] [PubMed] [Google Scholar]
- Yeo RA, Ryman SG, van den Heuvel MP, de Reus MA, Jung RE, Pommy J, Mayer AR, Ehrlich S, Schulz SC, Morrow EM, Manoach D, Ho B‐C, Sponheim SR, Calhoun VD (2016): Graph metrics of structural brain networks in individuals with schizophrenia and healthy controls: Group differences, relationships with intelligence, and genetics. J Int Neuropsychol Soc 22:240–249. [DOI] [PubMed] [Google Scholar]
- Yu C, Li J, Liu Y, Qin W, Li Y, Shu N, Jiang T, Li K (2008): White matter tract integrity and intelligence in patients with mental retardation and healthy adults. NeuroImage 40:1533–1541. [DOI] [PubMed] [Google Scholar]
- Zalesky A, Fornito A, Seal ML, Cocchi L, Westin C‐F, Bullmore ET, Egan GF, Pantelis C (2011): Disrupted axonal fiber connectivity in schizophrenia. Biol Psychiatry 69:80–89. [DOI] [PMC free article] [PubMed] [Google Scholar]
- Zhang Y, Lin L, Lin C‐P, Zhou Y, Chou K‐H, Lo C‐Y, Su T‐P, Jiang T (2012): Abnormal topological organization of structural brain networks in schizophrenia. Schizophr Res 141:109–118. [DOI] [PubMed] [Google Scholar]
Associated Data
This section collects any data citations, data availability statements, or supplementary materials included in this article.
Supplementary Materials
Supporting Information