

Abstract
Based on cytoarchitecture, the posterior cingulate cortex (PCC) is thought to be comprised of two distinct functional subregions: the dorsal and ventral PCC (dPCC and vPCC). However, functional subregions do not completely match anatomical boundaries in the human brain. To understand the relationship between the functional organization of regions and anatomical features, it is necessary to apply parcellation algorithms based on functional properties. We therefore defined functionally informed subregions in the human PCC by parcellation of regions with similar patterns of functional connectivity in the resting brain. We used various patterns of functional connectivity, namely local, whole‐brain and diffuse functional connections of the PCC, and various clustering methods, namely hierarchical, spectral, and k‐means clustering to investigate the subregions of the PCC. Overall, the approximate anatomical boundaries and predicted functional regions were highly overlapped to each other. Using hierarchical clustering, the PCC could be clearly separated into two anatomical subregions, namely the dPCC and vPCC, and further divided into four subregions segregated by local functional connectivity patterns. We show that the PCC could be separated into two (dPCC and vPCC) or four subregions based on local functional connections and hierarchical clustering, and that subregions of PCC display differential global functional connectivity, particularly along the dorsal‐ventral axis. These results suggest that differences in functional connectivity between dPCC and vPCC may be due to differences in local connectivity between these functionally hierarchical subregions of the PCC. Hum Brain Mapp 38:2808–2818, 2017. © 2017 Wiley Periodicals, Inc.
Keywords: functional magnetic resonance imaging, brain connectivity, resting state, clustering algorithms, human brain
INTRODUCTION
Primates, including humans, have two subregions of the posterior cingulate cortex (PCC) that have been defined based on cytoarchitecture. The dorsal posterior cingulate cortex (dPCC) resides superior to the splenium of the corpus callosum, and corresponds to areas d23a‐c, and d31, while the ventral posterior cingulate cortex (vPCC) is situated posterior to the splenium, and includes areas v23a, v23b, and v31 [Vogt, 2009; Vogt et al., 2005, 2006]. The dPCC and vPCC display significant differences in structural connectivity with both cortex [Cavada and Goldman‐Rakic, 1989a; Palomero‐Gallagher et al., 2009; Vogt and Pandya, 1987] and thalamus [Shibata and Masao, 2003]. While the dPCC connects to caudal cingulate motor regions, vPCC communicates with mesial temporal structures as well as subgenual anterior cingulate cortex (ACC) [Cauda et al., 2010; Vogt et al., 2006]. In addition, resting state functional magnetic resonance imaging (RS FMRI) studies in humans and macaques have shown a clear functional dissociation between dPCC and vPCC [Bzdok et al., 2015; Leech et al., 2011; Margulies et al., 2009]. However, neuroanatomical parcellation‐based functional connectivity analysis of RS FMRI data indicated that the functional connectivity patterns of the dPCC and vPCC in humans are very similar, with both regions mainly correlating with the default mode network (DMN) [Yu et al., 2011]. In addition, connectivity‐based parcellation of human diffusion tensor imaging data did not reveal distinct PCC subregions [Zhang et al., 2014].
Notably, the parcellation methods that were used in these studies were based on anatomical rather than functional features. Anatomical boundaries, based on features such as cytoarchitecture, sulcus and gyrus patterns, have long been used to classify brain areas [Brodmann, 1994; Fischl et al., 2004; Toga et al., 2006; Zilles and Amunts, 2010]. While anatomical features may sometimes correspond well with functional organization, mismatches between anatomical boundaries and functional architecture have been identified in most areas [Frost and Goebel, 2012; Yeo et al., 2011]. Therefore, the results of RS FMRI analyses can be highly dependent on whether the parcellation method that is used to define regions of interest (ROI) is based on anatomical landmarks or functional features. Furthermore, results obtained using functional parcellation methods depend on the particular functional features that are used to define functionally distinct regions. One approach, for example, is to parcellate regions based solely on properties of the local signal [Cauda et al., 2010], while it is also possible to parcellate areas based on whole brain functional connectivity profiles [Kim et al., 2010], as well as on connectivity with the whole brain excluding the region in question [Kahnt et al., 2012]. Furthermore, parcellation can be accomplished using a variety of algorithms, including hierarchical [Blumensath et al., 2013], k‐means [Kim et al., 2010], and spectral clustering [Craddock et al., 2012], which may further impact the results of functional connectivity studies.
To understand the functional organization of the PCC, we defined the subregions of the human PCC using several parcellation methods that utilize functional connectivity patterns. In this work, the term PCC refers to area 23, while area 31 is included in the precuneal cortex. We chose to apply this schema because area 23 is the largest cortical area in the primate PCC, while area 31 is more often classified as a transition zone to the medial parietal cortex [Vogt and Gabriel, 1993]. Local, diffuse, and whole‐brain functional connectivity patterns of seed points located in the PCC were obtained, and clustering was accomplished by commonly used methods, namely hierarchical, spectral, and k‐means clustering. Finally, we examined the specific patterns of functional connectivity for each PCC subregion.
MATERIALS AND METHODS
MRI Data
We performed our analyses using publicly available imaging data from the State Key Laboratory of Cognitive Neuroscience and Learning at Beijing Normal University (n = 198), which is part of the 1,000 Functional Connectomes Project [Biswal et al., 2010]. All data are available at http://www.nitrc.org/projects/fcon_1000/. The bias for functional connections along axes of head motion is smaller in this dataset compared to another dataset [Saad et al., 2013]. Details of image acquisition protocols are described on the website. Briefly, whole‐brain echo‐planar imaging (EPI) time series scans (TR, 2 s; 33 slices; 3.125 × 3.125 × 3.6 mm3 voxel resolution) consisted of 225 volumes and lasted for 7.5 min. In addition, a high‐resolution T1‐weighted anatomical image was also acquired (voxel size = 1.33 × 1.0 × 1.0 mm3). To minimize noise, only male subjects were selected for further analysis and data from 53 male subjects that exhibited sharp head motion artifacts, inconsistent data orientation, highly global connectivity (>0.2), and errors during the regression of the nuisance covariates were excluded. At the motion correction stage, we performed motion censoring for head motion artifacts [Jo et al., 2013] using estimated translational and rotational displacement with respect to the x, y, and z axes. The threshold set was an estimated displacement of less than 0.3 mm for the Euclidean L2 norm of motion displacement between successive time series volumes and less than 0.5 mm translations in any of the three directions or less than 0.5° of maximum rotations around any of the axes. Head‐coil artifacts were also checked visually by observing the contribution of local white matter signals in the time series, and no strong artifact was detected across brain tissue types [Jo et al., 2010]. Following these quality control steps, data from 23 subjects (mean age 21.5 ± 2.15 years) met our criteria and were included in this study. In addition, the analysis was repeated using both male and female subjects (female, n = 23, age = 21.52 ± 1.59 years) (see Supporting Information for more detail).
Preprocessing of MRI Data
The overall data preprocessing and parcellation procedures are presented in Figure 1. Anatomical T1 images were coregistered to the first functional image using a local Pearson correlation cost function [Saad et al., 2009]. Aligned anatomical T1 images were then processed with CIVET–Montreal Neurological Institute (MNI) image processing software for generating individual whole‐brain segmentation and cortical surface models. Nonuniform artifacts in the image were corrected using an N3 algorithm [Sled et al., 1998]. The corrected images were registered into a standardized stereotaxic space using a linear transformation [Collins et al., 1994], and subsequently classified into white matter, gray matter, cerebrospinal fluid, and background using an artificial neural net classifier [Zijdenbos et al., 1996]. The inner and outer surfaces were extracted using a Constrained Laplacian‐Based Automated Segmentation with Proximities algorithm [Kim et al., 2005; MacDonald et al., 2000] resulting in two surfaces with 81,920 polygons each. The results of automated segmentation and surface extraction were verified by visual inspection. There were no obvious errors for all subjects. To allow results to be displayed on a template surface, an improved nonlinear surface registration algorithm and an unbiased iterative group template were employed [Lyttelton et al., 2007].
Figure 1.

Diagram for data preprocessing and parcellation procedures.
Preprocessing of RS FMRI data was conducted using Analysis of Functional NeuroImages (AFNI; http://afni.nimh.nih.gov/afni) software [Cox, 1996]. The first five volumes from each functional image were removed. We used Physiologic EStimation by Temporal ICA (PESTICA; http://www.nitrc.org/projects/pestica/) to determine and correct for physiological cardiac and respiratory noise in the RS FMRI data [Beall and Lowe, 2007]. PESTICA includes IRF‐RETROICOR (RETROspective Image CORrection), an improved method of correction [Beall, 2010] that determines impulse response functions (IRF) for each heartbeat or breath from the data itself, and avoids aliasing of respiratory and cardiac signals into a lower frequency band. After removing physiological noise using PESTICA, images were despiked, and then corrected for slice time acquisition differences and head motion [Cox and Jesmanowicz, 1999]. The slice timing‐ and motion‐corrected functional images were acquired using an anatomy‐based correlation method known as ANATICOR [Jo et al., 2010]. Hardware artifacts were modeled with one regressor for eroded local white matter signals and one averaged signal from eroded lateral ventricle masks. The regressors of no interest were (1) six parameters obtained by correction of head motion, (2) signal from the eroded large ventricle mask, and (3) signal from a region of the local white matter erosion mask (r = 15mm). Subsequently, a band‐pass filter (0.009 < f < 0.08) was temporally applied to the residual time series [Dagli et al, 1999]. The time series were mapped onto cortical surfaces using a two‐surface method with an average of 10 sampling kernels evenly distributed along a line centered between white matter and gray matter surfaces. The mapped time series were smoothed with a heat kernel that resulted in 4.5 mm full‐width‐at‐half‐maximum (FWHM) resolution [Chung et al., 2005; Jo et al., 2007].
Functional Connectivity‐Based Parcellation of PCC
While Brodmann areas are commonly used as the basis for defining the boundaries of cytoarchitectural regions, our definition of PCC was guided by manually modernized ROIs based on an existing study [Toga, 2015]. Previously, vertices of the PCC were defined using Harvard–Oxford probabilistic anatomical atlas in the FSL software (http://fsl.fmrib.ox.ac.uk/fsl/fslwiki/Atlases) (Supporting Information Figure 1B). At the suggestion of an anatomist, retrosplenial areas 29 and 30 on the vertical bank of the cingulate gyrus and parahippocampal gyrus (PHG) were excluded from the analysis. Figure 2 represents the revised definition of PCC applied in this work.
Figure 2.

The ROI in the PCC. (A) Approximate locations of the subregions in the PCC based on cytoarchitectonics [Toga, 2015]. Areas 23d, d23, and v23 represent the PCC. (B) Mapping of the PCC onto the MNI152 gray matter surface. (C) Mapping results of the PCC onto the group template surface. LH, left hemisphere; RH, right hemisphere. [Color figure can be viewed at http://wileyonlinelibrary.com]
The basic approach to functional parcellation in the PCC is that the vertices with similar functional connectivity patterns are combined into the same cluster. To do this, we generated an individual cross‐correlation symmetry matrix reflecting the similarity of functional connectivity patterns. We defined the degree of similarity between functional connectivity patterns of the vertices using Pearson correlation coefficients. To understand the properties of subregions in the PCC, three types of functional connectivity patterns were used. (1) Only functional connectivity patterns within the PCC vertices were used to generate an individual matrix. These functional connectivity patterns reflect local functional connections of the PCC (N pcc × N pcc matrix, where N pcc is the number of PCC voxels). (2) The functional connectivity patterns between the PCC vertices and whole‐brain vertices outside of PCC were used to predict subregions of PCC. This means diffuse functional connections of the PCC (N pcc × N diffuse matrix, where N diffuse is the number of whole‐brain vertices excluding the number of PCC vertices). (3) The patterns of functional connectivity of the PCC with vertices across the entire brain were used. This matrix represents the whole‐brain connections of PCC (N pcc × N whole matrix, where N whole is the number of whole‐brain vertices). Each row of these matrices contained a pattern of functional connectivity corresponding to each PCC vertex. To measure the similarity between the patterns of functional connectivity for each PCC vertex, we computed cross‐correlation and generated a symmetric matrix (N pcc × N pcc). These matrices contained information regarding the similarity between the functional connectivity maps for every pair of vertices within the PCC. The (i,j) element of the N pcc × N pcc matrix represented the degree of similarity between the functional connection patterns of PCC vertex i and the functional connection patterns of PCC vertex j. To normalize the data statistically, we converted the correlation coefficient value r to z‐value using a Fisher's r‐to‐z transformation. To generate a group matrix, all individual symmetric matrices were averaged across subjects. The group matrix was then used for further clustering analysis.
To examine the effects of varying the clustering method on the results, we applied three commonly used clustering algorithms: hierarchical, spectral, and k‐means clustering. In addition, we examined the effect of varying the cluster number (C) from 2 to 5. Unexplained variance was then calculated as the within‐cluster sum of squares over the relevant columns of functional connections, and was plotted with respect to increasing C (Supporting Information Figure 2 and Supporting Information Table 1).
Cluster Consistency and Functional Connectivity Analysis for PCC Subregions
Based on the previous study [Vogt et al., 2006], four distinct clusters in the PCC were chosen and used as seed masks. To explore the consistency of the predicted clusters across subjects, we calculated adjacency matrices within and between clusters. The (i,j) element of the adjacency matrix represented by the labels of vertex i and vertex j was equal to 1 if i and j were in the same cluster, and equal to zero if i and j were not in the same cluster. Then, the adjacency matrix was averaged for each cluster across subjects.
In addition, to explore the functional connectivity of each cluster, time series data from each vertex within a given cluster were averaged. To define the degree of functional connectivity, a Pearson correlation coefficient was computed between the averaged time series of each region and the time series of whole‐brain vertices. The correlation coefficient, r, was converted to z using a Fisher's r‐to‐z transformation to enable statistical analysis. The z values determined levels of functional connectivity. A one‐sample t test was performed on the individual normalized correlation vertices. The threshold of significance was set at an uncorrected P < 0.001 (|t|>3.79) with an area of 400 mm2 for clear interpretation.
RESULTS
Subregions of the PCC Identified by Functional Connectivity Patterns
Subregions within the PCC were identified using the three described methods for measuring functional connectivity, and using k‐means, hierarchical, and spectral clustering algorithms (Fig. 3). While the functional subregions varied depending on the functional connections that were assessed, as well as the applied clustering algorithms, the predicted functional regions were visually similar to each other. But, whole and diffuse of the connectivity analyses and clustering algorithms predicted that the predicted PCC subregions were fragmented (see blur arrows in Fig. 3).
Figure 3.
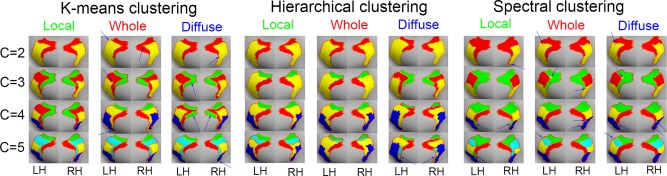
Predicted subregions in the PCC using three clustering algorithms (k‐means clustering, hierarchical clustering, and spectral clustering), various functional information (local functional connections, whole‐brain functional connections, and diffuse functional connections) and different numbers of clusters (C = 2 to 5). LH, left hemisphere; RH, right hemisphere. Parcel colors have been matched for easy viewing. [Color figure can be viewed at http://wileyonlinelibrary.com]
Functional connectivity analysis for C = 4 yielded four subregions of PCC. In line with previous work by Vogt et al. [Vogt, 2009], two of the four regions were within vPCC, while the other two were within dPCC. Due to the high correspondence of the results described above with previous work, we conducted a functional connectivity analysis using the PCC results obtained from the C = 4, using local functional connections and hierarchical clustering (ROI key in Fig. 4).
Figure 4.

Brain regions showing significant functional connectivity of four subregions in the PCC using hierarchical clustering and local functional information. (A) The four subregions in the PCC predicted using hierarchical clustering and local functional information. Then, the ROI Key regions were used for further functional connectivity analysis. (B) Consistency of the four clusters was calculated within and between clusters. (C) The functional connectivity of the four subregions in the PCC. The significant threshold was set at an uncorrected P < 0.001 (|t| > 3.79) with an area of 400 mm2 for clear interpretation. LH, left hemisphere; RH, right hemisphere; MFG, middle frontal gyrus; SPG, superior parietal gyrus, ITG: inferial temporal gyrus, Pcu: precuneus, PHG: parahippocampal gyrus, pMCC: posterior middle cingulate cortex, aMCC: anterior middle cingulate cortex, pACC: posterior anterior cingulater cortex, sACC: subgenual anterior cingulate cortex, IPL: inferior parietal lobule, MTG: middle temporal gyrus, SFG: superior frontal gyrus. [Color figure can be viewed at http://wileyonlinelibrary.com]
Between‐Subject Consistency and Functional Connectivity Analysis for Each Cluster
The between‐subject consistency of the four clusters is presented in Figure 4B. The averaged within‐cluster consistency of all four clusters were significant at a Bonferroni‐corrected threshold level of P < 0.0001. To characterize the patterns of functional connectivity for each cluster, a one‐sample t test was used to generate group maps of the functional connectivity profiles (Fig. 4 and Table 1). The majority of functional connectivity patterns were similar across subclusters within the PCC, and they included core elements of the DMN. There was a dorsal to ventral shift in the DMN connectivity patterns with dorsal frontal and angular gyrus regions as the seed transitions shifted from dorsal (cluster 1) to ventral (cluster 4) locations. Notably, the connectivity patterns for clusters 1 and 2, as well as those for clusters 3 and 4, were similar on visual inspection. Clusters 1 and 2 displayed unique functional connections to the supramarginal gyrus, ACC, inferior frontal gyrus, and dorsomedial prefrontal cortex. In contrast, clusters 3 and 4 had unique regions of functional connectivity within the angular gyrus, ventromedial prefrontal cortex, middle occipital gyrus, postcentral gyrus, PHG, middle temporal gyrus, and cuneus. The functional connectivity using cluster 4 were only showed negative correlations.
Table 1.
Brain regions showing significant functional connectivity of four subregions in the PCC using hierarchical clustering and local functional information
| Brain regions | Hemisphere | x | y | z | Maximum t | Number of nodes |
|---|---|---|---|---|---|---|
| Cluster 1 | ||||||
| PCC/Precuneus | Left | −10.1 | −42.6 | 35.6 | 22.158 | 1937 |
| Supramarginal gyrus | Left | −42.6 | −46.6 | 45.6 | 8.508 | 543 |
| Middle frontal gyrus | Left | −31.3 | 34.6 | 31.8 | 8.292 | 687 |
| sSuperior parietal gyrus | Left | −31.0 | −78.3 | 26.5 | 7.368 | 569 |
| Inferior temporal gyrus | Left | −49.8 | −55.3 | −6.44 | 7.729 | 257 |
| Fusiform gyrus | Left | −31.0 | −37.8 | −11.6 | 6.788 | 172 |
| PCC/Precuneus | Right | 11.8 | −50.3 | 42.2 | 10.926 | 1128 |
| Supramarginal gyrus | Right | 43.4 | −47.9 | 43.0 | 8.032 | 518 |
| Inferior parietal lobule | Right | 32.2 | −75.0 | 27.0 | 6.345 | 356 |
| Middle frontal gyrus | Right | 41.6 | 36.6 | 17.3 | 6.219 | 273 |
| Inferior temporal gyrus | Right | 55.5 | −54.4 | −5.71 | 6.636 | 184 |
| Middle frontal gyrus | Right | 29.6 | 35.8 | 33.6 | 7.842 | 247 |
| Cluster 2 | ||||||
| PCC/Precuneus/ | Left | −10.0 | −52.4 | 25.8 | 25.357 | 3546 |
| Inferior parietal lobule | Left | −38.1 | −68.9 | 39.8 | 11.457 | 1350 |
| Middle frontal gyrus | Left | −32.5 | 20.1 | 43.0 | 8.425 | 772 |
| Medial frontal gyrus | Left | −9.67 | 40.2 | 13.3 | 11.806 | 848 |
| Middle temporal gyrus | Left | −60.6 | −31.9 | −13.4 | 7.948 | 334 |
| Superior frontal gyrus | Left | −19.9 | 60.2 | 4.64 | 9.463 | 306 |
| Middle frontal gyrus | Left | −37.2 | 51.6 | 2.08 | 7.687 | 275 |
| Superior frontal gyrus | Left | −18.0 | 39.3 | 40.5 | 7.464 | 304 |
| PCC/Precuneus | Right | 11.2 | −51.6 | 29.1 | 12.924 | 3128 |
| Inferior parietal lobule | Right | 41.1 | −64.1 | 39.1 | 8.620 | 1099 |
| Medial frontal gyrus | Right | 11.2 | 38.3 | 12.4 | 7.962 | 809 |
| Middel temporal gyrus | Right | 60.5 | −30.4 | −14.7 | 7.624 | 271 |
| Superior frontal gyrus | Right | 24.1 | 22.3 | 44.1 | 7.117 | 314 |
| Ligual gyrus | Right | 9.50 | −87.1 | −1.41 | 7.034 | 218 |
| Preicalcarine sulcus | Right | 13.7 | −70.7 | 9.67 | 6.504 | 225 |
| Cluster 3 | ||||||
| PCC/Precuneus | Left | −11.2 | −56.5 | 24.9 | 22.765 | 4032 |
| Inferior parietal lobule | Left | −41.7 | −66.8 | 36.7 | 9.846 | 1627 |
| Middle frontal gyrus | Left | −26.8 | 24.4 | 46.3 | 8.226 | 1203 |
| Middle temporal gyrus | Left | −58.0 | −20.4 | −12.9 | 7.854 | 561 |
| Medial frontal gyrus | Left | −8.89 | 44.4 | 14.9 | 9.122 | 769 |
| Superior frontal gyrus | Left | −18.0 | 61.1 | 9.61 | 8.394 | 336 |
| PCC/Precuneus | Right | 12.7 | −58.0 | 24.7 | 12.441 | 3811 |
| Inferior parietal lobule | Right | 45.4 | −62.1 | 33.9 | 9.428 | 1520 |
| Middle frontal gyrus | Right | 29.0 | 27.4 | 42.8 | 9.127 | 1009 |
| Medial frontal gyrus | Right | 11.3 | 47.1 | 17.5 | 6.381 | 1343 |
| Middle temporal gyrus | Right | 59.1 | −20.0 | −11.1 | 8.445 | 705 |
| Cluster 4 | ||||||
| PCC/PHG | Left | −12.3 | −55.2 | 18.9 | 24.616 | 2840 |
| Orbitofrontal gyrus | Left | −8.37 | 43.0 | 3.04 | 8.652 | 1479 |
| Inferior parietal lobule | Left | −40.4 | −73.5 | 32.9 | 10.174 | 744 |
| Superior frontal gyrus | Left | −16.4 | 37.3 | 43.7 | 8.969 | 607 |
| PHG | Left | −25.7 | −35.1 | −12.0 | 10.920 | 364 |
| Superior temporal gyrus | Left | −56.0 | −6.29 | −19.4 | 7.289 | 225 |
| Supramarginal gyrus | Left | −57.0 | −42.0 | 42.8 | −3.804 | 246 |
| PCC | Right | 13.2 | −53.7 | 21.5 | 14.433 | 2112 |
| Medial orbitofrontal gyrus | Right | 8.23 | 35.1 | −4.83 | 8.932 | 988 |
| Inferior parietal lobule | Right | 44.1 | −69.4 | 29.6 | 11.494 | 677 |
| Supramarginal gyrus | Right | 59.6 | −37.1 | 39.3 | −3.796 | 419 |
| PHG | Right | 28.2 | −29.1 | −15.1 | 9.247 | 505 |
| Superior frontal gyrus | Right | 20.3 | 33.9 | 43.2 | 9.497 | 480 |
| Opercularis | Right | 49.8 | 17.3 | 12.9 | −3.792 | 342 |
| Middle temporal gyrus | Right | 59.2 | −5.43 | −22.6 | 8.115 | 211 |
| Insula | Right | 36.3 | 30.2 | −2.07 | −3.802 | 138 |
Abbreviations: PCC: posterior cingulate cortex; PHG: parahippocampal gyrus. Threshold: uncorrected P < 0.001 with a minimum area of 400 mm2 for clear interpretation.
DISCUSSION
In this study, we examined patterns of functional connectivity for each vertex within the PCC using RS FMRI, and then generated PCC subregions based on these functional connectivity profiles. In addition, we assessed the effect of different clustering algorithms on subregion parcellation. Our main findings were that (i) the subregions of the PCC can vary depending on the method that is used to define connectivity patterns (i.e., local or diffuse connectivity patterns), and also depends on the clustering method utilized; (ii) the PCC could be separated into two (dPCC and vPCC) or four subregions based on local functional connections and hierarchical clustering; and (iii) subregions of PCC display differential global functional connectivity, particularly along the dorsal‐ventral axis. Taken together, our findings suggest that the PCC may have a functionally hierarchical architecture and can be divided into two regions, namely the dPCC and vPCC and four regions using local connectivity.
The Effects of Various Functional Connectivity and Clustering Algorithms on PCC Subregions
Depending on the functional connectivity method and clustering algorithm that was used, the predicted functional subregions of PCC exhibited some variation. In most cases, the predicted subregions (C = 2) were not continuous, except when local functional connectivity and hierarchical clustering were used (Fig. 3). These results suggest that the functional subdivision between dPCC and vPCC may be driven by differences in local connectivity, rather than whole‐brain functional differences. This may have contributed to the observed difference between results obtained when analyzing diffuse and whole‐brain functional connections as opposed to local functional connections. The PCC has complex functional connectivity and the subregions of the PCC exhibit greater differences in their local connections than the diffuse and whole‐brain connections. As most of the information between diffuse and whole brain functional connections were similar, the results from these two analyses were comparable. We suspect that most of the information captured by analyses using whole‐brain and diffuse functional connections may not reflect the true functional characteristics in the PCC. This is because the proper functional connections used to parcellate regions might differ across brain regions, and may depend on the functional organization and properties of the regions. Therefore, parcellation with various functional properties and clustering algorithms can help our understanding the regions in human brain. Clustering algorithms can be divided into several categories including connectivity‐based, centroid‐based, and partitioning clustering algorithms. When various parcellation algorithms were examined with simulated and task fMRI datasets, hierarchical clustering was more reproducible and accurate than the alternative methods [Thirion et al., 2014]. We note that the subregions of the PCC did vary slightly, depending on the algorithm used to predict them (see Fig. 3). In particular, when the number of clusters in each subregion was set from 3 to 5, the patterns using spectral clustering were different to those found with hierarchical and k‐means clustering. Finally, we emphasize that even when the same clustering algorithm was applied to parcellate regions, the results varied depending on the functional information that was considered. Therefore, our results suggest that the contribution of different types of functional information, as well as different clustering algorithms, should be considered when analyzing the functional subregions in the human brain.
Subregions within the PCC Identified by Functional Connectivity‐Based Segregation
Using hierarchical clustering and local functional connections, the PCC could be clearly separated two and four continuous subregions. These results were consistent with previous studies, which have examined the posteromedial cortex [Bzdok et al., 2015, Yang et al., 2014] and whole‐brain parcellation using resting‐state correlations [Gordon et al., 2016]. These studies have shown that the PMC consists of four regions: the precuneal cluster, vPCC, dPCC, and retrosplenial cortex (RSC). While the PCC is the primary component of the PMC, we must note, however, that the PMC can also include area 7m and somatosensory areas. The ROI Key in Figure 4 shows the four clusters within the PCC obtained through surface‐based hierarchical clustering based on the local functional connections in the PCC.
Cluster‐Wise Patterns of Global Functional Connectivity
The majority of functional connectivity patterns were similar across PCC subregions (see Fig. 4). These patterns were mainly associated with the DMN, a network that has been shown by positron emission tomography studies to display elevated metabolism in the brain at rest [Gusnard et al., 2001; Raichle et al., 2001]. The PCC represents a central node within the DMN [Barbas et al., 1999; Buckner et al., 2008; Fransson and Marrelec, 2008; Greicius et al., 2003; Morecraft et al., 2004]. Interestingly, we found that the functional connectivity of PCC subregions with DMN structures was subregion‐dependent. In particular, the dorsal frontal and angular patterns shifted to more ventral locations for more ventrally located PCC subregions (Fig. 4). The DMN is comprised of two distinct networks, dorsal medial prefrontal cortex subsystem and medial temporal lobe subsystem [Andrews‐Hanna et al., 2010]. The DMN is thought to play a role in the generation of mental scenes [Hassabis and Maguire, 2007] and in self‐referential and social processes [D'Argembeau et al., 2005; Schilbach et al., 2008; Wicker et al., 2003]. In addition to the DMN, the PCC is also involved in the dorsal attention network and the frontoparietal control network [Leech and Sharp, 2014]. The presence of structural connections from the RSC and vPCC to the medial temporal lobes, as well as connections between dPCC and the dorsal medial prefrontal cortex by way of the cingulum bundle have been confirmed [Greicius et al., 2009]. In line with these structural results, we observed that vPCC was more functionally correlated with the temporal lobes and middle occipital gyrus, while the dPCC was more functionally correlated with the mid‐cingulate cortex and prefrontal cortex. These results also align with behavioral data which suggest that the two subregions play distinct functional roles. While dPCC is involved in spatial processing [Vogt et al., 2006], the vPCC is involved in self‐relevant assessment (self‐referential processing) [Northoff and Bermpohl, 2004; Vogeley et al., 2001].
The dPCC clusters (clusters 1 and 2 in Fig. 4) showed stronger functional connectivity with the cognitive control network. In addition, these regions showed a highly complex pattern of connectivity, with prominent connections to the frontal lobes. The dPCC has previously been shown to have a greater prefrontal functional [Bzdok et al., 2015; Cauda et al., 2010; Margulies et al., 2009; Vogt et al., 2006] and structural connectivity [Cavada and Goldman‐Rakic, 1989b] with the dorsal medial prefrontal cortex. However, the difference in functional connectivity patterns of dPCC, reflected in our results, appears to extend beyond established DMN regions [Buckner et al., 2008]. Instead, the functional connectivity of cluster 1 seems to represent a combination of salience and dorsal attention networks [Yeo et al., 2011], while the connectivity of cluster 2 exhibits similarity with the parietal memory network [Gilmore et al., 2015; Rosen et al., 2016]. Specifically, cluster 1 was more functionally correlated with the cingulate motor area, supramarginal gyrus, and inferior frontal gyrus, while cluster 2 was more correlated with the angular gyrus, posterior ACC. But, the cluster 2 may represent areas that are connected with the RSC. The RSC is associated with planning for the future, episodic memory, navigation and imagination [Vann et al., 2009]. In support of this hypothesis, it is known that area 23a of the PCC is heavily interconnected with area 30 of RSC [Vogt and Pandya, 1987]. However, the RSC (2–4 mm) is difficult to delineate due to the insufficient spatial resolution of FMRI data (3.125 × 3.125 × 3.6 mm3) with 4.5 mm FWHM smoothing kernel. Thus, we should be cautious when interpreting the results of functional connections between cluster 2 and whole brain. Further studies are needed to define the RSC with high‐resolution FMRI and analyze the functional connections of the RSC.
In contrast, the vPCC clusters (clusters 3 and 4 in Fig. 4) showed increased functional connectivity with the PHG, ventromedial prefrontal cortex, and angular gyrus relative to the dPCC clusters. These regions are more traditionally associated with the DMN [Leech et al., 2011]. The vPCC is known to mediate an intermediate stage of information processing between visual recognition in the visual cortex and emotion‐related substrates [Vogt et al., 2006], and is involved in internally directed cognition such as memory retrieval and planning [Leech and Sharp, 2014]. These regions were not only active during simple emotions driven by faces or scripts but also activated by nonemotional scripts or faces [Vogt et al., 2003]. Interestingly, our results showed that the two ventral subregions displayed significant differences in functional connectivity with regions that are not strongly related to the DMN. For example, cluster 4 had more positive correlations with middle occipital regions than cluster 3. Both clusters were connected with the PHG, a precentral gyrus that is involved in spatial and motor systems, and the higher‐level visual cortex, which is involved in motion and object processing. Cluster 4 only had negative correlations with supramarginal gyrus and insular which is not involved in DMN.
While this limitation must be considered, our results demonstrate that the dPCC and vPCC are functionally distinct. Other limitations include the exclusion of female subjects. Previous studies using resting‐state fMRI showed that there were differences between genders in intrinsic brain activity [Filippi et al., 2013], small‐world brain networks [Tian et al., 2011], and regional homogeneity [Dai et al., 2012]. Therefore, the results from functional parcellation may be affected by the gender differences. We added the results from processing using both male and female subjects (see Supporting Information Figure 4), and we note that there were little differences in our results when female subjects were included. The further studies are needed to understand the role of sex differences in the functional anatomy of the PCC.
Supporting information
Supporting Information
ACKNOWLEDGMENTS
This study was greatly facilitated by the generous contribution of data by Functional Connectomes Project (http://www.nitrc.org/projects/fcon_1000/). The authors also thank Stephen J. Gotts for helpful discussion.
REFERENCE
- Andrews‐Hanna JR, Reidler JS, Sepulcre J, Poulin R, Buckner RL (2010): Functional‐anatomic fractionation of the brain's default network. Neuron 65:550–562. [DOI] [PMC free article] [PubMed] [Google Scholar]
- Barbas H, Ghashghaei H, Dombrowski SM, Rempel‐Clower NL (1999): Medial prefrontal cortices are unified by common connections with superior temporal cortices and distinguished by input from memory‐related areas in the rhesus monkey. J Comp Neurol 410:343–367. [DOI] [PubMed] [Google Scholar]
- Beall EB (2010): Adaptive cyclic physiologic noise modeling and correction in functional MRI. J Neurosci Methods 187:216–228. [DOI] [PubMed] [Google Scholar]
- Beall EB, Lowe MJ (2007): Isolating physiologic noise sources with independently determined spatial measures. NeuroImage 37:1286–1300. [DOI] [PubMed] [Google Scholar]
- Biswal BB, Mennes M, Zuo XN, Gohel S, Kelly C, Smith SM, Beckmann CF, Adelstein JS, Buckner RL, Colcombe S, Dogonowski AM, Ernst M, Fair D, Hampson M, Hoptman MJ, Hyde JS, Kiviniemi VJ, Kotter R, Li SJ, Lin CP, Lowe MJ, Mackay C, Madden DJ, Madsen KH, Margulies DS, Mayberg HS, McMahon K, Monk CS, Mostofsky SH, Nagel BJ, Pekar JJ, Peltier SJ, Petersen SE, Riedl V, Rombouts SA, Rypma B, Schlaggar BL, Schmidt S, Seidler RD, Siegle GJ, Sorg C, Teng GJ, Veijola J, Villringer A, Walter M, Wang L, Weng XC, Whitfield‐Gabrieli S, Williamson P, Windischberger C, Zang YF, Zhang HY, Castellanos FX, Milham MP (2010): Toward discovery science of human brain function. Proc Natl Acad Sci USA 107:4734–4739. [DOI] [PMC free article] [PubMed] [Google Scholar]
- Blumensath T, Jbabdi S, Glasser MF, Van Essen DC, Ugurbil K, Behrens TE, Smith SM (2013): Spatially constrained hierarchical parcellation of the brain with resting‐state fMRI. NeuroImage 76:313–324. [DOI] [PMC free article] [PubMed] [Google Scholar]
- Brodmann K (1994): Localisation in the Cerebral Cortex. London: Smith‐; Gordon (original work published 1909). [Google Scholar]
- Buckner RL, Andrews‐Hanna JR, Schacter DL (2008): The brain's default network: Anatomy, function, and relevance to disease. Ann N Y Acad Sci 1124:1–38. [DOI] [PubMed] [Google Scholar]
- Bzdok D, Heeger A, Langner R, Laird AR, Fox PT, Palomero‐Gallagher N, Vogt BA, Zilles K, Eickhoff SB (2015): Subspecialization in the human posterior medial cortex. NeuroImage 106:55–71. [DOI] [PMC free article] [PubMed] [Google Scholar]
- Cauda F, Geminiani G, D'Agata F, Sacco K, Duca S, Bagshaw AP, Cavanna AE (2010): Functional connectivity of the posteromedial cortex. PLoS One 5:e13107. [DOI] [PMC free article] [PubMed] [Google Scholar]
- Cavada C, Goldman‐Rakic PS (1989a): Posterior parietal cortex in rhesus monkey: I. Parcellation of areas based on distinctive limbic and sensory corticocortical connections. J Comp Neurol 287:393–421. [DOI] [PubMed] [Google Scholar]
- Cavada C, Goldman‐Rakic PS (1989b): Posterior parietal cortex in rhesus monkey: II. Evidence for segregated corticocortical networks linking sensory and limbic areas with the frontal lobe. J Comp Neurol 287:422–445. [DOI] [PubMed] [Google Scholar]
- Chung MK, Robbins SM, Dalton KM, Davidson RJ, Alexander AL, Evans AC (2005): Cortical thickness analysis in autism with heat kernel smoothing. Neuroimage 25:1256–1265. [DOI] [PubMed] [Google Scholar]
- Collins DL, Neelin P, Peters TM, Evans AC (1994): Automatic 3D intersubject registration of MR volumetric data in standardized Talairach space. J Comput Assist Tomogr 18:192–205. [PubMed] [Google Scholar]
- Cox RW (1996): AFNI: Software for analysis and visualization of functional magnetic resonance neuroimages. Comput Biomed Res 29:162–173. [DOI] [PubMed] [Google Scholar]
- Cox RW, Jesmanowicz A (1999): Real‐time 3D image registration for functional MRI. Magn Reson Med 42:1014–1018. [DOI] [PubMed] [Google Scholar]
- Craddock RC, James GA, Holtzheimer PE, III, Hu XP, Mayberg HS (2012): A whole brain fMRI atlas generated via spatially constrained spectral clustering. Hum Brain Mapp 33:1914–1928. [DOI] [PMC free article] [PubMed] [Google Scholar]
- Dagli MS, Ingeholm JE, Haxby JV (1999): Localization of cardiac‐induced signal change in fMRI. Neuroimage 9:407–415. [DOI] [PubMed] [Google Scholar]
- Dai XJ, Gong HH, Wang YX, Zhou FQ, Min YJ, Zhao F, Wang SY, Liu BX, Xiao XZ (2012): Gender differences in brain regional homogeneity of healthy subjects after normal sleep and after sleep deprivation: A resting‐state fMRI study. Sleep Med 13:720–727. [DOI] [PubMed] [Google Scholar]
- D'Argembeau A, Collette F, Van der Linden M, Laureys S, Del Fiore G, Degueldre C, Luxen A, Salmon E (2005): Self‐referential reflective activity and its relationship with rest: A PET study. NeuroImage 25:616–624. [DOI] [PubMed] [Google Scholar]
- Filippi M, Valsasina P, Misci P, Falini A, Comi G, Rocca MA (2013): The organization of intrinsic brain activity differs between genders: A resting‐state fMRI study in a large cohort of young healthy subjects. Hum Brain Mapp 34:1330–1343. [DOI] [PMC free article] [PubMed] [Google Scholar]
- Fischl B, van der Kouwe A, Destrieux C, Halgren E, Segonne F, Salat DH, Busa E, Seidman LJ, Goldstein J, Kennedy D, Caviness V, Makris N, Rosen B, Dale AM (2004): Automatically parcellating the human cerebral cortex. Cereb Cortex 14:11–22. [DOI] [PubMed] [Google Scholar]
- Fransson P, Marrelec G (2008): The precuneus/posterior cingulate cortex plays a pivotal role in the default mode network: Evidence from a partial correlation network analysis. NeuroImage 42:1178–1184. [DOI] [PubMed] [Google Scholar]
- Frost MA, Goebel R (2012): Measuring structural–functional correspondence: Spatial variability of specialised brain regions after macro‐anatomical alignment. NeuroImage 59:1369–1381. [DOI] [PubMed] [Google Scholar]
- Gilmore AW, Nelson SM, McDermott KB (2015): A parietal memory network revealed by multiple MRI methods. Trends Cogn Sci 19:534–543. [DOI] [PubMed] [Google Scholar]
- Gordon EM, Laumann TO, Adeyemo B, Huckins JF, Kelly WM, Petersen SE (2016): Generation and evaluation of a cortical area parcellation from resting‐state correlations. Cereb Cortex 26:288–303. [DOI] [PMC free article] [PubMed] [Google Scholar]
- Greicius MD, Krasnow B, Reiss AL, Menon V (2003): Functional connectivity in the resting brain: A network analysis of the default mode hypothesis. Proc Natl Acad Sci USA 100:253–258. [DOI] [PMC free article] [PubMed] [Google Scholar]
- Greicius MD, Supekar K, Menon V, Dougherty RF (2009): Resting‐state functional connectivity reflects structural connectivity in the default mode network. Cereb Cortex 19:72–78. [DOI] [PMC free article] [PubMed] [Google Scholar]
- Gusnard DA, Raichle ME, Raichle ME (2001): Searching for a baseline: Functional imaging and the resting human brain. Nat Rev Neurosci 2:685–694. [DOI] [PubMed] [Google Scholar]
- Hassabis D, Maguire EA (2007): Deconstructing episodic memory with construction. Trends Cogn Sci 11:299–306. [DOI] [PubMed] [Google Scholar]
- Jo HJ, Lee J‐M, Kim J‐H, Shin Y‐W, Kim I‐Y, Kwon JS, Kim SI (2007): Spatial accuracy of fMRI activation influenced by volume‐ and surface‐based spatial smoothing techniques. Neuroimage 34:550–564. [DOI] [PubMed] [Google Scholar]
- Jo HJ, Saad ZS, Simmons WK, Milbury LA, Cox RW (2010): Mapping sources of correlation in resting state FMRI, with artifact detection and removal. NeuroImage 52:571–582. [DOI] [PMC free article] [PubMed] [Google Scholar]
- Jo HJ, Gotts SJ, Reynolds RC, Bandettini PA, Martin A, Cox RW, Saad ZS (2013): Effective preprocessing procedures virtually eliminate distance‐dependent motion artifacts in resting state FMRI. J Appl Math 2013:935154. [DOI] [PMC free article] [PubMed] [Google Scholar]
- Kahnt T, Chang LJ, Park SQ, Heinzle J, Haynes J‐D (2012): Connectivity‐based parcellation of the human orbitofrontal cortex. J Neurosci 32:6240–6250. [DOI] [PMC free article] [PubMed] [Google Scholar]
- Kim JS, Singh V, Lee JK, Lerch J, Ad‐Dab'bagh Y, MacDonald D, Lee JM, Kim SI, Evans AC (2005): Automated 3‐D extraction and evaluation of the inner and outer cortical surfaces using a Laplacian map and partial volume effect classification. NeuroImage 27:210–221. [DOI] [PubMed] [Google Scholar]
- Kim JH, Lee JM, Jo HJ, Kim SH, Lee JH, Kim ST, Seo SW, Cox RW, Na DL, Kim SI, Saad ZS (2010): Defining functional SMA and pre‐SMA subregions in human MFC using resting state fMRI: Functional connectivity‐based parcellation method. NeuroImage 49:2375–2386. [DOI] [PMC free article] [PubMed] [Google Scholar]
- Leech R, Sharp DJ (2014): The role of the posterior cingulate cortex in cognition and disease. Brain 137:12–32. [DOI] [PMC free article] [PubMed] [Google Scholar]
- Leech R, Kamourieh S, Beckmann CF, Sharp DJ (2011): Fractionating the default mode network: Distinct contributions of the ventral and dorsal posterior cingulate cortex to cognitive control. J Neurosci 31:3217–3224. [DOI] [PMC free article] [PubMed] [Google Scholar]
- Lyttelton O, Boucher M, Robbins S, Evans A (2007): An unbiased iterative group registration template for cortical surface analysis. NeuroImage 34:1535–1544. [DOI] [PubMed] [Google Scholar]
- MacDonald D, Kabani N, Avis D, Evans AC (2000): Automated 3‐D extraction of inner and outer surfaces of cerebral cortex from MRI. NeuroImage 12:340–356. [DOI] [PubMed] [Google Scholar]
- Margulies DS, Vincent JL, Kelly C, Lohmann G, Uddin LQ, Biswal BB, Villringer A, Castellanos FX, Milham MP, Petrides M (2009): Precuneus shares intrinsic functional architecture in humans and monkeys. Proc Natl Acad Sci USA 106:20069–20074. [DOI] [PMC free article] [PubMed] [Google Scholar]
- Morecraft RJ, Cipolloni PB, Stilwell‐Morecraft KS, Gedney MT, Pandya DN (2004): Cytoarchitecture and cortical connections of the posterior cingulate and adjacent somatosensory fields in the rhesus monkey. J Comp Neurol 469:37–69. [DOI] [PubMed] [Google Scholar]
- Northoff G, Bermpohl F (2004): Cortical midline structures and the self. Trends Cogn Sci 8:102–107. [DOI] [PubMed] [Google Scholar]
- Palomero‐Gallagher N, Vogt BA, Schleicher A, Mayberg HS, Zilles K (2009): Receptor architecture of human cingulate cortex: Evaluation of the four‐region neurobiological model. Hum Brain Mapp 30:2336–2355. [DOI] [PMC free article] [PubMed] [Google Scholar]
- Raichle ME, MacLeod AM, Snyder AZ, Powers WJ, Gusnard DA, Shulman GL (2001): A default mode of brain function. Proc Natl Acad Sci USA 98:676–682. [DOI] [PMC free article] [PubMed] [Google Scholar]
- Rosen ML, Stern CE, Michalka SW, Devaney KJ, Somers DC (2016): Cognitive control network contributions to memory‐guided visual attention. Cereb Cortex 26:2059–2073. [DOI] [PMC free article] [PubMed] [Google Scholar]
- Saad ZS, Glen DR, Chen G, Beauchamp MS, Desai R, Cox RW (2009): A new method for improving functional‐to‐structural MRI alignment using local Pearson correlation. NeuroImage 44:839–848. [DOI] [PMC free article] [PubMed] [Google Scholar]
- Saad ZS, Reynolds RC, Jo HJ, Gotts SJ, Chen G, Martin A, Cox RW (2013): Correcting brain‐wide correlation differences in resting‐state FMRI. Brain Connect 3:339–352. [DOI] [PMC free article] [PubMed] [Google Scholar]
- Schilbach L, Eickhoff SB, Rotarska‐Jagiela A, Fink GR, Vogeley K (2008): Minds at rest? Social cognition as the default mode of cognizing and its putative relationship to the “default system” of the brain. Conscious Cogn 17:457–467. [DOI] [PubMed] [Google Scholar]
- Shibata H, Masao Y (2003): Differential thalamic connections of the posteroventral and dorsal posterior cingulate gyrus in the monkey. Eur J Neurosci 18:1615–1626. [DOI] [PubMed] [Google Scholar]
- Sled JG, Zijdenbos AP, Evans AC (1998): A nonparametric method for automatic correction of intensity nonuniformity in MRI data. IEEE Trans Med Imaging 17:87–97. [DOI] [PubMed] [Google Scholar]
- Thirion B, Varoquaux G, Dohmatob E, Poline JB (2014): Which fMRI clustering gives good brain parcellations? Front Neurosci 8:167. [DOI] [PMC free article] [PubMed] [Google Scholar]
- Tian L, Wang J, Yan C, He Y (2011): Hemisphere‐ and gender‐related differences in small‐world brain networks: A resting‐state functional MRI study. Neuroimage 54:191–202. [DOI] [PubMed] [Google Scholar]
- Toga AW (2015): Brain Mapping: An Encyclopedic Reference. Amsterdam: Academic Press. [Google Scholar]
- Toga AW, Thompson PM, Mori S, Amunts K, Zilles K (2006): Towards multimodal atlases of the human brain. Nat Rev Neurosci 7:952–966. [DOI] [PMC free article] [PubMed] [Google Scholar]
- Vann SD, Aggleton JP, Maguire EA (2009): What does the retrosplenial cortex do? Nat Rev Neurosci 10:792–802. [DOI] [PubMed] [Google Scholar]
- Vogeley K, Bussfeld P, Newen A, Herrmann S, Happe F, Falkai P, Maier W, Shah NJ, Fink GR, Zilles K (2001): Mind reading: Neural mechanisms of theory of mind and self‐perspective. NeuroImage 14:170–181. [DOI] [PubMed] [Google Scholar]
- Vogt BA (2009): Cingulate Neurobiology and Disease. Oxford: Oxford University Press; xxxiv, 829 p. [Google Scholar]
- Vogt BA, Pandya DN (1987): Cingulate cortex of the rhesus monkey: II. Cortical afferents. J Comp Neurol 262:271–289. [DOI] [PubMed] [Google Scholar]
- Vogt BA, Gabriel M (1993): Neurobiology of Cingulate Cortex and Limbic Thalamus: A Comprehensive Handbook. Boston: Birkauser. [Google Scholar]
- Vogt BA, Berger GR, Derbyshire SW (2003): Structural and functional dichotomy of human midcingulate cortex. Eur J Neurosci 18:3134–3144. [DOI] [PMC free article] [PubMed] [Google Scholar]
- Vogt BA, Vogt L, Farber NB, Bush G (2005): Architecture and neurocytology of monkey cingulate gyrus. J Comp Neurol 485:218–239. [DOI] [PMC free article] [PubMed] [Google Scholar]
- Vogt BA, Vogt L, Laureys S (2006): Cytology and functionally correlated circuits of human posterior cingulate areas. NeuroImage 29:452–466. [DOI] [PMC free article] [PubMed] [Google Scholar]
- Wicker B, Ruby P, Royet JP, Fonlupt P (2003): A relation between rest and the self in the brain? Brain Res 43:224–230. [DOI] [PubMed] [Google Scholar]
- Yang Z, Craddock RC, Margulies DS, Yan CG, Milham MP (2014): Common intrinsic connectivity states among posteromedial cortex subdivisions: Insights from analysis of temporal dynamics. Neuroimage 93(Pt 1):124–137. [DOI] [PMC free article] [PubMed] [Google Scholar]
- Yeo BT, Krienen FM, Sepulcre J, Sabuncu MR, Lashkari D, Hollinshead M, Roffman JL, Smoller JW, Zollei L, Polimeni JR, Fischl B, Liu H, Buckner RL (2011): The organization of the human cerebral cortex estimated by intrinsic functional connectivity. J Neurophysiol 106:1125–1165. [DOI] [PMC free article] [PubMed] [Google Scholar]
- Yu C, Zhou Y, Liu Y, Jiang T, Dong H, Zhang Y, Walter M (2011): Functional segregation of the human cingulate cortex is confirmed by functional connectivity based neuroanatomical parcellation. NeuroImage 54:2571–2581. [DOI] [PubMed] [Google Scholar]
- Zhang Y, Fan L, Zhang Y, Wang J, Zhu M, Zhang Y, Yu C, Jiang T (2014): Connectivity‐based parcellation of the human posteromedial cortex. Cereb Cortex 24:719–727. [DOI] [PubMed] [Google Scholar]
- Zijdenbos A, Evans A, Riahi F, Sled J, Chui J, Kollokian V (1996): Automatic quantification of multiple sclerosis lesion volume using stereotaxic space. Lect Notes Comput Sc 1131:439–448. [Google Scholar]
- Zilles K, Amunts K (2010): Centenary of Brodmann's map–conception and fate. Nat Rev Neurosci 11:139–145. [DOI] [PubMed] [Google Scholar]
Associated Data
This section collects any data citations, data availability statements, or supplementary materials included in this article.
Supplementary Materials
Supporting Information