

Abstract
Sensation seeking has been associated with substance use and other risk‐taking behaviors. The present functional magnetic resonance imaging (fMRI) study investigated the neural correlates underlying risk taking in sensation seeking. Twenty‐eight high sensation seekers (HSS; 14 female and 14 male young adults) and 28 low sensation seekers (LSS; 14 female and 14 male young adults) performed an interactive, sequential gambling task that allowed for voluntary pursuit or inhibition of risk taking. Behaviorally, HSS versus LSS exhibited a stronger tendency toward risk taking. Comparison of the groups revealed that when taking risks, HSS relative to LSS exhibited reduced fMRI responses in brain areas involved in risk processing, such as the dorsomedial prefrontal cortex and the thalamus. Importantly, during the voluntary inhibition of risk taking, HSS relative to LSS showed greater fMRI responses in brain areas implicated in cognitive control (the bilateral anterior cingulate cortex) and negative emotion (the right anterior insula). These findings suggest that risk taking in sensation seeking may be driven by both a hypoactive neural system in the voluntary pursuit of risk taking and a hyperactive neural system in the voluntary inhibition of risk taking, thus providing implications for future prevention programs targeting sensation‐seeking behaviors. Hum Brain Mapp 38:6019–6028, 2017. © 2017 Wiley Periodicals, Inc.
Keywords: sensation seeking, risk taking, risk avoidance, functional magnetic resonance imaging
INTRODUCTION
Sensation seeking—a personality trait associated with the tendency to take risks for varied, novel, complex, and intense stimulation [Zuckerman, 1994]—has received increased attention in recent years as a potential endophenotype of various risk‐taking behaviors. High sensation seekers (HSS), compared to low sensation seekers (LSS), are more vulnerable to reckless driving [Jonah, 1997], physical risk sports [Ruedl et al., 2012], unprotected sexual activities [Hoyle et al., 2000], problem gambling [Harris et al., 2015], and substance use [Bardo et al., 2007]. One critical issue is the mechanisms predisposing those high in sensation seeking to such risky behaviors. Addressing this issue is of great importance not only in prevention programs aimed at reducing the occurrence of sensation‐seeking behaviors [Sargent et al., 2010] but also in the development of risk‐taking models [Schonberg et al., 2011].
Most decisions in our daily life are made with more or less risk, an uncertainty about which of several possible outcomes with known probability will occur [Bernoulli, 1738]. Decision making under risk is the interaction between an emotional/motivational component and a cognitive component [Damasio et al., 1991; Kahneman and Tversky, 1979; Loewenstein et al., 2001]. Correspondingly, whereas neural underpinnings responsible for the emotional/motivational component consist of the ventral striatum and anterior insula, neural correlate underlying the cognitive component is the anterior cingulate cortex (ACC) [Mohr et al., 2010]. Whereas increased ventral striatal activity is associated with positive arousal and the subsequent approach‐tendency to take risk, increased anterior insula activity is linked to negative arousal and then promotes avoidance of risk [Knutson and Greer, 2008]. In addition, the ACC is responsible for exerting top–down control over the ventral striatum and anterior insula to influence the upcoming choice [Christopoulos et al., 2009; Kolling et al., 2012].
The functional significance of risk taking in sensation seeking remains poorly understood. Recent studies have investigated motivational processing in sensation seeking. Using a simple gambling task, a recent study found that HSS relative to LSS showed an enhanced reward sensitivity in the ventral striatum and insula and a reduced punishment sensitivity in the ventral striatum [Kruschwitz et al., 2012]. However, another study using a wheel‐of‐fortune task failed to observe group differences in ventral striatum activity to reward outcomes and instead found reduced insula and prefrontal responses to nonreward outcomes in HSS compared to LSS [Cservenka et al., 2012]. As described above, impaired motivational processing is unlikely to be the exclusive determinant of risky decision making among individuals with high sensation seeking. Rather, other functional circuitries, especially those mediating cognitive control, may be critically involved. Indeed, a previous study found that abnormal brain activity was associated with sensation seeking in a Go/Nogo task, indicating the potential influence of cognitive control on sensation‐seeking behaviors [Collins et al., 2012]. Specifically, LSS showed lateral prefrontal activation for nogo versus go trials. By contrast, HSS exhibited no differential activation in these areas but enhanced activation for go versus nogo trials in other brain areas including insula and ACC. However, no study to our knowledge has investigated the cognitive control function in sensation seeking under a motivational context.
In this study, we used an interactive, sequential gambling task to probe the neural correlates of risk taking and risk avoiding in sensation seeking. Both HSS and LSS decided whether to bet or to bank a certain number of chips at each round. Specifically, the participants had to balance between minimization of potential losses and maximization of potential gains, that is, to continue bet in the hope of winning more, or to stop playing and contend themselves with the chips accumulated during previous rounds. Stopping in this experimental context could be conceptualized as voluntary inhibition of the risk‐taking tendency [Meder et al., 2016]. Moreover, unlike most previous gambling tasks, the stake size (i.e., chips at each round) in this task was dynamic and could be accumulated, which was closer to a real gambling situation and thus possessed a greater external validity [Schonberg et al., 2011]. Behaviorally, we predicted that HSS relative to LSS would be more unwilling to stop (i.e., more willing to bet) in this task due to an intimate relationship between sensation seeking and risk‐taking behaviors in previous gambling tasks [Capra et al., 2013; Zheng and Liu, 2015]. Neurobiologically, we hypothesized that the voluntary inhibition of risk taking would implicate brain areas associated with cognitive control such as the ACC. Given its roles in representation of negative emotion and promotion of risk avoidance, the anterior insula would be also recruited when participants had to give up the opportunity to accumulate more chips. Importantly, these brain regions implicated by inhibition of risk taking would be more activated for HSS compared to LSS because it should be more difficult for HSS relative to LSS to inhibit their risk‐taking tendency. An alternative hypothesis, however, is that the ventral striatum and ACC would be activated when participants decided to take risks, which would be less recruited in HSS compared to LSS, as those high in sensation seeking should be more insensitive to risk.
METHODS
Participants
Fifty‐six young volunteers were recruited as participants through internet advertisements based on their scores on the Sensation Seeking Scale Form V (SSS‐V) [Zuckerman et al., 1978], which has a good reliability and validity in Chinese culture [Wang et al., 2000]. The SSS‐V includes the Thrill and Adventure Seeking (TAS), Experience Seeking (ES), Disinhibition (Dis), and Boredom Susceptibility (BS) subscales (10 items for each subscale). Summing the four subscales derives an overall sensation‐seeking score. Respondents scoring in the top quartile of the distribution of a large university student sample (N = 461, 253 females and 208 males) were classified as HSS, whereas those scoring in the bottom quartile as LSS. Potential participants were then invited randomly from the top and bottom quartiles separately. Additional recruitment criteria included: (1) no personal or family history of substance dependence or substance use; (2) free of a lifetime history of neurological or psychiatric disorders; (3) normal or corrected‐to‐normal vision; and (4) right‐handed as determined by self‐report. The final sample consisted of 28 HSS and 28 LSS (Table 1). As expected, the two groups differed significantly on the overall sensation‐seeking score and its subscale scores (Ps < 0.001). Moreover, the groups did not differ on age, gender, and education level (Ps > 0.05). A signed informed consent was obtained from each participant prior to the experiment, which was approved by the Institutional Review Board of the Institute of Psychology, Chinese Academy of Sciences.
Table 1.
Sample characteristics (M ± SD)
| High sensation seekers (N = 28) | Low sensation seekers (N = 28) | |
|---|---|---|
| Gender (M/F) | 14/14 | 14/14 |
| Age (years) | 21.46 ± 2.22 | 22.43 ± 3.01 |
| Education (years) | 14.50 ± 1.43 | 14.89 ± 1.81 |
| Thrill and adventure seeking | 9.29 ± 1.27 | 1.82 ± 1.74 |
| Experience seeking | 8.18 ± 1.12 | 2.61 ± 1.71 |
| Disinhibition | 6.39 ± 1.73 | 1.18 ± 1.12 |
| Boredom susceptibility | 5.64 ± 2.08 | 1.21 ± 1.20 |
| Sensation seeking | 29.50 ± 3.26 | 6.82 ± 2.80 |
Experimental Paradigm
An interactive, sequential gambling task was adopted in the current experiment (Fig. 1). In this task, participants started off with 3 chips taken out from their bank as their first wager. On each trial, participants had to decide whether to bank or to bet the current wager by selecting between a safe wheel and a risky wheel. This pair of wheels indicated in green the probability of winning the indicated wager and in red the probability of receiving nothing. The safe wheel always resulted in winning the wager with 100% probability, whereas the risky wheel was associated with one of three winning probabilities (i.e., 75%, 50%, and 25%). The safe and risky wheels on each trial were matched for expected value (i.e., probability × magnitude), but differed in risk value (Supporting Information, Table I), that is, variance, the mean squared deviation from the expected outcome, which is calculated using the following formula: Risk = [(1 − Probability) × (0 − Expected Value)2 + Probability × (Magnitude − Expected Value)2] [Engelmann and Tamir, 2009; Preuschoff et al., 2006; Tobler et al., 2009]. For example, a safe wheel yielded 3 chips at a probability of 100%, whereas a risky wheel yielded either 6 chips at a probability of 50% or 0 chips at a probability of 50%. The expected values of the safe wheel and risky wheel were equal (+3), while their risk values were different (safe wheel = 0; risky wheel = 9). If participants selected the safe wheel (i.e., bank), the current wager would be kept and saved to their bank and another 3 chips would be taken out from their bank as the wager on the next trial. If they selected the risky wheel (i.e., bet), the outcome would be resolved by the location where a spinning needle stopped on the wheel. However, participants were informed that the spinning of the wheel was not visible. If lost, the wager would be confiscated and they would have to take another 3 chips out of their bank as the wager on the next trial. If won, the winning chips would be carried as the wager on the next trial. If the current wager was over 100 chips, it would be automatically banked and the game would start over with 3 chips as the first wager.
Figure 1.
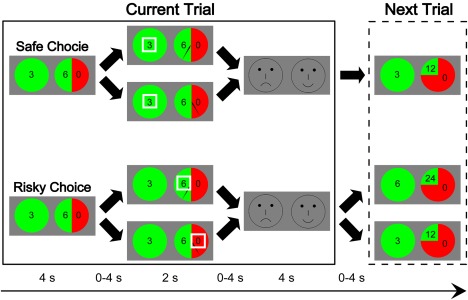
Schematic of the interactive, sequential gambling task. On each trial, participants chose to either bank or bet the chips, then were shown the outcomes of both the chosen and unchosen options, and finally evaluated their choice. The task was started off with 3 chips and the chips on the current trial were dependent on the outcome of the previous trial (see the text for details). [Color figure can be viewed at http://wileyonlinelibrary.com]
Participants played four runs of 6 min each. Each run comprised 24 trials with eight for each probability level. Each trial lasted 15 s on average: 4 s for a decision/anticipation phase, 2 s for an outcome‐monitoring phase, 4 s for a choice‐evaluation phase, and 0–4 s for jitters between phases. During the decision/anticipation phase, participants were shown a safe wheel and a risky wheel and were asked to choose one of them by pressing a button with either their left or right index finger, corresponding to the position of the preferred wheel. The positions of the two wheels on the screen were counterbalanced across trials. If no choice was made in a 4 s time limit, the computer would select one option randomly. During the outcome‐monitoring phase, participants were shown the outcomes of both the chosen and unchosen wheels, with only the outcome of the chosen wheel highlighted by a white box. During the choice‐evaluation phase, participants were told to indicate whether or not they were satisfied with the obtained outcome by selecting either a happy face or a sad face on the screen with the positions counterbalanced across trials.
Before each run, participants were provided with an initial endowment of 30 chips and were encouraged to respond in such a way to maximize their total chips as much as possible. In fact, outcomes (win or loss) of risky wheels were predetermined to allow a balanced design. That is, for each probability level, the proportion of trials for win or loss followed exactly the corresponding probability. Accumulated chips were shown only at the end of each run. At the end of the experiment, participants selected one of the four runs at random to determine their final payment. Unbeknown to participants, their payoff was determined by the maximal net earnings they obtained at the end of the four runs. Prior to entering the scanner, participants played a practice version of the task with 20 trials for familiarization.
Imaging Data Acquisition
A GE 3T (Discovery MR750) scanner located at Magnetic Resonance Imaging Research Center, Institute of Psychology, CAS equipped for echo‐planar imaging (EPI) was used for data acquisition. EPI images were acquired using the blood oxygen level dependent (BOLD) technique (TR = 2500 ms, TE = 30 ms, flip angle = 70°), each consisting of 40 contiguous axial slices (field of view = 220 × 220 mm2, voxel size = 3.44 × 3.44 × 3.50 mm3). A high‐resolution 3D BRAVO T1‐weighted anatomical set (136 sagittal slices of full head, TR = 8.208 ms, TE = 3.22 ms, flip angle = 12°, field of view = 240 × 240 mm2, voxel size = 1 × 1 × 1 mm3) was acquired at the end of the experiment. Stimuli were presented via a visual and audio stimulation system for fMRI. A computer running E‐Prime controlled stimulus presentation, behavioral data acquisition, and event timing. To ensure that acquisition of brain activity was synchronized with the onset of stimulus presentation, the start of each run was triggered by an optical pulse from the scanner.
Behavioral Data Analysis
After removal of trials in which no response was made within the 4 s period of the decision phase (1.00% for HSS and 0.52% for LSS), behavioral performance was collapsed across trials with different winning probabilities. Analysis of decision‐making time, the proportion of risky choice, and the proportion of right choice was performed using an independent‐samples t test separately. The right choice was defined as when participants bet and won or when they banked and avoided a potential loss. Moreover, we used two general estimating equation (GEE) models with group (categorical), risk value (continuous), and trial number (continuous) as predictors to determine the influence of risk and group (Model 1) and the interaction (Model 2) on participants' choice. GEE is a generalized technique able to model binary outcome variable (e.g., Bet vs Bank) with correlated residuals (e.g., nested within a single participant) through a link function [Liang et al., 1986; Zeger and Liang, 1986]. The GEE models were implemented in SPSS v21. In addition, two further analyses were performed to evaluate participants' risk preference. First, because of the dynamic nature of this gambling task, the amounts won and lost are much higher when participants go through a winning streak (won 2/3 times in a row). We therefore compared the number of winning streaks between HSS and LSS and then evaluated how this influenced risk preference (the proportion of bet) using an independent‐samples t test. Second, a sequential analysis was performed using a Group (HSS vs LSS) × Preceding outcome (Win vs Loss) ANOVA to examine how risk preference was influenced by the outcome on the previous trial.
fMRI Data Analysis
Analyses were conducted using FMRIB's Software Library (FSL, v5.09, http://www.fmrib.ox.ac.uk/fsl). The images of each participant's time series were preprocessed with motion correction using MCFLIRT, nonbrain removal using BET, spatial smoothing using a 3D Gaussian kernel (full width at half maximum = 5 mm), and high‐pass temporal filtering (cutoff = 100 s).
As in behavioral analysis, statistical analysis was collapsed across trials with different winning probabilities and trials involving no response during the decision phase were excluded from further analyses. Regressors of interest included individualized models of the decision/anticipation phase (Bet, Bank), the outcome‐monitoring phase (Win, Loss), and the choice‐evaluation phase (Happy, Sad). Activity during the decision/anticipation phase was modeled in terms of whether participants chose a risky wheel (Bet) or a safe wheel (Bank). Given that the outcome of the safe wheel is certain and thus makes no sense, activity during the outcome‐monitoring phase was modeled in terms of the outcomes (Win or Loss) of the risky wheel regardless of participants' decision, which affords to examine the rapid, coarse processing of reward valence. Note that the outcomes of the risky wheel are counterfactual after a Bank decision in that they represent what would have happened if participants had chosen to bet. Activity during the choice‐evaluation phase was modeled in terms of whether or not participants were pleased with the obtained outcome: Happy or Sad. Because of the dynamic nature of this task, the stake size (i.e., the amount of chips) escalated trial‐by‐trial as participants won gambles and then got reset due to a loss or banking decision, which might influence activation patterns during the decision and outcome phases (i.e., Bet, Bank, Win, and Loss). For each of these four regressors, we therefore included an additional parametric regressor with its modulation value set to the risk value of the risky wheel on each trial. The parametric values were demeaned before creating the regressor so that the parametric regressor was not correlated with the corresponding constant regressor [Poldrack et al., 2011].
Customized square waveforms for regressors were constructed and then convolved with a double‐gamma hemodynamic response function. Statistical contrast maps of interest were registered via participants' high resolution T1‐weighted anatomical image to common stereotaxic space yielding images with 2 × 2 × 2 mm3 spatial resolution before mixed‐effects group analyses were performed to obtain the group mean of brain activation. The main contrast of interest was the group comparison (HSS vs LSS) for contrasts during the decision/anticipation phase (Bet vs Bank). Group comparison was also performed for the outcome‐monitoring phase (Win vs Loss) and the choice‐evaluation phase (Happy vs Sad) to examine whether group differences were specific to the decision phase. Group images were corrected for multiple comparisons using Gaussian Random Filed Theory (GRFT) with a height threshold of Z > 2.3 and a cluster probability of P < 0.05. Moreover, a gray‐matter mask was used to limit the statistics searching only within gray matter voxels. Because of the double subtraction, clusters exceeding the statistical threshold should result in a significant interaction of group‐by‐condition. To determine which of the group or condition differences were driving the brain activation, parameter estimate (PE) value averaging across all voxels in each cluster was extracted from contrasts of interest (e.g., the Bet > Baseline and Bank > Baseline contrasts) for each participant and then entered into a mixed‐model ANOVA with post hoc t tests to examine simple effects.
RESULTS
Behavioral Results
Average decision‐making time was similar between HSS (1341 ± 257 ms) and LSS (1368 ± 285 ms), t(54) = −0.37, P = 0.741. Overall, participants exhibited a stronger tendency to bet compared to the chance level (0.50). This bias to bet was somewhat enhanced in HSS compared to LSS, t(54) = 1.91, P = 0.062 (Fig. 2A), which was further revealed by following GEE models (Supporting Information, Table II). Overall coefficients of the models revealed that sensation seeking was a positive predictor of selection of risky choice (b = 0.414, P = 0.038), which was not modulated by risk level as indicated by the absence of the interaction between risk and group (b = 0.008, P = 0.246). Moreover, risk level seemed to be a negative predictor of the selection of risky choice, though the effect failed to reach significance (b = −0.004, P = 0.059).
Figure 2.
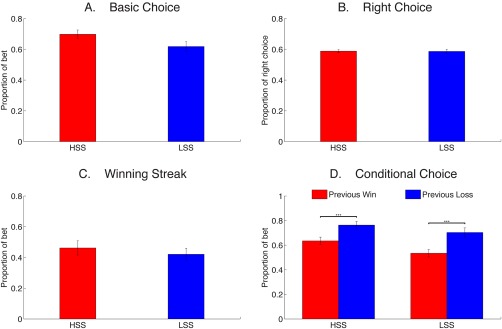
Behavioral results. The figures show the proportion of bet (A), the proportion of right choice (B), the proportion of bet when participants won 2/3 times in a row (C), and the proportion of bet based on the outcome of previous trial (D) for HSS and LSS. Error bars represent standard errors of the means. ***P < 0.001. [Color figure can be viewed at http://wileyonlinelibrary.com]
In addition, participants made more right choices (i.e., bet and won or banked and avoided a potential loss) against the chance level, with no differences between the two groups (Fig. 2B). For the winning‐streak analysis, HSS (12.64 ± 4.35) exhibited more winning streaks compared to LSS (9.54 ± 4.44), t(54) = 2.65, P = 0.011. The two groups, however, showed similar risk preference when they went through winning streaks, t(54) = 0.68, P = 0.502 (Fig. 2C). For the sequential analysis, participants tended to bet after a loss compared to after a win, F(1, 54) = 85.02, P < 0.00001, which was similar across HSS and LSS, as reflected by a nonsignificant interaction (P > 0.2) (Fig. 2D). In sum, these behavioral findings revealed no group differences in overall task engagement.
Neuroimaging Results
Task‐related brain activity for HSS and LSS during the decision/anticipation, outcome‐monitoring, and choice‐evaluation phases is displayed in Figure 3. Both groups showed robust activity in response to the contrasts of Bet > Bank, Win > Loss, and Happy > Sad in subcortical areas including the ventral striatum, regions implicated in reward processing. No activation for the reversed contrasts (i.e., Bank > Bet, Loss > Win, and Sad > Happy) emerged in both groups. Group differences during the outcome‐monitoring phase (Win vs Loss) and the choice‐evaluation phase (Happy vs Sad) were relatively small and mainly observed in brain regions irrelevant to motivation or cognitive control (Supporting Information, Table III) and thus were not interpreted further.
Figure 3.
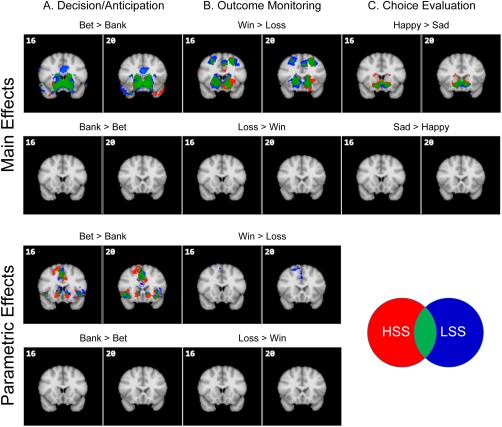
Overlay of brain areas activated for HSS and LSS across the decision/anticipation, outcome‐monitoring, and choice‐evaluation phases (Z > 2.3, whole‐brain cluster‐corrected at P < 0.05 using GRFT). [Color figure can be viewed at http://wileyonlinelibrary.com]
Table 2 displays a complete list of regions showing group differences for main and parametric effects during the decision/anticipation phase (LSS > HSS for Bet > Bank, which was equivalent to HSS > LSS for Bank > Bet). For the main effects, two clusters (the bilateral ACC and right anterior insula) were obtained for LSS > HSS for Bet > Bank (i.e., HSS > LSS for Bank > Bet), as illustrated in Figure 4. In the bilateral ACC, a Group (HSS vs LSS) × Choice (Bet vs Bank) ANOVA revealed a significant main effect of choice, F(1, 54) = 7.05, P = 0.010, which was qualified by a significant group‐by‐choice interaction, F(1, 54) = 15.23, P < 0.001. This interaction was due to a significantly greater ACC activation in the HSS versus LSS when they decided to avoid a risky choice (P = 0.007) but not when to choose a risky choice (P = 0.798). Moreover, within‐group tests revealed that whereas LSS showed greater ACC activation in response to risk taking than risk avoidance (P < 0.001), HSS showed comparable ACC responses between risk taking and risk avoidance (P = 0.382). In the right anterior insula, there was a significant interaction between group and choice, F(1, 54) = 9.65, P = 0.003. Follow‐up tests indicated that HSS relative to LSS showed significantly stronger responses in the right anterior insula when they decided to give up the risky choice and keep the money (P = 0.004) but not when to choose a risky choice (P = 0.966). Furthermore, while the right anterior insula activation was not modulated by choice in LSS (P = 0.139), HSS responded more strongly when avoiding risk versus taking risk (P = 0.006).
Table 2.
Group differences in Bet versus Bank in HSS and LSS during the decision/anticipation phase
| Cluster size | Region | BA | MAX Z | MNI | ||
|---|---|---|---|---|---|---|
| X | Y | Z | ||||
| LSS > HSS: main effects | ||||||
| 2161 | R. anterior cingulate cortex | 24 | 3.90 | 4 | 36 | 18 |
| L. anterior cingulate cortex | 24 | 3.83 | −6 | 14 | 36 | |
| R. supplementary motor area | 6 | 3.67 | 10 | 8 | 56 | |
| 485 | R. frontal orbital cortex | 47 | 3.69 | 34 | 32 | −10 |
| R. insula | 47 | 3.31 | 36 | 28 | 4 | |
| R. insula | 48 | 2.94 | 48 | 10 | 0 | |
| LSS > HSS: parametric effects | ||||||
| 2231 | R. inferior temporal gyrus | 37 | 3.57 | 48 | −58 | −18 |
| R. cerebellum crus II | 3.57 | 8 | −78 | −28 | ||
| R. cerebellum crus I | 3.53 | 30 | −62 | −32 | ||
| 2023 | L. superior parietal lobule | 7 | 3.55 | −30 | −64 | 52 |
| L. superior parietal lobule | 3.45 | −14 | −76 | 46 | ||
| R. angular gyrus | 40 | 3.43 | 30 | −52 | 38 | |
| 1472 | R. dorsomedial frontal cortex | 44 | 3.98 | 2 | 30 | 42 |
| dorsomedial frontal cortex | 3.75 | 0 | 40 | 32 | ||
| R. supplementary motor cortex | 6 | 3.63 | 8 | 8 | 66 | |
| 1130 | L. thalamus | 3.70 | −6 | −4 | 4 | |
| L. pallidum | 3.61 | −10 | 6 | −2 | ||
| R. caudate | 3.47 | 12 | 6 | 8 | ||
| 632 | L. middle occipital cortex | 18 | 3.55 | −20 | −92 | 0 |
| L. middle occipital cortex | 19 | 3.19 | −38 | −86 | 12 | |
| L. occipital pole | 3.15 | −18 | −96 | −20 | ||
Note. Statistical images were thresholded with a height threshold of Z > 2.3 and a cluster probability of P < 0.05 at the whole‐brain level. L., left; R., right; BA, Brodmann area; MNI, Montreal Neurological Institute; HSS, high sensation seekers; LSS, low sensation seekers.
Figure 4.
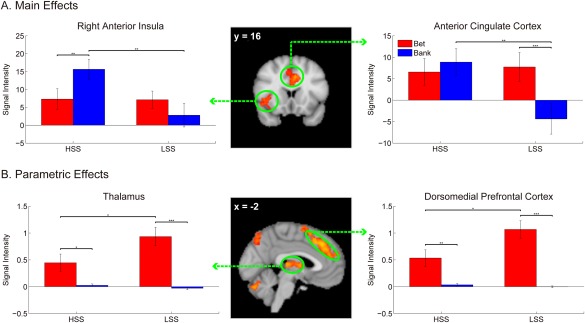
Activation patterns of brain areas isolated from LSS > HSS for Bet > Bank (equivalent to HSS > LSS for Bank > Bet) for main (A) and parametric (B) effects. Error bars represent standard errors of the means. *P < 0.05. **P < 0.01. ***P < 0.001. [Color figure can be viewed at http://wileyonlinelibrary.com]
Regions showing group differences for a parametric modulation as a function of risk are shown in Table 2. Among these regions, the dorsomedial prefrontal cortex (DMPFC) and thalamus were highlighted (Fig. 4) as they have been implicated in risk processing in previous brain‐imaging studies. A Group × Choice on the DMPFC data revealed significant main effects of choice, F(1, 54) = 51.33, P < 0.0001, and group, F(1, 54) = 6.78, P = 0.012, and a significant interaction between group and choice, F(1, 54) = 6.78, P = 0.012. Follow‐up tests indicated that the DMPFC activity was decreased in HSS compared to LSS during risk taking (P = 0.020) instead of risk avoidance (P = 0.206). Moreover, both groups exhibited stronger responses to risk taking than risk avoidance (Ps < 0.05). Similar results were obtained for the thalamus activation. There was a significant main of choice, F(1, 54) = 33.47, P < 0.0001, which was qualified by a significant interaction between choice and group, F(1, 54) = 5.14, P = 0.027. Follow‐up tests revealed that this interaction was driven by reduced thalamus responses for HSS versus LSS during risk taking (P = 0.044) instead of risk avoidance (P = 0.153). Moreover, the risk effect was significant across the two groups (Ps < 0.05).
DISCUSSION
This fMRI study investigated the neural mechanisms underlying risk taking in sensation seeking using an interactive, sequential gambling task. During this task, HSS and LSS had to make a decision between a risky continued choice with uncertain but significant gains against losses and a safe stop choice with a known outcome, which allowed us to examine the neural correlates responsible for the voluntary pursuit and inhibition of risk taking in sensation seeking. At the behavioral level, HSS relative to LSS showed a stronger tendency to take risks with no group differences in decision time, conditional choice, and right choice. Although HSS relative to LSS exhibited more winning streaks (won 2/3 times in a row), risk preference was influenced by winning streaks across groups to the same extent. At the neurobiological level, group differences emerged in brain areas recruited in the voluntary inhibition of risk taking, as HSS compared to LSS showed enhanced neural responses to risk‐avoidance decision in the bilateral ACC and right anterior insula. Moreover, parametric analyses revealed group differences in the pursuit of risk taking with a reversed pattern. HSS relative to LSS exhibited reduced responses to risk‐seeking decision in brain areas such as the DMPFC and thalamus. These findings suggest that sensation seeking is associated with the abnormal brain activation both of risk‐avoidance and risk‐seeking decisions and thus provide valuable constraints toward advancing theoretical perspectives on the mechanisms underlying risk taking in sensation seeking.
According to the arousal theory [Zheng and Liu, 2015; Zheng et al., 2015; Zuckerman, 1994], HSS differ from LSS in terms of their optimal level of arousal and need more stimulation to reach and maintain their optimal arousal level. As risk taking provides the main source of intense stimulation and thus an increased arousal level, it is not surprising that those high in sensation seeking are more vulnerable to various risky behaviors. However, this does not mean that HSS cannot process risk appropriately, which was demonstrated by the behavioral data in this study. Despite an enhanced risk‐taking tendency for HSS compared to LSS in the current experiment, both groups were likely to take risks after a loss and made an equal number of right choices. Importantly, we found that HSS relative to LSS showed reduced neural responses to risk‐seeking decision in the DMPFC and thalamus, which has been implicated in risk processing [Knutson and Huettel, 2015; Liu et al., 2007; Mohr et al., 2010; Xue et al., 2009]. Our finding is in line with previous research finding that HSS versus LSS displayed diminished fear‐potentiated startle during the anticipation of negatively emotional stimuli [Lissek et al., 2005] and reduced event‐related potential (ERP) amplitudes in responses to high emotionally arousal stimuli [Zheng et al., 2015] and monetary risk [Zheng and Liu, 2015]. Together with these previous studies, it is possible that HSS relative to LSS possess a hypoactive brain system and thus need higher stakes to reach their optimal level of arousal.
On the other hand, risk may be not the main focus of sensation seeking per se [Patton, 2012], as many sensation‐seeking activities (e.g., viewing scary movies) are not at all risky; it is just one way by which HSS obtain their optimal level of arousal. Our second finding suggests what drives sensation seeking may be that they cannot tolerate for the daily routines that are unable to provide sufficient stimulation, for example, the safe wheel in the current experimental context. Specifically, this study demonstrated that when HSS had to give up an opportunity to obtain strong arousal in risk taking, they paid a cost both at the cognitive level as indexed by enhanced activation in the bilateral ACC and at the emotional level as indexed by enhanced right anterior insula activity.
ACC activation is found in various tasks tapping cognitive control such as error monitoring, response conflict, action selection, and decision making [Ridderinkhof et al., 2004]. It is responsible for exerting cognitive control over risky choice when people have to make a decision between a safe option and a risky option [Knutson and Huettel, 2015], which is observed among those low in sensation seeking in the current study. Interestingly, this risk effect disappeared in HSS, which was mainly caused by the fact that HSS engaged the ACC more strongly than LSS in the voluntary inhibition of risk taking (i.e., choosing to bank the current chips). Previous research has linked the ACC activation to choices against a typical decision frame [De Martino et al., 2006], overcoming the status quo [Fleming et al., 2010], and overriding Pavlovian learning bias [Cavanagh et al., 2013]. Thus, the stronger ACC activity observed for HSS versus LSS indicates that more cognitive control is needed to override their tendency to take risks for an optimal arousal level.
Previous research found that HSS engaged the insula more strongly in the face of high‐arousal emotional stimuli [Joseph et al., 2009] and rewards with high magnitude [Kruschwitz et al., 2012] but showed reduced insula activity in response to reward absence [Cservenka et al., 2012]. Our findings extended these findings in that HSS relative to LSS recruited the right anterior insula more strongly in voluntary inhibition, rather than the pursuit, of risk taking. The right anterior insula is known as an interoceptive cortex and responsible for the mapping of internal bodily states and the representation of emotional arousal [Craig, 2009; Critchley, 2005]. This area also is implicated in risk processing [Mohr et al., 2010] due to its association with aversive emotion [Aupperle and Paulus, 2010; Phan et al., 2002]. Thus, our finding suggests that strong aversive emotion might be evoked when those high in sensation seeking had to give up an opportunity to obtain intense arousal, which was even more powerful than when they decided to take a risk. This explanation is consistent with the well‐known phenomenon that people under the optimal level of arousal often experience negative emotions [Zuckerman, 2007], though we had not collected the affective rating data during the decision phase. Interestingly, HSS and LSS showed comparable activation in the right anterior insula during the choice‐evaluation phase, indicating that the group differences found here were specific to the decision phase.
One limitation of this study concerns sample selection. First, HSS and LSS were selected from the top and bottom quartiles of the SSS‐V, and we did not include participants from the middle quartile, who could be served as a baseline when comparing with HSS and LSS. Second, the current sample, as in most of the existing sensation‐seeking studies, has been drawn from a university student pool using a personality questionnaire, limiting the possibility that generalizes our findings to individuals showing sensation‐seeking behaviors in real life. Taking these issues into accounting, future research with more ecological validity is needed by including “real‐life” sensation seekers and “normal” individuals randomly selected from the community.
In conclusion, whereas previous studies on the risk‐taking mechanisms in sensation seeking have shown that this personality trait is associated with abnormal motivational system, our findings suggest that the impact of sensation seeking on risk‐based decision‐making depends on two forces: one is the reduced neural responses when taking risk and the other is the over‐recruitment of neural systems in voluntary inhibition of risk taking. This dual cognitive/motivational architecture provides implications for future prevention programs targeting sensation‐seeking behaviors.
Supporting information
Supporting Information Table S1
Supporting Information Table S2
Supporting Information Table S3
ACKNOWLEDGMENT
The authors have declared that no competing interests exist.
REFERENCES
- Aupperle RL, Paulus MP (2010): Neural systems underlying approach and avoidance in anxiety disorders. Dialog Clin Neurosci 12:517–531. [DOI] [PMC free article] [PubMed] [Google Scholar]
- Bardo MT, Williams Y, Dwoskin LP, Moynahan SE, Perry IB, Martin CA (2007): The sensation seeking trait and substance use: Research findings and clinical implications. Curr Psychiatry Rev 3:3–13. [Google Scholar]
- Bernoulli D (1738): Specimen theoriae novae de mensura sortis. Commentarii Academiae Scientarum Imperialis Petropolitanae 5:175–192. [Google Scholar]
- Capra CM, Jiang B, Engelmann JB, Berns GS (2013): Can personality type explain heterogeneity in probability distortions? J Neurosci Psychol Econ 6:151–166. [DOI] [PMC free article] [PubMed] [Google Scholar]
- Cavanagh JF, Eisenberg I, Guitart‐Masip M, Huys Q, Frank MJ (2013): Frontal theta overrides pavlovian learning biases. J Neurosci 33:8541–8548. [DOI] [PMC free article] [PubMed] [Google Scholar]
- Christopoulos GI, Tobler PN, Bossaerts P, Dolan RJ, Schultz W (2009): Neural correlates of value, risk, and risk aversion contributing to decision making under risk. J Neurosci 29:12574–12583. [DOI] [PMC free article] [PubMed] [Google Scholar]
- Collins HR, Corbly CR, Liu X, Kelly TH, Lynam D, Joseph JE (2012): Too little, too late or too much, too early? Differential hemodynamics of response inhibition in high and low sensation seekers. Brain Res 1481:1–12. [DOI] [PMC free article] [PubMed] [Google Scholar]
- Craig AD (2009): How do you feel–now? The anterior insula and human awareness. Nat Rev Neurosci 10:59–70. [DOI] [PubMed] [Google Scholar]
- Critchley HD (2005): Neural mechanisms of autonomic, affective, and cognitive integration. J Comp Neurol 493:154–166. [DOI] [PubMed] [Google Scholar]
- Cservenka A, Herting MM, Seghete KL, Hudson KA, Nagel BJ (2012): High and low sensation seeking adolescents show distinct patterns of brain activity during reward processing. NeuroImage 66C:184–193. [DOI] [PMC free article] [PubMed] [Google Scholar]
- Damasio AR, Tranel D, Damasio HC (1991): Somatic markers and the guidance of behavior: Theory and preliminary testing In: Levin HS, Eisenberg HM, Benton AL, editors. Frontal Lobe Function and Dysfunction. New York, NY, US: Oxford University Press; pp 217–229. [Google Scholar]
- De Martino B, Kumaran D, Seymour B, Dolan RJ (2006): Frames, biases, and rational decision‐making in the human brain. Science 313:684–687. [DOI] [PMC free article] [PubMed] [Google Scholar]
- Engelmann JB, Tamir D (2009): Individual differences in risk preference predict neural responses during financial decision‐making. Brain Res 1290:28–51. [DOI] [PMC free article] [PubMed] [Google Scholar]
- Fleming SM, Thomas CL, Dolan RJ (2010): Overcoming status quo bias in the human brain. Proc Natl Acad Sci USA 107:6005–6009. [DOI] [PMC free article] [PubMed] [Google Scholar]
- Harris N, Newby J, Klein RG (2015): Competitiveness facets and sensation seeking as predictors of problem gambling among a sample of university student gamblers. J Gambl Stud 31:385–396. [DOI] [PubMed] [Google Scholar]
- Hoyle RH, Fejfar MC, Miller JD (2000): Personality and sexual risk taking: A quantitative review. J Pers 68:1203–1231. [DOI] [PubMed] [Google Scholar]
- Jonah BA (1997): Sensation seeking and risky driving: A review and synthesis of the literature. Accid Anal Prev 29:651–665. [DOI] [PubMed] [Google Scholar]
- Joseph JE, Liu X, Jiang Y, Lynam D, Kelly TH (2009): Neural correlates of emotional reactivity in sensation seeking. Psychol Sci 20:215–223. [DOI] [PMC free article] [PubMed] [Google Scholar]
- Kahneman D, Tversky A (1979): Prospect theory: An analysis of decision under risk. Econometrica 47:263–291. [Google Scholar]
- Knutson B, Greer SM (2008): Anticipatory affect: Neural correlates and consequences for choice. Philos Trans R Soc Lond B Biol Sci 363:3771–3786. [DOI] [PMC free article] [PubMed] [Google Scholar]
- Knutson B, Huettel SA (2015): The risk matrix. Curr Opin Behav Sci 5:141–146. [Google Scholar]
- Kolling N, Behrens TE, Mars RB, Rushworth MF (2012): Neural mechanisms of foraging. Science 336:95–98. [DOI] [PMC free article] [PubMed] [Google Scholar]
- Kruschwitz JD, Simmons AN, Flagan T, Paulus MP (2012): Nothing to lose: Processing blindness to potential losses drives thrill and adventure seekers. NeuroImage 59:2850–2859. [DOI] [PMC free article] [PubMed] [Google Scholar]
- Liang KY, Beaty TH, Cohen BH (1986): Application of odds ratio regression models for assessing familial aggregation from case‐control studies. Am J Epidemiol 124:678–683. [DOI] [PubMed] [Google Scholar]
- Lissek S, Baas JM, Pine DS, Orme K, Dvir S, Rosenberger E, Grillon C (2005): Sensation seeking and the aversive motivational system. Emotion 5:396–407. [DOI] [PubMed] [Google Scholar]
- Liu X, Powell DK, Wang H, Gold BT, Corbly CR, Joseph JE (2007): Functional dissociation in frontal and striatal areas for processing of positive and negative reward information. J Neurosci 27:4587–4597. [DOI] [PMC free article] [PubMed] [Google Scholar]
- Loewenstein GF, Weber EU, Hsee CK, Welch N (2001): Risk as feelings. Psychol Bull 127:267–286. [DOI] [PubMed] [Google Scholar]
- Meder D, Haagensen BN, Hulme O, Morville T, Gelskov S, Herz DM, Diomsina B, Christensen MS, Madsen KH, Siebner HR (2016): Tuning the brake while raising the stake: Network dynamics during sequential decision‐making. J Neurosci 36:5417–5426. [DOI] [PMC free article] [PubMed] [Google Scholar]
- Mohr PN, Biele G, Heekeren HR (2010): Neural processing of risk. J Neurosci 30:6613–6619. [DOI] [PMC free article] [PubMed] [Google Scholar]
- Patton JH (2012): Sensation seeking In: Editor‐in‐Chief VSR, editor. Encyclopedia of Human Behavior, 2nd ed. San Diego: Academic Press; pp 359–365. [Google Scholar]
- Phan KL, Wager T, Taylor SF, Liberzon I (2002): Functional neuroanatomy of emotion: A meta‐analysis of emotion activation studies in PET and fMRI. NeuroImage 16:331–348. [DOI] [PubMed] [Google Scholar]
- Poldrack RA, Mumford JA, Nichols TE (2011): Handbook of Functional MRI Data Analysis. Cambridge University Press. [Google Scholar]
- Preuschoff K, Bossaerts P, Quartz SR (2006): Neural differentiation of expected reward and risk in human subcortical structures. Neuron 51:381–390. [DOI] [PubMed] [Google Scholar]
- Ridderinkhof KR, Ullsperger M, Crone EA, Nieuwenhuis S (2004): The role of the medial frontal cortex in cognitive control. Science 306:443–447. [DOI] [PubMed] [Google Scholar]
- Ruedl G, Abart M, Ledochowski L, Burtscher M, Kopp M (2012): Self reported risk taking and risk compensation in skiers and snowboarders are associated with sensation seeking. Accid Anal Prev 48:292–296. [DOI] [PubMed] [Google Scholar]
- Sargent JD, Tanski S, Stoolmiller M, Hanewinkel R (2010): Using sensation seeking to target adolescents for substance use interventions. Addiction 105:506–514. [DOI] [PMC free article] [PubMed] [Google Scholar]
- Schonberg T, Fox CR, Poldrack RA (2011): Mind the gap: Bridging economic and naturalistic risk‐taking with cognitive neuroscience. Trends Cogn Sci 15:11–19. [DOI] [PMC free article] [PubMed] [Google Scholar]
- Tobler PN, Christopoulos GI, O'Doherty JP, Dolan RJ, Schultz W (2009): Risk‐dependent reward value signal in human prefrontal cortex. Proc Natl Acad Sci USA 106:7185–7190. [DOI] [PMC free article] [PubMed] [Google Scholar]
- Wang W, Wu YX, Peng ZG, Lu SW, Yu L, Wang GP, Fu XM, Wang YH (2000): Test of sensation seeking in a Chinese sample. Pers Indiv Differ 28:169–179. [Google Scholar]
- Xue G, Lu Z, Levin IP, Weller JA, Li X, Bechara A (2009): Functional dissociations of risk and reward processing in the medial prefrontal cortex. Cereb Cortex 19:1019–1027. [DOI] [PMC free article] [PubMed] [Google Scholar]
- Zeger SL, Liang KY (1986): Longitudinal data analysis for discrete and continuous outcomes. Biometrics 42:121–130. [PubMed] [Google Scholar]
- Zheng Y, Liu X (2015): Blunted neural responses to monetary risk in high sensation seekers. Neuropsychologia 71:173–180. [DOI] [PubMed] [Google Scholar]
- Zheng Y, Tan F, Xu J, Chang Y, Zhang Y, Shen H (2015): Diminished P300 to physical risk in sensation seeking. Biol Psychol 44–51. [DOI] [PubMed] [Google Scholar]
- Zuckerman M (1994): Behavioral Expressions and Biosocial Bases of Sensation Seeking. New York: Cambridge University Press. [Google Scholar]
- Zuckerman M (2007): Sensation Seeking and Risky Behavior. Washington, DC US: American Psychological Association. [Google Scholar]
- Zuckerman M, Eysenck S, Eysenck HJ (1978): Sensation seeking in England and America: Cross‐cultural, age, and sex comparisons. J Consult Clin Psychol 46:139–149. [DOI] [PubMed] [Google Scholar]
Associated Data
This section collects any data citations, data availability statements, or supplementary materials included in this article.
Supplementary Materials
Supporting Information Table S1
Supporting Information Table S2
Supporting Information Table S3