

Abstract
Previous studies on visuo‐haptic shape processing provide evidence that visually learned shape information can transfer to the haptic domain. In particular, recent neuroimaging studies have shown that visually learned novel objects that were haptically tested recruited parts of the ventral pathway from early visual cortex to the temporal lobe. Interestingly, in such tasks considerable individual variation in cross‐modal transfer performance was observed. Here, we investigate whether this individual variation may be reflected in microstructural characteristics of white‐matter (WM) pathways. We first trained participants on a fine‐grained categorization task of novel shapes in the visual domain, followed by a haptic categorization test. We then correlated visual training‐performance and haptic test‐performance, as well as performance on a symbol‐coding task requiring visuo‐motor dexterity with microstructural properties of WM bundles potentially involved in visuo‐haptic processing (the inferior longitudinal fasciculus [ILF], the fronto‐temporal part of the superior longitudinal fasciculus [SLFft] and the vertical occipital fasciculus [VOF]). Behavioral results showed that haptic categorization performance was good on average but exhibited large inter‐individual variability. Haptic performance also was correlated with performance in the symbol‐coding task. WM analyses showed that fast visual learners exhibited higher fractional anisotropy (FA) in left SLFft and left VOF. Importantly, haptic test‐performance (and symbol‐coding performance) correlated with FA in ILF and with axial diffusivity in SLFft. These findings provide clear evidence that individual variation in visuo‐haptic performance can be linked to microstructural characteristics of WM pathways. Hum Brain Mapp 38:842–854, 2017. © 2016 Wiley Periodicals, Inc.
Keywords: tractography, shape processing, haptics, individual variability, DTI, multisensory processing
INTRODUCTION
Imagine that you want to find an object (such as your keys) in the depths of your pocket or handbag—in order to solve this task, visual information will need to activate or prime touch information so that you can locate the object without visual input. Previous studies have, indeed, shown that information travels fairly easily between vision and touch [Lacey et al., 2009; Newell et al., 2001; Norman et al., 2004; Wallraven et al., 2014]—one potential reason for this may be that object representations may be multisensory in nature being activated by visual or tactile input [Lacey et al., 2009]. Further support for shared object representations comes from a series of recent studies showing that both vision and touch are able to reconstruct highly abstract shape spaces of novel objects [Cooke et al., 2007; Gaißert et al., 2010; Gaißert and Wallraven, 2012; Gaißert et al., 2011].
The similarity between vision and touch also extends to categorization tasks with novel objects [Wallraven et al., 2014] and to real‐world natural objects [Gaißert and Wallraven, 2012]. In a recent study, we have shown that metric shape information trained in one modality (either vision or touch) symmetrically transfers to the other, untrained modality using a novel shape categorization task [Wallraven et al., 2014]. While these results—and those from other studies—speak strongly in favor of shared representations between vision and touch, one aspect that has so far not been studied in detail is the individual variability in this task. Indeed, in the study by Wallraven et al. [2014], all participants showed proper training effects—the magnitude of these effects, however, differed from participant to participant and with that also participants' performance and ability to transfer information from vision to touch (and vice versa). In other words, there are people who are naturally better at cross‐modal information transfer than others. The goal of this article is to provide more data on this phenomenon from a behavioral side, but more importantly to provide evidence of neuroanatomical correlates for these performance differences.
When looking into neural correlates of multisensory processing of vision and touch, several functional neuroimaging studies have resulted in evidence for shared multisensory representations in the human brain. These studies have identified potential substrates of such representations in the lateral occipital cortex (LOC) and the intraparietal sulcus (IPS) [Amedi et al., 2001; Lacey et al., 2009].
Furthermore, it was found that haptic shape processing was not solely limited to LOC. Our previous study provided evidence that haptic shape selectivity for novel objects could be observed along the ventral pathway (from early visual cortex to the temporal lobe), when participants had been exposed to these objects in the visual domain before. Hence, the entire ventral stream provided a highly accurate and veridical reconstruction of object shapes of both visual and haptic shape information [Lee Masson et al., 2015].
While these previous studies show a tight link between vision and touch and have identified functional correlates of multisensory processing, so far nothing is known about how performance in vision and touch is associated with WM, structural properties in the brain.
Diffusion‐weighted MR imaging (dMRI) followed by diffusion tensor analysis investigates microstructural white‐matter properties by tracking the diffusivity of water molecules in the brain tissue [Le Bihan et al., 2001]. In particular, the diffusion tensor that fits with the dMRI measurements encodes the direction of axonal fibers and hence can be used as an indirect measure of neural connectivity in WM. The tensor contains intra‐voxel structural information, embodied in the shape of the diffusion ellipsoid (three eigenvectors and three eigenvalues) with which scalar values such as fractional anisotropy (FA), axial diffusivity (AD) or radial diffusivity (RD) are calculated. Among these scalar values, the largest eigenvalue parallel to the axon is referred as AD, while the mean of two eigenvalues perpendicular to the axon is called RD. Generally, AD reflects axonal morphological changes, while RD is related to the degree of myelination of the axon [Song et al., 2005]. The FA value is more widely used as an indication of WM integrity, representing the degree of the diffusion anisotropy (FA = 0 represents isotropic diffusion and FA = 1 represents fully‐directed, anisotropic diffusion) of the fiber [Horsfield and Jones, 2002; Song et al., 2005; Werring et al., 2000]. Since FA is characterized by the variance among the three eigenvalues, high FA values may reflect either high AD, low RD or both [Pierpaoli and Basser, 1996], showing that the three microstructural measures are related. In addition, several factors can influence these parameters, such that direct inferences about microstructural properties should be treated with caution [Beaulieu, 2002; Beaulieu and Allen, 1994]—such factors include changes in myelination [Bosch et al., 2012], axon density, axonal membrane integrity, axon diameter [Barazany et al., 2009] and intra‐voxel coherence of fiber orientation [Jeurissen et al., 2013; Pierpaoli et al., 2001]. In the context of the present study, our interest lies in the body of evidence that shows that these three types of scalar values characterizing microstructural properties are able to reflect various cognitive function and training effects.
Although no previous study has so far investigated which WM tracks are involved in visual or haptic shape information in particular, several previous experiments have implicated correlations of microstructural properties with various perceptual and cognitive functions along major WM tracks. As an example, performance in face and scene perception was shown to correlate with the FA value in the inferior longitudinal fasciculus (ILF—the ventral stream), suggesting that the ILF can be considered as a higher‐order, visual associative WM track [Tavor et al., 2014]. In addition, several clinical studies have investigated associations between perceptual impairments and WM structural characteristics and also implicated ILF in deficits in visual processing: for example, children with visual object recognition impairment showed decreased FA in the ILF [Ortibus et al., 2012], deterioration of the left ILF increased visual memory dysfunction [Shinoura et al., 2007], intraoperative direct electro‐stimulation of the ILF in a visual agnostic patient conversely resulted in improvements of visual object recognition performance [Coello et al., 2013] and a reduced number of fibers in ILF in a prosopagnosic patient went along with behavioral deficits in face processing [Grossi et al., 2014].
Given that several studies suggest that perceptual performance in several visual tasks may be reflected in WM properties, in the present study, our goal was to investigate whether this would also hold for a cross‐modal task in which information from the visual modality would need to be transferred to the touch modality. For this, we first determined behavioral cross‐modal performance in a shape categorization task modeled after Wallraven et al. [2014]. In this task, participants first learned how to categorize a set of novel shapes in the visual domain. After successful learning, they were then tested about their categorization knowledge in the haptic domain (i.e., by touching the objects)—a task that required successful cross‐modal transfer of shape information from vision to touch. The resulting cross‐modal categorization performance was then correlated with the aforementioned WM measures that reflected the microstructural characteristics of the major WM tracks in the brain. Given the previously mentioned WM studies and functional imaging results that implicated areas of multisensory processing in both ventral and dorsal streams, our investigation focused on the occipito‐temporal (ILF) projection as the ventral shape processing WM pathway, as well as the SLFft as a WM pathway linking frontal and temporal cortices while traversing the parietal lobe. Lastly, we also included the ventral‐occipital fasciculus (VOF) in our investigation as this WM track links the ventral and dorsal pathways in the occipital lobe as recently rediscovered [Yeatman et al., 2014]. Specifically, we hypothesized that microstructural characteristics (mainly as measured by FA) in the ILF as the main WM track involved in shape processing may be able to reflect also cross‐modal shape categorization performance.
MATERIALS AND METHODS
Participants
Thirty‐eight right‐handed healthy adults (age 18–33; mean age = 23.8; standard deviation = 3.2; 19 women) without history of neurological disease or any visual, haptic or other perceptual deficits were recruited in this study. However, due to excessive movement artifacts during dMRI acquisition, one participant was excluded from the analysis. All participants were provided with informed written consent, and the experiment received prior approval by the Korea University Institutional Review Board (1040548‐KU‐IRB‐14‐133‐A‐1).
Stimuli and Presentation
Since the behavioral task was based on categorization, we first defined a one‐dimensional, continuous stimulus space that participants learned to carve into two categories. The stimuli consisted of eight objects for visual training and seven objects for haptic testing with an additional two objects defining two exemplars (A and B) as reference prototypes for each category (Fig. 1, [Wallraven et al., 2014]). Stimuli between training and testing did not overlap, allowing us measure the generalization performance instead of pure memorization of learned shape. Objects were printed out as tangible objects (average measurements: 7 × 7 × 7cm, average weight: 97.88 g) using a 3D printer (Zprinter650, 3DSystems).
Figure 1.
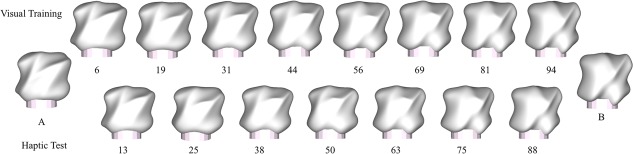
Reference objects A and B denote the representative objects of each of the two categories. The remaining objects were then vertex‐morphed linearly from A to B. The number below each object specifies the percentage of B (e.g., object 6 means that this object contains 94% of A and 6% of B). The objects in the upper row were used as stimuli for the visual training, whereas the stimuli in the lower row were used for haptic testing. Note that test objects were never shown during the training session. [Color figure can be viewed at http://wileyonlinelibrary.com]
During the experiment, the novel objects were presented in the middle of a table at which the participant and the experimenter were seated facing each other. For the visual training, participants were able to see the objects (visual angle: ∼10 degrees) at the same distance at which they were touched later. Objects were presented at random angles during both visual and haptic tasks. For the haptic experiment, a black curtain located in the middle of the table blocked the visual input, while the objects could be explored using the right hand of the participants (dominant hand) through the curtain. Participants were blindfolded during the haptic experiment.
Behavioral Experiments
The main experiment task consisted of a cross‐modal object categorization task. Participants had to learn to form two categories in the one‐dimensional shape space shown in Figure 1 based on visual training and were then tested on their category knowledge in a haptic testing task. Again, we were interested to see how well participants were able to transfer knowledge from vision to touch, and importantly how much this transfer varied across participants.
The categorization experiments of visual training started by presenting two reference objects from either category A or B (Fig. 2). Participants were asked to use these references for the later categorization judgments. Each visual reference object was presented for 6 s. This was followed by presentation of all eight training objects (see Fig. 1, upper row) in random order. Presentation time for the objects was 3 s for this visual training part. After the presentation ended, participants were asked to verbally state whether the object belongs to either category “A” or “B” (by referencing them in memory to the previously seen prototype objects). Feedback on the correctness of the response was given verbally by the experimenter immediately after the participant responded. Presentation of the two reference objects and the eight training objects constituted one block (2 reference objects + 8 objects to be categorized = 10 objects per block). This visual training part ended once participants reached the predefined training criterion of correct answers for all training objects for two consecutive blocks (i.e., 16 objects). If participants were not able to reach this criterion after 20 blocks, training also stopped since we assumed that further training was not able to improve performance.
Figure 2.
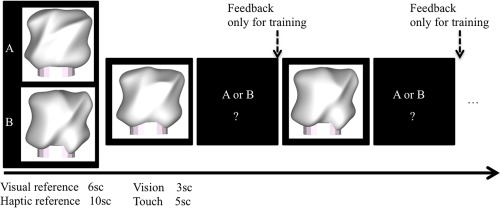
Structure of the experiments. Every block started with presenting the two reference objects one after the other (each reference was presented for 6 s in the visual training block and for 10 s in the haptic testing block). This was followed by a randomized presentation of the morphed objects (visual objects were presented for 3 s while haptic objects were presented for 6 s). For each object, participants had to report either category A or B as a response. During (visual) training, feedback was provided after the response. During (haptic) testing no feedback was given. [Color figure can be viewed at http://wileyonlinelibrary.com]
After the visual training, a short break was given, followed by the haptic test. The haptic test followed the exact same protocol as the visual training, except that participants were not able to see the objects and that no feedback was given. Again, at the start of each test block, each of the two reference objects was presented haptically for 10 s. Following this, participants had to categorize the seven objects from the test set (Fig. 1, bottom row) presented in random order. Each object was presented for 6 s to give participants ample time to explore the object haptically. The haptic testing finished after 10 blocks (i.e., 70 test objects).
Finally, all participants performed a “coding task,” one of the sub‐tests of the Korean Wechsler Adult Intelligence Scale—Fourth Edition (KWAIS‐IV, [Wechsler, 2008]). This task required them to draw a symbol corresponding (Fig. 3) to a set of digits as quickly and as accurately as possible. The task started with a brief explanation and several practice trials, followed by the actual task right after (Fig. 3). The number of correctly written symbols in the blanks that could be filled within a period of 2 min was counted to measure performance. According to the KWAIS manual, this task is designed to test visuo‐motor control as well as visual imagery. In addition, the coding task has been shown to reflect general information processing capacity [Royer, 1971] as well as visual processing time, psychomotor speed, visuo‐motor coordination and short‐term visual memory [Crowe et al., 1999]. Accordingly, we chose this task as a supportive test for comparison, assuming that our categorization entailed both motor coordination (exploring the shape) as well as potential visual imagery (see discussion by [Lacey et al., 2010] on the use of visual imagery during haptic object processing).
Figure 3.
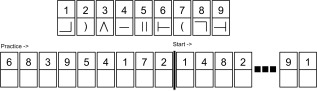
Structure of the coding task. Stimuli consisted of an array of digit‐symbol pairs (nine simple shapes each paired with a single digit, one through nine). Stimuli were shown all the time above the blanks, which participants were required to correctly fill in within two minutes. A short practice session was provided, followed by the real task according to the experimental specifications in the KWAIS‐IV manual.
MRI Acquisition
MRI data were acquired a few weeks before the behavioral experiments on a SIEMENS Trio 3T scanner (Siemens Medical Systems, Erlangen, Germany) with a 32‐channel SENSE head‐coil (Brain‐imaging‐center, Korea University, Seoul, South Korea). Structural MRI images of all participants were collected using a T1‐weighted sagittal high‐resolution MPRAGE‐sequence (repeat time (TR)=2250 ms, echo time (TE)=3.65 ms, flip angle (FA)=9°, voxel size = 1 × 1 × 1 mm, 192 axial slices). Whole brain diffusion‐weighted volumes were acquired using a diffusion‐weighted spin‐echo echo‐planar‐imaging (DWI‐EPI) pulse sequence [(TR)=6400 ms, echo time (TE)=84 ms, b = 1000 s/mm2, with 64 diffusion gradient orientations in addition to one non‐weighted b0 image, 52 slices, voxel size = 2.2 × 2.2 × 2 mm].
Image Processing
Before the processing, all images were visually inspected for artifacts or corruption possibly induced by head movement during the scanning. The data of one participant had to be removed due to excessive head motion artifacts so that further analysis of diffusion and behavioral data were made for a total of 37 participants. Diffusion‐weighted data were analyzed within the framework for tractography recently described by Girard et al. [2014] that will be briefly described below [Girard et al., 2014]. Preprocessing of the diffusion data used a combination of tools from the FMRIB software library (FSL [Jenkinson et al., 2012], MRtrix [Tournier et al., 2012], http://www.nitrc.org/projects/mrtrix) and Dipy ([Garyfallidis et al., 2014], http://nipy.org/dipy) software packages. If not otherwise specified, all methods were used with default parameters.
First, diffusion datasets were corrected for movement and eddy‐current distortions using FSL, and the original gradient table was rotated accordingly [Leemans and Jones, 2009]. Even though the eddy‐current correction aligns all volumes in the reference space (given by the non‐weighted b0 image), the log‐files from the process were further analyzed to obtain the three translations and three rotations of each participant to be used as nuisance covariates for later analysis ([Yendiki et al., 2014], see statistical analysis part). Next, skull‐removal was done using FSL/BET to improve co‐registration, followed by upsampling the data to 1mm‐isotropic resolution. All diffusion data were denoised by automatically estimating the standard deviation of the noise, followed by nonlocal means filtering using standard denoising methods from Dipy. Lastly, fitting the standard diffusion tensor model using Dipy yielded the microstructural characteristics such as FA, radial diffusivity (RD) and AD that were later used for investigating characteristics of WM tracks. Independently, using the thresholded FA value (FA > 0.7), the single fiber response function was estimated as the input of a spherical deconvolution with spherical harmonic order 8 to yield the fibers orientation distribution function (fODF) at every voxel [Descoteaux et al., 2009]. Finally, each individual whole‐brain tractogram was computed using a streamline deterministic tractography method on the field of fODF with multiple seeds (20 seeds/voxel) and default parameters (step size 0.2 mm, min/max streamline length 20/250, see details in Girard et al. [2014]). Note that all processing for each participant took place in their own diffusion space obtained by registering the T1 image to each diffusion space a combination of linear (FLIRT) and nonlinear transformation (ANTs [Avants et al., 2011]).
Tracts of Interest Extraction
The tracts of interest were visualized and extracted using TrackVis [Wang et al., 2007; Zhang et al., 2010] and White Matter Query Language (WMQL) [Wassermann et al., 2013]. We used the JHU‐DTI‐MNI atlas [Oishi et al., 2009] as a region‐of‐interest template after its deformation in individual native spaces using the FLIRT and ANTS transformations. Streamlines belonging to the ILF and the SLFft were extracted following their multiple region‐of‐interest definitions [Wang et al., 2007; Zhang et al., 2010]. Streamlines depicting the VOF were extracted following its anatomical definition given in Yeatman et al. [2014]. Finally, the streamlines extracted for each tract of interest were used as a mask to compute the diffusion microstructural metrics (mean FA, mean RD and mean AD) using the statistics tool in TrackVis.
Analysis
Analysis of behavioral experiments
We first determined the average number of blocks participants needed for reaching criterion. Importantly, as a measurement of cross‐modal performance, haptic accuracy was calculated for each participant by determining the correct answers for the two categories in the test block (note that this includes data from only 63 trials out of 70, since the middle object (object “50,” see Fig. 1) belongs to both category A or B in our design).
The performance in the coding task was measured by counting the number of correctly written symbols achieved within two minutes, followed by transforming the raw score to an age‐scaled score using the KWAIS‐IV manual.
Statistical analysis
Task performance measures (number of visual training blocks, haptic accuracy achieved in the testing and performance in the coding task) were first checked for normality using the Shapiro–Wilk test. Next, performance measures were correlated with all three WM microstructure metrics (mean FA, mean RD and mean AD) of the three tracts of interest in both left and right hemispheres using partial correlation analysis.
Individual age, total intracranial volume (TIV) and motion index were included as nuisance variables in the partial correlation to control for possible confounds. TIV was calculated using the SPM voxel‐based morphometry (VBM8) toolbox. For the motion index, we followed Yendiki et al. [2014], calculating the volume‐by‐volume translations and rotations from the affine pre‐processing step (for this, the translations and rotations were first de‐trended by subtracting the median and normalized by the inter‐quartile range, [Yendiki et al., 2014]). Since several tracts of interest were tested, significance of correlations of the partial correlation test was assessed using Bonferroni‐corrected thresholds. In order to better characterize the three scalar values measuring the WM microstructural characteristics (i.e., FA, AD and RD) and their association with cross‐modal categorization performance, we also conducted a correlation analysis of the three WM measures to check for interdependencies.
Finally, to supplement our analysis of the partial correlation, we additionally selected the 10 best‐ and the 10 weakest‐performing participants so as to yield a high and a low performer group (HG and LG). We then conducted independent two‐sample t‐tests to examine potential microstructural differences for the same measures and WM tracks between these two groups.
All statistical analyses were performed using MATLAB (R2013a, The Mathworks, Natick, MA) built‐in functions and JMP software (SAS, Cary, version 9.0). When calculated correlations reach statistical significance, the results are given both as r and r 2 (i.e., proportion of variance explained) and can be cautiously interpreted according to Cohen's recommendations on effect size [Cohen, 1992] with small effect sizes for 0.1< |r| < 0.3, medium effect sizes for 0.3 <= |r| < 0.5 and large effect sizes for |r| >=0.5.
RESULTS
Visual Training
Participants on average needed 10.4 (SD = 5.3) blocks to finish the visual training—this is consistent with the data from Wallraven et al. [2014, not reported] in which participants needed 8.5 blocks (SD = 5.9). Only 3 out of 37 participants were not able to finish within 20 blocks—during the final blocks, however, performance for these participants hovered around 92%, showing that they made only one or two errors during last two blocks (16 objects). We assume therefore that also these participants acquired knowledge about the categories. Results below are hence reported for all 37 participants. Since the distribution had a marked asymmetry, the Shapiro–Wilk test rejected the null‐hypothesis of a normal distribution (W = 0.93, P = 0.02).
Haptic Categorization Task
Average haptic accuracy was 80.5% (SD = 12.4%) ‐ again, this average performance is consistent with a re‐analysis from data of Wallraven et al. [2014, not reported] in which participants achieved 84.5% (SD = 12.9%). Additionally, accuracy scores were normally distributed (W = 0.94, P > 0.05). Importantly for our study, however, the results show that there is considerable individual variability in haptic performance after visual training (range 51. 7–98.3%, SD = 12.4%). Thus, effects of visual training seemed to be different across participants when transferring information from vision to touch. The full histogram for all 37 participants is shown in Figure 4. The number of visual blocks that was needed to achieve criterion did not correlate with haptic accuracy (r = 0.01, P = 0.96), suggesting that fast visual learners were not necessarily better at haptic recognition.
Figure 4.
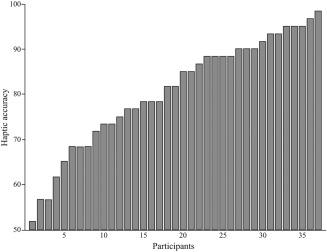
Histogram of accuracy in the haptic task for all 37 participants sorted from low to high performance, showing clear individual variance.
Coding Task
We found a mean age‐scaled score of 10.5 (SD = 2.7, on a scale of 1–19). The average value was close to the age‐scaled norm value of 10 and the scores conformed to a normal distribution (W = 0.96, P > 0.05). The range of scores was from 4 to 18, indicating considerable individual variance also for this task. Correlations of coding task performance did not reach significance with number of training blocks needed (r = −0.26, P = 0.11) but did so with haptic categorization accuracy (r = 0.40, P = 0.02; r 2 = 0.16) with medium effect size.
Task Performance Correlation with Microstructural Metrics of the Tracts of Interest
The bilateral IFL, SLFft and VOF were extracted in all subjects. Figure 5 shows an example of left ILF, SLFft and VOF extracted in a representative subject. Table 1 shows the average values for the FA, AD and RD measures for each left and right tracts of interest.
Figure 5.
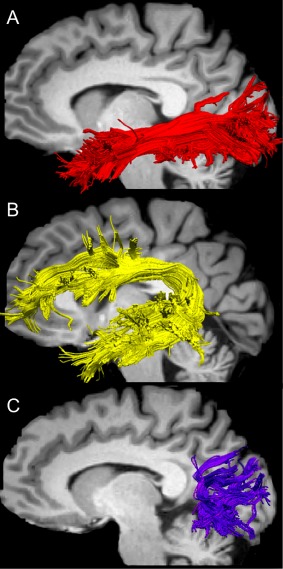
Example of left ILF, SLFft and VOF extracted in a representative subject. [Color figure can be viewed at http://wileyonlinelibrary.com]
Table 1.
Mean and standard deviation of the mean FA, AD and RD values extracted for the tracts of interest (N =37)
| FA | AD | RD | |
|---|---|---|---|
| ILF_L | 0.38 ± 0.02 | 0.0011 ± 0.00004 | 0.00060 ± 0.00002 |
| ILF_R | 0.37 ± 0.03 | 0.0011 ± 0.00004 | 0.00061 ± 0.00003 |
| SLFft _L | 0.41 ± 0.02 | 0.0011 ± 0.00003 | 0.00058 ± 0.00002 |
| SLFft _R | 0.39 ± 0.02 | 0.0011 ± 0.00003 | 0.00057 ± 0.00002 |
| VOF_L | 0.32 ± 0.02 | 0.0010 ± 0.00004 | 0.00062 ± 0.00002 |
| VOF_R | 0.34 ± 0.02 | 0.0011 ± 0.00003 | 0.00063 ± 0.00002 |
To test whether individual variability in the performance measures correlated with the variability in the microstructural measures of the bilateral ILF, SLFft and VOF, we performed correlations between each tract of interest measures and either the number of training blocks or the haptic accuracy or the coding performance. We first observed that mean FA of left VOF and left SLFft were correlated negatively with the number of training blocks (VOF, r = −0.41, r 2 = 0.17; SLFft, r = −0.45, r 2 = 0.20), demonstrating that fast visual learners showed a higher of FA value in left VOF and left SLFft (Fig. 6A). Accuracy in the haptic object shape categorization task was significantly correlated negatively with the mean FA of left ILF (r = −0.42, r 2 = 0.18) and positively with the mean AD of left SLFft (r = 0.42, r 2 = 0.18) (Fig. 6B). The age‐scaled score in the coding task showed similar trends to that of haptic accuracy (Fig. 6C): coding task performance was correlated negatively with mean FA of bilateral ILF (left r = −0.52, r 2 = 0.27; right r = −0.44, r 2 = 0.19) and positively with mean AD of bilateral SLFft (left r = 0.42, r 2 = 0.17; right r = 0.41, r 2 = 0.17). No other significant correlations were found with the performance measures. Overall, following Cohen's recommendations the effect sizes of correlations were medium with correlation of coding performance with FA in left ILF passing just above the large effect size threshold. Table 2 shows all correlations between microstructural and performance measures.
Figure 6.
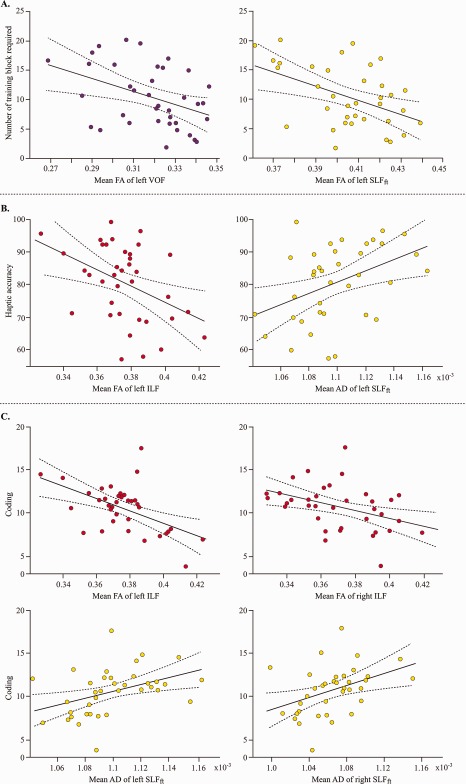
Scatter plots for the significant correlations between performance measures and the WM microstructural metrics of the tracts of interest. [Color figure can be viewed at http://wileyonlinelibrary.com]
Table 2.
Correlation values for each tract of interest and measured using partial Pearson correlation analysis
| Training block | Haptic accuracy | Coding | ||
|---|---|---|---|---|
| FA | 0.066 | −0.419* | −0.522* | |
| ILF_L | AD | 0.223 | −0.404 | −0.257 |
| RD | 0.130 | 0.174 | 0.361 | |
| FA | −0.024 | −0.216 | −0.438* | |
| ILF_R | AD | 0.075 | −0.273 | −0.375 |
| RD | 0.128 | 0.008 | 0.233 | |
| FA | −0.451* | 0.171 | 0.258 | |
| SLFft_L | AD | −0.257 | 0.421* | 0.415* |
| RD | 0.308 | 0.044 | −0.066 | |
| FA | −0.279 | 0.191 | 0.323 | |
| SLFft _R | AD | −0.105 | 0.213 | 0.408* |
| RD | 0.242 | −0.046 | −0.048 | |
| FA | −0.413* | 0.171 | −0.088 | |
| VOF_L | AD | −0.202 | 0.227 | 0.271 |
| RD | 0.222 | 0.017 | 0.353 | |
| FA | −0.216 | 0.208 | −0.101 | |
| VOF_R | AD | −0.214 | 0.116 | 0.060 |
| RD | 0.120 | −0.130 | 0.202 |
Tests were corrected for multiple comparisons using Bonferroni correction.
* signifies P‐value below 0.05 after the correction.
To increase the contrast in our analysis, we next selected the 10 best‐perfoming (HG, haptic accuracy > 89%) and the 10 weakest‐performing (LG, haptic accuracy < 74%) participants from our sample. Independent two‐sample t‐tests were used to compare the two groups in terms of their microstructural characteristics for left ILF and left SLFft. In line with previous results, we found lower FA in left ILF (t(18)=‐2.3, P = 0.03) for HG (M = 0.37, SD = 0.02) compared to LG (M = 0.39, SD = 0.02). Additionally, AD in the left SLFft was higher (t(18)=2.6, P = 0.02) for HG (M = 0.0011088, SD = 3.125e‐05) compared to LG (M= 0.0010851, SD = 2.017e‐05). No other results were significant.
Taken together, our results show that lower FA in left ILF as well as higher AD in left SLFft are associated with visuo‐haptic performance.
Correlation within the Microstructural Metrics of the Tracts of Interest
Given that previous results have shown that the three microstructural measures are related [Pierpaoli and Basser, 1996], we also provide intermeasure correlations to more fully characterize our results. As expected, we found significant correlations for all tracks of interest‐specifically, high FA was associated with both high AD and low RD in ILF, VOF and SLFft (see Table 3).
Table 3.
Correlation values among the microstructural measures of the tract of interest using partial Pearson correlation analysis
| AD | RD | ||
|---|---|---|---|
| ILF_L | FA | 0.58* | −0.67* |
| SLFft_L | FA | 0.4 | −0.83* |
| VOF_L | FA | 0.47* | −0.58* |
| ILF_R | FA | 0.62* | −0.77* |
| SLFft_R | FA | 0.56* | −0.62* |
| VOF_R | FA | 0.46* | −0.72* |
Tests were corrected for multiple comparisons using Bonferroni correction (* signifies P‐value below 0.05 after the correction).
DISCUSSION
Our behavioral results confirm those of previous studies [Cooke et al., 2007; Gaißert et al., 2010; Gaißert and Wallraven, 2012; Gaißert et al., 2011; Wallraven et al., 2014], showing that visually‐ trained object shape knowledge clearly transfers to the haptic domain. Indeed, all participants showed above‐chance performance in the haptic test.
More importantly for the goal of the present study, considerable individual variability was observed in the cross‐modal transfer performance. We next explored the potential correlates of this variation in cross‐modal performance for several WM microstructural characteristics along the major WM tracks known to be involved in either visual or visuo‐motor processing. We hypothesized that the composition of the fibers system of the relevant WM tracks may reflect this variation of perceptual ability, which would then allow us to delineate multisensory shape processing WM pathways in the human brain. Using a robust diffusion‐weighted tractography pipeline to extract tracts of interest, our results indeed showed correlations of cross‐modal performance measures with mean FA of the ILF and with mean AD of the SLFft.
A correlation between a metric derived from the diffusion‐weighted signal and a behavioral measure is considered as a useful outcome if such a correlation is robust and reliable [Jones et al., 2013] and is corrected for potential nuisance covariates (in our case, participants' age, motion and brain size). Diffusion‐weighted scalar measures (FA, RD, AD) are generally interpreted as measures of the integrity of the WM microstructure. Therefore, any change or difference in these measures may indicate a damage of the WM microstructure. Within a healthy group, however, better performance is unlikely to be associated with structural damage, decline or degeneration. Variability in diffusion‐weighted scalar values in correlation with behavioral measures may be attributed to—among others—differences in axonal density, axonal caliber, degree of myelination, as well as changes in some aspect of connectivity without being able to pinpoint the exact cause [Jones et al., 2013]. Whether positive or negative, the correlations with behavioral measures that we observed can be interpreted as reflecting a difference in the anatomical complexity of the tracts of interest. Note also that for each tract of interest, the more FA increases, the more AD increased and RD decreased (Table 3). In line with the pioneering study of [Pierpaoli and Basser, 1996], our result confirms the interdependency of these mathematically‐related measurements of WM microstructure in healthy subjects. We also note that within the constraints of our sample size, effect sizes of the correlations with white‐matter characteristics were medium to large, testifying to the relative robustness of our results.
Specifically, we first observed that the visual training correlated negatively with the mean FA values of left VOF and left SLFft. In other words, the less number of training blocks required for the participants to learn the shape of the object, that is, the fast visual learners, the highest mean FA values with both left VOF and SLFft. In the case of VOF, previous studies showed that dorsal and ventral visual pathways in the occipital lobe communicate through the VOF [Takemura et al., 2015; Yeatman et al., 2014], which may facilitate the visual training performance in our study. In the case of SLFft, while most of studies provided evidence that SLFft is relevant for visuo‐spatial attention, Mayer and Vuong demonstrated that FA values of voxels within the SLFft (in their case, between posterior parietal and inferior frontal lobe obtained by functionally defined ROIs) were correlated with reaction time of the performance during the feature‐attention task, extending the role of SLFft from spatial attention to feature attention in object processing [Mayer and Vuong, 2014]. However, in their study, right SLFft was associated with attentional processes of the object feature, while our results implicated left SLFft. We conjecture that the discrepancy occurred due to different characteristics of the task between the studies. For example, while the study of Mayer and Vuong required an attentional shift between different features of the object properties such as shape, motion and color, our task required a one‐dimensional focus on shape itself. However, further studies should be conducted to investigate how hemispheric lateralization affects visual object shape training in both VOF and SLFft.
We also observed a negative correlation between the haptic shape categorization performance and the mean FA value in left ILF and positive correlation with mean AD value in left SLFft, meaning that better performance went along with a lower mean FA value in ILF and a higher mean AD value in SLFft in the left hemisphere. So far, investigations of relevant WM tracts related to haptic object shape processing have not been yet conducted.
Regarding the ILF, previous diffusion‐related studies have shown that the ILF microstructure is associated with performance in visual object, face and scene recognition [Gomez et al., 2015; Ortibus et al., 2012; Tavor et al., 2014]. Our results provide evidence that the mean FA of the left ILF is associated with haptic shape categorization performance based on prior visual training and hence with cross‐modal transfer of haptic information. More interestingly, the involvement of the left ILF is strongly consistent with our previous multivoxel pattern analysis study showing that haptic shape processing with visual prior exposure recruited a large part of the left ventral stream from early visual cortex to the temporal lobe to convey fine details of object shape information and suggesting dominant hand‐based processing of haptic information [Lee Masson et al., 2015]. Hence, individual variation of haptic shape processing acquired from vision may in part be due to differences in microstructural characteristics of the ILF. Similar negative correlation was also found in a previous study that revealed associations between better face and scene recognition ability and a lower FA value in ILF [Tavor et al., 2014]. This later explained that the lower FA value could be due either to larger axon diameters or to increases in local connectivity in the presence of large crossing fibers within the voxel. In their study, lower FA went along with higher values in RD, suggesting that lower FA may signify larger axon diameters, inducing better performance. However, we did not observed any significant correlations between the mean RD of ILF and haptic categorization task performance even though low FA was associated with both low AD and high RD.; following this, we conjecture that the present negative correlation of FA with cross‐modal transfer performance may be due to WM bundle complexity resulting from a larger number of crossing fibers in the ILF. Since FA encodes the directional preference within a voxel, a large number of crossing fibers within a voxel may actually result in lower FA [Pierpaoli et al., 2001].
We also found that SLFft correlates with haptic shape categorization performance. Previous studies have shown this tract to carry information related to a variety of cognitive functions, including higher‐level visual processing such as visuo‐spatial attention: impairment of visuo‐spatial processing in older adults group without dementia, for example, correlated with changes in microstructural characteristics in SLFft [Kantarci et al., 2011]. Similarly, using functional data from a pantomime and motor imitation task, Vry et al., provided evidence that SLFft performs direct sensory‐motor interaction [Vry et al., 2015]. In the context of the present study, SLFft may be relevant to haptic processing since our task requires hand movements to explore the objects, hence requiring the use of an adequate exploration strategy to properly extract shape properties. Indeed, we find that the mean AD of the left SLFft exhibits a positive correlation with haptic performance.
Overall, our results show that cross‐modal categorization is reflected in white‐matter characteristics. Although this may reflect more general patterns of haptic and cross‐modal expertise in our participants, several previous studies have provided evidence that short‐term training also may be able to influence microstructural characteristics. This has been observed after visuo‐motor training (juggling) in the parieto‐occipital sulcus [Scholz et al., 2009], after memory training in tracks from frontal lobe to other region [Engvig et al., 2012], after meditation training in tracks from the anterior cingulate cortex to other regions [Tang et al., 2012], and following a visuo‐auditory working memory training in SLF, ILF and the corpus callosum [Salminen et al., 2016]. Since our imaging data was gathered before the behavioral data, however, the resulting correlations cannot be directly traced to such factors. The degree to which the short‐term visual training may also affect the present cross‐modal results remains an open question that could be addressed using additional postexperiment scans.
The present study solely investigated the performance with the dominant hand (right hand), which may explain why our findings of ILF and SLFft solely lie in the left hemisphere (see Lee Masson et al. [2015] for functional data on hemispheric contra‐lateralization for haptic shape processing). Based on the results of a previous study that uncovered a direct, causal relationship between the motor cortex in the contralateral hemisphere and the dexterity of the hands [Boggio et al., 2006], we conjecture that performance with a nondominant hand (i.e., the left hand) would be associated with similar white matter tracks located in the contralateral right hemisphere. However, cross‐modal performance itself may less effective due to relatively decreased dexterity of the nondominant hand compare to the dominant one [Özcan et al., 2004]. It would be interesting to conduct further experiments in which shape transfer is tested with the non‐dominant hand to investigate the lateralization of our findings.
In addition to the main haptic categorization task, we also measured individual performance on a coding task from the Korean version of the Wechsler intelligence scale (KWAIS‐IV). Since this task requires visuo‐motor dexterity and fast processing speed, resemblances between this task and the main cross‐modal experimental task may exist. Indeed, the two tasks correlate behaviorally, meaning that participants who were better at coding also exhibited better performance in haptic categorization. Another link between the two tasks is that participants in the haptic testing may have retrieved object knowledge via visual imagery [Lacey et al., 2010] and then connected this to motor components related to exploration strategies [Lederman and Klatzky, 1987]. In particular, since our experimental design provided visual training prior to the actual haptic task, one may assume this visual component to be strongly involved—additional support for this hypothesis comes from our previous fMRI study in which we found that participants who had learned about novel objects visually activated a larger part of the visual, ventral stream than those who had learned about the objects haptically first [Lee Masson et al., 2015]. Accordingly, we also observed that FA of the bilateral ILF was negatively associated with performance in the coding task, showing that our results are consistent within ILF regardless of the type of the task, as long as the task requires the visual imagery component. A previous study also showed involvement of ILF in several visuo‐motor tasks (such as a grooved pegboard task, a letter cancelation task and a digit‐symbol coding task) within various age groups, claiming that age‐related disruption of the ILF predicted performance [Voineskos et al., 2012]. In addition, performance in a similar coding task implicated SLFft in a recent investigation comparing a patient group with autism spectrum disorder and a healthy control group, also finding that the higher AD value in the SLFft reflected better task performance [Lazar et al., 2014]. Our results confirm this relationship between AD of bilateral SLFft and visuo‐motor performance using the large variability observed in the coding task.
We also investigated VOF as a candidate WM bundle reflecting visuo‐haptic performance. However, we did not find any association between haptic performance and WM properties of VOF. Although it has been claimed that VOF might be responsible for cross talk between ventral and dorsal parts of occipital lobe [Yeatman et al., 2014], we conjecture that for our task occipito‐parietal connections would provide a better link between motor/sensory input and visual processing, instead of the occipito‐occipital connections served by the VOF.
Given that previous studies have illustrated haptic exploration strategies as specialized patterns of exploratory procedures [Lederman and Klatzky, 1987, 2009], the haptic accuracy measure used in the present study may also to some degree reflect participants' ability to use and develop proper motor strategies (such as enclosure and contour following) to efficiently explore the objects' shape. In a similar vein, our correlations in SLFft with haptic performance may reflect motor fluency, given the previous findings on motor deficits reflected in left SLFft [Langevin et al., 2014]. Although the behavioral results of the related coding task only weakly correlate with haptic accuracy, additional measures of motor fluency and, more importantly, a full analysis of the exploratory movements of the participants during the task, will be necessary to determine the degree to which such motor/haptic processes contribute to task performance in addition to visual imagery processes.
Lastly, although the present study presents the first data on anatomical correlates of cross‐modal task performance, further conditions, such as haptic‐to‐vision transfer and within‐modal conditions are yet to be investigated in more detail. Based on our previous imaging study [Lee Masson et al., 2015] in which we found largely symmetric results for vision‐to‐haptic and haptic‐to‐vision shape processing conditions [see also Wallraven et al., 2014 for matching behavioral results], we conjecture that ILF correlates will also be found for haptic‐to‐vision transfer, which would provide further evidence for its role as a cross‐modal shape processing pathway.
CONCLUSION
The current findings demonstrate for the first time that individual performance differences in a visuo‐haptic cross‐modal shape categorization task are reflected in microstructural properties of white matter bundles ILF (a ventral white matter pathway) and SLFft (a dorsal white matter pathway), suggesting their importance as multisensory pathways. The present results are highly consistent with our previous functional imaging study in which we found that regions along ILF encoded detailed haptic shape knowledge after participants had received prior visual exposure to the objects. Both of our findings together may point to the involvement of visual imagery in haptic shape processing, which warrants further studies. Furthermore, we also found similarities between haptic performance and digit coding task performance with ILF and SLFft involved in predicting performance in a digit coding task—again, the vivid recall of the visually learned symbols together with coupled planned hand movements may explain these findings. To fully understand and explain the whether ILF and SLFft reflect visual imagery processes, further unimodal and haptic‐visual cross‐modal conditions will need to be investigated in future studies.
ACKNOWLEDGMENT
We gratefully acknowledge the help of Pierre‐Yves Hervé and Janice Hau for DWI analysis.
REFERENCES
- Amedi A, Malach R, Hendler T, Peled S, Zohary E (2001): Visuo‐haptic object‐related activation in the ventral visual pathway. Nat Neurosci 4:324–330. [DOI] [PubMed] [Google Scholar]
- Avants BB, Tustison NJ, Wu J, Cook PA, Gee JC (2011): An open source multivariate framework for n‐tissue segmentation with evaluation on public data. Neuroinformatics 9:381–400. [DOI] [PMC free article] [PubMed] [Google Scholar]
- Barazany D, Basser PJ, Assaf Y (2009): In vivo measurement of axon diameter distribution in the corpus callosum of rat brain. Brain 132:1210–1220. [DOI] [PMC free article] [PubMed] [Google Scholar]
- Beaulieu C (2002): The basis of anisotropic water diffusion in the nervous system—A technical review. NMR Biomed 15:435–455. [DOI] [PubMed] [Google Scholar]
- Beaulieu C, Allen PS (1994): Determinants of anisotropic water diffusion in nerves. Magn Reson Med 31:394–400. [DOI] [PubMed] [Google Scholar]
- Boggio PS, Castro LO, Savagim EA, Braite R, Cruz VC, Rocha RR, Rigonatti SP, Silva MT, Fregni F (2006): Enhancement of non‐dominant hand motor function by anodal transcranial direct current stimulation. Neurosci Lett 404:232–236. [DOI] [PubMed] [Google Scholar]
- Bosch B, Arenaza‐Urquijo EM, Rami L, Sala‐Llonch R, Junqué C, Solé‐Padullés C, Peña‐Gómez C, Bargalló N, Molinuevo JL, Bartrés‐Faz D (2012): Multiple DTI index analysis in normal aging, amnestic MCI and AD. Relationship with neuropsychological performance. Neurobiol Aging 33:61–74. [DOI] [PubMed] [Google Scholar]
- Coello AF, Duvaux S, De Benedictis A, Matsuda R, Duffau H (2013): Involvement of the right inferior longitudinal fascicle in visual hemiagnosia: A brain stimulation mapping study: Case report. J Neurosurg 118:202–205. [DOI] [PubMed] [Google Scholar]
- Cohen J (1992): A power primer. Psychol Bull 112:155–159. [DOI] [PubMed] [Google Scholar]
- Cooke T, Jakel F, Wallraven C, Bülthoff HH (2007): Multimodal similarity and categorization of novel, three‐dimensional objects. Neuropsychologia 45:484–495. [DOI] [PubMed] [Google Scholar]
- Crowe SF, Benedict T, Enrico J, Mancuso N, Matthews C, Wallace J (1999): Cognitive determinants of performance on the digit symbol‐coding test, and the symbol search test of the wais‐III, and the symbol digit modalities test: An analysis in a healthy sample. Australian Psychol 34:204–210. [Google Scholar]
- Descoteaux M, Deriche R, Knösche TR, Anwander A (2009): Deterministic and probabilistic tractography based on complex fibre orientation distributions. IEEE Trans Med Imaging 28:269–286. [DOI] [PubMed] [Google Scholar]
- Engvig A, Fjell AM, Westlye LT, Moberget T, Sundseth Ø, Larsen VA, Walhovd KB (2012): Memory training impacts short‐term changes in aging white matter: A longitudinal diffusion tensor imaging study. Hum Brain Mapp 33:2390–2406. [DOI] [PMC free article] [PubMed] [Google Scholar]
- Gaißert N, Wallraven C, Bülthoff HH (2010): Visual and haptic perceptual spaces show high similarity in humans. J Vis 10:2. [DOI] [PubMed] [Google Scholar]
- Gaißert N, Wallraven C (2012): Categorizing natural objects: A comparison of the visual and the haptic modalities. Exp Brain Res 216:123–134. [DOI] [PubMed] [Google Scholar]
- Gaißert N, Bülthoff HH, Wallraven C (2011): Similarity and categorization: From vision to touch. Acta Psychol 138:219–230. [DOI] [PubMed] [Google Scholar]
- Garyfallidis E, Brett M, Amirbekian B, Rokem A, Van Der Walt S, Descoteaux M, Nimmo‐Smith I, Contributors D (2014): Dipy, a library for the analysis of diffusion MRI data. Front Neuroinform 8:8. [DOI] [PMC free article] [PubMed] [Google Scholar]
- Girard G, Whittingstall K, Deriche R, Descoteaux M (2014): Towards quantitative connectivity analysis: Reducing tractography biases. Neuroimage 98:266–278. [DOI] [PubMed] [Google Scholar]
- Gomez J, Pestilli F, Witthoft N, Golarai G, Liberman A, Poltoratski S, Yoon J, Grill‐Spector K (2015): Functionally defined white matter reveals segregated pathways in human ventral temporal cortex associated with category‐specific processing. Neuron 85:216–227. [DOI] [PMC free article] [PubMed] [Google Scholar]
- Grossi D, Soricelli A, Ponari M, Salvatore E, Quarantelli M, Prinster A, Trojano L (2014): Structural connectivity in a single case of progressive prosopagnosia: The role of the right inferior longitudinal fasciculus. Cortex 56:111–120. [DOI] [PubMed] [Google Scholar]
- Horsfield MA, Jones DK (2002): Applications of diffusion‐weighted and diffusion tensor MRI to white matter diseases–a review. NMR Biomed 15:570–577. [DOI] [PubMed] [Google Scholar]
- Jenkinson M, Beckmann CF, Behrens TEJ, Woolrich MW, Smith SM (2012): FSL. NeuroImage 62:782–790. [DOI] [PubMed] [Google Scholar]
- Jeurissen B, Leemans A, Tournier JD, Jones DK, Sijbers J (2013): Investigating the prevalence of complex fiber configurations in white matter tissue with diffusion magnetic resonance imaging. Hum Brain Mapp 34:2747–2766. [DOI] [PMC free article] [PubMed] [Google Scholar]
- Jones DK, Knösche TR, Turner R (2013): White matter integrity, fiber count, and other fallacies: The do's and don'ts of diffusion MRI. Neuroimage 73:239–254. [DOI] [PubMed] [Google Scholar]
- Kantarci K, Senjem M, Avula R, Zhang B, Samikoglu A, Weigand S, Przybelski S, Edmonson H, Vemuri P, Knopman D (2011): Diffusion tensor imaging and cognitive function in older adults with no dementia. Neurology 77:26–34. [DOI] [PMC free article] [PubMed] [Google Scholar]
- Lacey S, Tal N, Amedi A, Sathian K (2009): A putative model of multisensory object representation. Brain Topogr 21:269–274. [DOI] [PMC free article] [PubMed] [Google Scholar]
- Lacey S, Flueckiger P, Stilla R, Lava M, Sathian K (2010): Object familiarity modulates the relationship between visual object imagery and haptic shape perception. Neuroimage 49:1977–1990. [DOI] [PMC free article] [PubMed] [Google Scholar]
- Langevin LM, MacMaster FP, Crawford S, Lebel C, Dewey D (2014): Common white matter microstructure alterations in pediatric motor and attention disorders. J Pediatrics 164:1157–1164. e1. [DOI] [PubMed] [Google Scholar]
- Lazar M, Miles LM, Babb JS, Donaldson JB (2014): Axonal deficits in young adults with High Functioning Autism and their impact on processing speed. NeuroImage Clin 4:417–425. [DOI] [PMC free article] [PubMed] [Google Scholar]
- Le Bihan D, Mangin JF, Poupon C, Clark CA, Pappata S, Molko N, Chabriat H (2001): Diffusion tensor imaging: Concepts and applications. J Magn Reson Imaging 13:534–546. [DOI] [PubMed] [Google Scholar]
- Lederman SJ, Klatzky RL (1987): Hand movements: A window into haptic object recognition. Cogn Psychol 19:342–368. [DOI] [PubMed] [Google Scholar]
- Lederman SJ, Klatzky RL (2009): Haptic perception: A tutorial. Atten Percept Psychophys 71:1439–1459. [DOI] [PubMed] [Google Scholar]
- Lee Masson H, Bulthé J, Op de Beeck HP, Wallraven C (2015): Visual and haptic shape processing in the human brain: unisensory processing, multisensory convergence, and top‐down influences. Cereb Cortex 26:3402–3412. [DOI] [PubMed] [Google Scholar]
- Leemans A, Jones DK (2009): The B‐matrix must be rotated when correcting for subject motion in DTI data. Magn Reson Med 61:1336–1349. [DOI] [PubMed] [Google Scholar]
- Mayer K, Vuong Q (2014): TBSS and probabilistic tractography reveal white matter connections for attention to object features. Brain Struct Funct 219:2159–2171. [DOI] [PubMed] [Google Scholar]
- Newell FN, Ernst MO, Tjan BS, Bülthoff HH (2001): Viewpoint dependence in visual and haptic object recognition. Psychol Sci 12:37–42. [DOI] [PubMed] [Google Scholar]
- Norman JF, Norman HF, Clayton AM, Lianekhammy J, Zielke G (2004): The visual and haptic perception of natural object shape. Percept Psychophys 66:342–351. [DOI] [PubMed] [Google Scholar]
- Oishi K, Faria A, Jiang H, Li X, Akhter K, Zhang J, Hsu JT, Miller MI, van Zijl PCM, Albert M, Lyketsos CG, Woods R, Toga AW, Pike GB, Rosa‐Neto P, Evans A, Mazziotta J, Mori S (2009): Atlas‐based whole brain white matter analysis using large deformation diffeomorphic metric mapping: Application to normal elderly and Alzheimer's disease participants. NeuroImage 46:486–499. [DOI] [PMC free article] [PubMed] [Google Scholar]
- Ortibus E, Verhoeven J, Sunaert S, Casteels I, de Cock P, Lagae L (2012): Integrity of the inferior longitudinal fasciculus and impaired object recognition in children: A diffusion tensor imaging study. Dev Med Child Neurol 54:38–43. [DOI] [PubMed] [Google Scholar]
- Özcan A, Tulum Z, Pınar L, Başkurt F (2004): Comparison of pressure pain threshold, grip strength, dexterity and touch pressure of dominant and non‐dominant hands within and between right‐and left‐handed subjects. J Korean Med Sci 19:874–878. [DOI] [PMC free article] [PubMed] [Google Scholar]
- Pierpaoli C, Basser PJ (1996): Toward a quantitative assessment of diffusion anisotropy. Magn Reson Med 36:893–906. [DOI] [PubMed] [Google Scholar]
- Pierpaoli C, Barnett A, Pajevic S, Chen R, Penix L, Virta A, Basser P (2001): Water diffusion changes in Wallerian degeneration and their dependence on white matter architecture. Neuroimage 13:1174–1185. [DOI] [PubMed] [Google Scholar]
- Royer FL (1971): Information processing of visual figures in the digit symbol substitution task. J Exp Psychol 87:335. [Google Scholar]
- Salminen T, Mårtensson J, Schubert T, Kühn S (2016): Increased integrity of white matter pathways after dual n‐back training. NeuroImage 133:244–250. [DOI] [PubMed] [Google Scholar]
- Scholz J, Klein MC, Behrens TE, Johansen‐Berg H (2009): Training induces changes in white‐matter architecture. Nat Neurosci 12:1370–1371. [DOI] [PMC free article] [PubMed] [Google Scholar]
- Shinoura N, Suzuki Y, Tsukada M, Katsuki S, Yamada R, Tabei Y, Saito K, Yagi K (2007): Impairment of inferior longitudinal fasciculus plays a role in visual memory disturbance. Neurocase 13:127–130. [DOI] [PubMed] [Google Scholar]
- Song SK, Yoshino J, Le TQ, Lin SJ, Sun SW, Cross AH, Armstrong RC (2005): Demyelination increases radial diffusivity in corpus callosum of mouse brain. Neuroimage 26:132–140. [DOI] [PubMed] [Google Scholar]
- Takemura, H. , Rokem, A. , Winawer, J. , Yeatman, J.D. , Wandell, B.A. , Pestilli, F. (2015): A major human white matter pathway between dorsal and ventral visual cortex. Cereb Cortex 26:2205–2214. [DOI] [PMC free article] [PubMed] [Google Scholar]
- Tang YY, Lu Q, Fan M, Yang Y, Posner MI (2012): Mechanisms of white matter changes induced by meditation. Proc Natl Acad Sci USA 109:10570–10574. [DOI] [PMC free article] [PubMed] [Google Scholar]
- Tavor I, Yablonski M, Mezer A, Rom S, Assaf Y, Yovel G (2014): Separate parts of occipito‐temporal white matter fibers are associated with recognition of faces and places. Neuroimage 86:123–130. [DOI] [PubMed] [Google Scholar]
- Tournier J, Calamante F, Connelly A (2012): MRtrix: Diffusion tractography in crossing fiber regions. Int J Imaging Syst Technol 22:53–66. [Google Scholar]
- Voineskos AN, Rajji TK, Lobaugh NJ, Miranda D, Shenton ME, Kennedy JL, Pollock BG, Mulsant BH (2012): Age‐related decline in white matter tract integrity and cognitive performance: A DTI tractography and structural equation modeling study. Neurobiol Aging 33:21–34. [DOI] [PMC free article] [PubMed] [Google Scholar]
- Vry MS, Tritschler LC, Hamzei F, Rijntjes M, Kaller CP, Hoeren M, Umarova R, Glauche V, Hermsdoerfer J, Goldenberg G, Hennig J, Weiller C (2015): The ventral fiber pathway for pantomime of object use. Neuroimage 106:252–263. [DOI] [PubMed] [Google Scholar]
- Wallraven C, Bülthoff HH, Waterkamp S, van Dam L, Gaißert N (2014): The eyes grasp, the hands see: Metric category knowledge transfers between vision and touch. Psychon Bull Rev 21:976–985. [DOI] [PubMed] [Google Scholar]
- Wang R, Benner T, Sorensen AG, Wedeen VJ (2007): Diffusion toolkit: A software package for diffusion imaging data processing and tractography. In Proc Intl Soc Mag Reson Med 2007 (Vol. 15, No. 3720).
- Wassermann D, Makris N, Rathi Y, Shenton M, Kikinis R, Kubicki M, Westin C‐F (2013): On Describing Human White Matter Anatomy: The White Matter Query Language Medical Image Computing and Computer‐Assisted Intervention–MICCAI 2013: Springer; pp 647–654. [DOI] [PMC free article] [PubMed] [Google Scholar]
- Wechsler D. (2008) Wechsler Adult Intelligence Scale, 4th ed. (WAIS–IV). San Antonio, TX: NCS Pearson. [Google Scholar]
- Werring DJ, Toosy AT, Clark CA, Parker GJM, Barker GJ, Miller DH, Thompson AJ (2000): Diffusion tensor imaging can detect and quantify corticospinal tract degeneration after stroke. J Neurol Neurosurg Psychiatry 69:269–272. [DOI] [PMC free article] [PubMed] [Google Scholar]
- Yeatman JD, Weiner KS, Pestilli F, Rokem A, Mezer A, Wandell BA (2014): The vertical occipital fasciculus: A century of controversy resolved by in vivo measurements. Proc Natl Acad Sci USA 111:E5214–E5223. [DOI] [PMC free article] [PubMed] [Google Scholar]
- Yendiki A, Koldewyn K, Kakunoori S, Kanwisher N, Fischl B (2014): Spurious group differences due to head motion in a diffusion MRI study. Neuroimage 88:79–90. [DOI] [PMC free article] [PubMed] [Google Scholar]
- Zhang Y, Zhang J, Oishi K, Faria AV, Jiang H, Li X, Akhter K, Rosa‐Neto P, Pike GB, Evans A, Toga AW, Woods R, Mazziotta JC, Miller MI, van Zijl PCM, Mori S (2010): Atlas‐guided tract reconstruction for automated and comprehensive examination of the white matter anatomy. NeuroImage 52:1289–1301. [DOI] [PMC free article] [PubMed] [Google Scholar]