

Abstract
Background
The combination of genetics and imaging has improved their understanding of the brain through studies of aggregate measures obtained from high‐resolution structural imaging. Voxel‐wise analyses have the potential to provide more detailed information of genetic influences on the brain. Here they report a large‐scale study of the heritability of gray matter at voxel resolution (1 × 1 × 1 mm).
Methods
Validated voxel‐based morphometry (VBM) protocols were applied to process magnetic resonance imaging data of 3,239 unrelated subjects from a population‐based study and 491 subjects from two family‐based studies. Genome‐wide genetic data was used to estimate voxel‐wise gray matter heritability of the unrelated subjects and pedigree‐structure was used to estimate heritability in families. They subsequently associated two genetic variants, known to be linked with subcortical brain volume, with most heritable voxels to determine if this would enhance their association signals.
Results
Voxels significantly heritable in both estimates mapped to subcortical structures, but also voxels in the language areas of the left hemisphere were found significantly heritable. When comparing regional patterns of heritability, family‐based estimates were higher than population‐based estimates. However, regional consistency of the heritability measures across study designs was high (Pearson's correlation coefficient = 0.73, P = 2.6 × 10⁻¹³). They further show enhancement of the association signal of two previously discovered genetic loci with subcortical volume by using only the most heritable voxels.
Conclusion
Gray matter voxel‐wise heritability can be reliably estimated with different methods. Combining heritability estimates from multiple studies is feasible to construct reliable heritability maps of gray matter voxels. Hum Brain Mapp 38:2408–2423, 2017. © 2017 Wiley Periodicals, Inc.
Keywords: brain structure heritability, genetics, magnetic resonance imaging, gray matter, family‐based study, population‐based study, voxel‐based morphometry
INTRODUCTION
The human brain shows large inter‐individual variation, which could be explained by genetic and environmental influences. Studying these influences is essential in better understanding brain structure and function. The degree to which genetics explains phenotypic variation, in other words heritability, depends on many factors: the actual genetic contribution to the trait, environmental effects, measurement error, study design and sample characteristics [Visscher et al., 2006, 2008; Yang et al., 2010]. Recently an overview was published of 50 years of worldwide heritability research in twins encompassing thousands of traits, showing heritability studies are highly informative on how large the genetic contribution to a trait is [Polderman et al., 2015]. Heritability studies could aid future genetic research to focus on particular regions of interest in the brain. For example, large scale genetic studies of brain structures with the highest heritability typically yield the most findings [Hibar et al., 2015]. When studying the multitude of measures of voxel‐based magnetic resonance imaging (MRI), limiting genetic studies to the most heritable traits could be feasible in light of multiple testing. Recent studies have focused on heritability of detailed MRI measures at a voxel level [Brouwer et al., 2010; Ganjgahi et al., 2015; Jahanshad et al., 2010, 2013; Kochunov et al., 2010, 2015, 2016]. Different study designs showed comparably high estimates for white matter tract heritability in twin pairs [Brouwer et al., 2010; Kochunov et al., 2010], sib‐pairs [Jahanshad et al., 2010] and extended pedigrees (heritability = 50%–90%) [Ganjgahi et al., 2015]. The heritability of gray matter was studied by voxel‐based morphometry (VBM) previously [Hulshoff Pol et al., 2006; Peper et al., 2009; Thompson et al., 2001], but the studies were relatively small and relatively large voxels were studied. Moreover, heritability of gray matter VBM has not been estimated in population‐based studies.
Here, we perform a large multi‐site study to estimate the voxel‐wise heritability of gray matter. We calculate pedigree‐based heritability in two family‐based studies and heritability based on genome‐wide genetic data in a large population‐based study of unrelated subjects. Using these approaches, we created two gray matter heritability maps and described which regions contain significantly heritable voxels in both designs. We furthermore estimated overall regional consistency of the heritability measures across study designs and explored if usage of our heritability maps could potentially enhance association signals of two genetic variations, previously discovered by genome‐wide association studies [Bis et al., 2012; Hibar et al., 2015; Stein et al., 2012].
METHODS
Study Subjects and Imaging Protocol
Rotterdam Study
The Rotterdam Study is a population‐based cohort study among inhabitants of a district of Rotterdam (Ommoord), The Netherlands, and aims to examine the determinants of disease and health in the elderly with a focus on neurogeriatric, cardiovascular, bone, and eye disease [Hofman et al., 2015]. In 1990–1993, 7,983 persons participated and were re‐examined every 3–4 years (RS‐I). In 2000 to 2001 the cohort was expanded by 3,011 persons who had not yet been part of the Rotterdam Study (RS‐II). All participants had DNA extracted from blood at their first visit. In 2006–2008 a second expansion (RS‐III) of 3,932 persons aged 45 and over was realized. Genotyping was performed at the Human Genotyping Facility, Genetic Laboratory Department of Internal Medicine, Erasmus MC, Rotterdam. Genotypes were imputed to the 1,000 genomes phase I version 3 reference panel, using standard methods and software [Willer et al., 2008]. From 2005 onward MRI is part of the core protocol of the Rotterdam study [Ikram et al., 2015]. For this study a total of 4,071 unique study participants had both MRI and genetic data and were available for analysis. The Rotterdam Study has been approved by the Medical Ethics Committee of the Erasmus MC and by the Ministry of Health, Welfare and Sport of the Netherlands, implementing the Wet Bevolkingsonderzoek: ERGO (Population Studies Act: Rotterdam Study). All participants provided written informed consent to participate in the study and to obtain information from their treating physicians.
Erasmus Rucphen Family (ERF)
The ERF study is a family‐based cohort study in a genetically isolated population from a community in the South‐West of the Netherlands (Rucphen municipality) including 3,000 participants. Participants are all descendants of a limited number of founders living in the 19th century, and all of Caucasian European descent. Extensive genealogical data is available for this population. The study population is described in detail elsewhere [Sayed‐Tabatabaei et al., 2005]. In a follow‐up analysis, non‐demented hypertensive (systolic blood pressure ≥160, diastolic blood pressure ≥100, or use of antihypertensive medication) subjects aged 55–75 years were included for a new battery of tests, including MRI scanning [Ibrahim‐Verbaas et al., 2012]. These 122 participants from the ERF were related to each other in one large pedigree. This large pedigree was split into multiple small pedigrees for heritability calculations (pedcut version 1.19 http://mga.bionet.nsc.ru/soft/). Participants related to each other in 27 families with in total 880 relatives. The average size of the pedigrees was 32.6 relatives (range 20–44) with on average 4.5 participants with MRI per family. All participants gave informed consent to participate in the study and to obtain information from their treating physicians. The study was approved by the medical ethics committee at Erasmus MC University Medical Center, Rotterdam, The Netherlands.
MRI scanning for ERF and the Rotterdam Study was done on the same 1.5 T MRI unit (GE Healthcare, Milwaukee, Signa Excite software version 11×) fitted with a dedicated 8‐channel head coil. The T1‐weighted, proton density‐weighted (PDw) and fluid‐attenuated inversion recovery (FLAIR) sequences were used [Ikram et al., 2015]. For the purpose of segmentation, the T1w scan is acquired in 3D at high in‐plane resolution and with thin slices (voxel size <1 mm3 [Ikram et al., 2015].
Austrian Stroke Prevention Study (ASPS)
The ASPS study is a single‐center, prospective follow‐up study on the effects of vascular risk factors on brain structure and function in the normal elderly population of the city of Graz, Austria. The procedure of recruitment and diagnostic work‐up of study participants has been described previously [Schmidt et al., 1994, 1999]. Between 2006 and 2013 the study was extended for the Austrian Stroke Prevention Family Study (ASPS‐Fam) [Seiler et al., 2014]. Study participants of the ASPS and their first grade relatives were invited to enter ASPS‐Fam. Inclusion criteria were no history of previous stroke or dementia and a normal neurological examination. In total 176 families connecting a total of 719 relatives, among which 369 were study participants with brain‐MRI. The average size of the pedigrees was 4 (range 1–10) relatives with on average 2.4 participants with MRI per family. The diagnostic work‐up was identical to the original study. The study protocol was approved by the ethics committee of the Medical University of Graz, Austria, and written and informed consent was obtained from all subjects. MRI scanning of the ASPS‐Fam was done on a 3.0 T Tim Trio (Siemens, Erlangen). T1‐MPRAGE 1 × 1 × 1 mm was used for image processing [Seiler et al., 2014].
Image Processing
Prior to analysis, a number of pre‐processing steps were performed. For multispectral image analysis, the different scans were spatially registered using rigid registration [Ikram et al., 2015]. Subsequently, the brain was extracted from the scan. Hereto a manually segmented brain mask, which excludes cerebellum, eyes, and skull, was non‐rigidly registered to the T1‐weighted image using Elastix [Ikram et al., 2015]. Finally, scans were corrected for intensity non‐uniformity using the N3 method; non‐uniformity correction was carried out within the brain mask [Ikram et al., 2015]. All T1‐weighted images were segmented into supra‐tentorial gray matter (GM), white matter (WM) and cerebrospinal fluid (CSF). For the Rotterdam Study and ERF, we used a previously described k‐Nearest‐Neighbor (kNN) algorithm, which was trained on six manually labeled atlases [Vrooman et al., 2007]. For the ASPS‐Fam study a Quantib BV tissue segmentation tool was applied (http://www.quantib.org). Quantib® software implements the same algorithm, which we then used for tissue segmentation in the Rotterdam Study and ERF. There are thus no methodological differences between the methods, both of them based on kNN‐based segmentation training on manually labeled subjects for segmenting GM, WM and CSF.
Voxel‐based morphometry (VBM) was performed by the same optimized VBM protocol in all three studies [Good et al., 2001] and previously described [Roshchupkin, et al., 2016a]. FSL software [Smith et al., 2004] was used for VBM data processing. First, all GM density maps were non‐linearly registered to the standard GM probability template. For this study we chose the MNI152 GM template (Montreal Neurological Institute) with a 1 × 1 × 1 mm voxel resolution [Fonov et al., 2011]. The MNI152 standard‐space T1‐weighted average structural template image is derived from 152 structural images, which have been warped and averaged into the common MNI152 coordinate system after high‐dimensional nonlinear registration. A spatial modulation procedure was used to avoid differences in absolute gray matter volume due to the registration. This involved multiplying voxel density values by the Jacobian determinants estimated during spatial normalization. To decrease signal to noise ratio, all images were smoothed using a 3 mm (FWHM 8 mm) isotropic Gaussian kernel. Thus all results are in MNI space. Brain regions were segmented using atlas‐based segmentation based on the Hammer atlas [Hammers et al., 2003]. The modulation step in the VBM pipeline preserves the volume of a particular tissue within a voxel. The multiplication of the voxel values in the segmented images by the Jacobian determinants derived from the spatial normalization step allows us to calculate volumes by aggregating voxels. In total we estimated heritability for 1,405,508 gray matter voxels in all three studies.
Reproducibility VBM Measures
We investigated the test–retest reliability of the VBM measures in a subset of 83 persons who were scanned twice within 1–9 weeks. We quantified the reproducibility by calculating the intraclass correlation (ICC) of the gray matter density measures for every voxel (Online viewer, Supporting Information Fig. 1) [Shrout and Fleiss, 1979].
Heritability Analysis
Population‐based heritability estimates were calculated using Genome‐wide Complex Trait Analysis (GCTA v1.24) [Yang et al., 2011] (http://cnsgenomics.com/software/gcta/) in the population‐based Rotterdam Study. GCTA implements REML (restricted maximum likelihood) analysis, this method compares genotypic similarity between individuals to their phenotypic similarity. Formula's underlying the GCTA method to determine heritability estimates are described elsewhere [Yang et al., 2010] and thoroughly explained in a commentary by the authors [Visscher et al., 2010]. The 1,000 Genomes imputed genotypes [Imputation quality (Rsq) > 0.5 and minor allele frequency (MAF) > 0.01] were used to create a genetic relationship matrix (GRM) in GCTA [Adams et al., 2016]. The power of GCTA analysis is determined by pair‐wise genetic relationships in the studied population [Visscher et al., 2010; Yang et al., 2010]. Therefore the three cohorts of the Rotterdam study were combined and analyzed as one in the voxel‐wise heritability analysis. Pairwise genetic relatedness between all individuals (N = 4,071) was calculated and for pairs with more than 0.02 genotype similarity [Adams et al., 2016] one person was removed (N removed = 832). REML analysis was then performed in the remaining 3,239 unrelated subjects using the GRM correcting for age and sex. All gray matter heritability was estimated once.
Family‐based heritability was estimated using maximum‐likelihood variance components methods implemented in the SOLAR (version 6.6.2) [Almasy and Blangero, 1998] software. Formulas for the calculation of heritability estimates are described in detail elsewhere [Almasy and Blangero, 1998]. Briefly, the algorithms in SOLAR employ maximum likelihood variance decomposition methods. The covariance matrix Ω for a pedigree of individuals is given by:
where σ 2 g is the genetic variance due to the additive genetic factors, Φ is the kinship matrix representing the pair‐wise kinship coefficients among all individuals, σ 2 e is the variance due to individual‐specific environmental effects, and I is an identity matrix (under the assumption that all environmental effects are uncorrelated among family members). Narrow sense heritability is defined as the fraction of phenotypic variance σ 2 P attributable to additive genetic factors:
The variance parameters are estimated by comparing the observed phenotypic covariance matrix with the covariance matrix predicted by kinship (Almasy and Blangero, 1998). Significance of heritability is tested by comparing the likelihood of the model in which σ 2 g is constrained to zero with that of a model in which σ 2 g is estimated. Twice the difference between the loge likelihoods of these models yields a test statistic, which is asymptotically distributed as a ½:½ mixture of a χ 2 variable with 1 degree‐of‐freedom and a point mass at zero. If the algorithm converges SOLAR outputs the heritability value, the significance value (P), and the standard error for each voxel [Almasy and Blangero, 1998; Kochunov et al., 2015].
ERF study and ASPS‐Fam were not jointly analyzed because ERF subjects were scanned on a 1.5T MRI and ASPS‐Fam subjects on a 3.0T MRI. Instead inverse variance meta‐analysis using heritability and heritability standard errors was performed in METAL [Willer et al., 2010] to boost power and improve stability of heritability estimates [Jahanshad et al., 2013]. Heritability estimates were calculated in both studies with age and sex as covariates. Variance component methods implemented in SOLAR are vulnerable for inflation if phenotypes have a leptokurtic to distribution. Therefore we applied inverse normal transformations in SOLAR to all voxels, but some voxels still violated the distribution of too high residual kurtosis (kurtosis >0.9) and were therefore excluded [Blangero et al., 2001]. Non converging heritability estimates of 0 without standard errors were also excluded from the meta‐analysis. In the family‐based studies some voxels had valid P‐values and a heritability of 1, but missing standard errors. These voxels were located in the middle of voxel‐clusters with high heritability (online viewer reference) (close to 1). Therefore standard errors for such voxels were imputed to retain these voxels for meta‐analysis. This resulted in imputation of the standard error for 6.4% of voxels in the ERF study and a negligible percentage of voxels in ASPS‐Fam (<0.001%).
Enhancement of Association Signal
We explored whether voxel heritability information could enhance the association of genetic variants with brain structures. The genetic variants most significantly associated with hippocampal volume (rs77956314 on 12q24.22, near the gene HRK) and putamen volume (rs945270 on 14q22.3, downstream of the gene KTN1) were selected from a recently published genome‐wide association study on subcortical structures [Hibar et al., 2015]. To select the most heritable voxels in the hippocampus and putamen, we ordered them using three approaches. First, we ranked the voxels from low to high family‐based heritability estimates. Second, we ranked them from low to high population‐based heritability estimates. In the third approach we summed the ranks obtained from both the family‐ and population‐based estimates and used the sum of the ranks to prioritize the voxels. Using these three approaches we excluded the voxels in a step‐wise manner by removing the 5% least heritable voxels. For each step we computed the volume by summing the values of the remaining voxels. As a voxel represents gray matter density in 1 mm3, the sum of voxels gives the volume of gray matter. We determined the association of the two genetic variants in an additive model with the volumes in linear regression analyses (adjusted for age, sex, and the first three principal components) and compared this to association of the volume derived from all voxels mapped to the structure (i.e., the total VBM‐volume of the hippocampus or putamen). The P‐value of the association of the genetic variants with the subsets of voxels divided by the P‐value of the association of the genetic variants with the total VBM‐volume was calculated to measure change in the strength of the association. Genetic effects were calculated in the three cohorts of the Rotterdam study separately (RS‐I = 844, RS‐II = 1,003, RS‐III = 2,190) and were combined using an inverse variance weighted meta‐analysis in METAL [Willer et al., 2010].
Statistical Analysis
Descriptive statistics were compared using one‐way ANOVA and chi‐squared tests. To correct for multiple comparisons we applied FDR P‐value thresholds [Benjamini and Hochberg, 1995] for both population and family heritability separately to declare which voxels are significantly heritable.
RESULTS
Population Characteristics
Characteristics of the study population are shown in Table 1. The spread of the age of subjects in the ERF study (age range 55–76) was smaller compared with ASPS‐Fam (38–86) and the Rotterdam Study (46–98) due to the fact that inclusion criteria for scanning was restricted to midlife (Table 1). However, the average age at the time of MRI‐scanning of the cohorts was very similar, ranging from 64.3 (±4.5) years in the ERF study, 64.9 (±10.7) years in ASPS, and 64.9 (±10.7) in the Rotterdam Study (P = 0.86). The percentage of women was 52.5% in ERF, 60.4% in ASPS‐Fam and 55.3% in the Rotterdam study, these differences were non‐significant (P = 0.13) (Table 1).
Table 1.
Descriptive statistics
| ERF | ASPS‐Fam | RS | P | |
|---|---|---|---|---|
| Country | Netherlands | Austrian | Netherlands | |
| Study type | Family‐based | Family‐based | Population‐based | |
| Field strength | 1.5T | 3.0T | 1.5T | |
| Sequence | T1‐weighted | T1‐MPRAGE | T1‐weighted | |
| TR/TE (ms) | 13.8/2.8 | 1,900/2.19 | 13.8/2.8 | |
| TI (ms) | 400 | 900 | 400 | |
| Flip angle (degrees) | 20 | 9 | 20 | |
| Voxel size | 1 × 1 × 1 mm | 1 × 1 × 1 mm | 1 × 1 × 1 mm | |
| Minimum–maximum age | 56–76 | 38–86 | 46–98 | |
| Age (±SD) | 64.3 ± 4.5 | 64.9 ± 10.7 | 64.7 ± 10.7 | 0.86a |
| Minimum–maximum age | 56–76 | 38–86 | 46–98 | |
| Percentage females | 52.5% | 60.4% | 55.3% | 0.13b |
| N participants with MRI‐scan | 122 | 369 | 3,239c | |
| Total relatives in pedigrees | 880 | 718 | – |
Descriptive statistics of the included studies.
P calculated with one‐way ANOVA.
P chi‐squared test.
The total number of participants with brain magnetic imaging and genetics data in the Rotterdam study was 4,071, but for pairs with more than 0.02 genotype similarity one person was removed (N removed = 832). MRI, Magnetic Resonance Imaging; ERF, Erasmus Rucphen Family study; ASPS‐Fam, Austrian Stroke Prevention Family Study; RS, Rotterdam Study; SD, standard deviation. T1‐MPRAGE, T1 weighted 3D sequences with magnetization preparation; TR, repetition time; TE, echo time; TI inversion time.
Heritability Estimates
In total 4,54,184 (33.3% of all voxels) were FDR‐significant in the family‐based estimates. Mean heritability of significant voxels was 0.44 ± 0.12 SD (all voxels 0.29 ± 0.17 SD), with heritability estimates ranging from 0.23 to 1. In total 68,616 (4.9% of all voxels) were FDR‐significant in the population‐based estimates. Mean heritability of the significant voxels was 0.34 ± 0.04 SD (all voxels 0.11 ± 0.10), with heritability estimates ranging from 0.25 to 0.56. We found heritability of 44,349 voxels (3.2% of all voxels) to be FDR significant in the family‐ as well as the population‐based heritability estimates. These significantly heritable voxels were clustered, mostly within subcortical brain structures (Fig. 1). Table 2 shows the percentage of voxels that were significantly heritable of the total of voxels in a structure in both estimates, as well as the average regional heritability, considering all voxel‐wise heritability estimates. Highest percentage of significantly heritable in both estimates voxels were located in the caudate nucleus (right 72.4% and left 68.6%) followed by the putamen (right 57.5% and left 32.6%). Other subcortical structures with a large percentage of significantly heritable voxels were; left pallidum (32.2%), left nucleus accumbens (29.7%), right pallidum (28.5%), left amygdala (21.4%), left hippocampus (17.9%), left thalamus (14.4%), right amygdala (12.8%), and the right insula (11.4%). Apart from the subcortical structures, parts of the right lateral occipitotemporal gyrus (gyrus fusiformis) (10.4%), left straight gyrus (gyrus rectus) (10.4%), left subcallosal area (8.0%), and the left lingual gyrus (7.9%) harbored a proportion significantly heritable voxels (Table 2 and Fig. 1).
Figure 1.
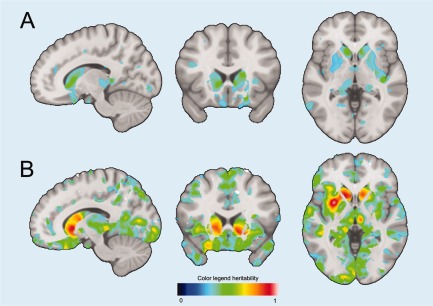
Example of FDR‐Significant voxels in both population‐based (A) and family‐based (B) estimates. Significant voxels cluster in subcortical structures, such as the caudate nucleus. All results can be interactively accessed (http://www.imagene.nl/heritability) and downloaded from the website. [Color figure can be viewed at http://wileyonlinelibrary.com]
Table 2.
Regional heritability estimates
| Lobe | Structure | N‐voxels | Family significant (%) | Population significant (%) | Significant both (%) | Population (±SD) | Family (±SD) | Δ h2 |
|---|---|---|---|---|---|---|---|---|
| Temporal lobe | Amygdala left | 2,328 | 21.4 | 79.6 | 21.4 | 0.21 (±0.09) | 0.44 (±0.11) | 0.23 |
| Temporal lobe | Amygdala right | 2,443 | 13 | 88.2 | 12.8 | 0.21 (±0.09) | 0.49 (±0.10) | 0.29 |
| Temporal lobe | Anterior temporal lobe, lateral part left | 5,169 | 0.1 | 21.9 | 0.1 | 0.08 (±0.08) | 0.27 (±0.16) | 0.19 |
| Temporal lobe | Anterior temporal lobe, lateral part right | 5,535 | 1.2 | 34.6 | 0.4 | 0.10 (±0.08) | 0.27 (±0.14) | 0.17 |
| Temporal lobe | Anterior temporal lobe, medial part left | 10,427 | 3.3 | 33.9 | 0.9 | 0.09 (±0.09) | 0.27 (±0.15) | 0.18 |
| Temporal lobe | Anterior temporal lobe, medial part right | 11,157 | 7.4 | 34.1 | 3 | 0.17 (±0.08) | 0.29 (±0.10) | 0.12 |
| Temporal lobe | Gyri parahippocampalis et ambiens left | 7,411 | 10.7 | 66.5 | 6.8 | 0.17 (±0.10) | 0.42 (±0.17) | 0.25 |
| Temporal lobe | Gyri parahippocampalis et ambiens right | 7,548 | 4.5 | 87.9 | 4.3 | 0.15 (±0.10) | 0.50 (±0.12) | 0.35 |
| Temporal lobe | Hippocampus left | 3,482 | 18.1 | 93.7 | 17.9 | 0.24 (±0.07) | 0.52 (±0.15) | 0.28 |
| Temporal lobe | Hippocampus right | 3,725 | 8.1 | 83.1 | 7.7 | 0.15 (±0.11) | 0.47 (±0.16) | 0.32 |
| Temporal lobe | Lateral occipitotemporal gyrus (gyrus fusiformis) left | 6,603 | 0 | 69.5 | 0 | 0.07 (±0.07) | 0.40 (±0.14) | 0.32 |
| Temporal lobe | Lateral occipitotemporal gyrus (gyrus fusiformis) right | 6,631 | 10.9 | 68.9 | 10.4 | 0.16 (±0.09) | 0.41 (±0.15) | 0.24 |
| Temporal lobe | Medial and inferior temporal gyri left | 23,978 | 0 | 26.7 | 0 | 0.06 (±0.06) | 0.24 (±0.14) | 0.18 |
| Temporal lobe | Medial and inferior temporal gyri right | 24,547 | 1.9 | 33.8 | 1.3 | 0.12 (±0.08) | 0.26 (±0.17) | 0.14 |
| Temporal lobe | Posterior temporal lobe left | 64,214 | 3.5 | 28.5 | 2.3 | 0.10 (±0.10) | 0.25 (±0.15) | 0.15 |
| Temporal lobe | Posterior temporal lobe right | 64,529 | 2.6 | 36.9 | 0.6 | 0.09 (±0.09) | 0.29 (±0.16) | 0.2 |
| Temporal lobe | Superior temporal gyrus, anterior part left | 6,618 | 4.9 | 49.1 | 2.3 | 0.18 (±0.08) | 0.30 (±0.09) | 0.13 |
| Temporal lobe | Superior temporal gyrus, anterior part right | 6,874 | 3 | 32.8 | 0.4 | 0.10 (±0.08) | 0.28 (±0.12) | 0.18 |
| Temporal lobe | Superior temporal gyrus, central part left | 17,666 | 8.1 | 66.3 | 5.7 | 0.14 (±0.10) | 0.39 (±0.12) | 0.26 |
| Temporal lobe | Superior temporal gyrus, central part right | 18,329 | 11.8 | 20.7 | 1.5 | 0.14 (±0.11) | 0.22 (±0.13) | 0.08 |
| Parietal Lobe | Postcentral gyrus left | 39,052 | 4 | 35 | 2.3 | 0.11 (±0.09) | 0.29 (±0.17) | 0.19 |
| Parietal Lobe | Postcentral gyrus right | 34,055 | 4.7 | 30 | 1.7 | 0.13 (±0.10) | 0.27 (±0.15) | 0.14 |
| Parietal Lobe | Remainder of parietal lobe left (including supramarginal and angular gyrus) | 56,090 | 8.3 | 21 | 2.4 | 0.14 (±0.11) | 0.21 (±0.15) | 0.08 |
| Parietal Lobe | Remainder of parietal lobe right (including supramarginal and angular gyrus) | 55,452 | 4 | 18 | 1.1 | 0.10 (±0.10) | 0.21 (±0.15) | 0.11 |
| Parietal Lobe | Superior parietal gyrus left | 53,683 | 3.6 | 28.9 | 2.3 | 0.11 (±0.09) | 0.26 (±0.16) | 0.15 |
| Parietal Lobe | Superior parietal gyrus right | 59,456 | 2.8 | 32.1 | 1.6 | 0.12 (±0.09) | 0.28 (±0.16) | 0.16 |
| Occipital Lobe | Cuneus left | 15,193 | 3.2 | 40.6 | 2.5 | 0.12 (±0.09) | 0.31 (±0.17) | 0.19 |
| Occipital Lobe | Cuneus right | 14,886 | 6.6 | 51.6 | 5.8 | 0.13 (±0.10) | 0.34 (±0.15) | 0.21 |
| Occipital Lobe | Lateral remainder of occipital lobe left | 61,105 | 0.6 | 35.3 | 0.3 | 0.07 (±0.07) | 0.30 (±0.16) | 0.23 |
| Occipital Lobe | Lateral remainder of occipital lobe right | 61,419 | 0.4 | 21.9 | 0.3 | 0.07 (±0.08) | 0.24 (±0.15) | 0.17 |
| Occipital Lobe | Lingual gyrus left | 18,574 | 8.3 | 65.7 | 7.9 | 0.15 (±0.10) | 0.40 (±0.14) | 0.25 |
| Lobe | Structure | N‐voxels | Family significant (%) | Population significant (%) | Significant both (%) | Population (±SD) | Family (±SD) | Δ h2 |
|---|---|---|---|---|---|---|---|---|
| Occipital Lobe | Lingual gyrus right | 19,412 | 10.5 | 60.2 | 6.1 | 0.15 (±0.11) | 0.37 (±0.14) | 0.22 |
| Insula and Cingulate gyri | Cingulate gyrus, anterior (supragenual) part left | 12,284 | 6.3 | 27.6 | 1.3 | 0.14 (±0.10) | 0.27 (±0.09) | 0.13 |
| Insula and Cingulate gyri | Cingulate gyrus, anterior (supragenual) part right | 13,770 | 1.1 | 23.4 | 0.1 | 0.13 (±0.08) | 0.25 (±0.11) | 0.12 |
| Insula and Cingulate gyri | Cingulate gyrus, posterior part left | 12,016 | 13.2 | 40.1 | 6.9 | 0.17 (±0.12) | 0.32 (±0.14) | 0.16 |
| Insula and Cingulate gyri | Cingulate gyrus, posterior part right | 12,643 | 6.7 | 51.9 | 5.6 | 0.16 (±0.09) | 0.36 (±0.14) | 0.2 |
| Insula and Cingulate gyri | Insula left | 20,040 | 8.5 | 62.5 | 4.5 | 0.16 (±0.10) | 0.43 (±0.16) | 0.27 |
| Insula and Cingulate gyri | Insula right | 20,796 | 20.6 | 46.3 | 11.4 | 0.22 (±0.10) | 0.33 (±0.15) | 0.11 |
| Frontal Lobe | Anterior orbital gyrus left | 9,240 | 0.1 | 25 | 0.1 | 0.07 (±0.07) | 0.25 (±0.14) | 0.18 |
| Frontal Lobe | Anterior orbital gyrus right | 8,652 | 0 | 11.4 | 0 | 0.10 (±0.08) | 0.23 (±0.20) | 0.13 |
| Frontal Lobe | Inferior frontal gyrus left | 26,296 | 1.3 | 33.6 | 0.3 | 0.08 (±0.08) | 0.30 (±0.19) | 0.22 |
| Frontal Lobe | Inferior frontal gyrus right | 24,054 | 0.7 | 11.3 | 0.2 | 0.07 (±0.08) | 0.21 (±0.16) | 0.14 |
| Frontal Lobe | Lateral orbital gyrus left | 5,264 | 0 | 59.3 | 0 | 0.04 (±0.05) | 0.36 (±0.11) | 0.32 |
| Frontal Lobe | Lateral orbital gyrus right | 5,348 | 0.3 | 42 | 0.1 | 0.09 (±0.10) | 0.30 (±0.15) | 0.21 |
| Frontal Lobe | Medial orbital gyrus left | 8,408 | 3.4 | 40.2 | 3.3 | 0.09 (±0.10) | 0.32 (±0.15) | 0.24 |
| Frontal Lobe | Medial orbital gyrus right | 8,486 | 4.6 | 27.2 | 3.9 | 0.10 (±0.10) | 0.28 (±0.21) | 0.18 |
| Frontal Lobe | Middle frontal gyrus left | 53,570 | 0.9 | 12.4 | 0.2 | 0.06 (±0.08) | 0.21 (±0.17) | 0.15 |
| Frontal Lobe | Middle frontal gyrus right | 56,150 | 1.4 | 9.5 | 0.2 | 0.07 (±0.08) | 0.19 (±0.15) | 0.12 |
| Frontal Lobe | Posterior orbital gyrus left | 7,098 | 0 | 58.8 | 0 | 0.09 (±0.07) | 0.41 (±0.20) | 0.32 |
| Frontal Lobe | Posterior orbital gyrus right | 7,469 | 8.5 | 38.6 | 5.5 | 0.14 (±0.11) | 0.31 (±0.20) | 0.18 |
| Frontal Lobe | Precentral gyrus left | 44,289 | 0.3 | 18.1 | 0 | 0.06 (±0.07) | 0.22 (±0.14) | 0.16 |
| Frontal Lobe | Precentral gyrus right | 45,058 | 1.3 | 24.1 | 0.8 | 0.09 (±0.09) | 0.22 (±0.16) | 0.13 |
| Frontal Lobe | Pre‐subgenual anterior cingulate gyrus left | 1,888 | 0 | 84.3 | 0 | 0.08 (±0.05) | 0.41 (±0.08) | 0.32 |
| Frontal Lobe | Pre‐subgenual anterior cingulate gyrus right | 1,166 | 2.6 | 90 | 0.3 | 0.14 (±0.07) | 0.47 (±0.10) | 0.33 |
| Frontal Lobe | Straight gyrus (gyrus rectus) left | 5,397 | 16.6 | 69.7 | 10.4 | 0.18 (±0.11) | 0.35 (±0.10) | 0.17 |
| Frontal Lobe | Straight gyrus (gyrus rectus) right | 6,467 | 6.7 | 41.5 | 3.5 | 0.17 (±0.11) | 0.28 (±0.12) | 0.11 |
| Frontal Lobe | Subcallosal area left | 527 | 8 | 87.7 | 8 | 0.19 (±0.07) | 0.51 (±0.11) | 0.32 |
| Frontal Lobe | Subcallosal area right | 496 | 4.2 | 92.5 | 4.2 | 0.16 (±0.09) | 0.53 (±0.08) | 0.36 |
| Frontal Lobe | Subgenual anterior cingulate gyrus left | 1,932 | 1.1 | 73.3 | 1.1 | 0.14 (±0.08) | 0.42 (±0.10) | 0.28 |
| Frontal Lobe | Subgenual anterior cingulate gyrus right | 2,044 | 1.9 | 60.5 | 1.9 | 0.16 (±0.09) | 0.37 (±0.13) | 0.21 |
| Frontal Lobe | Superior frontal gyrus left | 69,674 | 0.9 | 13.4 | 0.3 | 0.08 (±0.08) | 0.20 (±0.16) | 0.12 |
| Frontal Lobe | Superior frontal gyrus right | 73,393 | 1.3 | 14.2 | 0.4 | 0.09 (±0.08) | 0.22 (±0.19) | 0.13 |
| Central Structures | Caudate nucleus left | 6,042 | 68.6 | 96.4 | 68.6 | 0.32 (±0.10) | 0.65 (±0.13) | 0.33 |
| Central Structures | Caudate nucleus right | 6,172 | 75.6 | 91.7 | 72.4 | 0.34 (±0.09) | 0.55 (±0.15) | 0.21 |
| Central Structures | Nucleus accumbens left | 580 | 29.7 | 92.2 | 29.7 | 0.24 (±0.10) | 0.54 (±0.15) | 0.31 |
| Lobe | Structure | N‐voxels | Family significant (%) | Population significant (%) | Significant both (%) | Population (±SD) | Family (±SD) | Δ h2 |
|---|---|---|---|---|---|---|---|---|
| Central Structures | Nucleus accumbens right | 443 | 6.1 | 94.6 | 6.1 | 0.17 (±0.08) | 0.53 (±0.09) | 0.37 |
| Central Structures | Pallidum (globus pallidus) left | 1,893 | 32.2 | 89.2 | 32.2 | 0.22 (±0.09) | 0.50 (±0.11) | 0.28 |
| Central Structures | Pallidum (globus pallidus) right | 1,812 | 39.8 | 70.3 | 28.5 | 0.27 (±0.07) | 0.37 (±0.11) | 0.11 |
| Central Structures | Putamen left | 7,819 | 32.6 | 96.2 | 32.6 | 0.24 (±0.07) | 0.67 (±0.14) | 0.43 |
| Central Structures | Putamen right | 7,325 | 59.2 | 90.8 | 57.5 | 0.29 (±0.07) | 0.48 (±0.14) | 0.19 |
| Central Structures | Thalamus left | 11,142 | 15.2 | 76.2 | 14.4 | 0.18 (±0.10) | 0.40 (±0.11) | 0.22 |
| Central Structures | Thalamus right | 10,774 | 6.8 | 68.9 | 6.6 | 0.16 (±0.09) | 0.39 (±0.13) | 0.23 |
The average voxel‐wise heritability in 72 brain structures from family‐based and population‐based estimates. N = total number of tested voxels, Significant Population (%) = percentage of N which was significant at False discovery Rate threshold q = 0.05 in the population‐based estimates. Significant family (%) = percentage of N which was significant at False discovery Rate threshold q = 0.05 in family‐based estimates. Significant both (%) = percentage of N which was significant at False discovery Rate threshold q = 0.05 in both family‐based as population‐based estimates. Family = mean family‐based heritability estimates per brain structure, Population = mean population‐based heritability estimates per brain structure. Δ h2 = difference in regional heritability (Family‐Population).
When comparing regional heritability, estimates calculated in families was always higher than the population‐based estimates (P < 0.001) (Fig. 2A) and the difference in heritability between family‐based estimates and population‐based estimates was relatively stable (mean difference of regional heritability = 0.21 ± 0.08) (Table 2). Therefore, the regional heritability pattern of the family‐based estimates significantly predicted the regional pattern of heritability in the population‐based study (Pearson's correlation coefficient = 0.73, P = 2.6 × 10⁻¹³) (Fig. 2B).
Figure 2.
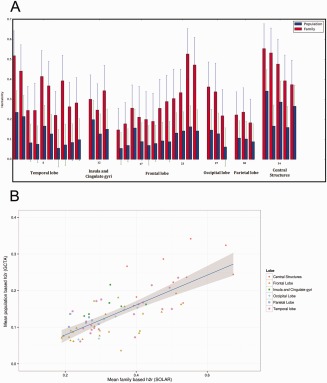
(A) Barplot showing regional brain heritability. Structures that are in both the left as well as the right hemisphere were averaged for this figure. It can clearly be seen that the heritability from family‐based studies is higher than heritability form the unrelated population (P < 0.001). (B) Scatter plot of the average regional heritability of all brain structures. The correlation of the family‐based and population‐based estimates was high (Pearson's correlation coefficient = 0.73, P = 2.6 × 10⁻¹³). Data points per structure correspond to family and population heritability in Table II. [Color figure can be viewed at http://wileyonlinelibrary.com]
Enhancement of Association Signal
We explored if applying our heritability map could enhance the statistical association signal of previously discovered genome‐wide significant loci. As expected the T‐allele of rs77956314 (HRK) associated with a smaller total volume of the hippocampus (P = 5.1 × 10⁻⁷) and the C‐allele of rs945270 (KTN1) significantly associated with larger total volume of the putamen (P = 4.3 × 10⁻³). When excluding the less heritable voxels the average heritability in the remaining voxels increased (Fig. 3A and B). With rising average heritability we observed a gradual decrease in P‐values (Fig. 3C), and consequently a more significant association of HRK with the more heritable part of the hippocampus. The maximum enrichment of association was reached when the 10% most significantly heritable voxels when combining heritability information from family‐based and population‐based studies was used. This increase corresponds to a 95.9 times more significant association, as the P‐value decreased from P = 5.1 × 10⁻⁷ to P = 5.4 × 10⁻⁹. Using only the family‐based estimates the association was 12.9 times more significant. A less substantial decrease in p‐value was observed for the association of KTN1 with the more heritable part of the putamen (Fig. 3D). The P‐value decreased when restricting to voxels that belong to the 25% most heritable voxels from the only the family‐based study. This corresponds to a 5.5 times more significant association (P‐value decrease from P = 4.3 × 10⁻³ to P = 7.9 × 10⁻⁴).
Figure 3.

Enhancement of the association signal of variants with the most heritable voxels of the hippocampus and putamen. A,B: Average heritability (y‐axis) of the voxels in hippocampus (A) and putamen (B) given a percentage of the most heritable voxels in that region (x‐axis) in steps of 5%. C,D: The −log(P‐value) increase comparing the P‐value of association with subsets of the most heritable voxels and all voxels in the region. The –log(P‐value) increase for association of hippocampal with rs77956314 (HRK gene) and putamen voxels with rs945270 (KTN1 gene) is shown. Associations were corrected for age, sex, and the first three principal components. [Color figure can be viewed at http://wileyonlinelibrary.com]
DISCUSSION
In this study we presented gray matter voxel heritability maps at resolution of 1 × 1 × 1 mm from population‐ and family‐based studies. First we found that clusters of voxels that are significantly heritable in family‐based heritability estimates as well as in an unrelated population‐based study are predominantly located in subcortical regions. Second, when comparing the overall regional patterns of voxel‐wise heritability the family‐based estimates were always higher compared with population‐based estimates and predicted the population‐based heritability estimates. Lastly, we showed that the heritability estimates from our studies could be used to enhance the association signal of two genetic variants with subcortical volumes.
Voxels with significant heritability formed clusters within mainly the subcortical structures. This is in line with the findings of previous studies that the volumes of subcortical structure are among the most heritable in the brain [Blokland et al., 2012]. There are multiple explanations for this consistent finding. First, subcortical structures probably are under tight genetic control as they exert vital functions within the brain. The percentage of significantly heritable voxels was relatively low in the frontal and parietal lobes. Although intra‐individual measurability was high throughout the brain (Supporting Information Fig. 1), intra‐individual differences in cortical folding patterns could explain the lower heritability in frontal and parietal regions. These might give a reliable measurability of the voxels, while it makes comparisons of voxel values between individuals less meaningful, thus yielding a lower heritability compared with the subcortical structures. Finally, environmental effects could have a larger effect on cortical gray matter compared with subcortical structures. As the effects of non‐genetic factors (e.g., lifestyle factors) accumulate over an individual's lifetime, the heritability of total brain volume and brain structures volume was found to reduce in adulthood up until old age [Batouli et al., 2014] in line with the accumulation of environmental influences over age. Their reported maximum age was 70 years. We studied relatively old participants (∼65 years), therefore study participants might have reduced estimated heritability because of their older age
Apart from the subcortical structures, we found three cortical regions in the left hemisphere, the dominant hemisphere in over 95% of individuals, involved in speech production and word processing to have more than 5% significant voxels; the subcallosal area (also called Broca area), central part of the superior temporal gyrus (contains Wernicke's area) and the lingual gyrus. Moreover, their right counterparts contained less significant voxels compared with the left side. Language skills [Gayan and Olson, 1999] and brain networks [Budisavljevic et al., 2015] are thought to be under tight genetic control and the left hemisphere language areas have been found more heritable than the right hemisphere before [Thompson et al., 2001]. Regions with significant heritability could in theory be connected by white matter connections, which in turn then also are under high genetic control, suggesting a common genetic architecture. In a recent report evidence for this theory was found [Shen et al., 2016]. Cortical thickness in some regions with high heritability, were connected by heritable white matter connections. These connections and the cortical regions were anatomically distant but showed significant genetically correlation [Shen et al., 2016].
We found a relatively stable difference in the regional patterns of the total additive genetic heritability. The heritability calculated from familial relations was always higher than the total additive variance explained by all autosomal variants calculated in unrelated subjects. This known difference between family and population‐based heritability estimates has been extensively described [Zuk et al., 2012, 2014]. The difference can in part be explained by overestimation of heritability in families due to sharing of environmental factors within the family. These factors are interpreted as genetic effects and cause the overestimation of heritability in twin and nuclear family studies [Koran et al., 2014]. Subjects in multi‐generational families share less environmental factors. Therefore multi‐generational families, as ASPS‐Fam and especially the ERF study, are more likely to yield an unbiased estimate of heritability. However, we assumed that all environmental factors affecting brain voxel volume are uncorrelated among family members (unique environmental effects) therefore some unassessed common environmental effects might be causing the higher heritability in our family‐based estimates. At the same time an underestimation of the heritability calculated from genetic data in unrelated populations could occur because of an incomplete coverage of the causal variants and exclusion of rare variants. We used imputed data to increase coverage of the causal variants. Imputed data provide a much denser coverage of the genome than only genotyped variants, but we did exclude rare variants (MAF < 0.01) which may in part be responsible for some missing heritability.
The overall regional patterns of heritability from families strongly predicted the population‐based heritability. This suggests that the regional pattern of variance explained by additive genetic effects is similar across populations, despite different ways to measure heritability, study design and scanner types. On the website (http://www.imagene.nl/heritability) both the population‐based estimates and the family‐based estimates can be viewed separately and can be downloaded. Combining current maps with results from other studies will further increase accuracy of the heritability estimates.
Heritability in Genetic Studies
Within the putamen and hippocampus we observed highly heritable clusters of gray matter voxels alternating with parts of the subcortical structures that were less heritable. Differences in heritability within structures might be due to technical limitations (e.g., voxels that are difficult to measure) or due to genetic or functional correlations. We hypothesized that studying the genetics of only highly heritable voxels could enhance signals in imaging genetics, either through reducing signal to noise ratio or through studying a more genetically homogeneous trait. We picked two genetic variants with a proven and strongly replicated biological effect, identified through genome‐wide association studies, on the subcortical structure volume (hippocampus, putamen) to explore if enhancement was possible [Hibar et al., 2015]. We show enhancement of the statistical signal of almost hundred‐fold for the association of HRK (rs77956314) with hippocampal volume and a five‐fold increase for the association of KTN1 (rs945270) with putamen volume. Based on Figure 3 we can deduct that for future genetic studies in both examples a maximum power for association analyses was observed using voxels with a heritability over approximately 0.3 from the population‐based heritability estimates and a heritability over approximately 0.7 from family‐based heritability estimates. Despite these encouraging results there are limitations of our analysis. First, we only tested two genetic variants in two subcortical structures. While we expect that the increased signal of genetic variants with more heritable voxels will not be limited to the two variants tested in current study, future studies applying this method should be performed to determine whether this truly is the case. Second, we calculated heritability estimates and genetic association of HRK and KTN1 variants with voxels in the same subjects of the Rotterdam Study. As voxels with a large (technical) measurement error have lower heritability and therefore were excluded first in our analysis, the decreased measurement error of the more heritable voxels could result in the more significant association of genetic variants. In other words, the enhancement of signal is a reflection of a higher signal to noise ratio. Also a higher test re‐test reliability of the highly heritable voxels, reduce signal to noise ratio. Third, we used the same data for the calculation of population‐based heritability estimates and genetic testing, resulting in a possible inflation of the increase in signal due to non‐independence [Kriegeskorte et al., 2009]. However, when only the family‐based heritability estimates were used to select the voxels for genetic associations (Fig. 3C and D) the analyses were independent. In these analyses, we still observed an increase in the signal—and the enhancement was actually even stronger for the putamen—arguing against inflation due to non‐independence. However, for the hippocampus the best enhancement was achieved using the combined sample when restricting to less than 55% the most significant voxels. While this could be due to non‐independence, this is contradicted by the fact that the population‐only results (i.e., fully dependent) are in fact worse at this and lower percentages. An explanation other than non‐independence could be that the combined sample provides more accurate heritability estimates and therefore results in a better enhancement. Last, highly heritable voxels which are in close proximity of each other could share their genetic background. However finding a cluster of heritable voxels does not directly prove genetic correlation.
Strengths and Limitations
Major strengths of this study are the large sample size of the population based study and unified imaging processing. Subjects from ERF and the Rotterdam Study subjects were scanned using the same 1.5T scanner, identical MRI protocols and images were processed with exactly the same software. The ASPS‐Fam was scanned on a 3T scanner, but segmented using similar protocols and VBM processing was performed in the same way as ERF and the Rotterdam Study. Important to note is that softwares used for tissue segmentation are different, but both implement the same kNN algorithm [Vrooman et al., 2007]. The ERF and the Rotterdam Study both are both from the Netherlands, a genetically homogeneous country [Boomsma et al., 2014]. The ASPS‐Fam study is from Austria, Austrians likely have slightly different genetic architecture than the Dutch. Maximum likelihood iterative optimization was used to estimation heritability. The iterations are prone to convergence failures when sample sizes are small. The percentage of voxels that did not converge was 9% in ASPS‐Fam (N participants = 369) and 36% in ERF (N participants = 122). The methods used for population‐based estimation of heritability always output an estimate. It has been shown that not converging occurs frequently in small datasets in SOLAR producing conservative estimates [Blangero et al., 2013; Koran et al., 2014]. We further note that using only VBM to assess heritability of brain morphology is a limitation of the current study. Cortical thickness, surface area, and other MRI measures, including tensor‐based (i.e., deformation) morphometry (TBM) [Brun et al., 2009; Yoon et al., 2011] and shape analysis are all potentially interesting for future heritability and genetic studies. The differences between measures have been attributed both to biology [Voets et al., 2008; Winkler et al., 2010] and methodology [Blankstein et al., 2009; Hutton et al., 2009]. Most probably, these measures reflect a different genetic architecture [Winkler et al., 2010] and should therefore be studied separately.
Future Perspectives
Genetic association with several voxels within an anatomical structure is biologically relevant as it shows an important genetic contribution to a sub region of the structure. Apart from the biological relevance, this sub region of voxels could have clinical significance. For example, it was shown previously that subfields of the anatomically defined hippocampus contributed differently to schizophrenia [Kuhn et al., 2012] and β‐amyloid load [Schroeder et al., 2016]. If only highly heritability brain voxels are studied in future voxel‐wise genome‐wide association studies we do not expect statistical signals to be uniformly enhanced. However, for the tested genetic variant that was identified for putamen volume, we did find statistical enhancement. High heritability estimates capture a variety of sources that can affect power to detect associations, including lower signal to noise ratios and higher genetic homogeneity (i.e., genetic correlation). Using these benefits to increase statistical signal is desirable, irrespective of the underlying cause. Ideally we envision selecting groups of voxels for genetic studies based on high heritability and measured high genetic correlation. Genetic correlation can be calculated for any of the commonly used MRI‐measures, but it would still require genetic testing of sufficiently powered (large) studies. A promising future direction would be to enable the calculation of genetic correlations, genetic association (millions of voxels times millions of genetic variants), and meta‐analyses of these associations. Programs which make the calculation of genetic correlation and genetic association computationally possible in sufficiently powered studies (i.e., meta‐analyses) are essential to the field. Currently these programs tailored to large scale genetic studies are developed and genetic studies started [Roshchupkin et al., 2016b]. The results of these studies will be able to prove to which extend clusters of heritable voxels have a common genetic architecture.
CONCLUSIONS
Heritability estimates can be reliably estimated using different methods and on different cohorts and combining heritability estimates from multiple studies leads to the construction of a reliable heritability map of gray matter. These maps can be used to prioritize highly heritable regions in future genetic imaging studies.
Supporting information
Supporting Information
ACKNOWLEDGMENTS
Erasmus Rucphen family study: The ERF study as a part of EUROSPAN (European Special Populations Research Network) was supported by European Commission FP6 STRP grant number 018947 (LSHG‐CT‐2006‐01947) and also received funding from the European Community's Seventh Framework Program (FP7/2007‐2013)/grant agreement HEALTH‐F4‐2007‐201413 by the European Commission under the program “Quality of Life and Management of the Living Resources” of 5th Framework Program (no. QLG2‐CT‐2002‐01254). Najaf Amin is supported by the Netherlands Brain Foundation (project number F2013 (1)−28). We are grateful to all study participants and their relatives, general practitioners and neurologists for their contributions and to P. Veraart for her help in genealogy, J. Vergeer for the supervision of the laboratory work and P. Snijders for his help in data collection.
The Austrian Stroke Prevention Family Study: The research reported in this article was funded by the Austrian Science Fond (FWF) grant number P20545‐P05 and P13180. The Medical University of Graz supports the databank of the ASPS. The authors thank the staff and the participants of the ASPS for their valuable contributions. The authors thank Birgit Reinhart for her long‐term administrative commitment and Ing Johann Semmler for the technical assistance at creating the DNA bank.
Rotterdam Study: The generation and management of GWAS genotype data for the Rotterdam Study (RS‐I, RS‐II, RS‐III) was executed by the Human Genotyping Facility of the Genetic Laboratory of the Department of Internal Medicine, Erasmus MC, Rotterdam, The Netherlands. The GWAS datasets are supported by the Netherlands Organization of Scientific Research NWO Investments (nr. 175.010.2005.011, 911‐03‐012), the Genetic Laboratory of the Department of Internal Medicine, Erasmus MC, the Research Institute for Diseases in the Elderly (014‐93‐015; RIDE2), the Netherlands Genomics Initiative (NGI)/Netherlands Organization for Scientific Research (NWO) Netherlands Consortium for Healthy Aging (NCHA), project nr. 050‐060‐810. We thank Pascal Arp, Mila Jhamai, Marijn Verkerk, Lizbeth Herrera and Marjolein Peters, MSc, and Carolina Medina‐Gomez, MSc, for their help in creating the GWAS database, and Karol Estrada, PhD, Yurii Aulchenko, PhD, and Carolina Medina‐Gomez, MSc, for the creation and analysis of imputed data. This study makes use of an extended dataset of RS‐II and RS‐III samples based on Illumina Omni 2.5 and 5.0 GWAS genotype data, imputed to 1KG using the two‐phase imputation method. This dataset was funded by the Genetic Laboratory of the Department of Internal Medicine, the department of Forensic Molecular Biology, and the department of Dermatology, Erasmus MC, Rotterdam, The Netherlands We thank Linda Broer, PhD, for the creation of imputed data, with the support of Marijn Verkerk and Carolina Medina‐Gomez, MSc, for the analysis setup. The Rotterdam Study is funded by Erasmus Medical Center and Erasmus University, Rotterdam, Netherlands Organization for the Health Research and Development (ZonMw), the Research Institute for Diseases in the Elderly (RIDE), the Ministry of Education, Culture and Science, the Ministry for Health, Welfare and Sports, the European Commission (DG XII), and the Municipality of Rotterdam. The authors are grateful to the study participants, the staff from the Rotterdam Study and the participating general practitioners and pharmacists.
REFERENCES
- Adams HH, Verlinden VJ, Callisaya ML, van Duijn CM, Hofman A, Thomson R, Uitterlinden AG, Vernooij MW, van der Geest JN, Srikanth V, Ikram MA (2016): Heritability and genome‐wide association analyses of human gait suggest contribution of common variants. J Gerontol a Biol Sci Med Sci 71:740–746. [DOI] [PMC free article] [PubMed] [Google Scholar]
- Almasy L, Blangero J (1998): Multipoint quantitative‐trait linkage analysis in general pedigrees. Am J Hum Genet 62:1198–1211. [DOI] [PMC free article] [PubMed] [Google Scholar]
- Batouli SA, Trollor JN, Wen W, Sachdev PS (2014): The heritability of volumes of brain structures and its relationship to age: A review of twin and family studies. Ageing Res Rev 13:1–9. [DOI] [PubMed] [Google Scholar]
- Benjamini Y, Hochberg Y (1995): Controlling the false discovery rate ‐ a practical and powerful approach to multiple testing. J R Stat Soc B Met 57:289–300. [Google Scholar]
- Bis JC, DeCarli C, Smith AV, van der Lijn F, Crivello F, Fornage M, Debette S, Shulman JM, Schmidt H, Srikanth V, Schuur M, Yu L, Choi SH, Sigurdsson S, Verhaaren BF, DeStefano AL, Lambert JC, Jack CR, Jr , Struchalin M, Stankovich J, Ibrahim‐Verbaas CA, Fleischman D, Zijdenbos A, den Heijer T, Mazoyer B, Coker LH, Enzinger C, Danoy P, Amin N, Arfanakis K, van Buchem MA, de Bruijn RF, Beiser A, Dufouil C, Huang J, Cavalieri M, Thomson R, Niessen WJ, Chibnik LB, Gislason GK, Hofman A, Pikula A, Amouyel P, Freeman KB, Phan TG, Oostra BA, Stein JL, Medland SE, Vasquez AA, Hibar DP, Wright MJ, Franke B, Martin NG, Thompson PM, Enhancing Neuro Imaging Genetics through Meta‐Analysis C, Nalls MA, Uitterlinden AG, Au R, Elbaz A, Beare RJ, van Swieten JC, Lopez OL, Harris TB, Chouraki V, Breteler MM, De Jager PL, Becker JT, Vernooij MW, Knopman D, Fazekas F, Wolf PA, van der Lugt A, Gudnason V, Longstreth WT, Jr. , Brown MA, Bennett DA, van Duijn CM, Mosley TH, Schmidt R, Tzourio C, Launer LJ, Ikram MA, Seshadri S, Cohorts for H, Aging Research in Genomic Epidemiology C (2012): Common variants at 12q14 and 12q24 are associated with hippocampal volume. Nat Genet 44:545–551. [DOI] [PMC free article] [PubMed] [Google Scholar]
- Blangero J, Williams JT, Almasy L (2001): Variance component methods for detecting complex trait loci. Adv Genet 42:151–181. [DOI] [PubMed] [Google Scholar]
- Blangero J, Diego VP, Dyer TD, Almeida M, Peralta J, Kent JW, Jr ., Williams JT, Almasy L, Goring HH (2013): A kernel of truth: Statistical advances in polygenic variance component models for complex human pedigrees. Adv Genet 81:1–31. [DOI] [PMC free article] [PubMed] [Google Scholar]
- Blankstein U, Chen JYW, Mincic AM, McGrath PA, Davis KD (2009): The complex minds of teenagers: Neuroanatomy of personality differs between sexes. Neuropsychologia 47:599–603. [DOI] [PubMed] [Google Scholar]
- Blokland GA, de Zubicaray GI, McMahon KL, Wright MJ (2012): Genetic and environmental influences on neuroimaging phenotypes: A meta‐analytical perspective on twin imaging studies. Twin Res Hum Genet 15:351–371. [DOI] [PMC free article] [PubMed] [Google Scholar]
- Boomsma DI, Wijmenga C, Slagboom EP, Swertz MA, Karssen LC, Abdellaoui A, Ye K, Guryev V, Vermaat M, van Dijk F, Francioli LC, Hottenga JJ, Laros JF, Li Q, Li Y, Cao H, Chen R, Du Y, Li N, Cao S, van Setten J, Menelaou A, Pulit SL, Hehir‐Kwa JY, Beekman M, Elbers CC, Byelas H, de Craen AJ, Deelen P, Dijkstra M, den Dunnen JT, de Knijff P, Houwing‐Duistermaat J, Koval V, Estrada K, Hofman A, Kanterakis A, Enckevort D, Mai H, Kattenberg M, van Leeuwen EM, Neerincx PB, Oostra B, Rivadeneira F, Suchiman EH, Uitterlinden AG, Willemsen G, Wolffenbuttel BH, Wang J, de Bakker PI, van Ommen GJ, van Duijn CM (2014): The Genome of the Netherlands: Design, and project goals. Eur J Hum Genet 22:221–227. [DOI] [PMC free article] [PubMed] [Google Scholar]
- Brouwer RM, Mandl RC, Peper JS, van Baal GC, Kahn RS, Boomsma DI, Hulshoff Pol HE (2010): Heritability of DTI and MTR in nine‐year‐old children. Neuroimage 53:1085–1092. [DOI] [PubMed] [Google Scholar]
- Brun CC, Lepore N, Pennec X, Lee AD, Barysheva M, Madsen SK, Avedissian C, Chou YY, de Zubicaray GI, McMahon KL, Wright MJ, Toga AW, Thompson PM (2009): Mapping the regional influence of genetics on brain structure variability–a tensor‐based morphometry study. Neuroimage 48:37–49. [DOI] [PMC free article] [PubMed] [Google Scholar]
- Budisavljevic S, Dell'Acqua F, Rijsdijk FV, Kane F, Picchioni M, McGuire P, Toulopoulou T, Georgiades A, Kalidindi S, Kravariti E, Murray RM, Murphy DG, Craig MC, Catani M (2015): Age‐related differences and heritability of the perisylvian language networks. J Neurosci 35:12625–12634. [DOI] [PMC free article] [PubMed] [Google Scholar]
- Fonov V, Evans AC, Botteron K, Almli CR, McKinstry RC, Collins DL, Brain Development Cooperative G (2011): Unbiased average age‐appropriate atlases for pediatric studies. Neuroimage 54:313–327. [DOI] [PMC free article] [PubMed] [Google Scholar]
- Ganjgahi H, Winkler AM, Glahn DC, Blangero J, Kochunov P, Nichols TE (2015): Fast and powerful heritability inference for family‐based neuroimaging studies. Neuroimage 115:256–268. [DOI] [PMC free article] [PubMed] [Google Scholar]
- Gayan J, Olson RK (1999): Reading disability: Evidence for a genetic etiology. Eur Child Adolesc Psychiatry 8 Suppl 3:52–55. [DOI] [PubMed] [Google Scholar]
- Good CD, Johnsrude IS, Ashburner J, Henson RN, Friston KJ, Frackowiak RS (2001): A voxel‐based morphometric study of ageing in 465 normal adult human brains. Neuroimage 14:21–36. [DOI] [PubMed] [Google Scholar]
- Hammers A, Allom R, Koepp MJ, Free SL, Myers R, Lemieux L, Mitchell TN, Brooks DJ, Duncan JS (2003): Three‐dimensional maximum probability atlas of the human brain, with particular reference to the temporal lobe. Hum Brain Mapp 19:224–247. [DOI] [PMC free article] [PubMed] [Google Scholar]
- Hibar DP, Stein JL, Renteria ME, Arias‐Vasquez A, Desrivieres S, Jahanshad N, Toro R, Wittfeld K, Abramovic L, Andersson M, Aribisala BS, Armstrong NJ, Bernard M, Bohlken MM, Boks MP, Bralten J, Brown AA, Chakravarty MM, Chen Q, Ching CR, Cuellar‐Partida G, den Braber A, Giddaluru S, Goldman AL, Grimm O, Guadalupe T, Hass J, Woldehawariat G, Holmes AJ, Hoogman M, Janowitz D, Jia T, Kim S, Klein M, Kraemer B, Lee PH, Olde Loohuis LM, Luciano M, Macare C, Mather KA, Mattheisen M, Milaneschi Y, Nho K, Papmeyer M, Ramasamy A, Risacher SL, Roiz‐Santianez R, Rose EJ, Salami A, Samann PG, Schmaal L, Schork AJ, Shin J, Strike LT, Teumer A, van Donkelaar MM, van Eijk KR, Walters RK, Westlye LT, Whelan CD, Winkler AM, Zwiers MP, Alhusaini S, Athanasiu L, Ehrlich S, Hakobjan MM, Hartberg CB, Haukvik UK, Heister AJ, Hoehn D, Kasperaviciute D, Liewald DC, Lopez LM, Makkinje RR, Matarin M, Naber MA, McKay DR, Needham M, Nugent AC, Putz B, Royle NA, Shen L, Sprooten E, Trabzuni D, van der Marel SS, van Hulzen KJ, Walton E, Wolf C, Almasy L, Ames D, Arepalli S, Assareh AA, Bastin ME, Brodaty H, Bulayeva KB, Carless MA, Cichon S, Corvin A, Curran JE, Czisch M, de Zubicaray GI, Dillman A, Duggirala R, Dyer TD, Erk S, Fedko IO, Ferrucci L, Foroud TM, Fox PT, Fukunaga M, Gibbs JR, Goring HH, Green RC, Guelfi S, Hansell NK, Hartman CA, Hegenscheid K, Heinz A, Hernandez DG, Heslenfeld DJ, Hoekstra PJ, Holsboer F, Homuth G, Hottenga JJ, Ikeda M, Jack CR, Jr , Jenkinson M, Johnson R, Kanai R, Keil M, Kent JW, Jr , Kochunov P, Kwok JB, Lawrie SM, Liu X, Longo DL, McMahon KL, Meisenzahl E, Melle I, Mohnke S, Montgomery GW, Mostert JC, Muhleisen TW, Nalls MA, Nichols TE, Nilsson LG, Nothen MM, Ohi K, Olvera RL, Perez‐Iglesias R, Pike GB, Potkin SG, Reinvang I, Reppermund S, Rietschel M, Romanczuk‐Seiferth N, Rosen GD, Rujescu D, Schnell K, Schofield PR, Smith C, Steen VM, Sussmann JE, Thalamuthu A, Toga AW, Traynor BJ, Troncoso J, Turner JA, Valdes Hernandez MC, van 't Ent D, van der Brug M, van der Wee NJ, van Tol MJ, Veltman DJ, Wassink TH, Westman E, Zielke RH, Zonderman AB, Ashbrook DG, Hager R, Lu L, McMahon FJ, Morris DW, Williams RW, Brunner HG, Buckner RL, Buitelaar JK, Cahn W, Calhoun VD, Cavalleri GL, Crespo‐Facorro B, Dale AM, Davies GE, Delanty N, Depondt C, Djurovic S, Drevets WC, Espeseth T, Gollub RL, Ho BC, Hoffmann W, Hosten N, Kahn RS, Le Hellard S, Meyer‐Lindenberg A, Muller‐Myhsok B, Nauck M, Nyberg L, Pandolfo M, Penninx BW, Roffman JL, Sisodiya SM, Smoller JW, van Bokhoven H, van Haren NE, Volzke H, Walter H, Weiner MW, Wen W, White T, Agartz I, Andreassen OA, Blangero J, Boomsma DI, Brouwer RM, Cannon DM, Cookson MR, de Geus EJ, Deary IJ, Donohoe G, Fernandez G, Fisher SE, Francks C, Glahn DC, Grabe HJ, Gruber O, Hardy J, Hashimoto R, Hulshoff Pol HE, Jonsson EG, Kloszewska I, Lovestone S, Mattay VS, Mecocci P, McDonald C, McIntosh AM, Ophoff RA, Paus T, Pausova Z, Ryten M, Sachdev PS, Saykin AJ, Simmons A, Singleton A, Soininen H, Wardlaw JM, Weale ME, Weinberger DR, Adams HH, Launer LJ, Seiler S, Schmidt R, Chauhan G, Satizabal CL, Becker JT, Yanek L, van der Lee SJ, Ebling M, Fischl B, Longstreth WT, Jr , Greve D, Schmidt H, Nyquist P, Vinke LN, van Duijn CM, Xue L, Mazoyer B, Bis JC, Gudnason V, Seshadri S, Ikram MA, Alzheimer's Disease Neuroimaging I, Consortium C, Epigen Imagen Sys Martin NG, Wright MJ, Schumann G, Franke B, Thompson PM, Medland SE (2015): Common genetic variants influence human subcortical brain structures. Nature 520:224–229. [DOI] [PMC free article] [PubMed] [Google Scholar]
- Hofman A, Brusselle GG, Darwish Murad S, van Duijn CM, Franco OH, Goedegebure A, Ikram MA, Klaver CC, Nijsten TE, Peeters RP, Stricker BH, Tiemeier HW, Uitterlinden AG, Vernooij MW (2015): The Rotterdam Study: 2016 objectives and design update. Eur J Epidemiol 30:661–708. [DOI] [PMC free article] [PubMed] [Google Scholar]
- Hulshoff Pol HE, Schnack HG, Posthuma D, Mandl RC, Baare WF, van Oel C, van Haren NE, Collins DL, Evans AC, Amunts K, Burgel U, Zilles K, de Geus E, Boomsma DI, Kahn RS (2006): Genetic contributions to human brain morphology and intelligence. J Neurosci 26:10235–10242. [DOI] [PMC free article] [PubMed] [Google Scholar]
- Hutton C, Draganski B, Ashburner J, Weiskopf N (2009): A comparison between voxel‐based cortical thickness and voxel‐based morphometry in normal aging. Neuroimage 48:371–380. [DOI] [PMC free article] [PubMed] [Google Scholar]
- Ibrahim‐Verbaas CA, Zorkoltseva IV, Amin N, Schuur M, Coppus AM, Isaacs A, Aulchenko YS, Breteler MM, Ikram MA, Axenovich TI, Verbeek MM, van Swieten JC, Oostra BA, van Duijn CM (2012): Linkage analysis for plasma amyloid beta levels in persons with hypertension implicates Abeta‐40 levels to presenilin 2. Hum Genet 131:1869–1876. [DOI] [PubMed] [Google Scholar]
- Ikram MA, van der Lugt A, Niessen WJ, Koudstaal PJ, Krestin GP, Hofman A, Bos D, Vernooij MW (2015): The Rotterdam Scan Study: Design update 2016 and main findings. Eur J Epidemiol 30:1299–1315. [DOI] [PMC free article] [PubMed] [Google Scholar]
- Jahanshad N, Lee AD, Barysheva M, McMahon KL, de Zubicaray GI, Martin NG, Wright MJ, Toga AW, Thompson PM (2010): Genetic influences on brain asymmetry: A DTI study of 374 twins and siblings. Neuroimage 52:455–469. [DOI] [PMC free article] [PubMed] [Google Scholar]
- Jahanshad N, Kochunov PV, Sprooten E, Mandl RC, Nichols TE, Almasy L, Blangero J, Brouwer RM, Curran JE, de Zubicaray GI, Duggirala R, Fox PT, Hong LE, Landman BA, Martin NG, McMahon KL, Medland SE, Mitchell BD, Olvera RL, Peterson CP, Starr JM, Sussmann JE, Toga AW, Wardlaw JM, Wright MJ, Hulshoff Pol HE, Bastin ME, McIntosh AM, Deary IJ, Thompson PM, Glahn DC (2013): Multi‐site genetic analysis of diffusion images and voxelwise heritability analysis: A pilot project of the ENIGMA‐DTI working group. Neuroimage 81:455–469. [DOI] [PMC free article] [PubMed] [Google Scholar]
- Kochunov P, Glahn DC, Lancaster JL, Winkler AM, Smith S, Thompson PM, Almasy L, Duggirala R, Fox PT, Blangero J (2010): Genetics of microstructure of cerebral white matter using diffusion tensor imaging. Neuroimage 53:1109–1116. [DOI] [PMC free article] [PubMed] [Google Scholar]
- Kochunov P, Jahanshad N, Marcus D, Winkler A, Sprooten E, Nichols TE, Wright SN, Hong LE, Patel B, Behrens T, Jbabdi S, Andersson J, Lenglet C, Yacoub E, Moeller S, Auerbach E, Ugurbil K, Sotiropoulos SN, Brouwer RM, Landman B, Lemaitre H, den Braber A, Zwiers MP, Ritchie S, van Hulzen K, Almasy L, Curran J, deZubicaray GI, Duggirala R, Fox P, Martin NG, McMahon KL, Mitchell B, Olvera RL, Peterson C, Starr J, Sussmann J, Wardlaw J, Wright M, Boomsma DI, Kahn R, de Geus EJ, Williamson DE, Hariri A, van 't Ent D, Bastin ME, McIntosh A, Deary IJ, Hulshoff Pol HE, Blangero J, Thompson PM, Glahn DC, Van Essen DC (2015): Heritability of fractional anisotropy in human white matter: A comparison of Human Connectome Project and ENIGMA‐DTI data. Neuroimage 111:300–311. [DOI] [PMC free article] [PubMed] [Google Scholar]
- Kochunov P, Fu M, Nugent K, Wright SN, Du X, Muellerklein F, Morrissey M, Eskandar G, Shukla DK, Jahanshad N, Thompson PM, Patel B, Postolache TT, Strauss KA, Shuldiner AR, Mitchell BD, Hong LE (2016): Heritability of complex white matter diffusion traits assessed in a population isolate. Hum Brain Mapp 37:525–535. [DOI] [PMC free article] [PubMed] [Google Scholar]
- Koran ME, Thornton‐Wells TA, Jahanshad N, Glahn DC, Thompson PM, Blangero J, Nichols TE, Kochunov P, Landman BA (2014): Impact of family structure and common environment on heritability estimation for neuroimaging genetics studies using Sequential Oligogenic Linkage Analysis Routines. J Med Imaging (Bellingham) 1:014005. [DOI] [PMC free article] [PubMed] [Google Scholar]
- Kriegeskorte N, Simmons WK, Bellgowan PS, Baker CI (2009): Circular analysis in systems neuroscience: The dangers of double dipping. Nat Neurosci 12:535–540. [DOI] [PMC free article] [PubMed] [Google Scholar]
- Kuhn S, Musso F, Mobascher A, Warbrick T, Winterer G, Gallinat J (2012): Hippocampal subfields predict positive symptoms in schizophrenia: First evidence from brain morphometry. Transl Psychiatry 2:e127. [DOI] [PMC free article] [PubMed] [Google Scholar]
- Peper JS, Schnack HG, Brouwer RM, Van Baal GC, Pjetri E, Szekely E, van Leeuwen M, van den Berg SM, Collins DL, Evans AC, Boomsma DI, Kahn RS, Hulshoff Pol HE (2009): Heritability of regional and global brain structure at the onset of puberty: A magnetic resonance imaging study in 9‐year‐old twin pairs. Hum Brain Mapp 30:2184–2196. [DOI] [PMC free article] [PubMed] [Google Scholar]
- Polderman TJ, Benyamin B, de Leeuw CA, Sullivan PF, van Bochoven A, Visscher PM, Posthuma D (2015): Meta‐analysis of the heritability of human traits based on fifty years of twin studies. Nat Genet 47:702–709. [DOI] [PubMed] [Google Scholar]
- Roshchupkin GV, Adams HH, van der Lee SJ, Vernooij MW, van Duijn CM, Uitterlinden AG, van der Lugt A, Hofman A, Niessen WJ, Ikram MA (2016a): Fine‐mapping the effects of Alzheimer's disease risk loci on brain morphology. Neurobiol Aging 48:204–211. [DOI] [PubMed] [Google Scholar]
- Roshchupkin GV, Adams HHH, Vernooij MW, Hofman A, Van Duijn CM, Ikram MA, Niessen WJ (2016b): HASE: Framework for efficient high‐dimensional association analyses. Sci Rep 6. [DOI] [PMC free article] [PubMed] [Google Scholar]
- Sayed‐Tabatabaei FA, van Rijn MJ, Schut AF, Aulchenko YS, Croes EA, Zillikens MC, Pols HA, Witteman JC, Oostra BA, van Duijn CM (2005): Heritability of the function and structure of the arterial wall: Findings of the Erasmus Rucphen Family (ERF) study. Stroke 36:2351–2356. [DOI] [PubMed] [Google Scholar]
- Schmidt R, Lechner H, Fazekas F, Niederkorn K, Reinhart B, Grieshofer P, Horner S, Offenbacher H, Koch M, Eber B, Schumacher M, Kapeller PA, Freidl WC, Dusek T (1994): Assessment of cerebrovascular risk profiles in healthy persons: Definition of research goals and the Austrian Stroke Prevention Study (ASPS). Neuroepidemiology 13:308–313. [DOI] [PubMed] [Google Scholar]
- Schmidt R, Fazekas F, Kapeller P, Schmidt H, Hartung HP (1999): MRI white matter hyperintensities: Three‐year follow‐up of the Austrian Stroke Prevention Study. Neurology 53:132–139. [DOI] [PubMed] [Google Scholar]
- Schroeder C, Park MT, Germann J, Chakravarty MM, Michels L, Kollias S, Kroll S, Buck A, Treyer V, Savaskan E, Unschuld PG, Nitsch RM, Kalin AM, Hock C, Gietl AF, Leh SE (2016): Hippocampal shape alterations are associated with regional Abeta load in cognitively normal elderly individuals. Eur J Neurosci. [DOI] [PubMed] [Google Scholar]
- Seiler S, Pirpamer L, Hofer E, Duering M, Jouvent E, Fazekas F, Mangin JF, Chabriat H, Dichgans M, Ropele S, Schmidt R (2014): Magnetization transfer ratio relates to cognitive impairment in normal elderly. Front Aging Neurosci 6:263. [DOI] [PMC free article] [PubMed] [Google Scholar]
- Shen KK, Dore V, Rose S, Fripp J, McMahon KL, de Zubicaray GI, Martin NG, Thompson PM, Wright MJ, Salvado O (2016): Heritability and genetic correlation between the cerebral cortex and associated white matter connections. Hum Brain Mapp 37:2331–2347. [DOI] [PMC free article] [PubMed] [Google Scholar]
- Shrout PE, Fleiss JL (1979): Intraclass correlations: Uses in assessing rater reliability. Psychol Bull 86:420–428. [DOI] [PubMed] [Google Scholar]
- Smith SM, Jenkinson M, Woolrich MW, Beckmann CF, Behrens TE, Johansen‐Berg H, Bannister PR, De Luca M, Drobnjak I, Flitney DE, Niazy RK, Saunders J, Vickers J, Zhang Y, De Stefano N, Brady JM, Matthews PM (2004): Advances in functional and structural MR image analysis and implementation as FSL. Neuroimage 23 Suppl 1:S208–S219. [DOI] [PubMed] [Google Scholar]
- Stein JL, Medland SE, Vasquez AA, Hibar DP, Senstad RE, Winkler AM, Toro R, Appel K, Bartecek R, Bergmann O, Bernard M, Brown AA, Cannon DM, Chakravarty MM, Christoforou A, Domin M, Grimm O, Hollinshead M, Holmes AJ, Homuth G, Hottenga JJ, Langan C, Lopez LM, Hansell NK, Hwang KS, Kim S, Laje G, Lee PH, Liu X, Loth E, Lourdusamy A, Mattingsdal M, Mohnke S, Maniega SM, Nho K, Nugent AC, O'Brien C, Papmeyer M, Putz B, Ramasamy A, Rasmussen J, Rijpkema M, Risacher SL, Roddey JC, Rose EJ, Ryten M, Shen L, Sprooten E, Strengman E, Teumer A, Trabzuni D, Turner J, van Eijk K, van Erp TG, van Tol MJ, Wittfeld K, Wolf C, Woudstra S, Aleman A, Alhusaini S, Almasy L, Binder EB, Brohawn DG, Cantor RM, Carless MA, Corvin A, Czisch M, Curran JE, Davies G, de Almeida MA, Delanty N, Depondt C, Duggirala R, Dyer TD, Erk S, Fagerness J, Fox PT, Freimer NB, Gill M, Goring HH, Hagler DJ, Hoehn D, Holsboer F, Hoogman M, Hosten N, Jahanshad N, Johnson MP, Kasperaviciute D, Kent JW, Jr , Kochunov P, Lancaster JL, Lawrie SM, Liewald DC, Mandl R, Matarin M, Mattheisen M, Meisenzahl E, Melle I, Moses EK, Muhleisen TW, Nauck M, Nothen MM, Olvera RL, Pandolfo M, Pike GB, Puls R, Reinvang I, Renteria ME, Rietschel M, Roffman JL, Royle NA, Rujescu D, Savitz J, Schnack HG, Schnell K, Seiferth N, Smith C, Steen VM, Valdes Hernandez MC, Van den Heuvel M, van der Wee NJ, Van Haren NE, Veltman JA, Volzke H, Walker R, Westlye LT, Whelan CD, Agartz I, Boomsma DI, Cavalleri GL, Dale AM, Djurovic S, Drevets WC, Hagoort P, Hall J, Heinz A, Jack CR, Jr , Foroud TM, Le Hellard S, Macciardi F, Montgomery GW, Poline JB, Porteous DJ, Sisodiya SM, Starr JM, Sussmann J, Toga AW, Veltman DJ, Walter H, Weiner MW, Alzheimer's Disease Neuroimaging I, Consortium E, Consortium I, Saguenay Youth Study G, Bis JC, Ikram MA, Smith AV, Gudnason V, Tzourio C, Vernooij MW, Launer LJ, DeCarli C, Seshadri S, Cohorts for H, Aging Research in Genomic Epidemiology C, Andreassen OA, Apostolova LG, Bastin ME, Blangero J, Brunner HG, Buckner RL, Cichon S, Coppola G, de Zubicaray GI, Deary IJ, Donohoe G, de Geus EJ, Espeseth T, Fernandez G, Glahn DC, Grabe HJ, Hardy J, Hulshoff Pol HE, Jenkinson M, Kahn RS, McDonald C, McIntosh AM, McMahon FJ, McMahon KL, Meyer‐Lindenberg A, Morris DW, Muller‐Myhsok B, Nichols TE, Ophoff RA, Paus T, Pausova Z, Penninx BW, Potkin SG, Samann PG, Saykin AJ, Schumann G, Smoller JW, Wardlaw JM, Weale ME, Martin NG, Franke B, Wright MJ, Thompson PM, Enhancing Neuro Imaging Genetics through Meta‐Analysis (2012): Identification of common variants associated with human hippocampal and intracranial volumes. Nat Genet 44:552–561. [DOI] [PMC free article] [PubMed] [Google Scholar]
- Thompson PM, Cannon TD, Narr KL, van Erp T, Poutanen VP, Huttunen M, Lonnqvist J, Standertskjold‐Nordenstam CG, Kaprio J, Khaledy M, Dail R, Zoumalan CI, Toga AW (2001): Genetic influences on brain structure. Nat Neurosci 4:1253–1258. [DOI] [PubMed] [Google Scholar]
- Visscher PM, Medland SE, Ferreira MA, Morley KI, Zhu G, Cornes BK, Montgomery GW, Martin NG (2006): Assumption‐free estimation of heritability from genome‐wide identity‐by‐descent sharing between full siblings. PLoS Genet 2:e41. [DOI] [PMC free article] [PubMed] [Google Scholar]
- Visscher PM, Hill WG, Wray NR (2008): Heritability in the genomics era–concepts and misconceptions. Nat Rev Genet 9:255–266. [DOI] [PubMed] [Google Scholar]
- Visscher PM, Yang J, Goddard ME (2010): A commentary on 'common SNPs explain a large proportion of the heritability for human height' by Yang et al. (2010). Twin Res Hum Genet 13:517–524. [DOI] [PubMed] [Google Scholar]
- Voets NL, Hough MG, Douaud G, Matthews PM, James A, Winmill L, Webster P, Smith S (2008): Evidence for abnormalities of cortical development in adolescent‐onset schizophrenia. Neuroimage 43:665–675. [DOI] [PubMed] [Google Scholar]
- Vrooman HA, Cocosco CA, van der Lijn F, Stokking R, Ikram MA, Vernooij MW, Breteler MM, Niessen WJ (2007): Multi‐spectral brain tissue segmentation using automatically trained k‐Nearest‐Neighbor classification. Neuroimage 37:71–81. [DOI] [PubMed] [Google Scholar]
- Willer CJ, Sanna S, Jackson AU, Scuteri A, Bonnycastle LL, Clarke R, Heath SC, Timpson NJ, Najjar SS, Stringham HM, Strait J, Duren WL, Maschio A, Busonero F, Mulas A, Albai G, Swift AJ, Morken MA, Narisu N, Bennett D, Parish S, Shen H, Galan P, Meneton P, Hercberg S, Zelenika D, Chen WM, Li Y, Scott LJ, Scheet PA, Sundvall J, Watanabe RM, Nagaraja R, Ebrahim S, Lawlor DA, Ben‐Shlomo Y, Davey‐Smith G, Shuldiner AR, Collins R, Bergman RN, Uda M, Tuomilehto J, Cao A, Collins FS, Lakatta E, Lathrop GM, Boehnke M, Schlessinger D, Mohlke KL, Abecasis GR (2008): Newly identified loci that influence lipid concentrations and risk of coronary artery disease. Nat Genet 40:161–169. [DOI] [PMC free article] [PubMed] [Google Scholar]
- Willer CJ, Li Y, Abecasis GR (2010): METAL: Fast and efficient meta‐analysis of genomewide association scans. Bioinformatics 26:2190–2191. [DOI] [PMC free article] [PubMed] [Google Scholar]
- Winkler AM, Kochunov P, Blangero J, Almasy L, Zilles K, Fox PT, Duggirala R, Glahn DC (2010): Cortical thickness or grey matter volume? The importance of selecting the phenotype for imaging genetics studies. Neuroimage 53:1135–1146. [DOI] [PMC free article] [PubMed] [Google Scholar]
- Yang J, Benyamin B, McEvoy BP, Gordon S, Henders AK, Nyholt DR, Madden PA, Heath AC, Martin NG, Montgomery GW, Goddard ME, Visscher PM (2010): Common SNPs explain a large proportion of the heritability for human height. Nat Genet 42:565–569. [DOI] [PMC free article] [PubMed] [Google Scholar]
- Yang J, Lee SH, Goddard ME, Visscher PM (2011): GCTA: A tool for genome‐wide complex trait analysis. Am J Hum Genet 88:76–82. [DOI] [PMC free article] [PubMed] [Google Scholar]
- Yoon U, Perusse D, Lee JM, Evans AC (2011): Genetic and environmental influences on structural variability of the brain in pediatric twin: Deformation based morphometry. Neurosci Lett 493:8–13. [DOI] [PubMed] [Google Scholar]
- Zuk O, Hechter E, Sunyaev SR, Lander ES (2012): The mystery of missing heritability: Genetic interactions create phantom heritability. Proc Natl Acad Sci U S A 109:1193–1198. [DOI] [PMC free article] [PubMed] [Google Scholar]
- Zuk O, Schaffner SF, Samocha K, Do R, Hechter E, Kathiresan S, Daly MJ, Neale BM, Sunyaev SR, Lander ES (2014): Searching for missing heritability: Designing rare variant association studies. Proc Natl Acad Sci U S A 111:E455–E464. [DOI] [PMC free article] [PubMed] [Google Scholar]
Associated Data
This section collects any data citations, data availability statements, or supplementary materials included in this article.
Supplementary Materials
Supporting Information