

Abstract
Women with complete androgen insensitivity syndrome (CAIS) have a male (46,XY) karyotype but no functional androgen receptors. Their condition, therefore, offers a unique model for studying testosterone effects on cerebral sex dimorphism. We present MRI data from 16 women with CAIS and 32 male (46,XY) and 32 female (46,XX) controls. Methods: FreeSurfer software was employed to measure cortical thickness and subcortical structural volumes. Axonal connections, indexed by fractional anisotropy, (FA) were measured with diffusion tensor imaging, and functional connectivity with resting state fMRI. Results: Compared to men, CAIS women displayed a “female” pattern by having thicker parietal and occipital cortices, lower FA values in the right corticospinal, superior and inferior longitudinal tracts, and corpus callosum. Their functional connectivity from the amygdala to the medial prefrontal cortex, was stronger and amygdala‐connections to the motor cortex weaker than in control men. CAIS and control women also showed stronger posterior cingulate and precuneus connections in the default mode network. Thickness of the motor cortex, the caudate volume, and the FA in the callosal body followed, however, a “male” pattern. Conclusion: Altogether, these data suggest that testosterone modulates the microstructure of somatosensory and visual cortices and their axonal connections to the frontal cortex. Testosterone also influenced functional connections from the amygdala, whereas the motor cortex could, in agreement with our previous reports, be moderated by processes linked to X‐chromosome gene dosage. These data raise the question about other genetic factors masculinizing the human brain than the SRY gene and testosterone. Hum Brain Mapp 38:1801–1814, 2017. © 2017 Wiley Periodicals, Inc.
Keywords: disorders of sexual differentiation, gender, MRI, Y‐chromosome
INTRODUCTION
Despite a steadily increasing interest in sexual dimorphism of the human brain, our knowledge about the underlying mechanisms is still scant. It is an area that warrants further attention, considering that the vast majority of psychiatric disorders are characterized by a skewed sex distribution with regard to prevalence, age at onset, and symptom presentation [Young and Pfaff, 2014]. Many of these disorders affect the neuronal networks that process cognitive and emotional functions, and it is possible that inherent sex differences in these networks constitute vulnerability factors for disease development. Understanding the underpinnings of cerebral sex dimorphism may, therefore, provide us with important tools for identifying possible sex‐specific protective factors that could contribute to therapeutic improvement. Through brain imaging methods, sex differences have been shown in regard to cortical thickness [Good et al., 2001; Luders et al., 2006; Savic and Arver, 2014], and regional gray and white matter volumes [Goldstein et al., 2001; Good et al., 2001; Lentini et al., 2013; Nopoulos et al., 2000; Savic and Arver, 2011], and in subcortical volumes, namely larger volumes of the caudate and hippocampus in women, and larger putamen and amygdala volumes in men, [Filipek et al., 1994; Giedd et al., 1997; Goldstein et al., 2001; Lentini et al., 2013; Raz et al., 1995]. They have also been detected in neuronal connections, usually measured with diffusion tensor imaging (DTI), [Kanaan et al., 2012; Rametti et al., 2011; Takeuchi et al., 2013] and resting state PET and functional MRI [Erickson et al., 2005; Filippi et al., 2013; Kilpatrick et al., 2006; Kong et al., 2010; Savic and Lindstrom, 2008]. These differences cannot be attributed to differences in brain size [Luders et al., 2009] and are believed to be influenced by an intricate interplay between sex chromosome genes, sex hormones, and the external environment.
In the quest to distinguish between these etiological factors, studies of individuals with certain disorders of sex development (DSD), in which the development of chromosomal, gonadal, and/or anatomical sex is atypical [Hughes et al., 2012; McCarthy et al., 2012], can provide insights. Based on direct comparisons of cortical thickness (Cth) and gray matter volume (GMV) among 46,XX women, 46,XY men, and men with 47,XXY (Klinefelter syndrome), we recently put forward the hypothesis that programming of the motor cortex and the basal ganglia is influenced by processes linked to X‐chromosome inactivation escapee genes, which do not have Y‐chromosome homologs, whereas sex differences in the sensory cortices (the parietal and occipital corticesin particular) are inversely correlated to testosterone levels, [Savic and Arver, 2014]. These observations, together with corresponding data from women with the 45,X karyotype [Marzelli et al., 2011] who, like 46,XY men, have a thinner motor cortex, smaller nucleus caudate volumes, and larger amygdala volumes than 46,XX women, raise the interesting question as to whether Y‐chromosome genes have any masculinizing effect on the brain in addition to the effects mediated by testosterone and the genes involved in testis formation. To address this issue we chose to investigate individuals with complete androgen insensitivity syndrome (CAIS).
Women with CAIS have a 46,XY karyotype; they are born with testes that secrete male‐typical or elevated amounts of testosterone prenatally and postnatally because they lack functional androgen receptors due to mutations of the androgen receptor (AR) gene [Cheikhelard et al., 2009; Hughes et al., 2012; Quigley et al., 1995]. Individuals with CAIS are thus born with female external genitalia, develop a female phenotype, are reared as girls, and undergo a feminizing puberty as a result of the aromatization of their testosterone to estradiol [Cheikhelard et al., 2009]. Due to secretion of antimüllerian hormone (AMH) from the sertoli cells of the testes, female internal genitalia do not develop and no uterus is formed, and therefore CAIS is often presented as primary amenorrhea. Studies using quantitative measures of psychosexual development indicate that individuals with CAIS have a female gender identity, show female‐typical gender role behavior, and are most often androphilic (sexually attracted to men) [Koolschijn et al., 2014; Masica et al., 1971; Walhovd et al., 2010]; CAIS occurs in approximately 1–5 per 100,000 births [Mendoza and Motos, 2013].
Comparisons among women with CAIS, 46,XY males, and 46,XX female controls provide a unique opportunity to study the separate effects of testosterone and sex chromosome genes on the sexual differentiation of the brain.
We investigated this, using MR measurements of cortical thickness (Cth) and subcortical structural volumes. We also carried out DTI of fractional anisotropy (FA) indexing structural (axonal) connections in the brain, and resting state fMRI indexing cerebral functional connections. Sex differences have been reported in all these metrices, but the underpinnings of these differences may vary with the specific metric, and also between different neuronal networks. To better understand these complex interactions, multimethodological investigations of the same study groups would therefore be required, which are scarce in the literature, especially for populations with rare conditions. Based on previous studies suggesting pruning effects of testosterone [Fernandez et al., 2003; Rasgon et al., 2005], and its stimulating effect on white matter tracts [Rametti et al., 2012; van Hemmen et al., in press], we hypothesized that Cth of the parietal lobe (and probably also the occipital lobe) would be greater in both 46,XX women and women with CAIS, whereas the FA values in the long white matter tracts (the corticospinal tract, superior and inferior longitudinal fascicle, the fronto‐occipital fascicle, and perhaps also the corpus callosum [CC]) would be lower compared to 46,XY men. Given our previous comparative studies between XXY men and controls suggesting that both testosterone and X‐chromosome gene dosage could influence the amygdala [Savic and Arver, 2014], it was an open question as to whether the limbic and paralimbic networks would be affected by testosterone. This also applied to the caudate and putamen volumes for which we did not have a primary hypothesis.
METHODS
The major demographic data are presented in Tables 1 and 2. Altogether, 16 CAIS women (30 ± 10 years) were investigated together with 32 male (30 ± 6 years) and 32 female (29 ± 6 years) controls. Participants reported no history of a serious medical or neurological disease or MRI contraindications. Three women with CAIS had psychiatric comorbidity diagnosed at the time of the study (three had bipolar disorder diagnoses, one of them also ADHD, another also autism spectrum disorder). Three women with CAIS, three female controls, and two male controls were left‐handed, all the others were right‐handed. There was no significant group difference with respect to handedness (Chi Square 1.88, df 2 P = 0.392). All controls were heterosexual (scored Kinsey 0‐1) according to Kinsey's Heterosexual/Homosexual Scale [Berglund et al., 2006; Kinsey et al., 2003; Savic and Lindstrom, 2008]. Two women with CAIS considered themselves bisexual (Kinsey 3); the other fourteen were heterosexual (Kinsey 0‐1), Table 1. The women with CAIS were recruited from tertiary clinics in Sweden, mainly the Department of Obstetrics and Gynaecology, Karolinska University Hospital, Stockholm. The controls were recruited from the local community. The CAIS diagnosis was based on clinical characteristics, endocrine evaluations, karyotype, and mutation analysis of the androgen receptor gene. In 2 of the 16 participants, the clinical presentation was in accordance with CAIS, but no androgen receptor gene mutation could be detected. Since there is a small increased risk of gonadal tumors associated with CAIS [Peper et al., 2013], many patients undergo prophylactic gonadectomy. In the present study, 12 women had been gonadectomized and all of these were undergoing estrogen replacement therapy, of which some used oral contraceptives (Tables 1 and 2). Two patients had been diagnosed at birth, 2 at the ages of 23 and 26, respectively, while the remaining 12 were diagnosed in their late teenage years (range 16–19 years) due to primary amenorrhea.
Table 1.
Demography
| Women with CAIS, N=16 | Male controls, N=32 | Female controls, N=32 | |||||||
|---|---|---|---|---|---|---|---|---|---|
| Mean | Sd | Mean | Sd | Mean | Sd | ||||
| Age | 30.10 | 9.81 | 29.52 | 5.81 | 29.12 | 5.51 | |||
| Yrs of education | 13.41 | 1.90 | 16.11 | 2.12 | 16.20 | 2.80 | |||
| Kinsey score | 1.71 | 0.81 | 0.50 | 0.85 | 0.51 | 0.60 | |||
| R 2D:4D ratio* | 0.99 | 0.03 | 0.97 | 0.03 | 0.98 | 0.05 | |||
| L 2D:4D ratio | 1.00 | 0.02 | 0.98 | 0.03 | 0.99 | 0.03 | |||
*significant group difference, P = 0.003, F = 4.1, one‐way ANOVA factoring for subject group. This difference was constituted by the higher 2D:4D ratios in women with CAIS and female controls compared to male controls. No significant group differences were detected for other demographic measures, including the left‐hand 2D:4D ratio.
Table 2.
Women with CAIS, clinical data
| Patient | AR mutation | Gonadectomy | Hormone treatment | Testosterone nmol/l | Estradiol pmol/l |
|---|---|---|---|---|---|
| 1 | Yes | No | No | 13 | <150 |
| 2 | Yes | Yes | Oral estradiol 2 mg | 0.9 | <150 |
| 3 | Yes | Yes | Combined oral contraceptive | 0.7 | <150 |
| 4 | No | Yes | Transdermal estradiol (patch) 100 microgram | 0.9 | 416 |
| 5 | No | No | No | 10 | <150 |
| 6 | Yes | Yes | Transdermal estradiol (gel) 1 mg | <0.4 | <150 |
| 7 | Yes | Yes | Oral estradiol 2 mg | 0.4 | 186 |
| 8 | Yes | Yes | Oral estradiol 2 mg | <0.4 | 331 |
| 9 | Yes | No | Oral estradiol 2 mg | 28 | 217 |
| 10 | Yes | Yes | Oral estradiol 2 mg | 1.1 | 277 |
| 11 | Yes | Yes | Oral estradiol 2 mg | 0.7 | 414 |
| 12 | Yes | Yes | Combined oral contraceptive | <0.4 | <150 |
| 13 | Yes | Yes | Oral estradiol 2 mg | 0.9 | 310 |
| 14 | Yes | Yes | Oral estradiol 2 mg | 0.5 | <150 |
| 15 | Yes | No | No | 15 | <150 |
| 16 | Yes | Yes | Oral estradiol 2 mg | not available | not available |
AR = androgen receptor.
All of the control women reported having a regular menstrual cycle and did not use hormonal contraceptives, and their study participation took place during the 1–7 day period following the onset of their menstruations, when estradiol levels are low. The study was approved by the Medical Ethical Committee of the Karolinska Institutet in Stockholm (Ref no 2008/1671‐31/3, 2010/1874‐32), and all subjects gave their written informed consent.
Hormone Assessment
Measurements of estradiol and testosterone in serum were performed as part of the routine clinical evaluation. Serum estradiol was determined by radioimmunoassay (Orion Diagnostica AB) and serum testosterone by direct chemiluminescent immunometric assay (Siemens Medical Solutions) at the Department of Clinical Chemistry, Karolinska University Hospital. Hormone measures were carried out in women with CAIS and are presented in Table 2.
The control men had normal testosterone levels as measured in saliva for another study [Savic, 2015]. For the control women hormone measurements were not performed since they all had regular menstruation as indication of normal sex hormone production.
Measurements of Digit Ratios
Considering that 2D:4D digit ratios have been found to relate to effects of prenatal exposure to testosterone [Manning et al., 1998], 2D:4D measurements were taken of both hands using a steel vernier caliper. The measurements were carried out directly on the fingers, on the ventral side of the hand between the basal crease and the fingertip [Ciumas et al., 2009; Lutchmaya et al., 2004; Manno, 2008]. The 2D:4D ratios were independently measured by 2 raters, and the inter‐rater correlation was calculated with linear regression (Pearson's coefficient).
Magnetic Resonance Imaging
Data acquisition
Magnetic resonance imaging data was acquired on a 3‐Tesla MRI medical scanner (Discovery 3T GE‐MR750, General Electric, Milwaukee, Wisconsin) equipped with a 32‐channel and/or 8‐channel phased array receiving coil. 3D T1‐weighted SPGR images were acquired with 1 mm3 isotropic voxel size (TE = 3.1 ms, TR = 7.9 ms, TI = 450 ms, FoV = 24 cm, 176 axial slices, flip angle of 12 deg.). Resting state functional MRI was performed with a gradient echo pulse sequence using a voxel size of 2.25 × 2.25 × 3 mm, (TE = 30 ms, TR = 2,500 ms, FoV = 28.8 cm, 45 bottom up interleaved axial slices, 3 mm thickness, flip angle of 90 deg.). During the acquisition of the resting state fMRI, that lasted for 8 min, the subjects were instructed to keep their eyes closed, let the mind wander, not fall asleep, and not try to solve problems. An assistant was in the scanner making sure that the subject was not sleeping. In addition, multislice DTI was performed using an echo planar imaging sequence with 1 × 1 mm in‐plane resolution, [FoV = 24 cm, 60 interleaved axial slices, thickness = 2.9 mm, TE = 83 ms, TR 8,000 ms, 60 diffusion gradient directions (b = 1,000), flip angle of 90 deg.]. Finally, clinical sagittal FLAIR images were taken (TE/TR = 126.3/6,000, TI = 1,863, ETL = 140, ARC acceler. R = 2 × 2 (slice, phase), FoV = 24 cm, 512 × 512, slice thickness = 1.2 mm). Images acquired with the 8‐channel coil were used only for the FreeSurfer segmentation analyses (see below) because these T1 images had better demarcation between white and gray matter in the occipital cortex than T1 images acquired with the 32‐channel coil.
Cortical thickness and gray matter volume
The MR volumes were processed using FreeSurfer software version 5.1 [Fischl and Dale, 2000], (http://www.surfer.nmr.mgh.harvard.edu), as described in detail in our previous studies [Savic, 2015; Savic and Arver, 2014]. Briefly, a calculation of surface‐based anatomical measures was produced by reconstructing models of white matter (WM) and gray matter (GM) surfaces from MR volumes. The reconstruction of the MRI images was inspected visually after the Talairach transformation, after the skull striping, and after the surfaces had been built and the volumes labeled. Necessary corrections were made after each inspection, including correcting erroneous skull striping by adjusting watershed parameters or manually editing out the skull tissue and adding control points to normalize intensity for erroneous WM surface reconstruction.
Possible group differences in Cth were evaluated for each vertex, using age as the nuisance variable, and employing a 15 mm filter to increase the sensitivity, given the restricted population of CAIS women. P was set to <0.05 corrected after Monte Carlo correction for multiple comparisons (5,000 permutations). Because the groups were matched for age and education, none of these factors were used as a nuisance covariate, and group comparisons were carried out using a different‐offset‐same‐slope (DOSS) model in the qdec statistics.
Segmentation of the subcortical volumes
Subcortical segmentation generated with FreeSurfer was used to calculate the volumes of four subcortical structures—the amygdala, hippocampus, caudate, and putamen. Each of these structural volumes has in several previous studies been found to differ between men and women [Raz et al., 2005; Savic and Arver, 2011]. Manual correction by a rater (especially with regard to the putamen and amygdala) is often needed when using FreeSurfer segmentation. Manual correction by a rater who was not informed about the identities of the subjects was done in the present study with respect to images from three CAIS women and six controls. The standard procedure used has been described in detail previously [Fischl et al., 2002, 2004; Savic, 2015]. Group comparisons were based on the relative structural volumes (structure/ICV), using one‐way ANOVA, P < 0.05 with Scheffe's post hoc test. With Bonferroni correction for the eigth comparisons the significance level was 0.006. The aforementioned analyses were carried out with PASW Statistics 21 (SPSS Inc., Chicago, IL).
Resting state functional MRI, seed region analysis
Analysis of resting‐state functional connectivity is a useful approach for assessment of functional brain organization. Connectivity maps of functional networks can be derived from the computing of correlations between the intrinsic activity fluctuations in seed regions of interest and the rest of the brain or, exploratively, between all voxels in the brain. Sex differences have been demonstrated in the amygdala connections [Kilpatrick et al., 2006; Savic and Lindstrom, 2008], and therefore, it was of interest to use the amygdala as seed region in the functional connectivity analysis and evaluate if women with CAIS in this respect followed the male or female pattern. In addition, sex differences have been reported in the so‐called default mode network (DMN), which is active when the brain rests [Greicius et al., 2003], and which in some studies showed greater resting state connectivity in 46,XX women than 46,XY men in a cluster located in the precuneus and posterior cingulate cortex [Erickson et al., 2005; Zhang and Li, 2012]. We, therefore, carried out seed region analysis from the right and left amygdala seeds. In addition, we used the model‐free independent component analysis (MELODIC) for the DMN. Amygdala seeds were defined as spheres with 5 mm radii and coordinates of −24, −7, −19 and 24, −7, −19, covering the entire amygdala with the exception of the most medial 4 mm, the basomedial amygdala, which was excluded to avoid the susceptibility artifact that was detected in some subjects.
Spatial preprocessing and statistical analysis of functional images were performed using SPM8 (Welcome Department of Cognitive Neurology), as described in some of our previous studies [Golkar et al., 2014; Manzouri et al., in press]. Group differences were tested with one‐way ANOVAs, voxel threshold P < 0.001, FWE corrected at cluster level, and P < 0.05.
For calculations with independent component analysis using MELODIC, the data were, after initial preprocessing with SPM8 (Welcome Department of Cognitive Neurology), analyzed in FSL software v5.0 (FMRIB Software Library, Oxford, http://fsl.fmrib.ox.ac.uk/), using a high‐pass filter at 100 s before running individual independent component analyses (ICA), [Beckmann and Smith, 2004], (Multivariate Exploratory Linear Decomposition into Independent Components, Version 3.14), with automatic determination of dimensionality. The resulting component maps were then manually classified into components of interest and nuisance components in accordance with the criteria proposed in Kelly et al. [2010]. The components marked as nuisance were subsequently regressed out of the original dataset using fsl_regfilt. Further preprocessing information is presented as Supporting Information.
Group concat‐ICA was then performed on the whole cleaned dataset, resulting in 22 components. These components were used to run dual regression analysis, and the resulting general linear model (GLM) parameter estimate images were fed into FSL's Randomise tool for nonparametric permutation inference to test the separate hypotheses about differences in connectivity within the DMN among groups. As we did not have an a priori hypothesis for the other components they were not used in the further analysis for the present publication. The design included using mean DVARS (Root Mean Square intensity difference of volume N to volume N + 1), [Power et al., 2012], which indexes effects of motion, as a nuisance covariate. Results are reported at a threshold of FWE corrected P < 0.05, (using masks as described by Feusner and Savic) [Feusner et al., 2016].
DTI analysis
DTI is used to examine the integrity of white matter tracks. DTI techniques utilize the magnetic resonance signal to visualize water movement within axons, which can help characterize axonal microstructure. Information about the diffusion of water is considered anisotropic because it is directionally along the parallel axis of axons [Basser and Jones, 2002]. Fractional anisotropy was used as an index for axonal connectivity. FA yields values between 0 (isotropic diffusion: diffusion that is equal in all directions) and 1 (maximum anisotropic diffusion—the hypothetical case of diffusion along one axis). Data were analyzed in a standardized way using the FMRIB's Diffusion Toolbox implemented in FSL v5.0 (FMRIB Software Library, Oxford, http://fsl.fmrib.ox.ac.uk/) and a group‐wise mean FA white matter skeleton.
Diffusion images were first corrected for (motion) artifacts and eddy current distortions using DTIPrep [Oguz et al., 2014]. They were then realigned by means of DTIfit, which is part of the FMRIB's Diffusion Toolbox. Nonbrain tissue was removed with BET (part of FSL). Finally, a tensor model was fitted to the diffusion data, defining the eigenvalues of the tensor for each voxel and calculating individual FA maps. All subjects' FA maps were registered to the FMRIB58_FA template, and then transformed to MNI152 space. The normalized individual FA maps were averaged to create a group‐wise mean FA white matter skeleton. A threshold of 0.2 was applied to reduce partial volume effects. Finally, the individual aligned FA images were projected onto the mean FA skeleton for subsequent voxel‐wise statistical analyses with Tract‐Based‐Spatial Statistics (TBSS) and using the Randomise Tool (part of FSL).
Between‐group differences were tested using Randomise, permutation‐based nonparametric testing (5,000 permutation) and by applying the Threshold‐Free Cluster Enhancement option, with a cluster threshold of P = 0.01 and a minimal cluster size of 20 voxels. Results were considered significant at pFWE < 0.05, (family wise error corrected). Cluster locations were identified using the JHU White Matter Tractography atlas and JHU ICBM‐DTI‐81 white matter labels [Hua et al., 2009; Mori et al., 2008].
RESULTS
Considering the rarity of the CAIS condition, and because all women with CAIS were asymptomatic at the time of inclusion, we decided to carry out group comparisons both with and without the data of the three CAIS subjects who had comorbidity with autism spectrum disorder, ADHD, and/or bipolar disorder.
Female controls and women with CAIS had significantly higher right 2D:4D ratios compared to male controls, P = 0.003 (one‐way ANOVA, and Scheffe's post hoc analysis showing differences between males and both women with CAIS at P = 0.003 and female controls at P = 0.004; Tables 1 and 2). The inter‐rater correlation was 0.87 for the right 2D:4D and 0.85 for the left 2D:4D.
Sexual orientation according to the Kinsey scoring was not significantly different among women with CAIS compared with controls, (Table 1).
Cortical Thickness
As could be predicted according to previous observations regarding cortical modulation by testosterone [Lentini et al., 2013; Savic and Arver, 2014], both women with CAIS and female controls displayed thicker parietal and occipital cortices, and thinner left temporal cortex than male controls. Congruent with our prediction from these previous studies women with CAIS also displayed, a “male” pattern, characterized by a significantly thinner cortex in the precentral gyrus, and to some extent, postcentral gyrus compared to female controls, but similar values as male controls (Fig. 1, Table 3).
Figure 1.
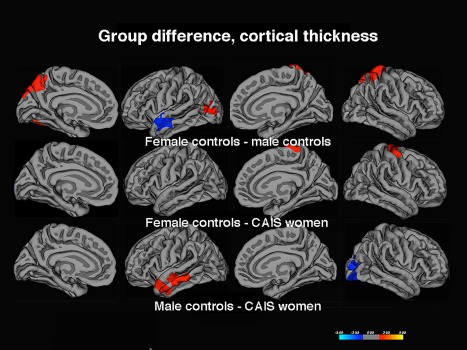
Group difference in Cth. The contrasts were calculated at P < 0.05, FWE corrected for multiple comparisons (Monte Carlo permutation). The projection of cerebral hemispheres (MR images of the FreeSurfer atlas) is standardized. Scale is logarithmic and shows –log10(P), with cool colors indicating negative contrast (lower values in male controls, women with CAIS), and warm colors positive contrast.
Table 3.
Clusters showing significant group differences in cortical thickness
| Cluster |
Female controls–male controls (positive ‐log10(p) values) Male controls–Female controls (negative ‐log10(p) values) |
Female controls–CAIS women (positive ‐ log10 (p) values) CAIS women–Female controls (negative ‐ log10(p) values) |
Male controls–CAIS women (positive ‐log10 (p) values) CAIS women–Male controls (negative ‐log10(p) values) |
|||||||
|---|---|---|---|---|---|---|---|---|---|---|
|
Maximum vertex‐wise −log10(p) |
Cluster size, cm^2 | Talairach Coordinates | Maximum vertex‐wise −log10(p) |
Clustersize, cm^2 |
Talairach Coordinates | Maximum vertex‐wise −log10(p) | Cluster size, cm^2 | Talairach Coordinates | ||
| R precentral cortex | 4.2 | 18.47 | 26 −17 62 | |||||||
| R lateral occipital cortex + part of parietal cortex | −2.2 | 19.4 | 28 −82 13 | |||||||
| L superior + middle temporal cortex | −2.2 | 11.7 | −60 −20 −19 | 2.2 | 21.7 | −62 −19 −14 | ||||
| L lateral occipital cortex | 2.1 | 30.1 | −44 −75 0 | |||||||
|
R superior parietal cortex,incl. part of the precentral gyrus and postcentral gyrus |
3.9 | 18.8 | 16 −47 57 | |||||||
Clusters calculated at P < 0.05, corrected for multiple comparisons (Monte Carlo permutations), using a 15 mm filter. The Talairach coordinates indicate location of maximum group difference; the “Region” column describes the coverage of the respective cluster.
R= right; L = left.
Rerunning the analyses after excluding the three patients with psychiatric comorbidities did not change the results.
Subcortical Volumes
Both relative caudate volumes were significantly smaller in women with CAIS compared to female controls, and similar to those of male controls—thus, in this respect, CAIS women showed a male pattern. Also, their ICV was significantly larger than in female controls, and similar to that of male controls (Table 4). However, the relative hippocampus volumes were in the range of female controls and significantly larger than in male controls. No group differences were detected for the relative amygdala volumes, or the putamen volumes [the latter tended to be larger in women with CAIS compared to male controls (P = 0.051 and P = 0.047 for the right and left side, respectively)], but not female controls); see Table 4. Thus, a mixed female and male pattern was found, with the latter primarily being related to parts of the motor networks.
Table 4.
Structural volumes
|
Structural Volumes (cm3) |
Male controls N=32 |
Female controls N=32 |
Women with CAIS N=16 |
P‐ and F‐values |
|---|---|---|---|---|
| L caudate | 4.2 ± 0.5 | 4.0 ± 0.4 | 3.9 ± 0.6 | P=0.003 F=6.4a, b |
| R caudate | 4.2 ± 0.6 | 4.1 ± 0.4 | 4.0 ± 0.6 | P=0.001 F=8.1a, b |
| L putamen | 5.4 ± 0.6 | 4.9 ± 0.6 | 5.6 ± 0.6 | P=0.051 F=2.9 |
| R putamen | 5.1 ± 0.6 | 4.8 ± 0.6 | 5.4 ± 0.6 | P=0.047 F=4.3 |
| L hippocampus | 4.2 ± 0.4 | 4.0 ± 0.44.2 ± 0.3 | 4.5 ± 0.5 | P=0.002 F=7.0b, c |
| R hippocampus | 4.4 ± 0.4 | 4.6 ± 0.4 | P=0.001 F=7.7b, c | |
| L amygdala | 1.9 ± 0.3 | 1.7 ± 0.2 | 1.9 ± 0.2 | P=0.183 F=0.8 |
| R amygdala | 2.0 ± 0.3 | 1.8 ± 0.2 | 2.0 ± 0.3 | P=0.154 F=0.3 |
| TIV | 1,639.9 ± 126.1 | 1,440.6 ± 123.5 | 1,574.2 ± 260.7 | P=0.000 F=15.1b,c |
TIV = total intracranial volume; P‐values for structural volumes were based on calculations of ratios between the respective structural volume and the TIV. Women with CAIS and control women showed larger relative hippocampus volumes than control men. However, the relative volumes of caudate nucleus were significantly smaller in women with CAIS as well as in male controls compared with female controls.
The P‐ and F‐values are for the overall group analysis. Denoting significant differences calculated with Scheffe's post hoc test, the significance level was 0.006 (Bonferroni correction was employed for multiple comparisons, eigth regions).
Significant difference between women with CAIS and female controls.
Significant difference between control men and women.
Significant difference between women with CAIS and male controls.
Bold text indicates regions in which women with CAIS differ from female controls.
DTI
At pFWE < 0.05, a large cluster emerged with significantly higher FA values in 46,XY men than the 46,XX women. Specifically, 46,XY men showed higher FA bilaterally in the internal capsule, the forceps major and minor, in the superior and anterior corona radiata, the superior and inferior longitudinal fascicle, and in the genu, body, and splenium of the CC. Overlapping clusters showing lower FA in both female groups compared to the male group (46,XY > 46,XX and 46,XY > CAIS women) were detected in posterior portions of the superior and inferior longitudinal fascicles particularly on the right side, in the right capsula interna, and the splenium CC (Fig. 2). Also the uncinate fascicle (again, right > left) showed lower FA values in both female groups, compared to 46,XY men, suggesting that testosterone has a major impact on masculinization of these tracts. Conversely, and similar to the finding for motor cortex thickness, the body of CC, which connects the two hemispheres' motor cortices, showed in women with CAIS similar FA values to the male controls (46,XY men), and higher FA values than in female controls (46,XX women), when lowering the significance threshold to 0.1, FWE corrected (Fig. 2). There were no tracts with higher FA in women with CAIS than in male controls and no other tracts with different FA values between the two groups of females. The similarity between women with CAIS and female controls was, thus, most pronounced in the superior and inferior longitudinal tract and the parts of the corticospinal tracts on the right side, posterior limb of the internal capsule.
Figure 2.
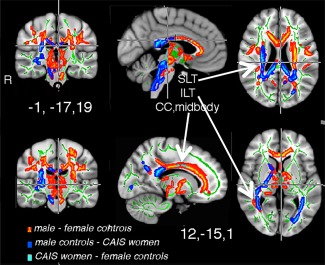
Group difference in FA. The differences are illustrated in red–yellow and superimposed on the group skeleton (green). These clusters were calculated at P < 0.05, FWE corrected for multiple comparisons. Both female groups differed from male controls. The difference in forceps major and ACC was significant only when contrasting data between male and female controls, however, a similar cluster appeared also when contrasting FA from male controls and women with CAIS (males‐CAIS women), but only when changing the threshold level to P < 0.1, FWE corrected). At P < 0.1, FWE corrected there was also a CC cluster, indicated in light blus, when contrasting female controls‐women with CAIS. MNI co‐ordinates are indicated for the two sets of images.
Rs‐fMRI
The DMN network patterns showed significantly greater functional connections in the posterior cingulate and precuneus in both 46,XX women (MNI co‐ordinate 9,−45,24) and CAIS women (co‐ordinate 2, −33, 24) in relation to 46,XY men (Fig. 3). Likewise, in CAIS women and 46,XX women, the left amygdala connections to the anterior and posterior cingulate were significantly stronger than in 46,XY men, as were the connections between the right and left amygdala (Table 5). 46,XY men showed, conversely, stronger right and left amygdala connections to the motor cortex and insular cortex in comparison to both female populations (Table 5, Fig. 3). There were no regions in which functional connections in 46,XX women differed from women with CAIS.
Figure 3.
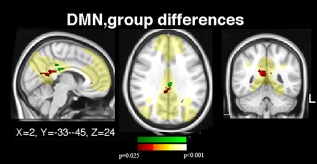
Group difference, in rs‐fMRI, default mode network (DMN). Significant group differences in resting state functional connections within the default mode network (indicated in yellow), which was used as a mask, are shown. Differences between female and male controls in the precuneus are indicated in red–yellow; the corresponding cluster from the CAIS women–male controls contrast is indicated in green. Clusters calculated at P < 0.05, FWE corrected. MNI co‐ordinates for the two clusters are indicated.
Table 5.
Group differences in fMRI connectivity patterns from the amygdala seed regions
| Regions showing significant connection with the respective seed region | Male controls–CAIS women | Male controls–Female controls | |||||
|---|---|---|---|---|---|---|---|
| Seed region |
Peak Z‐level |
Sizecm3 |
Coordinates |
Peak Z‐level |
Sizecm3 |
Coordinates | |
| L amygdala | |||||||
| ACC | −4.9 | 3.2 | −10 32 −11 | ||||
| R putamen | 4.4 | 4.4 | 0 33 23 | ||||
| R caudate | 4.4 | 1.1 | 24 −1 16 | ||||
| Parts of motor cortex | 4.2 | 2.4 | 44 −31 38 | ||||
| R amygdala | |||||||
| L amygdala | −4.2 | 3.1 | −32 0 −24 | ||||
| ACC | −4.7 | 4.3 | −4 10 4 | ||||
| L insular + motor cortex | 4.3 | 1.2 | −33 −4 10 | ||||
Clusters were detected at P < 0.05, FWE corrected at cluster level, cluster denoted in italics are calculated at P < 0.1 FWE. There were no significant differences between female controls and women with CAIS. Negative z‐values indicate the reversed contrast.
ACC = anterior cingulate cortex.
Post Hoc Analyses
Two women with CAIS had comorbity with bipolar disorder, one of them was also diagnosed with ADHD and another one had autism spectrum disorder. These comorbide conditions may affect the FA and the caudate volumes. Therefore, the group comparison of FA and the caudate volumes were rerun without the CAIS individuals with psychiatric diagnoses. However, the results with smaller caudate volume as well as the lower FA values in CC remained.
DISCUSSION
The present study utilized DTI and resting state fMRI along with FreeSurfer measurements of Cth and sexually dimorphic structural volumes in an attempt to tease out the possible effects of testosterone and Y‐chromosome genes on masculinization of the human brain. Specific attention was therefore paid to regions and metrices that have shown sex differences in previous MRI studies, but for which the developmental mechanisms are still uncertain. This inquiry is of general interest given the current view that perception of one's sex is linked to sexual differentiation of the brain. Our primary hypothesis was that potential similarities between women with CAIS and female controls, and shared differences in relation to male controls, would mainly reflect the effects of testosterone, whereas possible similarities between women with CAIS and 46,XY men would point to an effect of Y‐chromosome genes (other than the SRY gene for testis formation and testosterone production) or reflect processes linked to X‐chromosome inactivation escapee genes which do not have Y‐chromosome homologues. The results indeed show considerable support for these hypotheses: (1) women with CAIS displayed a “female” pattern with respect to Cth in the occipital, temporal, and parietal occipital lobes, with respect to FA values (except for the midbody of CC), subcortical volumes (with exception for the caudate volume), and functional connections from the amygdala, and in the DMN. (2) Women with CAIS showed a “male” pattern along the motor networks, with a thinner motor cortex, greater midcalosal FA, and smaller caudate volumes compared to female controls but not male controls.
Sex Hormone Effects
Our results support the notion that testosterone has significant effects on cerebral structure. They accord with earlier observations of inverse correlations between partietal and occipital Cth and testosterone levels [Bramen et al., 2012; Nguyen et al., 2013a; Nopoulos et al., 2000; Savic and Arver, 2014], which were explained by the pruning effects of testosterone on cortical neurons. Because androgen receptors are expressed particularly in the parieto‐occipital lobe [Abdelgadir et al., 1999; Goldstein et al., 2001; Simerly et al., 1990], testosterone effects on Cth are expected primarily in these regions. The present results suggest that testosterone also has effects on structural connections, indexed by FA values, which were higher in male controls, particularly in the long tracts—the cortico‐spinal tract and the superior and inferior longitudinal tracts, and the CC. Notably, women with CAIS displayed lower FA values compared to 46,XYmen despite having similar intracranial volumes (ICV; Table 4). Testosterone's stimulating effects on the white matter have been reported previously [Rametti et al., 2012; van Hemmen et al., in press], although some found also a negative association between testosterone levels and white matter integrity [Peper et al., 2015; Rametti et al., 2012; van Hemmen et al., in press]. A finding especially interesting from a behavioral perspective, was that functional connections between the amygdala and the ACC were stronger among women with CAIS (and female controls) compared to male controls. These connections are essential for emotional perception and modulation, they are reported to differ between men and women [Savic and Lindstrom, 2008; Wolk et al., 2010] and seem to be moderated by both testosterone and estrogen [Price et al., 2016]. Administration of testosterone to middle‐aged women diminished orbitofrontal cortex activity and its effective connectivity with the amygdala during a matching task using angry and fearful faces [Ducharme et al., 2016]. Administration of estrogen to postmenopausal women, conversely, is reported to increase the amygdala–PFC connectivity [Weaver et al., 2014], and these connections are found to be stronger in women with higher estrogen levels [Nguyen et al., 2013b]. The women with CAIS in this study had low to moderate estrogen levels and also no effect of testosterone. The present findings, thus, accord with the view that the amygdala prefrontal connections are moderated by both estrogen and testosterone, and add to the discussion about the underpinnings of sex differences in regard to these neuronal connections that are important for emotional and stress‐related processes. In line with some reports on sex hormonal effects during pubertal development [Herting et al., 2015; Peper et al., 2009] it is also possible that estrogen influenced the thickness of the left temporal, cortex, which was smaller in CAIS women and female controls than in male controls.
Sex Chromosome Gene Effects
A less predicted finding in the present study relates to the observed “masculine pattern” in several nodes of the motor network. That the motor cortex of women with CAIS was thinner than in control women and similar to that of control men is congruent with our hypothesis, based on studies of 47,XXY men, that the motor cortex is coded by X‐chromosome genes, [Lentini et al., 2013; Marzelli et al., 2011; Savic and Arver, 2014]. More difficult to attribute to X‐chromosome gene dosage are the results of caudate measures, because this structure is found to be smaller in women with 45,X0 as well as in men with 47,XXY compared to sex matched controls, thus, independently of the number of X‐chromosomes [Marzelli et al., 2011; Savic and Arver, 2014]. The relative volume of the caudate is usually larger in females compared to male controls [Raz et al., 1995], a gender difference that seems to be present already before puberty [Giedd et al., 1997], but which, according to some [Herting et al., 2012; Mukherjee et al., 2012; Nguyen et al., 2013a; Nopoulos et al., 2000] but not all data [Koolschijn et al., 2014], also undergoes pubertal changes. The present data, with similar caudate volumes in male controls and women with CAIS, indicates that there was no major effect of testosterone. An alternative mechanism would be SRY‐independent Y‐chromosome gene mediated processes, indeed suggested by animal data, the four core genotype model in rats, which creates XX “males” and XY “females” [Arnold and Chen, 2009]. Overall, the present data, together with other recent studies [Savic and Arver, 2014] of rare conditions in humans such as sex chromosome aneuploidy provide important complement to the initial seminal studies of the 4 core genotype model emphasizing that brain sex differences stem from a complex mix of both hormonal and genetic mechanisms. Additional investigations in humans are, however, needed to further disentangle the specific biological underpinnings of sex differences, for example in the caudate volumes.
Methodological Considerations
Although the size of the study group was limited, due to the rarity of the condition, the results were detected at the ususal significance thresholds. Furthermore, the results corroborate with previous findings about testosterone effects [Rey et al., 2016], even though the contexts and design models were different [Rametti et al., 2012]. An additional complication was that three women with CAIS were diagnosed with bipolar disorder (one of them also had ADHD, and one had autism spectrum disorder). These comorbidities are primarily critical for the interpretation of findings related to caudate volume and FA values in CC, both reported to be reduced in ADHD [Castellanos, 2002; Frodl and Skokauskas, 2012]. However, the smaller caudate volume as well as the lower FA values in CC remained when rerunning group comparisons without the CAIS individuals with psychiatric diagnoses. As for comorbidity with bipolar disorder, a bias would be expected foremost along the limbic networks. However, the differences in FA, Cth, and structural volumes were reported in other parts of the brain [Ducharme et al., 2012; Wolz et al., 2011]. Also, our CAIS cohort showed stronger functional connectivity with the ACC than male controls, which is not compatible with the reported reductions in these connections in bipolar patients [Cho et al., 2012]. Although an effect on the DMN has been reported in bipolar disorder [Wang et al., 2016], these effects were not compatible with the specifically female connectivity pattern, which was detected in our CAIS population.
Another methodological factor is whether the lower FA in women with CAIS could be attributed to partial volume effects due to smaller size of the brain and the white mater volume. Smaller volumes, or thinner fiber bundles, are more affected by partial volume effects, which might result in artificially lower FA values in women. However, the ICV and the overall white matter volume in women with CAIS was in the range of male rather than female controls.
Like in Rametti et al. [2012] who studied testosterone effects on FA in transsexuals, our women with CAIS displayed lower FA than male controls primiarily on the right side. The reasons for this lateralization are unclear. Neither can we make any inferences about the exact timing of the proposed testosterone effects. Since women with CAIS are insensitive to androgens throughout life, the current findings are likely to reflect organizational and/or activational sex hormone effects during the pre‐/neonatal phase, adolescence and/or adulthood. Given the current literature, these effects are less likely to be linked to estrogen, except for the Cth of the left temporal lobe, which is usually thinner in women and reported to be inversely correlated to estrogen levels [Bramen et al., 2012; Herting et al., 2015; Peper et al., 2009]. We did not measure hormone levels in female controls, but there was no reason to assume that any of them would have abnormal sex hormone levels since they had normal menstrual cycles. Furthermore, except for the motor cortex, Cth did not differ between women with CAIS and female controls, and was in the left temporal lobe thinner in both these groups then in the male controls (Fig. 1, Table 3).
Two patients did not have AR mutation, and the sample was heterogeneous regarding gonadectomy. It is known from the literature that the diagnosis of CAIS cannot be confirmed by AR mutation in 10–20% of the patients. Consequently, it is not surprising that two patients out of 16 in our material had no AR mutation despite a clear phenotype of CAIS. However, the results in these two women, and also those who did not have gonadectomy did not differ significantly from the others.
Although it is known that environmental factors influence both the function and structure of the human brain, it seems, nevertheless, unlikely that living as a woman would selectively shape the motor networks in a “male” and the limbic and occipito‐parietal networks in a “female” mode. Also, given that the right D2:D4 ratios were similar in women with CAIS and female controls, and larger than in male controls, the observed cerebral “feminization” in CAIS seems, at least partly, attributable to prenatal processes (believed to be reflected in D2:D4 ratios) [Manning et al., 1998].
Finally, although FA is a rather nonspecific measure, (axial and radial diffusivity provide more specific information), we choose to limit our DTI analysis to FA, because it is the most sensitive metric. The observed differences in FA could reflect sex hormone effects on axonal density, diameter or the degree of myelination, and at the moment we can only conclude that white matter microstructure shows a predominantly female pattern in CAIS.
CONCLUSIONS
Testosterone has selective, regional effects on cerebral sex dimorphism. These effects are most prominent in the occipito‐parietal sensory cortex and the long axonal connections. The motor networks, conversely, seem to be moderated primarily by processes linked to genes on the sex chromosomes, other than the SRY‐gene. The present data do not support the hypothesis that estrogen‐mediated masculinization is operating in humans, as it does in rodents. Whether the observed mixture of “male” and “female” neuronal coding in women with CAIS has any specific behavioral correlates is presently uncertain, but would indeed be interesting to evaluate based on the present findings on cerebral networks.
Supporting information
Supporting Information
ACKNOWLEDGMENTS
We are greatful to the patients and controls for their participation in the study. Conflict of Interest: None. Ethical Standards: The authors assert that all procedures contributing to this work comply with the ethical standards of the relevant national and institutional committees on human experimentation and with the Helsinki Declaration of 1975, as revised in 2008. This work is supported by the Swedish Research Council.
REFERENCES
- Abdelgadir SE, Roselli CE, Choate JV, Resko JA (1999): Androgen receptor messenger ribonucleic acid in brains and pituitaries of male rhesus monkeys: studies on distribution, hormonal control, and relationship to luteinizing hormone secretion. Biol Reprod 60:1251–1256. [DOI] [PubMed] [Google Scholar]
- Arnold AP, Chen X (2009): What does the “four core genotypes” mouse model tell us about sex differences in the brain and other tissues? Front Neuroendocrinol 30:1–9. [DOI] [PMC free article] [PubMed] [Google Scholar]
- Basser PJ, Jones DK (2002): Diffusion‐tensor MRI: Theory, experimental design and data analysis ‐ a technical review. NMR Biomed 15:456–467. [DOI] [PubMed] [Google Scholar]
- Beckmann CF, Smith SM (2004): Probabilistic independent component analysis for functional magnetic resonance imaging. IEEE Trans Med Imaging 23:137–152. [DOI] [PubMed] [Google Scholar]
- Bramen JE, Hranilovich JA, Dahl RE, Chen J, Rosso C, Forbes EE, Dinov ID, Worthman CM, Sowell ER (2012): Sex matters during adolescence: Testosterone‐related cortical thickness maturation differs between boys and girls. PLoS One 7:e33850. [DOI] [PMC free article] [PubMed] [Google Scholar]
- Castellanos FX (2002): Proceed, with caution: SPECT cerebral blood flow studies of children and adolescents with attention deficit hyperactivity disorder. J Nucl Med 43:1630–1633. [PubMed] [Google Scholar]
- Cheikhelard A, Thibaud E, Morel Y, Jaubert F, Lortat‐Jacob S, Polak M, Nihoul‐Fekete N (2009): Complete androgen insensitivity syndrome: diagnosis and management. Expert Rev Endocrinol Metab 4:565–573. [DOI] [PubMed] [Google Scholar]
- Cho Y, Seong JK, Jeong Y, Shin SY; Alzheimer's Disease Neuroimaging Initiative (2012): Individual subject classification for Alzheimer's disease based on incremental learning using a spatial frequency representation of cortical thickness data. Neuroimage 59:2217–2230. [DOI] [PMC free article] [PubMed] [Google Scholar]
- Ciumas C, Lindén Hirschberg A, Savic I (2009): High fetal testosterone and sexually dimorphic cerebral networks in females. Cereb Cortex 19:1167–1174. [DOI] [PubMed] [Google Scholar]
- Ducharme S, Hudziak JJ, Botteron KN, Albaugh MD, Nguyen TV, Karama S, Evans AC and Brain Development Cooperative, G (2012): Decreased regional cortical thickness and thinning rate are associated with inattention symptoms in healthy children. J Am Acad Child Adolesc Psychiatry 51:18–27. e12. [DOI] [PMC free article] [PubMed] [Google Scholar]
- Ducharme S, Albaugh MD, Nguyen TV, Hudziak JJ, Mateos‐Perez JM, Labbe A, Evans AC, Karama S; Brain Development Cooperative Group (2016): Trajectories of cortical thickness maturation in normal brain development—The importance of quality control procedures. Neuroimage 125:267–279. [DOI] [PMC free article] [PubMed] [Google Scholar]
- Erickson KI, Colcombe SJ, Raz N, Korol DL, Scalf P, Webb A, Cohen NJ, McAuley E, Kramer AF (2005): Selective sparing of brain tissue in postmenopausal women receiving hormone replacement therapy. Neurobiol Aging 26:1205–1213. [DOI] [PubMed] [Google Scholar]
- Fernandez G, Weis S, Stoffel‐Wagner B, Tendolkar I, Reuber M, Beyenburg S, Klaver P, Fell J, de Greiff A, Ruhlmann J, Reul J, Elger CE (2003): Menstrual cycle‐dependent neural plasticity in the adult human brain is hormone, task, and region specific. J Neurosci 23:3790–3795. [DOI] [PMC free article] [PubMed] [Google Scholar]
- Feusner JD, Dervisic J, Kosidou K, Dhejne C, Bookheimer S, Savic I (2016): Female‐to‐male transsexual individuals demonstrate different own body identification. Arch Sex Behav 45:525–536. [DOI] [PubMed] [Google Scholar]
- Filipek PA, Richelme C, Kennedy DN, Caviness VS Jr (1994): The young adult human brain: An MRI‐based morphometric analysis. Cereb Cortex 4:344–360. [DOI] [PubMed] [Google Scholar]
- Filippi M, Valsasina P, Misci P, Falini A, Comi G, Rocca MA (2013): The organization of intrinsic brain activity differs between genders: A resting‐state fMRI study in a large cohort of young healthy subjects. Hum Brain Mapp 34:1330–1343. [DOI] [PMC free article] [PubMed] [Google Scholar]
- Fischl B, Dale AM (2000): Measuring the thickness of the human cerebral cortex from magnetic resonance images. Proc Natl Acad Sci USA 97:11050–11055. [DOI] [PMC free article] [PubMed] [Google Scholar]
- Fischl B, Salat DH, Busa E, Albert M, Dieterich M, Haselgrove C, van der Kouwe A, Killiany R, Kennedy D, Klaveness S, Montillo A, Makris N, Rosen B, Dale AM (2002): Whole brain segmentation: Automated labeling of neuroanatomical structures in the human brain. Neuron 33:341–355. [DOI] [PubMed] [Google Scholar]
- Fischl B, van der Kouwe A, Destrieux C, Halgren E, Segonne F, Salat DH, Busa E, Seidman LJ, Goldstein J, Kennedy D, Caviness V, Makris N, Rosen B, Dale AM (2004): Automatically parcellating the human cerebral cortex. Cereb Cortex 14:11–22. [DOI] [PubMed] [Google Scholar]
- Frodl T, Skokauskas N (2012): Meta‐analysis of structural MRI studies in children and adults with attention deficit hyperactivity disorder indicates treatment effects. Acta Psychiatr Scand 125:114–126. Review. [DOI] [PubMed] [Google Scholar]
- Giedd JN, Castellanos FX, Rajapakse JC, Vaituzis AC, Rapoport JL (1997): Sexual dimorphism of the developing human brain. Prog Neuropsychopharmacol Biol Psychiatry 21:1185–1201. [DOI] [PubMed] [Google Scholar]
- Goldstein JM, Seidman LJ, Horton NJ, Makris N, Kennedy DN, Caviness VS Jr, Faraone SV, Tsuang MT (2001): Normal sexual dimorphism of the adult human brain assessed by in vivo magnetic resonance imaging. Cereb Cortex 11:490–497. [DOI] [PubMed] [Google Scholar]
- Golkar A, Johansson E, Kasahara M, Osika W, Perski A, Savic I (2014): The influence of work‐related chronic stress on the regulation of emotion and on functional connectivity in the brain. PloS One 9:e104550. [DOI] [PMC free article] [PubMed] [Google Scholar]
- Good CD, Johnsrude IS, Ashburner J, Henson RN, Friston KJ, Frackowiak RS (2001): A voxel‐based morphometric study of ageing in 465 normal adult human brains. Neuroimage 14:21–36. [DOI] [PubMed] [Google Scholar]
- Greicius MD, Krasnow B, Reiss AL, Menon V (2003): Functional connectivity in the resting brain: A network analysis of the default mode hypothesis. Proc Natl Acad Sci USA 100:253–258. [DOI] [PMC free article] [PubMed] [Google Scholar]
- Herting MM, Maxwell EC, Irvine C, Nagel BJ (2012): The impact of sex, puberty, and hormones on white matter microstructure in adolescents. Cereb Cortex 22:1979–1992. [DOI] [PMC free article] [PubMed] [Google Scholar]
- Herting MM, Gautam P, Spielberg JM, Dahl RE, Sowell ER (2015): A longitudinal study: Changes in cortical thickness and surface area during pubertal maturation. PLoS One 10:e0119774. [DOI] [PMC free article] [PubMed] [Google Scholar]
- Hua K, Oishi K, Zhang J, Wakana S, Yoshioka T, Zhang W, Akhter KD, Li X, Huang H, Jiang H, van Zijl P, Mori S (2009): Mapping of functional areas in the human cortex based on connectivity through association fibers. Cereb Cortex 19:1889–1895. [DOI] [PMC free article] [PubMed] [Google Scholar]
- Hughes IA, Werner R, Bunch T, Hiort O (2012): Androgen insensitivity syndrome. Semin Reprod Med 30:432–442. [DOI] [PubMed] [Google Scholar]
- Kanaan RA, Allin M, Picchioni M, Barker GJ, Daly E, Shergill SS, Woolley J, McGuire PK (2012): Gender differences in white matter microstructure. PLoS One 7:e38272. [DOI] [PMC free article] [PubMed] [Google Scholar]
- Kelly RE, Alexopoulos GS, Wang Z, Gunning FM, Murphy CF, Morimoto SS, Kanellopoulos D, Jia Z, Lim KO, Hoptman MJ (2010): Visual inspection of independent components: Defining a procedure for artifact removal from fMRI data. J Neurosci Methods 189:233–245. [DOI] [PMC free article] [PubMed] [Google Scholar]
- Kilpatrick LA, Zald DH, Pardo JV, Cahill LF (2006): Sex‐related differences in amygdala functional connectivity during resting conditions. Neuroimage 30:452–461. [DOI] [PubMed] [Google Scholar]
- Kinsey AC, Pomeroy WR, Martin C (2003): Sexual Behavior in the Human Male, 1948. Am J Public Health 93:894–898. [DOI] [PMC free article] [PubMed] [Google Scholar]
- Kong J, Tu PC, Zyloney C, Su TP (2010): Intrinsic functional connectivity of the periaqueductal gray, a resting fMRI study. Behav Brain Res 211:215–219. [DOI] [PMC free article] [PubMed] [Google Scholar]
- Koolschijn PC, Peper JS, Crone EA (2014): The influence of sex steroids on structural brain maturation in adolescence. PLoS One 9:e83929. [DOI] [PMC free article] [PubMed] [Google Scholar]
- Lentini E, Kasahara M, Arver S, Savic I (2013): Sex differences in the human brain and the impact of sex chromosomes and sex hormones. Cereb Cortex 23:2322–2336. [DOI] [PubMed] [Google Scholar]
- Luders E, Narr KL, Thompson PM, Rex DE, Woods RP, Deluca H, Jancke L, Toga AW (2006): Gender effects on cortical thickness and the influence of scaling. Hum Brain Mapp 27:314–324. [DOI] [PMC free article] [PubMed] [Google Scholar]
- Luders E, Gaser C, Narr KL, Toga AW (2009): Why sex matters: Brain size independent differences in gray matter distributions between men and women. J Neurosci 29:14265–14270. [DOI] [PMC free article] [PubMed] [Google Scholar]
- Lutchmaya S, Baron‐Cohen S, Raggatt P, Knickmeyer R, Manning JT (2004): 2nd to 4th digit ratios, fetal testosterone and estradiol. Early Hum Dev 77:23–28. [DOI] [PubMed] [Google Scholar]
- Manning JT, Scutt D, Wilson J, Lewis‐Jones DI (1998): The ratio of 2nd to 4th digit length: a predictor of sperm numbers and concentrations of testosterone, luteinizing hormone and oestrogen. Hum Reprod 13:3000–3004. [DOI] [PubMed] [Google Scholar]
- Manzouri A, Kosidou K, Savic I (2015): Anatomical and functional findings in female‐to‐male transsexuals: Testing a new hypothesis. Cereb Cortex Dec 4. pii: bhv278. [Epub ahead of print] [DOI] [PubMed] [Google Scholar]
- Marzelli MJ, Hoeft F, Hong DS, Reiss AL (2011): Neuroanatomical spatial patterns in Turner syndrome. Neuroimage 55:439–447. [DOI] [PMC free article] [PubMed] [Google Scholar]
- Masica DN, Money J, Ehrhardt AA (1971): Fetal feminization and female gender identity in the testicular feminizing syndrome of androgen insensitivity. Arch Sex Behav 1:131–142. [DOI] [PubMed] [Google Scholar]
- McCarthy MM, Arnold AP, Ball GF, Blaustein JD, De Vries GJ (2012): Sex differences in the brain: The not so inconvenient truth. J Neurosci 32:2241–2247. [DOI] [PMC free article] [PubMed] [Google Scholar]
- Mendoza N, Motos MA (2013): Androgen insensitivity syndrome. Gynecol Endocrinol 29:1–5. [DOI] [PubMed] [Google Scholar]
- Mori S, Oishi K, Jiang H, Jiang L, Li X, Akhter K, Hua K, Faria AV, Mahmood A, Woods R, Toga AW, Pike GB, Neto PR, Evans A, Zhang J, Huang H, Miller MI, van Zijl P, Mazziotta J (2008): Stereotaxic white matter atlas based on diffusion tensor imaging in an ICBM template. NeuroImage 40:570–582. [DOI] [PMC free article] [PubMed] [Google Scholar]
- Mukherjee S, Kim S, Gibbons LE, Nho K, Risacher SL, Glymour MM, Habeck C, Lee GJ, Mormino E, Ertekin‐Taner N, Montine TJ, Decarli C, Saykin AJ, Crane PK (2012): Alzheimer's Disease Neuroimaging Initiative . Genetic architecture of resilience of executive functioning. Brain Imaging Behav 6:621–633. [DOI] [PMC free article] [PubMed] [Google Scholar]
- Nguyen TV, McCracken J, Ducharme S, Botteron KN, Mahabir M, Johnson W, Israel M, Evans AC, Karama S; Brain Development Cooperative Group (2013a): Testosterone‐related cortical maturation across childhood and adolescence. Cereb Cortex 23:1424–1432. [DOI] [PMC free article] [PubMed] [Google Scholar]
- Nguyen TV, McCracken JT, Ducharme S, Cropp BF, Botteron KN, Evans AC, Karama S (2013b): Interactive effects of dehydroepiandrosterone and testosterone on cortical thickness during early brain development. J Neurosci 33:10840–10848. [DOI] [PMC free article] [PubMed] [Google Scholar]
- Nopoulos P, Flaum M, O'Leary D, Andreasen NC (2000): Sexual dimorphism in the human brain: Evaluation of tissue volume, tissue composition and surface anatomy using magnetic resonance imaging. Psychiatry Res 98:1–13. [DOI] [PubMed] [Google Scholar]
- Oguz I, Farzinfar M, Matsui J, Budin F, Liu Z, Gerig G, Johnson HJ, Styner M (2014): DTIPrep: Quality control of diffusion‐weighted images. Front Neuroinform 8:4. [DOI] [PMC free article] [PubMed] [Google Scholar]
- Peper JS, Brouwer RM, Schnack HG, van Baal GC, van Leeuwen M, van den Berg SM, Delemarre‐Van de Waal HA, Boomsma DI, Kahn RS, Hulshoff Pol HE (2009): Sex steroids and brain structure in pubertal boys and girls. Psychoneuroendocrinology 34:332–342. [DOI] [PubMed] [Google Scholar]
- Peper JS, Mandl RC, Braams BR, de Water E, Heijboer AC, Koolschijn PC, Crone EA (2013): Delay discounting and frontostriatal fiber tracts: A combined DTI and MTR study on impulsive choices in healthy young adults. Cereb Cortex 23:1695–1702. [DOI] [PMC free article] [PubMed] [Google Scholar]
- Peper JS, de Reus MA, van den Heuvel MP, Schutter DJ (2015): Short fused? associations between white matter connections, sex steroids, and aggression across adolescence. Hum Brain Mapp 36:1043–1052. [DOI] [PMC free article] [PubMed] [Google Scholar]
- Power JD, Barnes KA, Snyder AZ, Schlaggar BL, Petersen SE (2012): Spurious but systematic correlations in functional connectivity MRI networks arise from subject motion. Neuroimage 59:2142–2154. [DOI] [PMC free article] [PubMed] [Google Scholar]
- Price CC, Tanner J, Nguyen PT, Schwab NA, Mitchell S, Slonena E, Brumback B, Okun MS, Mareci TH, Bowers D (2016): Gray and white matter contributions to cognitive frontostriatal deficits in non‐demented Parkinson's disease. PLoS One 11:e0147332. [DOI] [PMC free article] [PubMed] [Google Scholar]
- Quigley CA, De Bellis A, Marschke KB, el‐Awady MK, Wilson EM, French FS (1995): Androgen receptor defects: historical, clinical, and molecular perspectives. Endocr Rev 16:271–321. Review. Erratum in: Endocr Rev (1995): 16:546. [DOI] [PubMed] [Google Scholar]
- Rametti G, Carrillo B, Gomez‐Gil E, Junque C, Segovia S, Gomez A, Guillamon A (2011): White matter microstructure in female to male transsexuals before cross‐sex hormonal treatment. A diffusion tensor imaging study. J Psychiatr Res 45:199–204. [DOI] [PubMed] [Google Scholar]
- Rametti G, Carrillo B, Gomez‐Gil E, Junque C, Zubiaurre‐Elorza L, Segovia S, Gomez A, Karadi K, Guillamon A (2012): Effects of androgenization on the white matter microstructure of female‐to‐male transsexuals. A diffusion tensor imaging study. Psychoneuroendocrinology 37:1261–1269. [DOI] [PubMed] [Google Scholar]
- Rasgon NL, Silverman D, Siddarth P, Miller K, Ercoli LM, Elman S, Lavretsky H, Huang SC, Phelps ME, Small GW (2005): Estrogen use and brain metabolic change in postmenopausal women. Neurobiol Aging 26:229–235. [DOI] [PubMed] [Google Scholar]
- Raz N, Torres IJ, Acker JD (1995): Age, gender, and hemispheric differences in human striatum: A quantitative review and new data from in vivo MRI morphometry. Neurobiol Learn Mem 63:133–142. [DOI] [PubMed] [Google Scholar]
- Raz N, Lindenberger U, Rodrigue KM, Kennedy KM, Head D, Williamson A, Dahle C, Gerstorf D, Acker JD (2005): Regional brain changes in aging healthy adults: General trends, individual differences and modifiers. Cereb Cortex 15:1676–1689. [DOI] [PubMed] [Google Scholar]
- Rey G, Piguet C, Benders A, Favre S, Eickhoff SB, Aubry JM, Vuilleumier P (2016): Resting‐state functional connectivity of emotion regulation networks in euthymic and non‐euthymic bipolar disorder patients. Eur Psychiatry 34:56–63. [DOI] [PubMed] [Google Scholar]
- Savic I (2015): Structural changes of the brain in relation to occupational stress. Cereb Cortex 25:1554–1564. [DOI] [PubMed] [Google Scholar]
- Savic I, Arver S (2011): Sex dimorphism of the brain in male‐to‐female transsexuals. Cereb Cortex 21:2525–2533. [DOI] [PubMed] [Google Scholar]
- Savic I, Arver S (2014): Sex differences in cortical thickness and their possible genetic and sex hormonal underpinnings. Cereb Cortex 24:3246–3257. [DOI] [PubMed] [Google Scholar]
- Savic I, Lindstrom P (2008): PET and MRI show differences in cerebral asymmetry and functional connectivity between homo‐ and heterosexual subjects. Proc Natl Acad Sci USA 105:9403–9408. [DOI] [PMC free article] [PubMed] [Google Scholar]
- Simerly RB, Chang C, Muramatsu M, Swanson LW (1990): Distribution of androgen and estrogen receptor mRNA‐containing cells in the rat brain: an in situ hybridization study. J Comp Neurol 294:76–95. [DOI] [PubMed] [Google Scholar]
- Takeuchi H, Taki Y, Thyreau B, Sassa Y, Hashizume H, Sekiguchi A, Nagase T, Nouchi R, Fukushima A, Kawashima R (2013): White matter structures associated with empathizing and systemizing in young adults. Neuroimage 77:222–236. [DOI] [PubMed] [Google Scholar]
- van Hemmen J, Saris IM, Cohen‐Kettenis PT, Veltman DJ, Pouwels PJ, Bakker J: Sex differences in white matter microstructure in the human brain predominantly reflect differences in sex hormone exposure. Cereb Cortex 2016 May 25. pii: bhw156 (in press). [DOI] [PubMed] [Google Scholar]
- Walhovd KB, Fjell AM, Dale AM, McEvoy LK, Brewer J, Karow DS, Salmon DP, Fennema‐Notestine C; Alzheimer's Disease Neuroimaging Initiative (2010): Multi‐modal imaging predicts memory performance in normal aging and cognitive decline. Neurobiol Aging 31:1107–1121. [DOI] [PMC free article] [PubMed] [Google Scholar]
- Wang Y, Zhong S, Jia Y, Sun Y, Wang B, Liu T, Pan J, Huang L (2016): Disrupted resting‐state functional connectivity in nonmedicated bipolar disorder. Radiology 280:529–536. [DOI] [PubMed] [Google Scholar]
- Weaver AA, Schoell SL, Nguyen CM, Lynch SK, Stitzel JD (2014): Morphometric analysis of variation in the sternum with sex and age. J Morphol 275:1284–1299. [DOI] [PubMed] [Google Scholar]
- Wolk DA, Dickerson BC; Alzheimer's Disease Neuroimaging Initiative (2010): Apolipoprotein E (APOE) genotype has dissociable effects on memory and attentional‐executive network function in Alzheimer's disease. Proc Natl Acad Sci USA 107:10256–10261. [DOI] [PMC free article] [PubMed] [Google Scholar]
- Wolz R, Julkunen V, Koikkalainen J, Niskanen E, Zhang DP, Rueckert D, Soininen H, Lotjonen J; Alzheimer's Disease Neuroimaging Initiative (2011): Multi‐method analysis of MRI images in early diagnostics of Alzheimer's disease. PLoS One 6:e25446. [DOI] [PMC free article] [PubMed] [Google Scholar]
- Young LJ, Pfaff DW (2014): Sex differences in neurological and psychiatric disorders. Front Neuroendocrinol 35:253–254. [DOI] [PubMed] [Google Scholar]
- Zhang S, Li CS (2012): Functional connectivity mapping of the human precuneus by resting state fMRI. NeuroImage 59:3548–3562. [DOI] [PMC free article] [PubMed] [Google Scholar]
Associated Data
This section collects any data citations, data availability statements, or supplementary materials included in this article.
Supplementary Materials
Supporting Information