

Abstract
Previous studies have suggested that disorders of consciousness (DOC) after severe brain injury may result from disconnections of the thalamo‐cortical system. However, thalamo‐cortical connectivity differences between vegetative state (VS), minimally conscious state minus (MCS−, i.e., low‐level behavior such as visual pursuit), and minimally conscious state plus (MCS+, i.e., high‐level behavior such as language processing) remain unclear. Probabilistic tractography in a sample of 25 DOC patients was employed to assess whether structural connectivity in various thalamo‐cortical circuits could differentiate between VS, MCS−, and MCS+ patients. First, the thalamus was individually segmented into seven clusters based on patterns of cortical connectivity and tested for univariate differences across groups. Second, reconstructed whole‐brain thalamic tracks were used as features in a multivariate searchlight analysis to identify regions along the tracks that were most informative in distinguishing among groups. At the univariate level, it was found that VS patients displayed reduced connectivity in most thalamo‐cortical circuits of interest, including frontal, temporal, and sensorimotor connections, as compared with MCS+, but showed more pulvinar‐occipital connections when compared with MCS−. Moreover, MCS− exhibited significantly less thalamo‐premotor and thalamo‐temporal connectivity than MCS+. At the multivariate level, it was found that thalamic tracks reaching frontal, parietal, and sensorimotor regions, could discriminate, up to 100% accuracy, across each pairwise group comparison. Together, these findings highlight the role of thalamo‐cortical connections in patients' behavioral profile and level of consciousness. Diffusion tensor imaging combined with machine learning algorithms could thus potentially facilitate diagnostic distinctions in DOC and shed light on the neural correlates of consciousness. Hum Brain Mapp 38:431–443, 2017. © 2016 Wiley Periodicals, Inc.
Keywords: DTI, MVPA, probabilistic tractography, searchlight, vegetative state, minimally conscious plus, minimally conscious minus, thalamo‐cortical, connectivity
INTRODUCTION
Consciousness in clinical neurology is defined by two main components: wakefulness and awareness (of the self or environment) [Laureys, 2005]. Individuals surviving severe brain injury, traumatic (T) or non‐traumatic (NT), sometimes fail to fully recover consciousness after the initial state of acute coma, and remain, permanently or transiently, in a condition of disorder of consciousness (DOC) [Monti et al., 2010]. Patients in a vegetative state (VS) are characterized by wakefulness in the absence of discernable signs of awareness [Jennett and Plum, 1972]. Patients in a minimally conscious state (MCS), on the other hand, demonstrate wakefulness along with some reproducible, yet intermittent, evidence of awareness [Giacino et al., 2002]. Due to the wide spectrum of behaviors observed in minimally conscious patients, MCS can be further subdivided into MCS+ (patients exhibiting high‐level behavioral responses such as command following, intelligible verbalizations, or yes/no responses) and MCS− (patients exhibiting low‐level, non‐reflexive responses such as visual pursuit, localization of noxious stimuli, or appropriate contingent behavior to emotional stimuli) [Bruno et al., 2011].
Because of the heterogeneous brain pathology associated with DOC, there currently exists no reliable neuroanatomical marker that aids in differentiating VS and MCS patients. Thus, diagnostic distinctions are based solely on behavioral criteria, which can be prone to misdiagnosis, with rates of up to 40% [Andrews et al., 1996; Childs and Mercer, 1996; Schnakers et al., 2009]. The accurate differential diagnosis of patients suffering from DOC, particularly at the boundary between unconsciousness and (minimal) consciousness, is clinically paramount, and can bear important care‐taking and ethical ramifications.
In order to improve differential diagnosis, a better understanding of the underlying pathology is imperative. DOC has been described as a “disconnection syndrome” that can be triggered by several pathological mechanisms. VS is typically caused by extensive damage to the cortex, thalamus, or white matter tracts connecting the thalamus and cortex [Kinney and Samuels, 1994]. MCS, on the other hand, presents a similar but less severe extent of damage [Jennett et al., 2001]. While a number of brain regions may contribute to the maintenance of consciousness, recent models of loss and recovery of consciousness after severe brain injury stress the “necessary” role of the thalamo‐cortical complex [Laureys, 2005; Laureys and Tononi, 2008; Schiff, 2010]. Indeed, the degree of thalamic atrophy has been shown to correlate with patients' behavioral profile [Lutkenhoff et al., 2015] and, in the acute setting, to predict the chances of behavioral recovery [Lutkenhoff et al., 2013]. Furthermore, intact thalamo‐cortical functional connectivity has been shown to characterize DOC patients able to demonstrate voluntary deployment of top‐down auditory attention [Monti et al., 2015], and has also been shown, in a single case report, to be associated with functional recovery from VS [Laureys et al., 2000]. Conversely, also in a single case report, it has been shown that, where thalamo‐cortical connectivity is impaired, a patient can be in a VS despite preserved cortico‐cortical connectivity [Boly et al., 2009]. Nonetheless, the relationship between preservation of individual thalamo‐cortical circuits and patients' behavioral presentation and diagnosis remains unclear.
In line with the thalamo‐cortical hypothesis of DOC, Fernandez‐Espejo et al. [2011] have shown that VS and MCS patients can be distinguished based on the integrity of their global thalami and white matter using mean diffusivity histogram indices from diffusion tensor imaging (DTI). DTI measures the local movement of water molecules throughout the brain in an attempt to elucidate the tissue microstructure and provides a valuable tool for assessing anatomical connectivity in‐vivo [Pierpaoli et al., 1996]. Although the findings from Fernandez‐Espejo et al. [2011] offer indirect support for a differential degree of global thalamo‐cortical disconnection between VS and MCS, recent theories focus on the role of specific subdivisions of the thalamus and their corticopetal connections in DOC [Schiff, 2010]. It is therefore crucial to identify and distinguish specific contributions of the thalamo‐cortical circuits that underlie the different levels of consciousness impairment.
In the present study, we use probabilistic diffusion tractography to evaluate structural connectivity between the thalamus and cortex in VS, MCS−, and MCS+ patients, and to identify connectivity differences that could be used as reliable biomarkers for the stratification of patients with DOC. To achieve this aim, we first employ a univariate analysis approach to determine which thalamic subregion(s), as defined by their pattern of cortical connectivity, differ most significantly between patient groups. Subsequently, we employ a multivariate approach to uncover which regions along the thalamic tracks are maximally informative in distinguishing among patient groups.
MATERIALS AND METHODS
Patient Population
The original databank consisted of a convenience sample of 56 severely brain‐injured patients who fulfilled the diagnostic criteria for VS (n = 22; 13T/9NT), MCS− (n = 15; 12T/3NT), and MCS+ (n = 19; 13T/6NT) based on the Coma Recovery Scale‐Revised (CRS‐R) [Giacino et al., 2004]. However, 31 patients were excluded either due to excessive motion or extensive structural atrophy that obscured the identification of our regions of interest. This resulted in a sample size of 25 patients (6 females/19 males; mean age 39.5 ± 14.2 years), with 10 VS (4T/6NT), 7 MCS− (6T/1NT), and 8 MCS+ (7T/1NT). Demographic and clinical information for the final dataset are shown in Table 1. This study was approved by the Cambridge Local Ethics Committee, and informed consent was signed by patients' legal surrogate. Data were collected between 2006 and 2011, when A.M.O. and M.M.M. were affiliated with the MRC Cognition and Brain Sciences Unit and the Wolfson Brain Imaging Centre. A portion of this patient cohort has been described in previous neuroimaging studies that employed different analysis techniques [Fernandez‐Espejo et al., 2011; Newcombe et al., 2010].
Table 1.
Patients' demographic and clinical information
| CRS‐R scores | ||||||||||||
|---|---|---|---|---|---|---|---|---|---|---|---|---|
| Patient | Diagnosis | Gender | MPI | Age | Etiology | Auditory | Visual | Motor | Oromotor | Communication | Arousal | Total |
| P01 | VS | F | 18 | 48 | NT | 1 | 1 | 2 | 1 | 0 | 2 | 7 |
| P02 | VS | F | 8 | 52 | NT | 1 | 1 | 2 | 1 | 0 | 2 | 7 |
| P03 | VS | M | 10 | 35 | NT | 1 | 1 | 2 | 1 | 0 | 1 | 6 |
| P04 | VS | M | 14 | 67 | T | 0 | 1 | 2 | 1 | 0 | 1 | 5 |
| P05 | VS | M | 8 | 42 | NT | 1 | 1 | 2 | 1 | 0 | 2 | 7 |
| P06 | VS | M | 13 | 62 | NT | 1 | 0 | 2 | 2 | 0 | 2 | 7 |
| P07 | VS | F | 8 | 38 | T | NA | NA | NA | NA | NA | NA | 8 |
| P08 | VS | M | 9 | 35 | NT | 1 | 1 | 2 | 1 | 0 | 2 | 7 |
| P09 | VS | M | 13 | 34 | T | 1 | 0 | 2 | 1 | 0 | 2 | 6 |
| P10 | VS | M | 19 | 31 | T | NA | NA | NA | NA | NA | NA | NA |
| P11 | MCS− | M | 11 | 26 | T | 2 | 3 | 3 | 1 | 0 | 2 | 11 |
| P12 | MCS− | M | 19 | 23 | T | 1 | 3 | 2 | 1 | 0 | 2 | 9 |
| P13 | MCS− | F | 3 | 38 | T | 1 | 3 | 2 | 1 | 0 | 2 | 9 |
| P14 | MCS− | M | 8 | 18 | T | 1 | 3 | 4 | 1 | 0 | 2 | 11 |
| P15 | MCS− | M | 30 | 36 | T | 2 | 3 | 2 | 2 | 0 | 2 | 11 |
| P16 | MCS− | M | 15 | 54 | NT | 2 | 3 | 1 | 1 | 0 | 3 | 10 |
| P17 | MCS− | F | 13 | 38 | T | 2 | 3 | 2 | 2 | 0 | 2 | 11 |
| P18 | MCS+ | M | 7 | 17 | T | 3 | 3 | 2 | 2 | 0 | 2 | 12 |
| P19 | MCS+ | M | 11 | 29 | T | 3 | 3 | 2 | 1 | 0 | 2 | 11 |
| P20 | MCS+ | M | 6 | 56 | NT | 3 | 3 | 2 | 2 | 1 | 2 | 13 |
| P21 | MCS+ | M | 8 | 25 | T | 2 | 4 | 2 | 1 | 0 | 2 | 11 |
| P22 | MCS+ | M | 11 | 23 | T | 3 | 3 | 2 | 1 | 1 | 2 | 12 |
| P23 | MCS+ | M | 8 | 45 | T | 3 | 3 | 2 | 1 | 0 | 2 | 11 |
| P24 | MCS+ | M | 14 | 56 | T | 4 | 3 | 3 | 2 | 0 | 2 | 14 |
| P25 | MCS+ | F | 12 | 59 | T | 3 | 5 | 2 | 2 | 0 | 2 | 14 |
Abbreviations: MPI, months post‐ictus; NT, non‐traumatic; T, traumatic.
MRI Acquisition
All imaging data were collected on a 3T Siemens Magnetom Tim Trio scanner at the Wolfson Brain Imaging Centre (Addenbrooke's Hospital, Cambridge). Diffusion‐weighted data were acquired using echo planar imaging (63 axial slices, 2 mm thickness; field of view = 192 mm × 192 mm; matrix size = 96 × 96; voxel size = 2 mm isotropic; flip angle = 90°; TR = 8,300 ms; TE = 98 ms;). 12 non‐collinear gradient directions were collected 5 times using 5 b‐values ranging from 340 to 1,590 s/mm2, resulting in 60 diffusion‐weighted volumes. Five non‐diffusion weighted volumes were also acquired, so a total of 65 volumes were available per patient. The use of multiple b‐values has been shown to improve the accuracy and repeatability of DTI results [Correia et al., 2009]. In addition, a 3D T1‐weighted structural scan, magnetization prepared rapid gradient echo (MPRAGE) (160 sagittal slices, 1mm thickness; matrix size = 256 × 231; voxel size = 1 mm isotropic; flip angle = 9°; TR = 2,250 ms; TE = 2.98 ms) was obtained.
Image Analysis
Preprocessing
Data analysis was primarily carried out using FSL 5.0.4 (FMRIB's Software Library) [Smith et al., 2004]. After manually removing any diffusion‐weighted volumes with substantial distortion, the remaining volumes were corrected for eddy current distortions and head motion by affine registration to a b = 0 image. Between 1 and 6, out of 60 diffusion‐weighted volumes, were removed from 14 patients. There were no significant differences in the average number of volumes removed across groups (VS = 2, MCS− = 3, and MCS+ = 2 volumes removed). Next, skull stripping was applied to the b = 0 image using the Brain Extraction Tool (BET) [Smith, 2002] and to the T1‐weighted structural image using the Robust Brain Extraction (ROBEX) tool [Iglesias et al., 2011].
Regions of interests (ROIs)
For each hemisphere, a seed mask (thalamus) and seven cortical target masks (prefrontal [PFC], premotor/supplementary motor area [PMC/SMA], primary motor [M1], primary somatosensory [S1], posterior parietal [PPC], temporal, and occipital cortices) were transformed from standard space (MNI‐152 2 mm) into each patient's T1‐weighted structural space using Advanced Nonlinear Transformations (ANTs) tool [Avants et al., 2011]. The anatomical landmarks of these ROIs have been previously described in Behrens et al. [2003]. Transformations between the patients' structural and diffusion space were created with FLIRT [Jenkinson et al., 2002]. All masks were visually inspected to ensure accuracy and manually edited as needed prior to any data analysis. To improve the delineation of the thalamic masks, as many masks overlapped with parts of the cerebral spinal fluid (CSF), we removed any voxels from the thalamus mask that intersected with the CSF. Figure 1A illustrates both a lateral and medial view of the ROIs.
Figure 1.
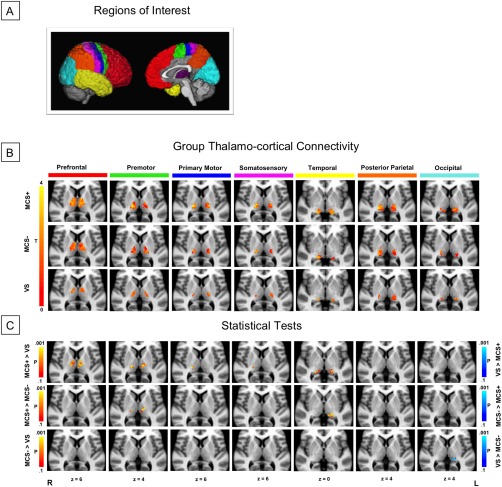
Structural connectivity between thalamus and cortex. (A) ROIs used for probabilistic tractography: seven cortical target masks and one thalamic seed mask, per hemisphere. (B) Connectivity‐based thalamic segmentation revealed seven subregions of the thalamus with target‐specific connections. Group mean thalamo‐cortical connectivity maps are displayed to reveal thalamic clusters shared by at least 25% of the patients in each group. (C) Statistical pairwise comparisons showed differential patterns of thalamo‐cortical connectivity between VS, MCS−, and MCS+. [Color figure can be viewed at http://wileyonlinelibrary.com.]
Probabilistic tractography
Using tools within FSL's diffusion toolbox (FDT), we estimated a probability distribution function on the principal fiber direction at each voxel. Then, 5,000 samples were drawn from the connectivity distribution from each voxel in the thalamic seed mask. Two subsequent approaches followed: (i) The probability of connection from the thalamus to each cortical target was calculated, where each voxel within the thalamus was quantified by the total number of samples reaching any target. This resulted in seven cortical connectivity clusters of the thalamus, one for each cortical target, which will later be submitted to the univariate analysis. (ii) A path distribution map from the left or right thalamus (i.e., reconstructed thalamic tracks) was created to identify all pathways originating from the thalamus and projecting throughout the whole brain, including the cortical targets. Each voxel within the path distribution map represented the number of samples that successfully passed through that voxel from the thalamus. This output will be used in the multivariate analysis. All tractography outputs were thresholded to exclude voxels with connectivity values less than 10 and divided by the total number of samples sent (5,000 samples × the number of seed voxels). This normalization step controlled for the variability of the patients' thalamus size. A small threshold was chosen based on the overall low connectivity profile of these severely brain‐injured patients.
Statistical Analysis
Univariate analysis
Each of the seven thalamo‐cortical connectivity clusters was then compared between VS and MCS+, VS and MCS−, and MCS− and MCS+. Voxelwise statistics were performed using randomize (5,000 permutations) and threshold‐free cluster enhancement was applied to correct for multiple comparisons (P < 0.05, corrected) [Smith and Nichols, 2009]. Only cluster sizes with at least 10 contiguous voxels are reported. Between‐group tests were carried out with and without covariates (i.e., gender, age, and months post‐ictus [MPI]), since these factors are sometimes considered to be important for patient prognosis [Monti et al., 2010]. Nonetheless, as we report below, no factor correlated with our dependent measure.
Multivariate classification
Since the aim of this study was to increase the accuracy of differential diagnoses, we employed multivariate classification techniques to assess the reliability of neuronal markers (i.e., patterns of thalamic projections). Considering the widespread connectivity of the thalamus and the variable, multifocal pathologies of DOC patients, we implemented a searchlight mapping technique [Kriegeskorte et al., 2006] to identify which regions along the thalamic tracks reaching the cortex varied most reliably across groups. We centered a 5‐voxel sphere at each voxel in the brain and used the thalamic connectivity values from voxels within each sphere as features in each of three binary support vector machine (SVM) classifications (MCS+ vs. VS, MCS− vs. VS, and MCS+ vs. MCS−). Classification accuracy was assessed in a leave‐2‐subjects‐out cross‐validation fashion in order to avoid any circularity or “double‐dipping” in the procedure [Kriegeskorte et al., 2009]. The achieved accuracy was assigned to the voxel that the sphere was centered around, resulting in a whole‐brain accuracy for each classification. Significance was determined by the binomial inverse of the cumulative distribution function to identify the smallest number of correct classifications out of the total number of classifications (number of subjects raised to the number of groups in the classification [n k]), where the distribution was centered around the chance value obtained by randomly shuffling the labels before classification [Pereira et al., 2009]. The P‐value cutoff was 0.05, Bonferroni corrected for the number of searchlight masks. To ensure that our results highlight the most significant regions, only clusters with at least 50 contiguous voxels are reported. The effects of potential covariates were regressed out prior to the SVM classifications.
RESULTS
Identifying Thalamic Subregions Based on Cortical Connectivity
Connectivity‐based thalamic segmentation revealed different regions within the thalamus that were preferentially connected to each ipsilateral cortical target. The group mean of each thalamo‐cortical cluster is depicted for VS, MCS−, and MCS+ in Figure 1B. Although some overlap were observed between putative thalamic subregions, areas containing high probabilities of connection to distinct cortical targets were relatively consistent with previous reports of connectivity‐based, and histologically verified, thalamic subregions [Behrens et al., 2003; Johansen‐Berg et al., 2005]. Collapsing across groups and reporting primary connections, PFC connections were largely found in the mediodorsal nucleus (MD), intralaminar nuclei (ILN), ventral anterior (VA), and ventral lateral (VL) complex; PPC, occipital, and temporal regions were predominantly connected to the pulvinar (PUL); S1 connections were mainly localized within the ventral posterior lateral nucleus (VPL); PMC/SMA was strongly associated with VL. M1 also revealed some connections in VL and VPL regions.
Univariate Tests of Thalamo‐Cortical Subregions
The proportion of cortical connections in the thalamic subdivisions was compared between each group to uncover univariate differences (Fig. 1C, Table 2). As compared with VS, MCS+ patients exhibited greater thalamo‐cortical connections across the majority of cortical targets, except for PPC and occipital regions. While no univariate differences were observed for MCS− > VS, the reverse contrast uncovered greater left pulvinar‐occipital connectivity in VS patients. Finally, comparison of the two MCS subgroups demonstrated that MCS+ patients showed greater connectivity between the thalamus and bilateral premotor cortices, as well as left temporal cortex.
Table 2.
Univariate differences of thalamo‐cortical connections
| Statistical tests | Cortical ROIs | Thalamic regions | Cluster size (voxels) |
|---|---|---|---|
| MCS+ > VS | L. PFC | MD, ILN, VA, VL, | 148 |
| R. PFC | MD, ILN, VA, VL | 97 | |
| L. PMC | MD, ILN, VL, VPL | 58 | |
| R. PMC | ILN, VL, VPL, VPM | 72 | |
| R. M1 | VL, VPL | 30 | |
| R. S1 | VL, VPL | 16 | |
| L. Temporal | PUL | 20 | |
| R. Temporal | PUL | 55 | |
| VS > MCS+ | − | − | − |
| MCS+ > MCS− | L. PMC | VL, ILN, VPL | 53 |
| R. PMC | VPL, VPM | 14 | |
| L. Temporal | PUL* | 51 (84*) | |
| MCS− > MCS+ | − | − | − |
| MCS− > VS | − | − | − |
| VS > MCS− | L. Occipital | PUL | 16 |
Only significant clusters (P < 0.05, corrected) with at least 10 voxels are reported. Voxel Size: 2 × 2 × 2 mm.
“*” denotes significance after controlling for gender, age, and months post‐ictus.
Abbreviations: MD, mediodorsal nucleus; ILN, intralaminar nuclei; VA, ventral anterior nucleus; VL, ventral lateral nucleus; VPL, ventral posterior lateral nucleus; VPM, ventral posterior medial nucleus; PUL, pulvinar.
We note that when additional variables were included as covariates (gender, age, and MPI), which were uncorrelated with our dependent variables, most of the findings failed to remain significant, except for the left pulvinar‐temporal connectivity difference for MCS+ > MCS−.
Multivariate Classification of Thalamic Tracks
Using the left or right whole‐brain thalamic tracks (Fig. 2) as features for 2‐way SVM searchlight classifications between patient groups, we identified extensive areas in the cortical gray matter and associated white matter regions that significantly distinguished between VS versus MCS+, VS versus MCS−, and MCS− versus MCS+ (Fig. 3, Table 3). The percent accuracy cutoff for VS versus MCS+ was 81%, whereas the accuracy cutoff for VS versus MCS− and MCS− versus MCS+ was 84%. The multivariate results, which were significant despite the inclusion of potential confounding variables such as gender, age, and MPI, supported a large portion of the univariate findings. Important features in the successful discrimination across all groups were found in thalamic tracks that traversed parts of frontal, parietal, and sensorimotor zones. However, the percent accuracy, cluster size, and precise locations within these main regions varied across each 2‐way classification.
Figure 2.
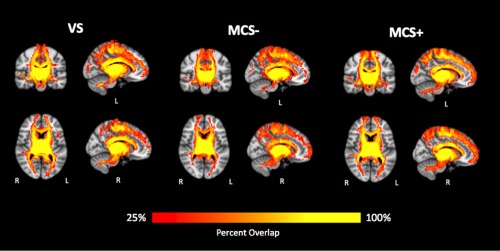
Reconstructed whole‐brain thalamic tracks. Only tracks shared by at least 25% of the patients for each group are shown. Left and right thalamic tracks are combined for visualization purposes. [Color figure can be viewed at http://wileyonlinelibrary.com.]
Figure 3.
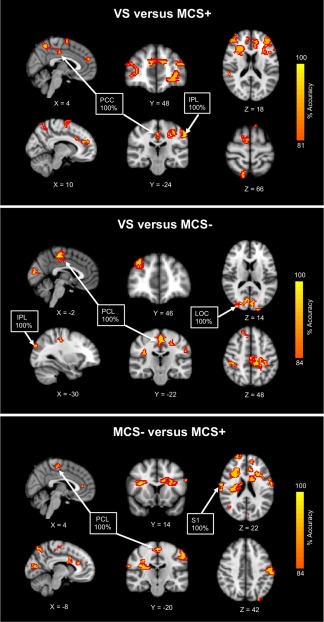
Searchlight classification results. Tracks originating from the thalamus and projecting to the cortex that successfully distinguished between VS versus MCS+, VS versus MCS−, and MCS− versus MCS+ are shown. Results from the left and right thalamic tracks are combined for visualization purposes. For enhanced display of the clusters, accuracy maps are thickened with a red border. Abbreviations: PCC, posterior cingulate cortex; IPL, inferior parietal lobule; PCL, paracentral lobule; LOC, lateral occipital complex; S1, primary somatosensory. [Color figure can be viewed at http://wileyonlinelibrary.com.]
Table 3.
Multivariate differences of thalamic tracks
| A. Peak classification accuracies and cluster sizes | ||||||||||||||||||
|---|---|---|---|---|---|---|---|---|---|---|---|---|---|---|---|---|---|---|
| VS versus MCS+ | VS versus MCS− | MCS− versus MCS+ | ||||||||||||||||
| Track Region | L. Thal Tracks | R. Thal Tracks | L. Thal Tracks | R. Thal Tracks | L. Thal Tracks | R. Thal Tracks | ||||||||||||
| Ipsi. | Contra. | Ipsi. | Contra. | Ipsi. | Contra. | Ipsi. | Contra. | Ipsi. | Contra. | Ipsi. | Contra. | |||||||
| Prefrontal | ||||||||||||||||||
| Sup. Frontal | 88 (409) | − | 88 (323) | − | 86 (59) | − | − | − | − | 93 (60) | 93 (52) | |||||||
| Mid.Frontal | − | 94 (309) | 88 (173) | 88 (312) | − | 93 (99) | − | − | − | − | 93 (163) | − | ||||||
| Inf. Frontal | − | − | 81 (61) | 81 (100) | − | − | − | − | − | − | 86 (75) | − | ||||||
| Ant. Cingulate | 81 (78) | − | − | − | − | 93 (191) | ||||||||||||
| Sensorimotor | ||||||||||||||||||
| PMC/SMA | − | 88 (92) | − | − | − | − | − | − | − | − | − | − | ||||||
| Paracentral | − | − | 100 (478) | − | 86 (69) | 100 (72) | ||||||||||||
| M1 | 88 (102) | − | − | − | 93 (72) | − | − | − | − | − | − | 93 (78) | ||||||
| S1 | 91 (124) | − | − | 93 (67) | 91 (82) | − | − | − | − | − | 100 (50)* | 97 (229) | ||||||
| Posterior Parietal | ||||||||||||||||||
| Post. Cingulate | 100 (67) | − | − | − | − | − | ||||||||||||
| Precuneus | 95 (154) | − | − | − | 86 (120) | − | ||||||||||||
| Inf. Parietal | 100 (184)* | 88 (60) | − | 94 (147) | 100 (60) | 93 (59) | 86 (55) | − | − | − | 93 (62) | 93 (89) | ||||||
| Sup. Parietal | − | − | 88 (84) | − | − | − | − | − | − | − | − | − | ||||||
| Occipital | ||||||||||||||||||
| Cuneus | − | − | − | − | 93 (100) | − | − | − | − | − | 87 (118) | |||||||
| Lat. Occipital | − | − | − | − | 93 (60) | 100 (178) | − | − | − | − | − | − | ||||||
| Subcortical WM | ||||||||||||||||||
| ACR | − | − | 88 (119) | − | − | − | − | − | − | − | 93 (290) | 93 (114) | ||||||
| SCR | − | − | − | − | − | − | − | − | − | − | 93 (271) | − | ||||||
| Peak classification accuracy % (cluster size in voxels). Only significant clusters (P < 0.05, corrected) with at least 50 voxels are reported. Voxel Size: 2 × 2 × 2 mm. Cortical clusters may contain both gray matter and corresponding white matter regions. | ||||||||||||||||||
| *Cluster spans S1 and Inf. Parietal border. | ||||||||||||||||||
| B. Peak MNI coordinates | ||||||||||||
|---|---|---|---|---|---|---|---|---|---|---|---|---|
| VS versus MCS+ | VS versus MCS− | MCS− versus MCS+ | ||||||||||
| Track Region | L. Thal Tracks | R. Thal Tracks | L. Thal Tracks | R. Thal Tracks | L. Thal Tracks | R. Thal Tracks | ||||||
| Ipsi. | Contra. | Ipsi. | Contra. | Ipsi. | Contra. | Ipsi. | Contra. | Ipsi. | Contra. | Ipsi. | Contra. | |
| Prefrontal | ||||||||||||
| Sup. Frontal | −28,40,−8 | − | −12,40,18 | − | 18,32,42 | − | − | − | − | 20,30,24 | −24,22,26 | |
| Mid.Frontal | − | 36,58,2 | 36,58,22 | −36,32,18 | − | 32,48,30 | − | − | − | − | 30,48,28 | − |
| Inf. Frontal | − | − | 48,34,12 | −38,10,16 | − | − | − | − | − | − | 50,32,0 | − |
| Ant. Cingulate | 20,24,24 | − | − | − | − | −34,12,16 | ||||||
| Sensorimotor | ||||||||||||
| PMC/SMA | − | 6,−34,68 | − | − | − | − | − | − | − | − | − | − |
| Paracentral | − | − | −16,−34,48 | − | −2,−34,50 | 2,−20,60 | ||||||
| M1 | −28,−24,38 | − | − | − | −32,−24,42 | − | − | − | − | − | − | −58,−6,20 |
| S1 | −48,8,56 | − | − | −42,−30,40 | −58,−14,24 | − | − | − | − | − | 66,−8,26 | −58,−12,40 |
| Posterior Parietal | ||||||||||||
| Post. Cingulate | 4,−22,38 | − | − | − | − | − | ||||||
| Precuneus | 14,−70,66 | − | − | − | −12,−66,50 | − | ||||||
| Inf. Parietal | −52,−32,52 | 54,−38,18 | − | −54,−28,40 | −28,−86,30 | 34,−38,44 | 40,−24,22 | − | − | − | 44,−72,14 | −26,−92,32 |
| Sup. Parietal | − | − | 30,−80,28 | − | − | − | − | − | − | − | − | − |
| Occipital | ||||||||||||
| Cuneus | − | − | − | − | −4,−90,10 | − | − | − | − | − | −6,−86,16 | |
| Lat. Occipital | − | − | − | − | −20,−100,14 | 24,−86,14 | − | − | − | − | − | − |
| Subcortical WM | ||||||||||||
| ACR | − | − | 32,14,18 | − | − | − | − | − | − | − | 28,24,16 | −20,20,26 |
| SCR | − | − | − | − | − | − | − | − | − | − | 26,−16,20 | − |
x,y,z in mm coordinates.
Abbreviations: WM, white matter; Sup., superior; Mid., middle; Inf., inferior; Ant., anterior; PMC/SMA, premotor/supplementary motor area; M1, primary motor; S1, primary somatosensory; Post., posterior; Lat., lateral; ACR, anterior corona radiata; SCR, superior corona radiata; ipsi, ipsilateral; contra., contralateral..
The VS versus MCS+ classification relied mainly upon widespread thalamo‐cortical networks, with roughly equal contributions from both left and right thalamic tracks. In particular, thalamic tracks reaching frontal, parietal, and sensorimotor areas were the most prominent, where the largest clusters were found within prefrontal, but 100% accuracies were detected in more posterior regions, including posterior cingulate and inferior parietal (bordering S1). The VS versus MCS− classification relied upon similar widespread thalamo‐cortical networks, but depended on projections primarily from the left thalamus. Hundred percent accuracies were identified in paracentral, inferior parietal, and lateral occipital cortices. Finally, similar thalamo‐cortical regions appeared for the MCS− versus MCS+ classification, but the right thalamic projections were more informative than the left in successful distinction of the two groups. Hundred percent accuracies were discovered in sensorimotor regions, including paracentral and S1.
DISCUSSION
In this article we assessed differences in thalamo‐cortical connectivity across varying levels of consciousness impairment (VS, MCS−, and MCS+) using probabilistic diffusion tractography. Although diverse patterns of local differences in thalamo‐cortical connectivity were evident in each pairwise group comparison, the key features shared by univariate and multivariate comparisons involved thalamic connections with prefrontal and sensorimotor regions. To date, this study is one of the very few to have reported reliable differences between the subcategories of MCS and VS, and the very first to have found systematic differences between VS and MCS−.
VS Versus MCS+
As expected, the univariate and multivariate comparison of groups at the extreme points of the DOC spectrum (i.e., VS vs. MCS+) revealed the greatest degree of thalamo‐cortical connectivity differences across multiple networks. MCS+ patients generally exhibited more thalamo‐cortical connections, compared with VS. These findings suggest that having a better preserved thalamo‐cortical system may explain the more complex behavioral repertoire observed in these minimally conscious patients and are consistent with previous studies implicating thalamo‐cortical circuits in wakefulness and ongoing conscious processing [Alkire et al., 2000; Tononi, 2012] and therefore in DOC [Schiff, 2010].
Moreover, the thalamic nuclei (ILN, MD, VA, VL, and PUL) that contributed to the increased thalamic connectivity with association cortices in MCS+, compared with VS, may be considered part of the central thalamus. The nuclei within the central thalamus, which include the intralaminar complex and paralaminar portions of related thalamic association nuclei—MD, VA, VL, and PUL [Schiff, 2008] have been found to be preferentially damaged following severe brain injury and the degree of damage grades with behavioral outcome [Lutkenhoff et al., 2013, 2015; Maxwell et al., 2006]. In addition, deep brain stimulation of the central thalamus in DOC patients has yielded functional improvements [Kanno et al., 1987; Schiff et al., 2007; Tsubokawa et al., 1990; Yamamoto and Katayama, 2005].
Classifying VS and MCS+ patients based on their thalamic projections yielded significant multivariate differences across extensive cortical networks. Tracks originating from both left and right thalami that reached frontal, parietal, and sensorimotor areas were significantly different between groups. Distributed regions within the prefrontal and parietal areas have been regarded as the neurobiological underpinnings of conscious processing [Dehaene and Changeux, 2011]. Moreover, seminal PET studies in VS patients have revealed functional disconnections in similar networks, where both fronto‐parietal and thalamo‐frontal networks have been associated with the recovery of consciousness [Laureys et al., 1999, 2000]; dysfunctioning in fronto‐parietal networks may be due to either direct cortical damage or cortico‐cortical or thalamo‐cortical disconnections [Laureys, 2005]. The thalamo‐sensorimotor differences observed in our study may reflect the severity of sensorimotor deficits in VS patients that may prevent them from responding to behavioral stimulation and thus from demonstrating signs of discernible awareness.
VS Versus MCS−
Distinguishing patients in VS from MCS− based on overt behavior is particularly challenging due to the latter patient group's limited behavioral repertoire, which may be an important contribution to the high misdiagnosis rates in this patient group. The ability to reliably discriminate these two groups on the basis of brain connectivity alone is therefore a particularly important aspect of this report. While greater pulvinar‐occipital connectivity in VS, compared with MCS−, was the only univariate difference detected in this between‐group comparison, the more sensitive and robust multivariate analysis uncovered multiple thalamo‐cortical networks that could systematically classify between the two groups. These networks were similar to the ones that distinguished VS from MCS+, but also included thalamo‐occipital differences and were more lateralized to the tracks originating from the left thalamus. We interpret this laterality observation as an indication of the differences in the degree of thalamo‐cortical injuries, with extensive, bilateral damages to the thalamus and/or cortex as characteristic of VS [Kinney and Samuels, 1994], and a lesser degree of thalamo‐cortical damage commonly witnessed in minimally conscious patients [Jennett et al., 2001]. On the other hand, the greater pulvinar‐occipital connectivity in VS compared with MCS− patients may reflect the possibility of VS patients undergoing compensatory changes in disease progression or recovery. Evidence of late axonal regrowth as implied by increased fractional anisotropy (FA) has been previously reported in a single MCS patient [Voss et al., 2006]. However, although increased FA is often interpreted as marking greater structural integrity, the occurrence of astrogliosis after injury can also contribute to a higher FA [Croall et al., 2014]. Likewise, post‐injury mechanisms may also bias diffusion vector estimations that could potentially lead to an increased connectivity between regions. Considering that visual pursuit is often the first sign of patients transitioning from VS to MCS [Giacino and Whyte, 2005], the pulvinar, whose main functions are visual [Cortes and van Vreeswijk, 2012], would certainly be a sensible locus for compensatory mechanisms. Nonetheless, given the relatively small group‐wise sample size under investigation, the lack of multiple time points to investigate interval changes in the present data, and the low prior evidence for such mechanisms in DOC, interpretation of this finding will only be possible through assessment of the issue in future studies.
MCS− Versus MCS+
Functional and structural differences between sub‐categories of MCS have been previously reported. Reduced metabolism by means of PET was found in left cortical areas of the language network and sensorimotor cortices in MCS− compared with MCS+ patients [Bruno et al., 2012]. Our univariate results complement these functional findings by offering structural support for reduced connectivity of bilateral premotor and left temporal cortices (possibly including language related regions) with the thalamus. Moreover, in a DTI study, decreased fractional anisotropy (FA) in the white matter tracts connecting the thalamus and precuneus/posterior cingulate was detected in MCS− compared with MCS+ [Fernandez‐Espejo et al., 2012]. Likewise, our classification algorithm was able to successfully differentiate MCS− from MCS+ based on connections of thalamus with precuneus as well as a number of other recipient regions. Other thalamo‐cortical differences were comparable to the previous group comparisons, but lateralized to the projections from the right thalamus, suggesting that perhaps, the two MCS subgroups may be less equally impaired in the right thalamus. Again, this laterality finding may concur with the notion that the severity of thalamic damage correlates with clinical manifestation [Maxwell et al., 2006].
LIMITATIONS
Finally, interpretation of the findings should be mindful of a number of limitations. Our sample size was limited by a number of factors. First, DOC patients are a relatively rare population, which poses many medical and logistic challenges. Second, despite collecting data for a sample of 56 patients, quality control procedures reduced the analysis sample to 25. This was mainly due to the artifacts introduced by high rates of spontaneous in‐scanner motion [see Monti et al., 2015, for a similar report) as well as the severe pathology often present in DOC patients, which makes it difficult to delineate with precision and confidence the regions of interest, process the data with existing software [Lutkenhoff et al., 2014] and achieve proper co‐registration with so‐called standard space templates. While appropriate, these procedures have the unwanted consequence of decreasing our sample size, degrading power, and potentially penalizing to a greater extent for patients at the high‐pathology end of the spectrum, both of which affect the generalizability of our findings. Thus, while patient exclusion was approximately balanced across conditions (i.e., 10 VS, 7 MCS−, and 8MCS+), it will be important to revisit these findings in an independent sample. We do emphasize, however, that there is good congruence between our findings and current models of DOC, which mitigates the issue. Alongside the challenges of acquiring data in this patient cohort, we were unable to obtain diffusion data with the optimal number of directions. While 12 directions may be sub‐optimal for the robust estimation of diffusion parameters, the use of multiple b‐values and multiple repetitions may mitigate this issue [Correia et al., 2009; Goodlett et al., 2007]. Likewise, potential effects from removing a few distorted volumes during the preprocessing step may also be mitigated by the availability of 60 diffusion‐weighted volumes from the repeated sampling. And, since there were no systematic differences in the number of volumes removed as a function of group, the likelihood of a bias toward any specific group is reduced. Moreover, there existed an imbalanced distribution of the patients' etiology, where majority of MCS patients were of traumatic origin; this prevented us from carefully evaluating the impact of this factor on our results, and from being able to compare the two groups. In addition, most of our univariate findings failed to remain significant when gender, age, and MPI were included as covariates. Although this result is likely due to the low sample size, and consequential low power, further degraded by the inclusion of the additional regressors uncorrelated with the dependent variables, our univariate results should be taken with some caution. Nonetheless, our findings fit well with the existing literature and with the results reported in the more sensitive multivariate analysis. Finally, it should also be remarked that diffusion tractography does not take into consideration potential differences across efferent and afferent thalamic fibers, which might play different roles in the context of loss and recovery of consciousness after severe brain injury.
CONCLUSION
In the effort to disentangle DOC with the use of DTI and machine learning algorithms, we have shown that structural connectivity of individual thalamo‐cortical networks and the preservation of this system in general can account for the gradations of consciousness observed in these severely brain‐injured patients. While univariate differences between VS and MCS+ included majority of thalamo‐cortical connections of interest, other comparisons between groups closer in the DOC spectrum uncovered limited differences. The addition of the multivariate analysis helped corroborate and extend some of the univariate findings by accounting for any potential effects of covariates and highlighting the importance of thalamic connections with fronto‐parietal cortices and sensorimotor areas. The combination of probabilistic tractography with searchlight classification presents a novel approach to identifying biomarkers that could complement existing behavioral assessments and aid in differential diagnoses.
ACKNOWLEDGMENTS
The authors would like to acknowledge the assistance of the patients' families, as well as the staff at the Royal Hospital for Neuro‐disability (London, UK), Leamington Spa Rehabilitation Hospital (Warwick, UK), and the Gardens and Jacobs Neurological Center (Heartfordshire, UK). Authors report no conflicts of interest.
REFERENCES
- Alkire MT, Haier RJ, Fallon JH (2000): Toward a unified theory of narcosis: Brain imaging evidence for a thalamocortical switch as the neurophysiologic basis of anesthetic‐induced unconsciousness. Conscious Cogn 9:370–386. [DOI] [PubMed] [Google Scholar]
- Andrews K, Murphy L, Munday R, Littlewood C (1996): Misdiagnosis of the vegetative state: Retrospective study in a rehabilitation unit. BMJ 313:13–16. [DOI] [PMC free article] [PubMed] [Google Scholar]
- Avants BB, Tustison NJ, Song G, Cook PA, Klein A, Gee JC (2011): A reproducible evaluation of ANTs similarity metric performance in brain image registration. NeuroImage 54:2033–2044. [DOI] [PMC free article] [PubMed] [Google Scholar]
- Behrens TE, Johansen‐Berg H, Woolrich MW, Smith SM, Wheeler‐Kingshott CA, Boulby PA, Barker GJ, Sillery EL, Sheehan K, Ciccarelli O, Thompson AJ, Brady JM, Matthews PM (2003): Non‐invasive mapping of connections between human thalamus and cortex using diffusion imaging. Nat Neurosci 6:750–757. [DOI] [PubMed] [Google Scholar]
- Boly M, Tshibanda L, Vanhaudenhuyse A, Noirhomme Q, Schnakers C, Ledoux D, Boveroux P, Garweg C, Lambermont B, Phillips C, Luxen A, Moonen G, Bassetti C, Maquet P, Laureys S (2009): Functional connectivity in the default network during resting state is preserved in a vegetative but not in a brain dead patient. Hum Brain Mapp 30:2393–2400. [DOI] [PMC free article] [PubMed] [Google Scholar]
- Bruno MA, Vanhaudenhuyse A, Thibaut A, Moonen G, Laureys S (2011): From unresponsive wakefulness to minimally conscious PLUS and functional locked‐in syndromes: Recent advances in our understanding of disorders of consciousness. J Neurol 258:1373–1384. [DOI] [PubMed] [Google Scholar]
- Bruno MA, Majerus S, Boly M, Vanhaudenhuyse A, Schnakers C, Gosseries O, Boveroux P, Kirsch M, Demertzi A, Bernard C, Hustinx R, Moonen G, Laureys S (2012): Functional neuroanatomy underlying the clinical subcategorization of minimally conscious state patients. J Neurol 259:1087–1098. [DOI] [PubMed] [Google Scholar]
- Childs NL, Mercer WN (1996): Misdiagnosing the persistent vegetative state. Misdiagnosis certainly occurs. BMJ 313:944. [DOI] [PMC free article] [PubMed] [Google Scholar]
- Correia MM, Carpenter TA, Williams GB (2009): Looking for the optimal DTI acquisition scheme given a maximum scan time: Are more b‐values a waste of time?. Magn Reson Imaging 27:163–175. [DOI] [PubMed] [Google Scholar]
- Cortes N, van Vreeswijk C (2012): The role of pulvinar in the transmission of information in the visual hierarchy. Front Comput Neurosci 6:29. [DOI] [PMC free article] [PubMed] [Google Scholar]
- Croall ID, Cowie CJ, He J, Peel A, Wood J, Aribisala BS, Mitchell P, Mendelow AD, Smith FE, Millar D, Kelly T, Blamire AM (2014): White matter correlates of cognitive dysfunction after mild traumatic brain injury. Neurology 83:494–501. [DOI] [PMC free article] [PubMed] [Google Scholar]
- Dehaene S, Changeux JP (2011): Experimental and theoretical approaches to conscious processing. Neuron 70:200–227. [DOI] [PubMed] [Google Scholar]
- Fernandez‐Espejo D, Bekinschtein T, Monti MM, Pickard JD, Junque C, Coleman MR, Owen AM (2011): Diffusion weighted imaging distinguishes the vegetative state from the minimally conscious state. NeuroImage 54:103–112. [DOI] [PubMed] [Google Scholar]
- Fernandez‐Espejo D, Soddu A, Cruse D, Palacios EM, Junque C, Vanhaudenhuyse A, Rivas E, Newcombe V, Menon DK, Pickard JD, Laureys S, Owen AM (2012): A role for the default mode network in the bases of disorders of consciousness. Ann Neurol 72:335–343. [DOI] [PubMed] [Google Scholar]
- Giacino J, Whyte J (2005): The vegetative and minimally conscious states: Current knowledge and remaining questions. J Head Trauma Rehabil 20:30–50. [DOI] [PubMed] [Google Scholar]
- Giacino JT, Ashwal S, Childs N, Cranford R, Jennett B, Katz DI, Kelly JP, Rosenberg JH, Whyte J, Zafonte RD, Zasler ND (2002): The minimally conscious state: Definition and diagnostic criteria. Neurology 58:349–353. [DOI] [PubMed] [Google Scholar]
- Giacino JT, Kalmar K, Whyte J (2004): The JFK Coma Recovery Scale‐Revised: Measurement characteristics and diagnostic utility. Arch Phys Med Rehabil 85:2020–2029. [DOI] [PubMed] [Google Scholar]
- Goodlett C, Fletcher PT, Lin W, Gerig G (2007): Quantification of measurement error in DTI: Theoretical predictions and validation. Medical image computing and computer‐assisted intervention: MICCAI International Conference on Medical Image Computing and Computer‐Assisted Intervention, 10, pp. 10−17. [DOI] [PubMed]
- Iglesias JE, Liu CY, Thompson PM, Tu Z (2011): Robust brain extraction across datasets and comparison with publicly available methods. IEEE Trans Med Imaging 30:1617–1634. [DOI] [PubMed] [Google Scholar]
- Jenkinson M, Bannister P, Brady M, Smith S (2002): Improved optimization for the robust and accurate linear registration and motion correction of brain images. NeuroImage 17:825–841. [DOI] [PubMed] [Google Scholar]
- Jennett B, Plum F (1972): Persistent vegetative state after brain damage. RN 35:ICU1–ICU4. [PubMed] [Google Scholar]
- Jennett B, Adams JH, Murray LS, Graham DI (2001): Neuropathology in vegetative and severely disabled patients after head injury. Neurology 56:486–490. [DOI] [PubMed] [Google Scholar]
- Johansen‐Berg H, Behrens TE, Sillery E, Ciccarelli O, Thompson AJ, Smith SM, Matthews PM (2005): Functional‐anatomical validation and individual variation of diffusion tractography‐based segmentation of the human thalamus. Cereb Cortex 15:31–39. [DOI] [PubMed] [Google Scholar]
- Kanno T, Kamei Y, Yokoyama T, Jain VK (1987): Neurostimulation for patients in vegetative status. Pacing Clin Electrophysiol: PACE 10:207–208. [DOI] [PubMed] [Google Scholar]
- Kinney HC, Samuels MA (1994): Neuropathology of the persistent vegetative state. A review. J Neuropathol Exp Neurol 53:548–558. [DOI] [PubMed] [Google Scholar]
- Kriegeskorte N, Goebel R, Bandettini P (2006): Information‐based functional brain mapping. Proc Natl Acad Sci U S A 103:3863–3868. [DOI] [PMC free article] [PubMed] [Google Scholar]
- Kriegeskorte N, Simmons WK, Bellgowan PS, Baker CI (2009): Circular analysis in systems neuroscience: The dangers of double dipping. Nat Neurosci 12:535–540. [DOI] [PMC free article] [PubMed] [Google Scholar]
- Laureys S (2005): The neural correlate of (un)awareness: Lessons from the vegetative state. Trends Cogn Sci 9:556–559. [DOI] [PubMed] [Google Scholar]
- Laureys S, Tononi G (2008): The Neurology of Consciousness. London: Academic Press‐Elsevier. [Google Scholar]
- Laureys S, Goldman S, Phillips C, Van Bogaert P, Aerts J, Luxen A, Franck G, Maquet P (1999): Impaired effective cortical connectivity in vegetative state: Preliminary investigation using PET. NeuroImage 9:377–382. [DOI] [PubMed] [Google Scholar]
- Laureys S, Faymonville ME, Luxen A, Lamy M, Franck G, Maquet P (2000): Restoration of thalamocortical connectivity after recovery from persistent vegetative state. Lancet 355:1790–1791. [DOI] [PubMed] [Google Scholar]
- Lutkenhoff ES, McArthur DL, Hua X, Thompson PM, Vespa PM, Monti MM (2013): Thalamic atrophy in antero‐medial and dorsal nuclei correlates with six‐month outcome after severe brain injury. NeuroImage Clin 3:396–404. [DOI] [PMC free article] [PubMed] [Google Scholar]
- Lutkenhoff ES, Rosenberg M, Chiang J, Zhang K, Pickard JD, Owen AM, Monti MM (2014): Optimized brain extraction for pathological brains (optiBET). PloS One 9:e115551. [DOI] [PMC free article] [PubMed] [Google Scholar]
- Lutkenhoff ES, Chiang J, Tshibanda L, Kamau E, Kirsch M, Pickard JD, Laureys S, Owen AM, Monti MM (2015): Thalamic and extrathalamic mechanisms of consciousness after severe brain injury. Ann Neurol 78:68–76. [DOI] [PubMed] [Google Scholar]
- Maxwell WL, MacKinnon MA, Smith DH, McIntosh TK, Graham DI (2006): Thalamic nuclei after human blunt head injury. J Neuropathol Exp Neurol 65:478–488. [DOI] [PubMed] [Google Scholar]
- Monti MM, Laureys S, Owen AM (2010): The vegetative state. BMJ 341:c3765. [DOI] [PubMed] [Google Scholar]
- Monti MM, Rosenberg M, Finoia P, Kamau E, Pickard JD, Owen AM (2015): Thalamo‐frontal connectivity mediates top‐down cognitive functions in disorders of consciousness. Neurology 84:167–173. [DOI] [PMC free article] [PubMed] [Google Scholar]
- Newcombe VF, Williams GB, Scoffings D, Cross J, Carpenter TA, Pickard JD, Menon DK (2010): Aetiological differences in neuroanatomy of the vegetative state: Insights from diffusion tensor imaging and functional implications. J Neurol Neurosurg Psychiatry 81:552–561. [DOI] [PubMed] [Google Scholar]
- Pereira F, Mitchell T, Botvinick M (2009): Machine learning classifiers and fMRI: A tutorial overview. NeuroImage 45:S199–S209. [DOI] [PMC free article] [PubMed] [Google Scholar]
- Pierpaoli C, Jezzard P, Basser PJ, Barnett A, Di Chiro G (1996): Diffusion tensor MR imaging of the human brain. Radiology 201:637–648. [DOI] [PubMed] [Google Scholar]
- Schiff ND (2008): Central thalamic contributions to arousal regulation and neurological disorders of consciousness. Ann N Y Acad Sci 1129:105–118. [DOI] [PubMed] [Google Scholar]
- Schiff ND (2010): Recovery of consciousness after brain injury: A mesocircuit hypothesis. Trends Neurosci 33:1–9. [DOI] [PMC free article] [PubMed] [Google Scholar]
- Schiff ND, Giacino JT, Kalmar K, Victor JD, Baker K, Gerber M, Fritz B, Eisenberg B, Biondi T, O'Connor J, Kobylarz EJ, Farris S, Machado A, McCagg C, Plum F, Fins JJ, Rezai AR (2007): Behavioural improvements with thalamic stimulation after severe traumatic brain injury. Nature 448:600–603. [DOI] [PubMed] [Google Scholar]
- Schnakers C, Vanhaudenhuyse A, Giacino J, Ventura M, Boly M, Majerus S, Moonen G, Laureys S (2009): Diagnostic accuracy of the vegetative and minimally conscious state: Clinical consensus versus standardized neurobehavioral assessment. BMC Neurol 9:35. [DOI] [PMC free article] [PubMed] [Google Scholar]
- Smith SM (2002): Fast robust automated brain extraction. Hum Brain Mapp 17:143–155. [DOI] [PMC free article] [PubMed] [Google Scholar]
- Smith SM, Nichols TE (2009): Threshold‐free cluster enhancement: Addressing problems of smoothing, threshold dependence and localisation in cluster inference. NeuroImage 44:83–98. [DOI] [PubMed] [Google Scholar]
- Smith SM, Jenkinson M, Woolrich MW, Beckmann CF, Behrens TE, Johansen‐Berg H, Bannister PR, De Luca M, Drobnjak I, Flitney DE, Niazy RK, Saunders J, Vickers J, Zhang Y, De Stefano N, Brady JM, Matthews PM (2004): Advances in functional and structural MR image analysis and implementation as FSL. NeuroImage 23 Suppl 1:S208–S219. [DOI] [PubMed] [Google Scholar]
- Tononi G (2012): Integrated information theory of consciousness: An updated account. Arch Ital Biol 150:293–329. [PubMed] [Google Scholar]
- Tsubokawa T, Yamamoto T, Katayama Y, Hirayama T, Maejima S, Moriya T (1990): Deep‐brain stimulation in a persistent vegetative state: Follow‐up results and criteria for selection of candidates. Brain Injury: [BI] 4:315–327. [DOI] [PubMed] [Google Scholar]
- Voss HU, Uluc AM, Dyke JP, Watts R, Kobylarz EJ, McCandliss BD, Heier LA, Beattie BJ, Hamacher KA, Vallabhajosula S, Goldsmith SJ, Ballon D, Giacino JT, Schiff ND (2006): Possible axonal regrowth in late recovery from the minimally conscious state. J Clin Investig 116:2005–2011. [DOI] [PMC free article] [PubMed] [Google Scholar]
- Yamamoto T, Katayama Y (2005): Deep brain stimulation therapy for the vegetative state. Neuropsychol Rehabil 15:406–413. [DOI] [PubMed] [Google Scholar]