

Abstract
People with autism spectrum disorder (ASD) have poor decision‐making and temporal foresight. This may adversely impact on their everyday life, mental health, and productivity. However, the neural substrates underlying poor choice behavior in people with ASD, or its’ neurofunctional development from childhood to adulthood, are unknown. Despite evidence of atypical structural brain development in ASD, investigation of functional brain maturation in people with ASD is lacking. This cross‐sectional developmental fMRI study investigated the neural substrates underlying performance on a temporal discounting (TD) task in 38 healthy (11–35 years old) male adolescents and adults with ASD and 40 age, sex, and IQ‐matched typically developing healthy controls. Most importantly, we assessed group differences in the neurofunctional maturation of TD across childhood and adulthood. Males with ASD had significantly poorer task performance and significantly lower brain activation in typical regions that mediate TD for delayed choices, in predominantly right hemispheric regions of ventrolateral/dorsolateral prefrontal cortices, ventromedial prefrontal cortex, striatolimbic regions, and cerebellum. Importantly, differential activation in ventromedial frontal cortex and cerebellum was associated with abnormal functional brain maturation; controls, in contrast to people with ASD, showed progressively increasing activation with increasing age in these regions; which furthermore was associated with performance measures and clinical ASD measures (stereotyped/restricted interests). Findings provide first cross‐sectional evidence that reduced activation of TD mediating brain regions in people with ASD during TD is associated with abnormal functional brain development in these regions between childhood and adulthood, and this is related to poor task performance and clinical measures of ASD. Hum Brain Mapp 38:5343–5355, 2017. © 2017 Wiley Periodicals, Inc.
Keywords: autism, brain maturation, fronto‐cerebellum, temporal discounting, fMRI
INTRODUCTION
Autism spectrum disorder (ASD) is a neurodevelopmental disorder characterized by difficulties in reciprocal social communication and stereotyped repetitive behaviors (International Classification of Diseases, Tenth Edition (ICD‐10)) [WHO, 1993]. People with ASD also report difficulties with, and avoidance of, decision making [Luke et al., 2012] which adversely impacts on their everyday life [Green et al., 2000] and may contribute toward the significant costs associated with ASD [Buescher et al., 2014], including unmanaged mental health difficulties [Murphy et al., 2011; Murphy et al., 2016; Russell et al., 2016].
Our ability to make everyday decisions (e.g., financial planning, visiting the doctor) is of considerable economic, health, and clinical importance [Bickel et al., 2015] and matures with age, becoming less impulsive and risk‐prone with better planning and foresight in adulthood [Steinberg et al., 2009]. Competent planning is crucial to decision making and involves inter‐temporal bridging/temporal foresight; the ability to make future choices based on previous experience and to understand the future consequences of one's actions. There is evidence that people with ASD have difficulty in planning [Bramham et al., 2009; Geurts et al., 2004; Ozonoff et al., 2004; Sinzig et al., 2008], reward related decision making [Minassian et al., 2007], temporal processing [Brenner et al., 2015; Szelag et al., 2004] and temporal discounting [Chantiluke et al., 2014].
Temporal discounting refers to how much the subjective value of a reward is discounted (reduced) when reward delivery is delayed in time [Critchfield and Kollins, 2001]. Hence, temporal discounting tasks typically measure the choice between a small immediate or a larger delayed reward and require both inhibition of immediate reward and temporal foresight (forward thinking/future consideration of current choice) to choose the delayed reward [Noreika et al., 2013; Rubia et al., 2009]. Temporal foresight and the ability to wait for larger rewards is central to reward related decision making and is inversely associated with impulsivity [Richards et al., 1999].
There is increasing evidence for the role of poor temporal discounting and decision making in impulsivity related disorders, including addictions and attention‐deficit hyperactivity disorder [Bickel et al., 2015]. However, investigation of temporal discounting in people with ASD is limited. There is evidence that children with ASD have significantly steeper (worse) temporal discounting than typically developing children [Chantiluke et al., 2014] and that adults with ASD have difficulties in reward‐related decision making [Damiano et al., 2012], temporal foresight [Hanson and Atance, 2014], and future thinking [Lind et al., 2013], although no temporal discounting abnormalities have also been observed [Demurie et al., 2012].
fMRI investigations of temporal discounting in typically developing people have shown that immediate reward choices activate fronto‐striato‐limbic brain regions including ventromedial (vmPFC) [Hare et al., 2009] and lateral orbitofrontal cortex and ventral striatum (VS), while delayed reward choices activate brain regions involved in temporal foresight/temporal bridging and future planning such as dorsolateral and ventrolateral prefrontal cortices (DLPFC and VLPFC), vmPFC [Hare et al., 2009], inferior parietal cortices, dorsal striatum [Wesley and Bickel, 2014], and cerebellum [Blackwood et al., 2004; Christakou et al., 2011]. There is increasing evidence of a single valuation system for both immediate and delayed rewards, including vmPFC, VS, and posterior cingulate cortex (PCC) [Hare et al., 2009; Wiehler and Peters, 2015].
In typical development, temporal foresight and temporal discounting matures from childhood to adulthood [Christakou et al., 2011; Steinberg et al., 2009], with decreased (better) rates of discounting with increasing age, which is underpinned by increased activation in vmPFC and its intercorrelation with lateral prefrontal regions and increasing top–down control over the VS [Christakou et al., 2011; Steinbeis et al., 2014].
Despite neuropsychological evidence that people with ASD have temporal discounting difficulties, there has been limited fMRI investigation of temporal discounting in people with ASD. There is only one published pediatric fMRI temporal discounting study [Chantiluke et al., 2014]; this found that children with ASD, relative to typically developing children, had steeper (worse) temporal discounting and a weaker relationship between temporal discounting and brain activation in bilateral inferior frontal cortices and superior temporal regions, right superior frontal cortex, pre‐ and postcentral gyri, midbrain, supplementary motor area, insula, and basal ganglia.
However, ASD is a lifelong neurodevelopmental disorder associated with significant neuropsychological difficulties in childhood [Sinzig et al., 2008] and adulthood [Bramham et al., 2009]. ASD is now recognized as a major public health concern [UN 2007; WHO, 2013] that is remarkable in being of early childhood onset, yet persists across adulthood with high levels of associated difficulties [Simonoff et al., 2008]. Furthermore, there is evidence of atypical and dynamic age‐related changes in the brain structure of people with ASD in infancy [Carper et al., 2002; Hazlett et al., 2011], childhood, and adulthood [Courchesne et al., 2011; Lainhart 2015; Lange et al., 2015; Zielinski et al., 2014] that are associated with symptoms of ASD. However, there has been little investigation of functional brain maturation across children and adults with ASD. Hence, it is crucial to identify whether functional brain abnormalities occur across childhood and adulthood and, if so, whether this is associated with abnormal functional brain maturation in people with ASD as investigated during specific fMRI tasks of cognition.
We have previously compared brain function between children and adults with and without ASD during an fMRI sustained attention task, providing first evidence that abnormal functional activation in fronto‐striato‐cerebellar sustained attention networks in people with ASD was associated with underlying abnormalities in their functional maturation [Murphy et al., 2014]. However, to our knowledge, there are no other fMRI investigations of functional brain maturation in people with ASD across childhood and adulthood.
Hence, the aims of this cross‐sectional developmental fMRI study were to investigate the neural substrates underlying performance on a temporal discounting task in a comparatively large group of healthy male adolescents and adults with ASD and age, sex, and IQ matched typically developing healthy controls and to assess whether these would be associated with differences in the neurofunctional maturation of TD between childhood and adulthood in people with ASD relative to typically developing controls.
We hypothesized that people with ASD would, relative to typically developing participants, show steeper (poor) temporal discounting and reduced brain activation in temporal foresight‐mediating regions of vmPFC, VLPFC, parietal lobe, striato‐limbic, and cerebellar areas and that these functional deficits would be associated with differential functional brain maturation in these regions from childhood to adulthood.
MATERIALS AND METHODS
Participants
Seventy‐eight physically healthy, medication naïve, right‐handed [Oldfield 1971], 11 to 35 year old males (38 with ASD and 40 typically developing all with an IQ > 70) participated. All participants with ASD (N = 38) and 20 typically developing controls completed the Wechsler Abbreviated Scale of Intelligence [Wechsler 1999] and 20 controls completed the Raven's Performance Matrices. Recruitment of people with ASD was supported by the Medical Research Council Autism Imaging Multicentre Study (MRC AIMS), the National Autistic Society, and the Maudsley Hospital. Controls were recruited locally by advertisement and scored below clinical cutoff on the General Health Questionnaire [Goldberg and Hillier, 1979], Strengths and Difficulties Questionnaire (SDQ) [Goodman et al., 2000], and revised Conners' Parent Rating Scale (CPRS‐R) [Conners et al., 1998]. Parents of children with ASD completed the SDQ [Goodman et al., 2000] and CPRS‐R [Conners et al., 1998] and of adults with ASD the Barkley Parent Report Current Behavior questionnaire [Barkley and Murphy, 2005]. Diagnosis of ASD was made by a Consultant Psychiatrist using ICD‐10‐research diagnostic criteria (ICD‐10R) and confirmed using the Autism Diagnostic Interview–Revised (ADI‐R) [Lord et al., 1994]. The ADI‐R [Lord et al., 1994] and the Autism Diagnostic Observation Schedule (ADOS) [Lord et al., 2000] were completed for all 38 participants with ASD; all 38 reached algorithm cutoffs for autism on all ADI‐R (social, communication, restricted/stereotyped) and ADOS (communication, social) domains. Participants with ASD either fulfilled ICD‐10R criteria for childhood autism (N = 10) or fulfilled these criteria but had no history of language delay and therefore were subtyped with Asperger's syndrome (N = 28) (Table 1).
Table 1.
Subject characteristics and task performance
| Controls | ASD | |
|---|---|---|
| N = 40 males | N = 38 males, P value | |
| (mean ± SD) | (mean ± SD) | |
| Age and IQ | ||
| Age in months (range in years) | 244.96 ± 66 (11–35) | 218.18 ± 69, P = 0.84 (11–35) |
| FSIQ | 116 ± 12 | 113 ± 14, P = 0.20 |
| Autism Diagnostic Interview‐Revised (ADI‐R), N = 38 | ||
| Social | — | 21 ± 5 |
| Communication | — | 16 ± 5 |
| Restricted, repetitive behavior | — | 6 ± 2 |
| Autism Diagnostic Observation Schedule (ADOS), N = 38 | ||
| Communication | – | 4 ± 1 |
| Social | – | 9 ± 2 |
| Total (social and communication) | – | 13 ± 3 |
| Stereotyped behaviors and restricted interests | – | 2 ± 1 |
| Temporal discounting task performance measures | ||
| k (impulsivity) | 0.02 ± 0.03 | 0.06 ± 0.12, P = 0.02 |
| Area under the curve (AUC) | 0.60 ± 0.20 | 0.49 ± 0.23, P = 0.02 |
| MRT | 2146.66 ± 521.67 | 2109.27 ± 600.23, P = 0.7 |
| Intrasubject SD of MRT | 732.94 ± 239.26 | 773.42 ± 283.20, P = 0.4 |
MRT, mean reaction time; SD, standard deviation; k, discounting measure; AUC, area under the curve; P = P value (between‐group differences).
The AUC is inversely correlated with k and both are indicators of the degree of discounting with higher k and reduced AUC reflecting steeper discounting.
All participants with ASD underwent a structured clinical assessment to exclude comorbid medical disorders, major psychiatric disorders, and biochemical, hematologic, or chromosomal abnormalities possibly affecting brain function. Exclusion criteria were comorbidity affecting brain development (e.g., epilepsy or psychosis), psychotropic medication (antipsychotics, stimulants, mood stabilizers, antidepressants, benzodiazepines), substance dependence, history of head injury, genetic disorders associated with ASD (e.g., fragile X or 22q11.2), or clinically detectable abnormal MRI brain findings.
Thirty‐three participants (18 typically developing and 15 with ASD) also participated in our pediatric TD study, where analysis was restricted to brain–behavioral correlations [Chantiluke et al., 2014].
The local Ethics Committee conferred ethical approval. Each participant gave written informed consent/assent (and where relevant, parents) and received £30 for their participation.
fMRI Task: Temporal Discounting Task
The 12 min task [Rubia et al., 2009; Christakou et al., 2011; Chantiluka et al., 2014] is an fMRI adaptation of the temporal discounting task [Richards et al., 1999] and measures how much reward is discounted by delay. Participants are required to respond to a visual stimulus with a right‐handed button press to indicate their choice of either a smaller variable amount of money (between £0 and £100) available immediately (immediate reward/left button/right index finger), or a larger, fixed amount (£100) available a week, month, or year later (delayed reward/right button/right middle finger). Delay choices are presented to the right (fixed/delayed reward) and left (adjusted/immediate reward) of the screen for 4 s, followed by a blank screen of at least 8 s (serving as the implicit baseline), depending on the participant's reaction time (intertrial interval = 12 s). Choice types were presented on the same side of the screen to minimize the sensorimotor mapping load of the decision. Trials of the three different delays were randomly interspersed throughout the testing session (20 trials for each delay). The value of the immediate reward value is adjusted in an algorithm based on the participant's previous choices [Richards et al., 1997], which is calculated separately for each of the three different delays, to narrow the range of values converging into an indifference value that is considered by each subject as equivalent to the fixed delayed reward for that delay. Hence, the algorithm adjusts the amount of the immediate reward offered based on the participant's choices, so determining the lowest immediate reward tolerated instead of waiting for the larger delayed reward, and ensures equal numbers of immediate and delayed reward choices for each participant in each delay trial type.
The choice of larger, delayed reward reflects the neural correlates of reward‐related decision making and temporal discounting and is our key interest. Therefore, we focused on the contrast of choice of delayed reward versus immediate reward.
Each participant practiced the task once in a mock scanner before scanning. The practice task consisted of 12 pseudorandomized presentations of hypothetical choices between a small immediate amount and a fixed £100 available after a week, month, or year, so allowing each delay to be presented four times.
Performance Measures
To estimate the steepness of each participant's temporal discounting, we first calculated the effective indifference (or switch) point between the immediate amount and the delayed £100 for each delay interval (day, month, and year). This indifference point was calculated as the midpoint value between the lowest immediate reward selected and the next lowest immediate reward available (i.e., the value of immediate reward offered at which the participant began consistently to select the standard £100 delayed reward) [Richards et al., 1999]. The indifference point is equivalent to the individual's subjective value of £100 when it is available after each delay.
Reward is typically discounted in a hyperbolic function that depends on amount, delay, and a free impulsiveness indicator “k.” k is calculated by fitting a hyperbolic function to the indifference values for every delay; V = A/(1 + kD), where V = subjective value of a reward of amount A, D = delay, and k is a constant characterizing the individual's discounting rate [Richards et al., 1999]. Larger k values indicate steeper reward devaluation with increasing delay (i.e., greater temporal discounting) [Richards et al., 1999] and impulsivity.
While k can be used as the main dependent variable, area under the curve (AUC) analysis is calculated directly from observed indifference points [Myerson et al., 2001], providing a theoretically neutral account of temporal discounting more appropriate for investigations with quantitative, inferential statistics [Myerson et al., 2011] and in fMRI tasks with few delays. Therefore, AUC was calculated as the main temporal discounting outcome variable. AUC is calculated as (x 2 − x 1)[(y 1 + y 2)/2], where x 2 and x 1 represent the successive delays and y 1 and y 2 the indifference point values associated with these delays. Smaller AUC values represent steeper temporal discounting/impulsiveness.
fMRI Image Acquisition
fMRI images were acquired at King's College London Centre for Neuroimaging Sciences, on a 3 T General Electric Signa HDx Twinspeed (Milwaukee, WI) MRI scanner using a quadrature birdcage head coil. In each of 22 noncontiguous planes parallel to the anterior–posterior commissure, 480 T2*‐weighted MR images depicting BOLD (blood oxygen level‐dependent) contrast covering the whole brain were acquired with echo time (TE) = 30 ms, repetition time (TR) = 1.5 s, flip angle = 60°, in‐plane voxel size = 3.75 mm, slice thickness = 5.0 mm, slice skip = 0.5 mm. A whole‐brain high resolution structural scan (inversion recovery gradient echo planar image) used for standard space normalization was also acquired in the intercommissural plane with TE = 40 ms, TR = 3 s, flip angle = 90°, number of slices = 43, slice thickness = 3.0 mm, slice skip = 0.3 mm, in‐plane voxel size = 1.875 mm, providing complete brain coverage.
fMRI Image Analysis
fMRI data were analyzed using XBAM software (version 4), developed at King's College London, The Institute of Psychiatry, Psychology and Neuroscience. XBAM uses a nonparametric permutation based strategy rather than normal theory based inference, to minimize assumptions and employs median, rather than mean‐based statistics, to control for outlier effects [Brammer et al., 1997; Bullmore et al., 1999]. Finally, its goodness of fit statistic (SSQ ratio) is computed by standardizing for individual differences in residual noise before embarking on a second level multisubject testing using robust permutation‐based methods. This allows a mixed effects approach to analysis, an approach that has been recommended following detailed analysis of the validity and impact of normal theory based inference in fMRI in a large number of subjects [Thirion et al., 2007].
Description of fMRI preprocessing
fMRI data were first processed to minimize motion‐related artifacts [Bullmore et al., 1999]. A 3‐D volume consisting of the average intensity at each voxel over the whole experiment was calculated and used as a template. The 3D image volume at each time point was then realigned to this template by computing the combination of rotations (around the x, y, and z axes) and translations (in x, y, and z) that maximized the correlation between the image intensities of the volume in question and the template (rigid body registration). Following realignment, data were then smoothed using a Gaussian filter (FWHM, 7.2 mm) to improve the signal to noise characteristics of the images. An FWHM of 7.2 mm was used because the voxel distributions are 3 mm. 7.2 mm thus approximates to a nearest neighbor Gaussian smoothing filter and so allows for the effects of a unit voxel displacement during normalization.
Further data analysis includes slice timing correction and the residual effects of motion are regressed out from the time series (using the estimated motion parameters) before fitting a GLM.
After preprocessing, a time‐series analysis of individual subject activation was performed with a wavelet‐based fMRI data resampling method [Bullmore et al., 1999]. Using rigid body and affine transformations, individual statistical maps were then normalized to Talairach‐standard space [Talairach and Tournoux, 1988].
Group‐level analysis
Group activation maps were produced for the key experimental condition of delayed > immediate choice by calculating the median observed SSQ‐ratio over all subjects at each voxel in standard space and testing them against the null distribution of median SSQ‐ratios computed from the identically transformed wavelet re‐sampled (permuted) data [Brammer et al., 1997]. The voxel‐level threshold was first set to P < 0.05 to give maximum sensitivity and to avoid type II errors. Next, a cluster‐mass threshold was computed from the distribution of cluster masses in the wavelet‐permuted data, such that the final expected number of type I error clusters under the null hypothesis was <1 per whole brain (cluster level probability P < 0.01). Cluster mass rather than a cluster extent threshold was used, to minimize discrimination against possible small, but strongly responding foci of activation [Bullmore et al., 1999].
A group brain activation map was then produced for the experimental condition of delayed > immediate choice by calculating the median observed SSQ‐ratio over all subjects at each voxel in standard space and testing them against the null distribution of median SSQ‐ratios computed from the identically transformed wavelet re‐sampled (permuted) data [Brammer et al., 1997]. Hypothesis testing was carried out at the cluster level. A voxelwise test at P < 0.05 was conducted to identify any voxels that might plausibly be activated, followed by a subsequent test at a cluster‐level threshold of P < 0.01 to remove false positive clusters produced by the voxel‐level test. Combined voxel/cluster tests with permutation testing allow for excellent type I error control [Bullmore et al., 1999]. For the group activation analysis, less than one false‐positive activated three‐dimensional cluster was expected at P < 0.05 in voxel‐level comparisons and at P < 0.01 in cluster‐level comparisons.
Following group‐level analysis, a between‐group comparison of brain activation was completed using an ANOVA analysis [Bullmore et al., 1999]. In all analyses, voxel and cluster level statistical thresholds were set to obtain less than one false‐positive cluster per map.
Group differences in correlations between whole‐brain activation and age in areas of group differences
To investigate whether regions that differed between groups were also different in their functional maturation across age, we tested differential linear Pearson product–moment correlation coefficients between age and brain activation in those regions that differed between groups, by applying a mask of the ANOVA group differences activation clusters. For this purpose, the Pearson product–moment correlation coefficient was first computed at each voxel in standard space between age data and signal change across all subjects in each group. Correlation coefficients were recalculated after randomly permuting the ages, but not the fMRI data. Multiply repeating the second step (1,000 times per voxel, then combining across all voxels) gives the distribution of correlation coefficients under the null hypothesis of no association between specific ages and specific BOLD effects. This null distribution can then be used to assess the probability of any particular correlation coefficient under the null hypothesis. The critical value of the correlation coefficient at any desired type I error level in the original (nonpermuted) data could be determined by reference to this distribution. Statistical analysis was extended to cluster level [Bullmore et al., 1999].
To test whether group had differential effects on linear age correlations across the whole‐brain, group differences were examined in the correlation coefficients of brain activation with age. For each group independently, at each voxel, the Pearson correlation coefficient between subject age and fMRI response was computed. We then computed, at each voxel, the difference between these two Pearson correlation coefficients, representing the difference in correlation between the groups. To determine the significance of this difference, the appropriate null distribution was generated by randomly permuting subjects and ages between groups, thus scrambling any group differences. The same process as above was repeated for each permutation; Pearson correlation coefficients were calculated for each scrambled group and their difference computed. The resulting values were combined across all voxels to produce a whole‐brain null distribution of differences in correlation. Testing was then extended to cluster level, with the cluster probability under the null hypothesis chosen to set the level of expected type I error clusters at <1. Less than one error cluster was observed (at P < 0.05 for voxel and P < 0.01 for cluster analyses). Areas where either group showed exclusive significant progressive or regressive changes are reported.
To determine the direction of group differences in age correlations, post hoc analyses were conducted on the statistical measures of the BOLD response extracted for each subject in these regions, and age correlations were then performed for all clusters within each group.
RESULTS
There were no significant group differences in age (t(76) = 1.75, P = n.s.) or IQ (t(76) = 1.29, P = n.s.) (Table 1).
Performance
There was a significant group effect for both temporal discounting variables; k (t(76) = −2.26, P = 0.02) and AUC (t(76) = 2.235, P = 0.02). k was smaller and AUC was larger in controls relative to people with ASD, suggesting that people with ASD discounted larger rewards more steeply with increasing time delay.
Age Effect on Performance
The rate of temporal discounting (measured by AUC) significantly decreased with age in both people with ASD (r = 0.519, P = 0.001) and controls (r = 0.366, P = 0.020), but there were no significant group differences in correlations (z obs = −0.793).
Movement
We excluded 4 participants (1 typically developing control and 3 with ASD) because of excess motion. There were no significant group differences in largest, mean, minimum, or median displacement of x, y, z movement parameters (t(76) = −1.955, P = > 0.06) (P largest displacement x movement parameter = 0.3, P largest displacement y movement parameter = 0.7, P largest displacement z movement parameter = 0.06).
fMRI Results
Within‐group brain activations are shown in Figure 1.
Figure 1.
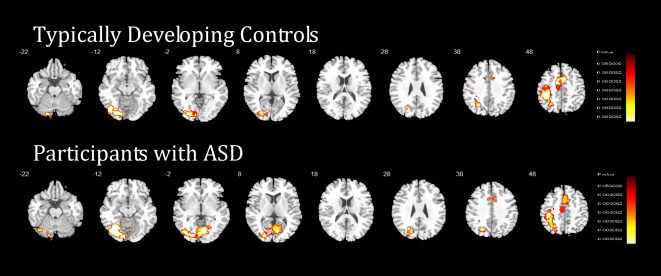
Within‐group differences in the temporal discounting task. Horizontal sections showing brain activation within typically developing controls (N = 40) and within people with ASD (N = 38) across temporal discounting. Tailarach z‐coordinates are indicated for slice distance (in mm) from the intercommissural line. The right hemisphere corresponds to the right side of the image. [Color figure can be viewed at http://wileyonlinelibrary.com]
ANOVA Group Difference
Controls, compared with individuals with ASD, showed increased activation during delayed versus immediate choices in predominantly right hemisphere regions in a large cluster comprising right VLPFC, superior temporal lobe, ventromedial OFC, reaching into right amygdala, right hippocampus, insula, nucleus accumbens, globus pallidus, putamen, thalamus, hypothalamus, bilateral parahippocampal gyrus, and brain stem; in right dorso‐rostral MPFC and anterior cingulate cortex (ACC); in a cluster comprising right VLPFC and MPFC, pre‐ and postcentral gyri, extending into insula/PCC; and in bilateral cerebellum reaching into right occipital lobe. Group differences in all regions were driven by controls activating these regions more to delayed choices, while people with ASD activated them more during immediate choices (Table 2 and Fig. 2).
Table 2.
ANOVA group differences in brain activation between individuals with ASD and typically developing controls in the Temporal Discounting Task
| Brain regions of activation | Brodman area C>ASD | Talairach coordinates (x, y, z) | No of voxels | P |
|---|---|---|---|---|
| Right VLPFC/STL, vmOFC, right amygdala, right hippocampus, insula, nucleus accumbens, globus pallidus, putamen, thalamus, hypothalamus, right and left parahippocampal, gyrus, and right and left brain stem, including pons. | 47/38/25 | 32; 0; −18 | 290 | 0.008 |
| Right rostromedial/ dorsomedial prefrontal cortex, dorsal anterior cingulate cortex | 10, 8, 32, 9, 24 | 10; 59; 20 | 203 | 0.009 |
| Right VLPFC, DLPFC, MFC, pre‐/postcentral gyrus, insula, posterior cingulate cortex | 44, 9, 6, 4, 31 | 43; −11; 36 | 347 | 0.002 |
| Left and right cerebellum, right occipital lobe | 19 | 36; −81; −12 | 182 | 0.008 |
C, typically developing controls; ASD, autism spectrum disorder; No of voxels, number of voxels; VLPFC, ventrolateral prefrontal cortex; STL, superior temporal lobe; vmOFC, ventromedial orbitofrontal cortex; DLPFC, dorsolateral prefrontal cortex; MFC, medial frontal cortex.
The maps are thresholded to give <1 Type I error cluster per map.
Figure 2.
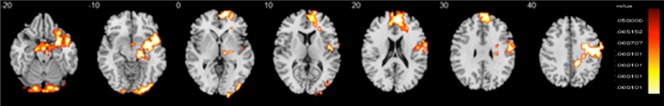
Group differences in the temporal discounting task. Horizontal fMRI sections showing group differences in brain activation between individuals with autism spectrum disorder (ASD) (N = 38) and typically developing controls (N = 40). In the figure, the sections show analysis‐of‐variance (ANOVA) group differences in the temporal discounting task during delayed choices. Activation clusters in orange indicate regions where the ASD group had significantly lower activation relative to the control group. No areas showed higher activation in the ASD group relative to the comparison group. Talairach z‐coordinates are indicated for slice distance (in mm) from the intercommissural line. The right hemisphere corresponds to the right side of the image. [Color figure can be viewed at http://wileyonlinelibrary.com]
In Figure 2, the sections show analysis of variance (ANOVA) group differences in the temporal discounting task during delayed choices. Activation clusters in orange indicate regions where the ASD group had significantly lower activation relative to the Control group. No areas showed higher activation in the ASD group relative to the comparison group. Talairach z coordinates are indicated for slice distance (in mm) from the intercommissural line. The right hemisphere corresponds to the right side of the image.
Group Differences in Whole‐Brain Correlations Between Brain Activation and Age
The group difference analysis of correlations between age and brain activation (using group difference regions as a mask) showed that in two subclusters within regions that differed between groups, controls showed progressively increased activation with increasing age for delayed versus immediate choices relative to people with ASD in vmPFC and right cerebellum (Table 3 and Fig. 3). In the cerebellum, both groups showed increased activation with age for the delayed–immediate contrast, but this age‐correlated activation was significantly larger for controls relative to people with ASD. In vmPFC, the difference in brain function maturation was due to the fact that, with increasing age, people with ASD showed greater activation in this region in immediate versus delayed choices, while controls showed greater activation in this region for delayed–immediate choices.
Table 3.
Group differences between individuals with ASD and typically developing controls in the correlation between brain activation and age in regions that differed between groups and age correlationsb
| Brain regions of activation | Brodman area | Talairach coordinate (x, y, z) | No. of voxels | Cluster P value | Age correlation between BBAM age differences and age in monthsb | |||
|---|---|---|---|---|---|---|---|---|
|
Control Group Correlation |
Control Group, P | ASD Group Correlation | ASD Group, P | |||||
| vmPFC | 25 | −4, 63, 9 | 27 | 0.000001 | −0.345 | 0.029a | −0.120 | 0.471 |
| Right cerebellum | 17 | 14, −88, −23 | 17 | 0.000001 | −0.389 | 0.013a | −0.125 | 0.451 |
Abbreviations: ASD, autism spectrum disorder; control, typically developing controls; No. of voxels, number of voxels; vmPFC, ventromedial prefrontal cortex; P, P value.
Correlation is significant at the 0.05 level (2‐tailed).
Age correlations = age correlations between group differences in whole brain correlations between brain activation and age and age in months.
The maps are thresholded to give <1 Type I error cluster per map.
Figure 3.
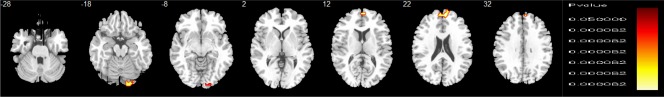
Group differences in whole‐brain correlations between brain activation and age, using a mask of group differences. Horizontal fMRI sections showing group differences in whole‐brain correlations between brain activation and age between individuals with autism spectrum disorder (ASD) (N = 38) and typically developing controls (N = 40). In the figure, the sections show group differences in whole‐brain correlations between brain activation and age during delayed choices. To investigate brain maturation and temporal discounting, we first extracted a 3‐D mask of group differences in brain activation (from our group analysis) and then used this mask to confine our investigation of brain correlations between activation and age to these areas of group differences in activation during TD. Activation clusters shown in orange are those where the control group showed progressively greater activation with increasing age relative to the ASD group, which showed no significant age correlations in these regions. Talairach z‐coordinates are indicated for slice distance (in mm) from the intercommissural line. The right hemisphere corresponds to the right side of the image. [Color figure can be viewed at http://wileyonlinelibrary.com]
To investigate the possible impact of IQ on group differences in whole‐brain correlations between brain activation and age, the analysis was repeated with IQ as a covariate and all findings remained.
Brain Performance and Brain–Behavior Correlations
To investigate whether regions that differed between groups in activation or in correlation between activation and age were associated with performance or behavior, we then extracted each subject's average BOLD response from the clusters found to be different between groups, and correlated these with AUC for each group and, in people with ASD, with ADOS and ADI‐R scores.
In typically developing controls, no correlations between performance and brain activation, or brain activation and age, survived correction for multiple comparisons.
In people with ASD, following correction for multiple comparisons, AUC was significantly positively correlated with the cluster of reduced activation in delayed choice in bilateral cerebellum/occipital lobe (r = 0.48, P = 0.002). ADOS/stereotyped scores correlated significantly negatively with activation in bilateral cerebellum/occipital lobe (r = −0.53, P = 0.001) and with the abnormal age‐correlated right cerebellum cluster with reduced functional maturation (r = −0.42, P = 0.009).
However, AUC was significantly negatively correlated with reduced activation in the right vmPFC/ACC cluster (r = −0.5, P = 0.001), reduced functional maturation of vmPFC (r = −0.527, P = 0.001) and with reduced activation in the right VLPFC/STL/limbic/striatal cluster (r = −0.535, P = 0.001). This suggests that the less people with ASD activated these regions during delayed choices, and the more they activated them during immediate choices, the better their performance. Furthermore, the more these activations were age correlated during immediate choices, the better their performance. In addition, ADI‐R restricted/repetitive scores correlated significantly positively with the vmPFC cluster that was significantly less age correlated in people with ASD relative to controls (r = 0.461, P = 0.004).
To investigate the possible impact of group performance differences on both analyses (group differences in brain activation and group differences in whole‐brain correlations between brain activation and age), we covaried each analysis with the key performance measure (AUC) and all findings remained.
DISCUSSION
Individuals with ASD showed significantly steeper (worse) temporal discounting than typically developing participants. Furthermore, they showed, relative to controls, decreased activation to delayed choices in typical temporal discounting mediating brain regions, including predominantly right hemispheric regions of VLPFC, DLPFC, vmPFC, striato‐limbic regions, and cerebellum. Crucially, abnormal activation in vmPFC and right cerebellum was associated with abnormal functional brain maturation; with increasing age, controls, relative to people with ASD, showed increasing activation in these regions. Furthermore, abnormal activation and functional maturation in cerebellum and vmPFC was associated with worse temporal discounting and clinical symptoms in people with ASD. Overall, findings provide first cross‐sectional evidence that functional abnormalities in individuals with ASD during temporal discounting tasks may be associated with differential neurofunctional maturation of these regions from adolescence to adulthood.
The finding that people with ASD had significantly steeper (worse) temporal discounting, extends our pediatric findings [Chantiluke et al., 2014], but contrasts with other negative results [Demurie et al., 2012]. However, methodological differences (e.g., age, diagnosis, exclusion criteria, and duration of temporal delay) could explain contrasting findings.
Typically developing adolescents and adults showed increased activation relative to people with ASD during delayed choice in typical temporal discounting regions of vmPFC, VLPFC, DLPFC, limbic regions, striatum, and cerebellum [Ballard et al., 2009; Rubia et al., 2009; Wesley and Bickel, 2014]. This extends recent evidence of abnormal brain–behavior associations in frontocerebellar regions during the same task in ASD children [Chantiluke et al., 2014]. Furthermore, the novelty of this study is that some regions that were underactivated during temporal discounting in people with ASD were also differentially age‐correlated. Thus activation in vmPFC and right cerebellum was significantly more age correlated in controls than in people with ASD, suggesting that reduced activation in these regions is associated with diminished functional maturation. If this finding is supported by subsequent longitudinal studies, it suggests that abnormal brain function/behavior itself is associated with subsequent “downstream” maldevelopment of crucial brain systems.
The group differences in brain activation and functional brain maturation survived the covariate analysis with performance (AUC). Although several of these activation differences were related to temporal discounting performance in people with ASD, the covariate analysis suggests that performance differences did not entirely account for the brain activation differences, but that these were dependent on diagnostic group differences.
The components of the PFC‐striatal‐limbic‐cerebellar network are intrinsically linked to reward related temporal decision making and its processing stages of valuation, choice/conflict‐monitoring, and consideration of future outcomes/prospection [Peters and Buchel, 2011]. The dmPFC and PCC are central to reward‐related decision making [Ballard and Knutson, 2009; Wesley and Bickel, 2014], the VS, and vmPFC (and their extensive connections to amygdala and hippocampus) are strongly implicated in reward valuation [Haber and Knutson, 2010; Peters and Buchel, 2010; 2011] and prospection [Schacter et al., 2007] and the VLPFC, insula, and cerebellum are vital in timing and temporal foresight [Wiener et al., 2010; Christakou et al., 2011]. The amygdala is central to decision making and valuation [Peters and Buchel, 2011] and poor decision making is associated with right amygdala damage [Gupta et al., 2011]. The ACC is implicated in choice [Pochon et al., 2008] and the nucleus accumbens evaluates financial risk [Knutson et al., 2008]. Overall, therefore, our findings support increasing evidence of hypoactivation of these areas in people with ASD during other monetary reward related tasks, including vmPFC, basal ganglia, striatum [Kohls et al., 2014], and nucleus accumbens [Dichter et al., 2012].
Furthermore, these findings are in line with our recent sustained attention developmental fMRI study, where we found that abnormal functional activation was associated with abnormalities in the functional brain maturation of fronto‐striatal cerebellar sustained attention networks in children and adults with ASD [Murphy et al., 2014]. This fMRI study adds to evidence of complex, dynamic, age‐specific neuroanatomical changes in the brain structure of people with ASD from childhood to adulthood [Amaral et al., 2008; Murphy et al., 2012; Jou et al., 2013; Lainhart 2015], including fronto‐cerebellar regions [Courchesne et al., 2011; Zielinski et al., 2014].
Moreover, functional activation and functional maturation deficits in cerebellum in people with ASD were significantly correlated with both temporal discounting and ADOS/stereotyped scores. There is increasing recognition of the cerebellum's potentially crucial role in ASD beyond motor anomalies, to other difficulties, including planning, social, and repetitive behaviors [Catani et al., 2008; D'Mello et al., 2015; Mostofsky et al., 2009; Rojas et al., 2006]. It has been suggested that time sensitive disruption in cerebellar connections may disturb maturation of distant fronto‐cerebellar brain circuits and contribute to the behavioral difficulties of people with ASD, including abnormal response to reward and timing [Wang et al., 2014] and that future research should consider timing as a biomarker for cerebellar dysfunction in individuals with ASD and developing cerebellar focused treatments [Fatemi et al., 2012]. Our finding of a negative correlation between ADOS/stereotyped scores with abnormal cerebellar activation in people with ASD supports evidence of associations between repetitive behavior and fronto‐striato‐cerebellar abnormalities in individuals with ASD [Pierce and Courchesne 2001; Rojas et al., 2006; Cheung et al., 2009; Langen et al., 2014; D'Mello et al., 2015].
Strikingly, people with ASD activated vmPFC, ACC and right VLPFC, STL, limbic, and striatal regions more for immediate choices while controls activated them for delayed choices. Furthermore, increased activation in these regions for immediate choices was associated with better temporal discounting performance and more severe symptoms of ASD. The vmPFC, ACC, VLPFC, limbic, and striatal regions are vital temporal discounting mediating brain regions [Peters et al., 2011]. In typical development from adolescence to adulthood [Christakou et al., 2011], progressively increased activation of the vmPFC and its top–down, presumably inhibitory, control over the VS has been associated with better temporal discounting. The findings suggest that people with ASD use the same brain regions but in different contrasts than controls, presumably reflecting a more immature alternative activation pattern, where the shift to the adult pattern of activating these regions more for delayed than immediate choices has not yet happened [Christakou et al., 2011]. This hypothesis is supported by the finding that vmPFC activation for delayed choices correlated with age in controls but not in people with ASD, where it correlated with age for immediate choices.
LIMITATIONS
This study was cross‐sectional, specific to high functioning males with ASD, lacked pubertal developmental measures [Urosevic et al., 2014] and did not include a semi‐structured clinical interview of possible psychiatric comorbidity such as the SCID‐5‐RV. Hence, our findings describe age‐related differences that may not generalize to others within the autism spectrum, including females [Craig et al., 2007; Ecker et al., 2017; Wilson et al., 2016]. However, study strengths include the relatively large sample of physically healthy, medication naive, clearly diagnosed males with ASD without confounding psychiatric diagnoses and matched controls, and the 25 year age span from childhood to adulthood.
CONCLUSION
This is the first cross‐sectional developmental fMRI investigation of brain activation and functional brain development in healthy adolescents and adults with ASD and typically developing people in temporal discounting. Findings show that individuals with ASD have differential activation of vmPFC, VLPFC, limbic, striatal, and cerebellar regions during delayed choices in temporal discounting and that in vmPFC and cerebellar regions, this is associated with abnormal functional brain development between childhood and adulthood and with clinical ASD measures of the behavioral phenotype (stereotyped/restricted interests) and temporal discounting. This may contribute to difficulties with reward‐based decision making and forward thinking for individuals with ASD in childhood and adulthood. Longitudinal studies are required to identify the development of reward‐based decision making and timing networks from childhood to adulthood in ASD and enable development of novel age‐appropriate treatments.
FINANCIAL DISCLOSURES
KR has received funding from Lilly for other projects and speaker's honoraria from Lilly, Shire, and Novartis. MB has served as a consultant for P1Vital. CM has received funding from Lilly for another project and speaker's honoraria from Shire and Flynn Pharma. None of the other authors reported any financial interests or potential conflicts of interests associated with this study.
ACKNOWLEDGMENTS
The authors thank all the individuals and their families who participated in this study and the National Autistic Society for their help in recruiting participants. They are also grateful for the assistance of the radiographers and physicists of the Centre for Neuroimaging Sciences, Institute of Psychiatry, Psychology & Neuroscience, King's College London.
REFERENCES
- Amaral DG, Schumann CM, Nordahl CW (2008): Neuroanatomy of autism. Trends Neurosci 31:137–145. [DOI] [PubMed] [Google Scholar]
- Ballard K, Knutson B (2009): Dissociable neural representations of future reward magnitude and delay during temporal discounting. NeuroImage 45:143–150. [DOI] [PMC free article] [PubMed] [Google Scholar]
- Barkley R, Murphy K (2005): Attention Deficit Hyperactivity Disorder: A Clinical Workbook, 3rd ed. New York: Guilford. [Google Scholar]
- Bickel WK, MacKillop J, Madden GJ, Odum AL, Yi R (2015): Experimental manipulations of delay discounting & related processes: An introduction to the special issue. J Exp Anal Behav 103:1–9. [DOI] [PMC free article] [PubMed] [Google Scholar]
- Blackwood N, Ffytche D, Simmons A, Bentall R, Murray R, Howard R (2004): The cerebellum and decision making under uncertainty. Brain Res Cogn Brain Res 20:46–53. [DOI] [PubMed] [Google Scholar]
- Bramham J, Ambery F, Young S, Morris R, Russell A, Xenitidis K, et al. (2009): Executive functioning differences between adults with attention deficit hyperactivity disorder and autistic spectrum disorder in initiation, planning and strategy formation. Autism 13:245–264. [DOI] [PubMed] [Google Scholar]
- Brammer MJ, Bullmore ET, Simmons A, Williams SC, Grasby PM, Howard RJ, et al. (1997): Generic brain activation mapping in functional magnetic resonance imaging: A nonparametric approach. Magn Reson Imag 15:763–770. [DOI] [PubMed] [Google Scholar]
- Brenner LA, Shih VH, Colich NL, Sugar CA, Bearden CE, Dapretto M (2015): Time reproduction performance is associated with age and working memory in high‐functioning youth with autism spectrum disorder. Autism Res 8:29–37. [DOI] [PMC free article] [PubMed] [Google Scholar]
- Buescher AV, Cidav Z, Knapp M, Mandell DS (2014): Costs of autism spectrum disorders in the United Kingdom and the United States. JAMA Pediatr 168:721–728. [DOI] [PubMed] [Google Scholar]
- Bullmore ET, Brammer MJ, Rabe‐Hesketh S, Curtis VA, Morris RG, Williams SC, et al. (1999): Methods for diagnosis and treatment of stimulus‐correlated motion in generic brain activation studies using fMRI. Hum Brain Mapp 7:38–48. [DOI] [PMC free article] [PubMed] [Google Scholar]
- Bullmore ET, Suckling J, Overmeyer S, Rabe‐Hesketh S, Taylor E, Brammer MJ (1999): Global, voxel, and cluster tests, by theory and permutation, for a difference between two groups of structural MR images of the brain. IEEE Trans Med Imag 18:32–42. [DOI] [PubMed] [Google Scholar]
- Carper RA, Moses P, Tigue ZD, Courchesne E (2002): Cerebral lobes in autism: Early hyperplasia and abnormal age effects. NeuroImage 16:1038–1051. [DOI] [PubMed] [Google Scholar]
- Catani M, Jones DK, Daly E, Embiricos N, Deeley Q, Pugliese L, et al. (2008): Altered cerebellar feedback projections in Asperger syndrome. NeuroImage 41:1184–1191. [DOI] [PubMed] [Google Scholar]
- Chantiluke K, Christakou A, Murphy CM, Giampietro V, Daly EM, Ecker C, et al. (2014): Disorder‐specific functional abnormalities during temporal discounting in youth with Attention Deficit Hyperactivity Disorder (ADHD), Autism and comorbid ADHD and Autism. Psychiatry Res 223:113–120. [DOI] [PubMed] [Google Scholar]
- Cheung C, Chua SE, Cheung V, Khong PL, Tai KS, Wong TK, et al. (2009): White matter fractional anisotrophy differences and correlates of diagnostic symptoms in autism. J Child Psychol Psychiatry 50:1102–1112. [DOI] [PubMed] [Google Scholar]
- Christakou A, Brammer M, Rubia K (2011): Maturation of limbic corticostriatal activation and connectivity associated with developmental changes in temporal discounting. NeuroImage 54:1344–1354. [DOI] [PubMed] [Google Scholar]
- Conners CK, Sitarenios G, Parker JD, Epstein JN (1998): The revised Conners' Parent Rating Scale (CPRS‐R): Factor structure, reliability, and criterion validity. J Abnorm Child Psychol 26:257–268. [DOI] [PubMed] [Google Scholar]
- Courchesne E, Campbell K, Solso S (2011): Brain growth across the life span in autism: Age‐specific changes in anatomical pathology. Brain Res 1380:138–145. [DOI] [PMC free article] [PubMed] [Google Scholar]
- Craig MC, Zaman SH, Daly EM, Cutter WJ, Robertson DM, Hallahan B, et al. (2007): Women with autistic‐spectrum disorder: Magnetic resonance imaging study of brain anatomy. Br J Psychiatry 191:224–228. [DOI] [PubMed] [Google Scholar]
- Critchfield TS, Kollins SH (2001): Temporal discounting: Basic research and the analysis of socially important behavior. J Appl Behav Anal 34:101–122. [DOI] [PMC free article] [PubMed] [Google Scholar]
- D'Mello AM, Crocetti D, Mostofsky SH, Stoodley CJ (2015): Cerebellar gray matter and lobular volumes correlate with core autism symptoms. NeuroImage Clin 7:631–639. [DOI] [PMC free article] [PubMed] [Google Scholar]
- Damiano CR, Aloi J, Treadway M, Bodfish JW, Dichter GS (2012): Adults with autism spectrum disorders exhibit decreased sensitivity to reward parameters when making effort‐based decisions. J Neurodev Disord 4:13. [DOI] [PMC free article] [PubMed] [Google Scholar]
- Demurie E, Roeyers H, Baeyens D, Sonuga‐Barke E (2012): Temporal discounting of monetary rewards in children and adolescents with ADHD and autism spectrum disorders. Dev Sci 15:791–800. [DOI] [PubMed] [Google Scholar]
- Dichter GS, Felder JN, Green SR, Rittenberg AM, Sasson NJ, Bodfish JW (2012): Reward circuitry function in autism spectrum disorders. Soc Cogn Affect Neurosci 7:160–172. [DOI] [PMC free article] [PubMed] [Google Scholar]
- Ecker C, Andrews DS, Gudbrandsen CM, Marquand AF, Ginestet CE, Daly EM, et al. (2017): Association between the probability of autism spectrum disorder and normative sex‐related phenotypic diversity in brain structure. JAMA Psychiatry 74:329–338. [DOI] [PMC free article] [PubMed] [Google Scholar]
- Fatemi SH, Aldinger KA, Ashwood P, Bauman ML, Blaha CD, Blatt GJ, et al. (2012): Consensus paper: Pathological role of the cerebellum in autism. Cerebellum 11:777–807. [DOI] [PMC free article] [PubMed] [Google Scholar]
- Geurts HM, Verte S, Oosterlaan J, Roeyers H, Sergeant JA (2004): How specific are executive functioning deficits in attention deficit hyperactivity disorder and autism? J Child Psychol Psychiatry 45:836–854. [DOI] [PubMed] [Google Scholar]
- Goldberg DP, Hillier VF (1979): A scaled version of the General Health Questionnaire. Psychol Med 9:139–145. [DOI] [PubMed] [Google Scholar]
- Goodman R, Ford T, Simmons H, Gatward R, Meltzer H (2000): Using the Strengths and Difficulties Questionnaire (SDQ) to screen for child psychiatric disorders in a community sample. Br J Psychiatry 177:534–539. [DOI] [PubMed] [Google Scholar]
- Green J, Gilchrist A, Burton D, Cox A (2000): Social and psychiatric functioning in adolescents with Asperger syndrome compared with conduct disorder. J Autism Dev Disord 30:279–293. [DOI] [PubMed] [Google Scholar]
- Gupta R, Koscik TR, Bechara A, Tranel D (2011): The amygdala and decision‐making. Neuropsychologia 49:760–766. [DOI] [PMC free article] [PubMed] [Google Scholar]
- Haber SN, Knutson B (2010): The reward circuit: Linking primate anatomy and human imaging. Neuropsychopharmacology 35:4–26. [DOI] [PMC free article] [PubMed] [Google Scholar]
- Hanson LK, Atance CM (2014): Brief report: Episodic foresight in autism spectrum disorder. J Autism Dev Disord 44:674–684. [DOI] [PubMed] [Google Scholar]
- Hare TA, Camerer CF, Rangel A (2009): Self‐control in decision‐making involves modulation of the vmPFC valuation system. Science 324:646–648. [DOI] [PubMed] [Google Scholar]
- Hazlett HC, Poe MD, Gerig G, Styner M, Chappell C, Smith RG, et al. (2011): Early brain overgrowth in autism associated with an increase in cortical surface area before age 2 years. Arch Gen Psychiatry 68:467–476. [DOI] [PMC free article] [PubMed] [Google Scholar]
- Jou RJ, Frazier TW, Keshavan MS, Minshew NJ, Hardan AY (2013): A two‐year longitudinal pilot MRI study of the brainstem in autism. Behav Brain Res 251:163–167. [DOI] [PMC free article] [PubMed] [Google Scholar]
- Knutson B, Wimmer GE, Kuhnen CM, Winkielman P (2008): Nucleus accumbens activation mediates the influence of reward cues on financial risk taking. Neuroreport 19:509–513. [DOI] [PubMed] [Google Scholar]
- Kohls G, Thonessen H, Bartley GK, Grossheinrich N, Fink GR, Herpertz‐Dahlmann B, et al. (2014): Differentiating neural reward responsiveness in autism versus ADHD. Dev Cogn Neurosci 10:104–116. [DOI] [PMC free article] [PubMed] [Google Scholar]
- Lainhart JE (2015): Brain imaging research in autism spectrum disorders: In search of neuropathology and health across the lifespan. Curr Opin Psychiatry 28:76–82. [DOI] [PMC free article] [PubMed] [Google Scholar]
- Lange N, Travers BG, Bigler ED, Prigge MB, Froehlich AL, Nielsen JA, et al. (2015): Longitudinal volumetric brain changes in autism spectrum disorder ages 6–35 years. Autism Res 8:82–93. [DOI] [PMC free article] [PubMed] [Google Scholar]
- Langen M, Bos D, Noordermeer SD, Nederveen H, van Engeland H, Durston S (2014): Changes in the development of striatum are involved in repetitive behavior in autism. Biol Psychiatry 76:405–411. [DOI] [PubMed] [Google Scholar]
- Lind SE, Williams DM, Raber J, Peel A, Bowler DM (2013): Spatial navigation impairments among intellectually high‐functioning adults with autism spectrum disorder: Exploring relations with theory of mind, episodic memory, and episodic future thinking. J Abnorm Psychol 122:1189–1199. [DOI] [PMC free article] [PubMed] [Google Scholar]
- Lord C, Risi S, Lambrecht L, Cook EH, Jr. , Leventhal BL, DiLavore PC, et al. (2000): The autism diagnostic observation schedule‐generic: A standard measure of social and communication deficits associated with the spectrum of autism. J Autism Dev Disord 30:205–223. [PubMed] [Google Scholar]
- Lord C, Rutter M, Le Couteur A (1994): Autism diagnostic interview‐revised: A revised version of a diagnostic interview for caregivers of individuals with possible pervasive developmental disorders. J Autism Dev Disord 24:659–685. [DOI] [PubMed] [Google Scholar]
- Luke L, Clare IC, Ring H, Redley M, Watson P (2012): Decision‐making difficulties experienced by adults with autism spectrum conditions. Autism 16:612–621. [DOI] [PubMed] [Google Scholar]
- Minassian A, Paulus M, Lincoln A, Perry W (2007): Adults with autism show increased sensitivity to outcomes at low error rates during decision‐making. J Autism Dev Disord 37:1279–1288. [DOI] [PubMed] [Google Scholar]
- Mostofsky SH, Powell SK, Simmonds DJ, Goldberg MC, Caffo B, Pekar JJ (2009): Decreased connectivity and cerebellar activity in autism during motor task performance. Brain 132:2413–2425. [DOI] [PMC free article] [PubMed] [Google Scholar]
- Murphy CM, Christakou A, Daly EM, Ecker C, Giampietro V, Brammer M, et al. (2014): Abnormal functional activation and maturation of fronto‐striato‐temporal and cerebellar regions during sustained attention in autism spectrum disorder. Am J Psychiatry 171:1107–1116. [DOI] [PubMed] [Google Scholar]
- Murphy CM, Deeley Q, Daly EM, Ecker C, O'Brien FM, Hallahan B, et al. (2012): Anatomy and aging of the amygdala and hippocampus in autism spectrum disorder: An in vivo magnetic resonance imaging study of Asperger syndrome. Autism Res 5:3–12. [DOI] [PubMed] [Google Scholar]
- Murphy CM, Wilson CE, Robertson DM, Ecker C, Daly EM, Hammond N, et al. (2016): Autism spectrum disorder in adults: Diagnosis, management, and health services development. Neuropsychiatr Dis Treat 12:1669–1686. [DOI] [PMC free article] [PubMed] [Google Scholar]
- Murphy DG, Beecham J, Craig M, Ecker C (2011): Autism in adults. New biologicial findings and their translational implications to the cost of clinical services. Brain Res 1380:22–33. [DOI] [PubMed] [Google Scholar]
- Myerson J, Green L, Morris J (2011): Modeling the effect of reward amount on probability discounting. J Exp Anal Behav 95:175–187. [DOI] [PMC free article] [PubMed] [Google Scholar]
- Myerson J, Green L, Warusawitharana M (2001): Area under the curve as a measure of discounting. J Exp Anal Behav 76:235–243. [DOI] [PMC free article] [PubMed] [Google Scholar]
- Noreika V, Falter CM, Rubia K (2013): Timing deficits in attention‐deficit/hyperactivity disorder (ADHD): Evidence from neurocognitive and neuroimaging studies. Neuropsychologia 51:235–266. [DOI] [PubMed] [Google Scholar]
- Oldfield RC (1971): The assessment and analysis of handedness: The Edinburgh inventory. Neuropsychologia 9:97–113. [DOI] [PubMed] [Google Scholar]
- Ozonoff S, Cook I, Coon H, Dawson G, Joseph RM, Klin A, et al. (2004): Performance on Cambridge neuropsychological test automated battery subtests sensitive to frontal lobe function in people with autistic disorder: Evidence from the Collaborative Programs of Excellence in Autism network. J Autism Dev Disord 34:139–150. [DOI] [PubMed] [Google Scholar]
- Peters J, Buchel C (2010): Episodic future thinking reduces reward delay discounting through an enhancement of prefrontal‐mediotemporal interactions. Neuron 66:138–148. [DOI] [PubMed] [Google Scholar]
- Peters J, Buchel C (2011): The neural mechanisms of inter‐temporal decision‐making: Understanding variability. Trends Cogn Sci 15:227–239. [DOI] [PubMed] [Google Scholar]
- Pierce K, Courchesne E (2001): Evidence for a cerebellar role in reduced exploration and stereotyped behavior in autism. Biol Psychiatry 49:655–664. [DOI] [PubMed] [Google Scholar]
- Pochon JB, Riis J, Sanfey AG, Nystrom LE, Cohen JD (2008): Functional imaging of decision conflict. J Neurosci 28:3468–3473. [DOI] [PMC free article] [PubMed] [Google Scholar]
- Richards JB, Mitchell SH, de Wit H, Seiden LS (1997): Determination of discount functions in rats with an adjusting‐amount procedure. J Exp Anal Behav 67:353–366. [DOI] [PMC free article] [PubMed] [Google Scholar]
- Richards JB, Zhang L, Mitchell SH, de Wit H (1999): Delay or probability discounting in a model of impulsive behavior: Effect of alcohol. J Exp Anal Behav 71:121–143. [DOI] [PMC free article] [PubMed] [Google Scholar]
- Rojas DC, Peterson E, Winterrowd E, Reite ML, Rogers SJ, Tregellas JR (2006): Regional gray matter volumetric changes in autism associated with social and repetitive behavior symptoms. BMC Psychiatry 6:56. [DOI] [PMC free article] [PubMed] [Google Scholar]
- Rubia K, Halari R, Christakou A, Taylor E (2009): Impulsiveness as a timing disturbance: Neurocognitive abnormalities in attention‐deficit hyperactivity disorder during temporal processes and normalization with methylphenidate. Philos Trans R Soc Lond B Biol Sci 364:1919–1931. [DOI] [PMC free article] [PubMed] [Google Scholar]
- Russell AJ, Murphy CM, Wilson E, Gillan N, Brown C, Robertson DM, et al. (2016): The mental health of individuals referred for assessment of autism spectrum disorder in adulthood: A clinic report. Autism 20:623–627. [DOI] [PubMed] [Google Scholar]
- Schacter DL, Addis DR, Buckner RL (2007): Remembering the past to imagine the future: The prospective brain. Nat Rev Neurosci 8:657–661. [DOI] [PubMed] [Google Scholar]
- Simonoff E, Pickles A, Charman T, Chandler S, Loucas T, Baird G (2008): Psychiatric disorders in children with autism spectrum disorders: Prevalence, comorbidity, and associated factors in a population‐derived sample. J Am Acad Child Adolesc Psychiatry 47:921–929. [DOI] [PubMed] [Google Scholar]
- Sinzig J, Morsch D, Bruning N, Schmidt MH, Lehmkuhl G (2008): Inhibition, flexibility, working memory and planning in autism spectrum disorders with and without comorbid ADHD‐symptoms. Child Adolesc Psychiatry Ment Health 2:4. [DOI] [PMC free article] [PubMed] [Google Scholar]
- Steinbeis N, Haushofer J, Fehr E, Singer T (2014): Development of behavioral control and associated vmPFC–DLPFC connectivity explains children's increased resistance to temptation in intertemporal choice. Cereb Cortex. [DOI] [PubMed] [Google Scholar]
- Steinberg L, Graham S, O'Brien L, Woolard J, Cauffman E, Banich M (2009): Age differences in future orientation and delay discounting. Child Dev 80:28–44. [DOI] [PubMed] [Google Scholar]
- Szelag E, Kowalska J, Galkowski T, Poppel E (2004): Temporal processing deficits in high‐functioning children with autism. Br J Psychol 95:269–282. [DOI] [PubMed] [Google Scholar]
- Talairach J, Tournoux P (1988): Co‐Planar Stereotaxic Atlas of the Brain. New York: Thieme. [Google Scholar]
- Thirion B, Pinel P, Meriaux S, Roche A, Dehaene S, Poline JB (2007): Analysis of a large fMRI cohort: Statistical and methodological issues for group analyses. NeuroImage 35:105–120. [DOI] [PubMed] [Google Scholar]
- UN (2007): World Autism Awareness Day U. N. G. A. Resolution. NY: United Nations General Assembly. [Google Scholar]
- Urosevic S, Collins P, Muetzel R, Lim KO, Luciana M (2014): Pubertal status associations with reward and threat sensitivities and subcortical brain volumes during adolescence. Brain Cogn 89:15–26. [DOI] [PMC free article] [PubMed] [Google Scholar]
- Wang SS, Kloth AD, Badura A (2014): The cerebellum, sensitive periods, and autism. Neuron 83:518–532. [DOI] [PMC free article] [PubMed] [Google Scholar]
- Wechsler D (1999): Wechsler Abbreviated Scale of Intelligence. San Antonio, Texas: Psychological Corp. [Google Scholar]
- Wesley MJ, Bickel WK (2014): Remember the future II: Meta‐analyses and functional overlap of working memory and delay discounting. Biol Psychiatry 75:435–448. [DOI] [PMC free article] [PubMed] [Google Scholar]
- WHO (1993): The ICD‐10 Classification of Mental and Behavioural Disorders: Diagnostic Criteria for Research. Geneva. [Google Scholar]
- WHO (2013): Autism Spectrum Disorders and Other Developmental Disorders: From Raising Awareness to Building Capacity W. H. Organisation. Switzerland, Geneva. [Google Scholar]
- Wiehler A, Peters J (2015): Reward‐based decision making in pathological gambling: The roles of risk and delay. Neurosci Res 90:3–14. [DOI] [PubMed] [Google Scholar]
- Wiener M, Turkeltaub P, Coslett HB (2010): The image of time: A voxel‐wise meta‐analysis. NeuroImage 49:1728–1740. [DOI] [PubMed] [Google Scholar]
- Wilson CE, Murphy CM, McAlonan G, Robertson DM, Spain D, Hayward H, et al. (2016): Does sex influence the diagnostic evaluation of autism spectrum disorder in adults? Autism 20:808–819. [DOI] [PMC free article] [PubMed] [Google Scholar]
- Zielinski BA, Prigge MB, Nielsen JA, Froehlich AL, Abildskov TJ, Anderson JS, et al. (2014): Longitudinal changes in cortical thickness in autism and typical development. Brain 137:1799–1812. [DOI] [PMC free article] [PubMed] [Google Scholar]