

Abstract
Enhanced beta‐band activity recorded in patients suffering from Parkinson‘s Disease (PD) has been described as a potential physiomarker for disease severity. Beta power is suppressed by Levodopa intake and STN deep brain stimulation (DBS) and correlates with disease severity across patients. The aim of the present study was to explore the promising signature of the physiomarker in the spatial domain. Based on local field potential data acquired from 54 patients undergoing STN‐DBS, power values within alpha, beta, low beta, and high beta bands were calculated. Values were projected into common stereotactic space after DBS lead localization. Recorded beta power values were significantly higher at posterior and dorsal lead positions, as well as in active compared with inactive pairs. The peak of activity in the beta band was situated within the sensorimotor functional zone of the nucleus. In contrast, higher alpha activity was found in a more ventromedial region, potentially corresponding to associative or premotor functional zones of the STN. Beta‐ and alpha‐power peaks were then used as seeds in a fiber tracking experiment. Here, the beta‐site received more input from primary motor cortex whereas the alpha‐site was more strongly connected to premotor and prefrontal areas. The results summarize predominant spatial locations of frequency signatures recorded in STN‐DBS patients in a probabilistic fashion. The site of predominant beta‐activity may serve as an electrophysiologically determined target for optimal outcome in STN‐DBS for PD in the future. Hum Brain Mapp 38:3377–3390, 2017. © 2017 Wiley Periodicals, Inc.
Keywords: deep brain stimulation, beta power, Parkinson's disease, magnetic resonance imaging, diffusion spectrum imaging, DTI
Abbreviations
- BA
Brodmann area
- DARTEL
method describing a fast diffeomorphic image registration algorithm
- DBS
deep brain stimulation
- FOV
field of view
- LFP
local field potentials
- MNI
Montreal Neurological Institute, here refers to a standard stereotactic space
- PD
Parkinson's disease
- SAR
specific absorption rate
- STN
subthalamic nucleus
- TE
echo time
- TR
repetition time
- VTA
volume of tissue activated
INTRODUCTION
STN‐DBS in patients suffering from Parkinson's disease (PD) is a well‐established therapy with excellent short and long term clinical results and significant improvement in quality of life [Deuschl et al., 2006; Krack et al., 2003; Schuepbach et al., 2013]. Patient selection and electrode placement are the most important factors to achieve maximal benefit from DBS. However, the optimal site of DBS electrode placement within the STN remains a matter of debate [Butson et al., 2011; Eisenstein et al., 2014; Herzog et al., 2004; Maks et al., 2009; Nowinski et al., 2005; Welter et al., 2014; Wodarg et al., 2012]. In recent years, enhanced beta band power of subthalamic local field potential activity (13–30 Hz) has been identified as an electrophysiological signature in PD [Brown, 2003; Hammond et al., 2007; Kühn and Volkmann, 2017]. STN beta power off medication correlates with motor impairment in PD [Neumann et al., 2016; Van Wijk et al., 2016]. Enhanced beta band activity is suppressed by levodopa [Geng et al., 2017; Kühn et al., 2006a, 2006b, 2009] and during DBS [Eusebio et al., 2011; Kühn et al., 2008] in parallel with improvement of motor symptoms, especially bradykinesia and rigidity. This led authors to conclude that enhanced beta activity is associated with a hypo‐dopaminergic state [Geng et al., 2017]. Neurons with predominant firing frequencies within beta range are more frequent in the dorso‐lateral portion of the STN [Trottenberg et al., 2007; Weinberger et al., 2006; Zaidel et al., 2010] which corresponds to the sensorimotor functional zone of the nucleus [Accolla et al., 2014; Lambert et al., 2012], forming part of the cortex–basal ganglia motor loop [Haynes and Haber, 2013; Litvak et al., 2011]. In agreement, clinical outcome of DBS correlated with the length of the electrode trajectory displaying beta band activity during DBS surgery [Zaidel et al., 2010]. Moreover, first promising results with adaptive DBS underline that the amount of local STN beta power can be used as a threshold to trigger stimulation periods [Little et al., 2013]. Further extending these findings into a network domain, simultaneous magnetoencephalography and LFP recordings showed that DBS targets communicate on different frequency bands with different cortical areas, respectively [Cao et al., 2017; Hirschmann et al., 2013; Litvak et al., 2011; Neumann et al., 2015a]. Information processing within the beta band was related to motor cortical areas irrespective of underlying disease and subcortical target structure. Finally, a recent study extended these findings by showing that high beta power is associated with structural connectivity to primary motor cortices [Accolla et al., 2016].
Given this tight relationship between STN beta activity, motor function, and connectivity to motor cortical areas from the sensorimotor STN, beta activity may serve as a physiomarker for effective STN‐DBS. The aim of this study was to explore beta power in the spatial domain by mapping values recorded across a large cohort of PD patients onto anatomical space. Our primary hypothesis was that higher amounts of beta activity could be found within the dorso‐lateral part of the STN. This would further illustrate a direct relationship between beta power and motor function of the nucleus. A second hypothesis was that beta power recorded from contact pairs actively used for DBS would exceed the power recorded from inactive contact pairs. This would show that active contacts were chosen to reside within areas of enhanced beta activity. The goal of the study was to create a probabilistic electrophysiological atlas of STN activity based on LFP recordings. Given the great importance and predictive power of the enhanced beta activity in PD, a spatial mapping of power values may serve to better understand the functional architecture of the nucleus. Furthermore, the area from which highest beta power values were recorded could electrophysiologically define the “optimal” target site for deep brain stimulation surgery in the STN. Thus, in future patients, such an atlas could be used to (i) identify an optimal stimulation site in presurgical planning and (ii) to tune stimulation parameters for an optimal stimulation effect postoperatively.
METHODS
Patients and Surgery
In total, 63 patients that underwent DBS surgery for severe Parkinson's disease (PD) between 2000 and 2014 were included in this retrospective study. From these, nine patients had to be excluded due to motion artifacts or pneumocephalus on postoperative imaging (6), poor image quality that rendered an exact localization of DBS electrodes impossible (2), or missing postoperative imaging data (1) resulting in a final cohort of 54 patients (33 male; mean age 61.4 ± 9.0 years, range 32–79 years). All patients received two quadripolar DBS leads of electrode model 3389 bilaterally (Medtronic, Minnesota; contact‐to‐contact distance of 0.5, 2‐mm distance between centers of two adjacent contacts). Surgery was performed under generalized anesthesia but patients were awakened for two brief sessions in which microelectrode‐recording and clinical testing were performed.
Imaging
All patients underwent pre‐operative MR‐imaging on a 1.5 T scanner (NT Intera; Philips Medical Systems, Best, The Netherlands) using a T2‐weighted fast spin‐echo (FSE) with the following parameters: TR = 3,500 ms, TE = 138 ms, echo‐train length: 8, excitations: 3, flip angle: 90°, section thickness: 2 mm, section gap: 0.2 mm, FOV: 260 mm (in‐plane resolution 0.51 × 0.51 mm), matrix size: 384 interpolated to 512, total acquisition time, 10 min and 41s.
Postoperative MR‐imaging was performed in 51 patients. Within 5 days after implantation of the electrodes, MR‐imaging was performed on the same scanner using a T2‐weighted fast spin‐echo sequence in low SAR mode with the same parameters as used pre‐operatively. Philips software Version 11.1 level 4 was used. MR sections in the axial and coronal planes were obtained and processed in this study. In the following, “axial” and “coronal” volumes refer to acquisitions with voxel sizes of 0.51 × 0.51 mm in the axial or coronal planes respectively, each with a slice thickness of 2 mm.
Postoperative high‐resolution CT images were acquired in the remaining three patients on a LightSpeed16 (GE Medical System, Milwaukee, Wisconsin) Slice CT with a spatial resolution of 0.49 × 0.49 × 0.67 mm3. Images were acquired in axial (i.e., sequential/incremental) order at 140 kV and automated mA setting. Noise index was 7.0. A large SFOV with 50 cm diameter was used.
Postoperative electrode localizations were performed using Lead‐DBS software [http://www.lead-dbs.org; Horn and Kühn, 2015; RRID:SCR_002915]. Namely, postoperative images were linearly co‐registered to preoperative images using SPM12 [http://www.fil.ion.ucl.ac.uk/spm/software/spm12/; Friston et al., 2011; RRID:SCR_007037; MR modality], and BRAINSFit software [https://www.nitrc.org/projects/multimodereg/; Johnson et al., 2007; RRID:SCR_002340; CT modality]. Images were then nonlinearly warped into standard stereotactic (MNI; ICBM152 2009b non‐linear asymmetric) space using a fast diffeomorphic image registration algorithm [DARTEL; Ashburner, 2007]. Electrode trajectories were automatically pre‐localized and results were manually refined in MNI space using Lead‐DBS.
To identify electrode contacts that resided within/outside the STN, distances between the centers of electrode contacts and their nearest voxel of the STN volume defined on an MNI version [Jakab et al., 2012] of the histology‐based Morel atlas [Morel, 2013] were calculated. Contacts with distances below 0.5 mm were considered to be placed within the STN.
LFP Recordings and Analysis
LFP were acquired within an interval of two to seven days after surgery with externalized electrode leads using an external amplifier. The exact setup of LFP‐recordings and signal processing procedures are described in detail elsewhere [Neumann et al., 2015a, 2015b]. Briefly, bipolar LFP activity was recorded from adjacent contact pairs (01,12,23) in each DBS electrode. Signals were amplified 50k fold and band‐pass filtered at 0.5–250 Hz on a Digitimer D360 (Digitimer Ltd., Welwyn Garden City, Hertfordshire, UK). They were recorded via a 1401 AD converter (Cambridge Electronic Design, CED, Cambridge, UK) using Spike2 software (CED, Cambridge, UK). Sampling rate was 1 kHz. In all patients, LFP recordings of 3–5 min duration were performed at rest after overnight withdrawal of dopaminergic medication. Data were visually inspected and artifacts were rejected. Contact pairs without artifact free segments were excluded from the analysis. All raw data were transformed into frequency domain by Fourier transform based methods using custom code based on FieldTrip [http://www.fieldtriptoolbox.org; Oostenveld et al., 2011; RRID:SCR_004849] and SPM12. The resulting power spectra were normalized to the percentage total power of 5–45 Hz and 55–95 Hz to omit potential variations of contact and tissue impedances along the electrode. The 0–5 and 45–55 Hz bands were excluded, because they are prone to movement artifacts and mains noise, respectively.
For each pair of neighboring electrode contacts, a value of alpha‐, beta‐, low beta‐, and high beta‐power was calculated by averaging spectral power amplitudes for 7–13 Hz, 13–35 Hz, 13–20 Hz, or 20–35 Hz, respectively. In total, this resulted in 4 × 324 values. Data from 15 channels had to be excluded due to artifacts and noise on the LFP recordings, resulting in a final dataset of 309 power values for each frequency band.
Probabilistic Mapping of LFP Results and Determination of Active/Inactive Contact Pairs
All available power values were mapped onto subcortical anatomy of the brain in common (MNI) space. Each datapoint was mapped to the Euclidean midpoint between the coordinates representing the two electrode contacts from which the signal was recorded. Datapoints from the right hemisphere of the brain were projected onto the left hemisphere and data was pooled across hemispheres. This led to a point cloud that accounted for beta or alpha power values in anatomical space. A scattered interpolant was calculated to estimate power values in the space between data points. No extrapolation (stretching spatially beyond the field of data values) was applied. A fine equidistant grid with a spacing of 0.2 mm in each direction was projected onto the data and interpolated values were obtained for each grid point. To attain for better normality in probabilistic atlases, resulting 3D image data was smoothed using a Gaussian kernel with full‐width‐half‐maximum of 0.7 mm. Figure 1 gives an overview about the mapping method. For 3D visualization, atlases were thresholded at their mean values plus one standard‐deviation (a power value of 3.9 in case of the alpha atlas and 2.1 in case of the beta atlas). Data was visualized on two‐dimensional planes and in 3D renderings using Lead‐DBS software for all figures except for fiber tracking results (see below) which were rendered using Caret5 (http://brainvis.wustl.edu/wiki/index.php; RRID:SCR_006260) and TrackVis software (http://trackvis.org/; v.0.6.0.1; RRID:SCR_004817).
Figure 1.
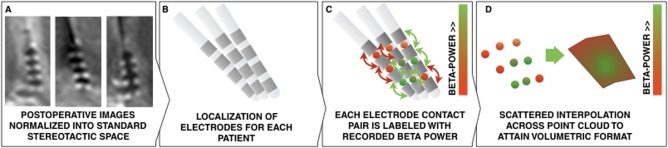
Overview of electrode mapping using the example of beta power. A) Normalization of postoperative images into MNI space. B) Localization of electrode placement using Lead‐DBS. C) Each electrode contact pair is labeled with its according beta‐power. This generates a point‐cloud of data values in three‐dimensional (anatomical) space. D) By estimating a scattered interpolant across data points, a slice visualization or 3D isovolume visualization (see Fig. 4) becomes feasible. [Color figure can be viewed at http://wileyonlinelibrary.com]
To test for a significant relationship between spatial position of recording site and electrophysiological power values, a general linear model was fit, treating the x‐, y‐ and z‐coordinates of contact pair centers in standard space as independent variables and the measured power value as dependent variable. Before, power values were transformed to a Gaussian distribution following the method of van Albada [van Albada and Robinson, 2007]. Please note that this latter processing step did not alter outcome (see Results).
Clinically active contacts were defined based on the most recent entry in the DBS database of our center. A contact pair was considered active if one or both contacts were active (i.e., serving as the cathode) based on most recent stimulation settings. A paired t‐test between normalized power values in active and inactive contact pairs across patients was performed.
Diffusion Data
To establish connectivity between “alpha” and “beta” regions of the mapped LFP recordings, diffusion spectrum and T2‐weighted imaging data from 32 subjects of the Human Connectome Project (HCP) at Massachusetts General Hospital [“MGH HCP Adult Diffusion”; Setsompop et al., 2013; RRID:SCR_003490] were obtained from the HCP database (https://ida.loni.usc.edu/login.jsp). Data was processed using a generalized q‐sampling imaging algorithm [Yeh et al., 2010] as implemented in DSI studio (http://dsi-studio.labsolver.org; RRID:SCR_009557). With the 92% valid connections, the deterministic fiber tracking approach implemented in DSI studio achieved the highest valid connection count in comparison to 96 methods submitted from 20 different research groups in a recent open competition [Maier‐Hein et al., 2016]. A white matter mask was estimated by segmenting the T2‐weighted anatomical images and co‐registering the images to the b0 image of the diffusion data using SPM12. In each subject, two‐hundred thousand fibers were sampled within the mask. Fibers were transformed into MNI space using Lead‐DBS following the approach described in [Horn and Blankenburg, 2016; Horn et al., 2014]. Fibers that traversed through the “alpha” but not “beta” seed regions (and vice versa) were isolated from the connectome and visualized using TrackVis. Fiber density maps of these tracts were isolated and projected onto the MNI 2009b nonlinear brain template which had also been used for normalizations. Maps were z‐scored and linearly contrasted to each other, resulting in a beta versus alpha contrast map. This map was projected onto the Conte69 brain surface atlas [Van Essen et al., 2012] using the metric enclosing voxel mapping algorithm as implemented in Caret5.
RESULTS
In this retrospectively analyzed cohort of patients, average relative UPDRS‐III motor score improvements were 49.6% ± 24.6% (average UPDRS‐III 33.78 ± 12.0 points OFF stimulation versus 16.7 ± 8.6 points ON stimulation, both measured after >12 hours of dopaminergic medication withdrawal). It is not trivial to determine whether an electrode contact resides within or outside the STN based on clinical imaging given the non‐uniform iron‐content and imaging properties of the nucleus [Dormont et al. 2004; De Hollander et al. 2014; Massey et al. 2012; Richter et al. 2004; Schäfer et al., 2012]. Thus, results should be seen as a best possible approximation to actual DBS electrode locations. Namely, proximity between DBS contact centers and the closest point within a histological atlas of the STN [Jakab et al., 2012; Krauth et al., 2010] was computed. This analysis revealed that 364 contact centers (of 432 total; 84%) were located closer than 0.5 mm to or within the STN. Given the diameter of the electrodes (1.27 mm), these contacts resided within the STN or on its border based on the localization model. Furthermore, 399 contact centers (92%) were closer than 1 mm to the nearest STN voxel center. Finally, 423 contact centers (98%) were closer than 2 mm to the nearest STN voxel center and given both the size of the STN atlas voxels (isotropic 0.4 mm) and the size of the receptive field in LFP recordings due to volume conduction [which has been described to amount to a magnitude of ∼0.5–3 mm even when using microelectrodes; Juergens et al., 1999], these electrode contact pairs were considered to still capture signals from the STN. Only four contacts resided more distant than 3 mm to their closest STN voxel center. All contact pairs were included in subsequent analyses because the design of the LFP power localization experiment did not necessarily require signals to be recorded from within the STN. However, similar results were obtained for the analysis excluding these four contacts. Figure 2A shows a three‐dimensional rendering of all 108 trajectories and subcortical structures defined by the Morel atlas.
Figure 2.
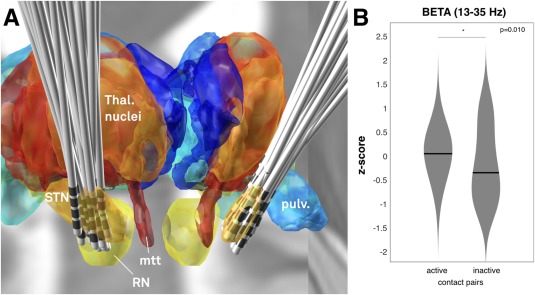
A) Placement of electrodes visualized in context of a 3D representation of the Morel atlas in MNI space. The ICMB 152 2009b nonlinear template is visualized in the background. STN: subthalamic nucleus. RN: red nucleus. mtt: mammillo‐thalamic tract. pulv.: Pulvinar. B) Comparison of z‐scored beta power recorded from active contact pairs in patient‘s long‐term DBS settings (left violin plot) versus inactive contact pairs (right violin plot). [Color figure can be viewed at http://wileyonlinelibrary.com]
To analyze the relationship between beta power (13–35 Hz) and stimulation effects, power values from clinically active and inactive contact pairs of each DBS lead were compared using paired t‐tests (Fig. 2B). For leads in which multiple active or passive pairs existed, power values were averaged. Active contact pairs included all cathodal stimulation (single or double monopolar contacts or interleaving mode) contacts but not the contacts used in a bipolar mode for anodal stimulation (see methods). In six electrodes the two middle contacts and in seven cases the second and fourth contacts were active, which did not allow to define pairs of active vs. inactive contacts according to the methods described. Thus, a total of 13 electrodes were excluded from the analysis. Beta power recorded from active contact pairs significantly exceeded power recorded from inactive contact pairs (P = 0.010, Fig. 2B). Similar to the whole beta band, average values from active contact pairs were also higher in the low beta (P = 0.008) but only as a trend in high beta (P = 0.062) band than the ones from inactive contact pairs. In contrast, alpha values did not significantly differentiate between active and inactive contact pairs (P = 0.112).
Power values recorded from upper‐ and lowermost contact pairs in each electrode were compared using paired t‐tests. In this analysis on a patient level, no significant relationship was found. However, when incorporating electrode location in standard space, across the whole group of subjects, significant relationships between power values and recording location were found. Specifically, x‐, y‐ and z‐ coordinates of each contact pair were fed into a GLM to predict power values. Location on x‐ (b = −0.3, p ≤ 0.001) and y‐coordinates (b = 0.22; p ≤ 0.001) significantly explained variance in alpha power, whereas location on z‐coordinate did not (b = −0.016, P = 0.693). This states that significantly higher alpha power had been recorded from anterior and medial contact pairs.
In case of beta power, location on y‐ (b = −0.17; P = 0.006) and z‐coordinates (b = 0.11; P = 0.009) significantly explained variance, whereas location on the x‐coordinate did not (b = −0.04, P = 0.501). This shows that higher beta power was recorded from posterior and dorsal contact pairs. These comparisons were done after transforming power values into a Gaussian distribution following the approach described in van Albada and Robinson [2007]. Please note that this transform did not alter the outcome of results (i.e., repeating the analysis with raw values had very similar outcome). Still, the transform was applied since independent variables (position on x‐/y‐/z‐axes) were normal distributed (revealed by a Chi‐squared Goodness of Fit test at significance level P ≤ 0.05), whereas power values were not. Instead, power values best followed a gamma‐distribution when comparing fits to seventeen continuous distribution types. This may be seen as an interesting side‐note since neuronal spike intervals have been priorly reported to follow a gamma‐distribution, as well [Robson and Troy, 1987; Wright et al., 2014].
Given this significant relationship between electrophysiological measures and location, frequency‐specific power distributions for alpha and beta bands were visualized in subcortical space based on local field potential recordings from all contact pairs. In a first analysis (Fig. 3), spatial distributions of power across alpha and beta bands were compared with each other. As expected, the peak of beta‐mapping resided within the postero‐dorso‐lateral portion of the STN at an MNI coordinate of x = ±14.4, y = −13.2, z = −4.8 whereas the peak of the alpha‐mapping was located antero‐medial to it at an MNI coordinate of x = ±13.5, y = −10.3, z = −2.9. When power values were mapped to an atlas that defines functional zones within the nucleus [Accolla et al., 2014], the beta peak was located at the dorsal border of the sensorimotor part, whereas the alpha peak was located at the boundary between sensorimotor and associative parts (Fig. 4).
Figure 3.
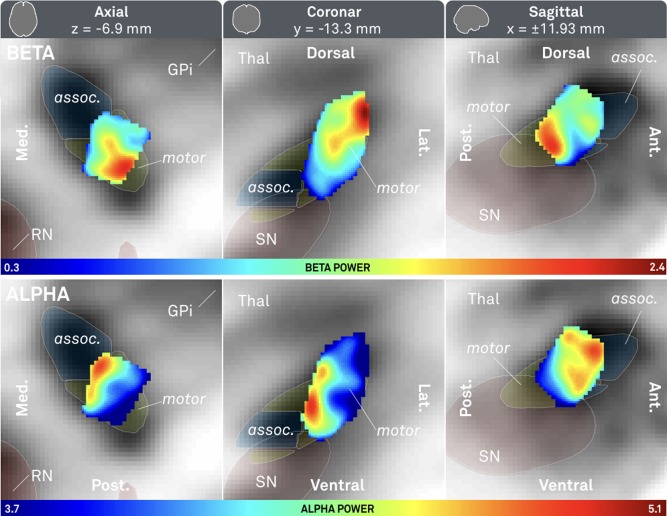
Probabilistic atlas of beta (top row) and alpha (bottom row) power recorded from 309 contact pairs in 54 patients. Axial (left), coronal (mid) and saggital (right) cuts. Associative (assoc.) and sensorimotor (motor) parts of subthalamic nucleus defined by Accolla STN atlas [Accolla et al., 2014]. Red nucleus (RN), internal part of the pallidum (GPi) and substantia nigra defined by ATAG atlas [Keuken et al., 2014]. Note that the beta peak is located more dorsolateral (x = ±14.4, y = −13.2, z = −4.8) whereas the alpha peak is located ventromedial (x = ±13.5, y = −10.3, z = −2.9).
Figure 4.
Comparison to the Accolla 2014 STN subdivisions atlas. Here, subdivisions of the STN have been identified by structural connectivity analysis using diffusion MRI based fiber tracking [Accolla et al., 2014]. The peaks of recorded beta‐power (red volume) and alpha‐ (orange volume) predominantly reside within the STN motor functional zone and the associative functional zone or the border between motor and associative zones, respectively. For illustration purposes, the electrophysiological volumes were masked by the anatomical volume of the STN. Without masking, the volume for beta‐power would extend dorsally into the zona incerta. [Color figure can be viewed at http://wileyonlinelibrary.com]
There is an ongoing discussion on potentially different functional roles of high and low beta activity. Therefore, a sub‐analysis between low (13–20 Hz) and high (20–35 Hz) beta power was added (Fig. 5). Here, low beta power was high in a larger area that included the smaller area highlighting high beta power. However, as expected, both bands were again predominantly expressed in the sensorimotor part of the nucleus.
Figure 5.
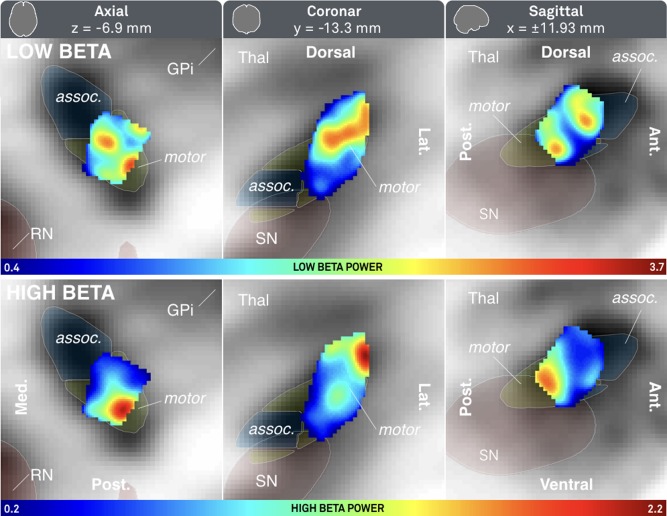
Probabilistic atlas of low (top row) and high (bottom row) beta power mapped to subcortical space. See Figure 3 for additional information. [Color figure can be viewed at http://wileyonlinelibrary.com]
Peak regions for alpha and beta power were subsequently used as seeds in a fiber‐tracking experiment within a normative group connectome based on human connectome project (HCP) data from 32 healthy subjects [MGH HCP Adult Diffusion; Setsompop et al., 2013]. Projections of fibers seeding from beta and alpha peaks to the rest of the brain were normalized and contrasted (Fig. 6A). According to a spatial overlap to regions defined by the SPM Anatomy toolbox [Eickhoff et al., 2005], projections from the beta seed were stronger in primary motor cortex, BA 44/45 and thalamic subparts that were assigned to motor and premotor subregions according to the Oxford thalamic connectivity atlas [Behrens et al., 2003]. In contrast, fibers traversing through the alpha seed projected more strongly to premotor cortices, the rolandic operculum and prefrontal/temporal subparts of the thalamus. Please note that these thalamic subparcellations do not correspond to actual thalamic nuclei but were again defined based on dMRI‐projections of the thalamus to cortical areas in the original study by Behrens and colleagues. Fibers that traversed through alpha and beta seeds as well as motor/premotor cortices [combined Brodmann areas four and six as defined by the automatic anatomical labeling atlas; Tzourio‐Mazoyer et al., 2002] were isolated from the group connectome and visualized in Figure 6B,C. Fibers traversing through the beta seed originated 1.75 times as much from primary motor cortex in comparison to fibers that traversed through the alpha seed. This again suggests relatively more projections from pre‐motor regions to the part of the STN with enhanced activity within the alpha band and relatively more input from primary motor regions to the part with enhanced beta band activity.
Figure 6.
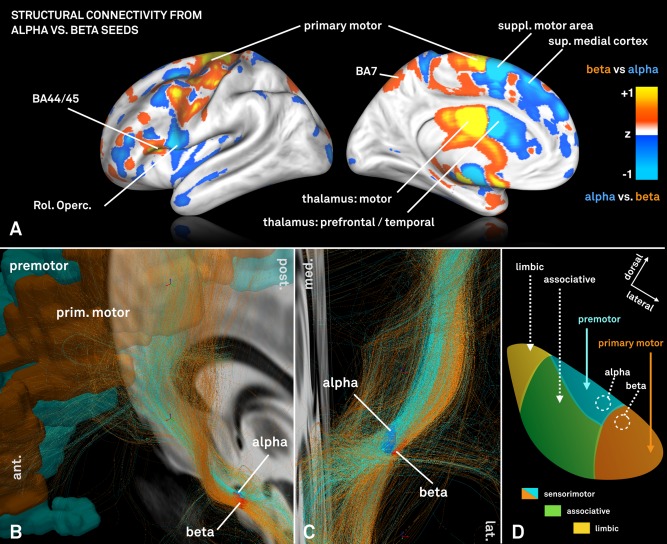
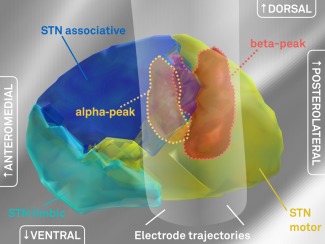
A: Visualization of normalized connectivity profiles when seeding from the electrophysiologically defined alpha versus beta peak on a HCP group connectome. The beta peak is predominantly more connected to primary motor cortices and motor functional zones of the thalamus as defined by the Oxford thalamic connectivity atlas [Behrens et al., 2003]. In contrast, the alpha seed is relatively stronger connected to supplementary motor and other premotor areas such as post. and sup. medial cortices. B + C: Fibertracts traversing through the same electrophysiologically defined alpha and beta seeds within the STN. Two distinct fiber bundles with a different twist angle can be outlined and fibers that traverse through the alpha seed again primarily originate from premotor areas of the cortex whereas fibers selected by the beta seed from primary motor area. D: Schematic representation of STN connectivity that in comparison to Figure 4 further parcellates the sensorimotor STN into areas predominantly receiving input from primary motor (red) vs. premotor (cyan) cortices informed by non‐human primate research [panel adapted from Mathai and Smith, 2011].
DISCUSSION
Our results show a frequency‐specific distribution of LFP power in the STN with largest beta band activity (13–35 Hz) located in the dorsolateral part of the nucleus and alpha band activity (8–12 Hz) ventromedially to beta peaks. Moreover, we could show that active contacts of DBS electrodes exhibited significantly higher beta power at rest. The stimulated subareas of the STN with largest beta power showed higher connectivity to the motor cortex as compared with alpha seed regions that were more strongly connected to premotor/frontal cortical areas.
Broadly speaking, in the brain, frequencies may be regarded as function of distance and functional context [Buzsaki, 2011]. In particular, distant regions generally communicate in lower frequencies than adjacent ones and brain functions requiring high processing speed as in the sensorimotor domain require high frequencies. Although this is a simplified concept, the principle of overlapping communication streams that use different frequencies seems to apply to basal ganglia–cortical loops nonetheless. Specifically, a study by Litvak and colleagues showed a beta network including the STN driven by motor cortices [Litvak et al., 2011]. Likewise, STN‐DBS contacts exhibiting the highest beta power in LFP recordings were also structurally more strongly connected to primary motor cortex [Accolla et al., 2016]. In a rodent model, direct stimulation of primary motor projections to the STN could alleviate PD symptoms [Gradinaru et al., 2009]. These studies conclude that beta‐power recorded within the STN seems to originate from a source both structurally and functionally connected to the (pre‐)motor cortex and that the source plays a crucial role in symptom alleviation mediated by DBS.
In the present study, we could extend these findings by showing that beta activity was predominantly present in the dorsolateral part of the STN, which corresponds to its sensori‐motor functional zone [Accolla et al., 2014; Lambert et al., 2012; Mathai and Smith, 2011]. When directly comparing the spatial locations of the alpha‐ and beta‐peaks to an STN subdivisions atlas [Accolla et al., 2014], the beta peak was located inside the sensori‐motor functional zone of the atlas. Thus, the source of beta‐power within the STN seems to (i) play a role in motor‐processing of the nucleus and (ii) to be linked to the primary motor cortex. Furthermore, the alpha‐peak was located within the associative part of the Accolla atlas. However, in primates, cortical inputs from primary motor cortex innervate the dorsolateral STN, whereas premotor cortices send projections to the dorsomedial STN [Haynes and Haber, 2013; Mathai and Smith, 2011; Nambu et al., 1996, 1997; Takada et al., 2001]. Thus, a further subdivision of the sensorimotor part could assign the more laterally located beta and more medially located alpha peaks to motor and premotor functional zones, which would be supported by our fiber tracking results (Fig. 6). Thus, we argue that the alpha peak could functionally either serve pre‐motor or associative related processing. In line with the recent discussion toward a functional organization of the STN without strict anatomical borders or septa [Accolla et al., 2014, 2016; Alkemade, 2013; Alkemade and Forstmann, 2014; Lambert et al., 2012], we propose that the alpha and beta regions estimated in our study might be part of a functional gradient of neuronal populations that—based on their connectivity and functional role—oscillate predominantly in the respective frequencies. Indeed, they may describe a spatial frequency gradient that corresponds to the functional gradient proposed by Alkemade and colleagues.
Activity in the beta‐band is of particular importance since it was identified as a potential biomarker for disease severity in PD [Hammond et al., 2007; Kühn and Volkmann, 2017]. Thus, the probabilistic location of the source that promotes highest beta‐activity in the STN may embody an ideal DBS target. In agreement, here, beta power values recorded from active contact pairs were significantly higher than values recorded from inactive contacts. It is established that the optimal stimulation site of the STN resides within its sensorimotor functional zone [Eisenstein et al., 2014; Nowinski et al., 2005; Welter et al., 2014; Wodarg et al., 2012] or around its dorsal border [Butson et al., 2011; Herzog et al., 2004; Maks et al., 2009]. In a recent study that created a probabilistic atlas in MNI space based on a recent systematic meta‐analysis incorporating optimal stimulation site in a total number of 342 electrodes [Caire et al., 2013], an “optimal” stimulation coordinate was located to the MNI coordinate of x = ±12.6, y = −13.4, z = −5.9 mm [Horn et al. 2017] and was thus very close (2‐mm distance) to the beta power peak of the electrophysiological atlas created here (x = ±14.4, y = −13.2, z = −4.9). Finally, a potential use‐case of the electrophysiological beta‐atlas is illustrated in Figure 7. Here, a DBS lead of a hypothetical patient is shown in MNI space. By overlaying the beta peak atlas onto its electrode, it becomes eminent that—based on the model—the second uppermost contact should serve as the most effective stimulation contact. A model‐inversion approach on methods to calculate the VTA could be used to directly calculate the optimal stimulation parameters that maximize overlap between VTA and the (electrophysiological) atlas. In the future, such procedures may become more important with increasing complexity in electrode designs [Kühn and Volkmann, 2017].
Figure 7.
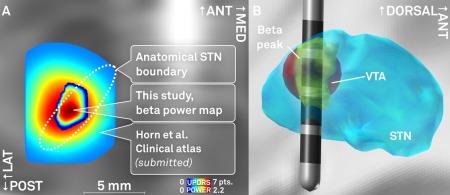
A: Comparison of the spatial location of peaks in a probabilistic atlas that is based on mean UPDRS hemibody score improvements [Horn et al., submitted; peak coordinates x = ±12.4, y = −14.6, z = −8.8 mm] and the beta power atlas estimated in this study (x = ±12.0, y = −14.4, z = −8.6). Axial slice cut at z = −8.7 mm. B: Exemplary use‐case of the probabilistic beta power atlas estimated in this study. A DBS lead is modeled within the STN. After localization, stimulation parameters are tuned in a way to maximize the overlap between volume of tissue activated (VTA, red) and the beta power hot‐spot (yellow). In this example, a low amplitude of 0.8V at 1kΩ impedance is modeled at the second dorsalmost contact using the heuristic VTA‐model developed by Mädler and Coenen [2012]. This panel illustrates the concept of VTA‐modeling based on an electrophysiological atlas and is not based on actual patient data. [Color figure can be viewed at http://wileyonlinelibrary.com]
Main limitations of the present study are threefold. First, the localization technique and normalization of electrode coordinates into common space comes with inevitable inaccuracies. Namely, resolution of postoperative imaging in a clinical setting is limited to a magnitude of approximately 0.5–1 mm. Furthermore, co‐registrations between preoperative images and postoperative images have inherent limitations, especially in cases with pneumocephalus on postoperative acquisitions. Last, nonlinear deformation into MNI space cannot be perfectly accurate by definition. These limitations are inherent to the field of electrode localizations and may never be overcome completely. However, the analysis software used was designed especially for this purpose and with the aim to limit sources of error in each processing step as much as possible. The software works on highly interpolated data that gains best mean anatomical information from axial, coronal and sagittal postoperative acquisitions [Horn and Kühn, 2015]. Each co‐registration and normalization result was carefully controlled by visual inspection using a special tool that is part of Lead‐DBS. Great care was given to exclude subjects with poor imaging quality, motion artifacts or pneumocephalus. Finally, a modern normalization algorithm was applied to warp into MNI space [Ashburner, 2007] that showed superior or equal to 13 competing algorithms [Klein et al., 2009].
The second limitation lies in the in‐between patient comparability of electrophysiological recordings. Since data was pooled across patients to generate a probabilistic atlas, comparability between datasets is a fundamental prerequisite of this study. To this end, electrophysiological data was processed using a well‐established pipeline [Neumann et al., 2014, 2015a, b] to create normalized spectral power estimates primarily influenced by electrode position. Given the large cohort of patients analyzed here, the time point of their LFP data acquisition was distributed across ten years. However, LFP‐signals were always recorded within an interval of 2–5 days after surgery. In contrast, clinically active contacts of each patient were determined based on the most recent entry in the clinical database of our center due to the retrospective nature of the study. Thus, in some cases, comparisons between LFP power calculated from active versus inactive contacts may have used electrophysiological data recorded many years before determining which contacts to use, clinically. This may be seen as a limitation of the study but also bears an interesting conclusion about the robustness of predictions that can be made based on beta recordings across time. Namely, in some patients, LFP signals recorded a decade ago still have predictive power about the efficacy of different electrode contacts.
Finally, regarding the tractography experiment, it needs to be emphasized that normative diffusion data was used that did not stem from patients analyzed here. Advantages in using normative connectome data include that data has significantly better signal to noise than data from single clinical patients. Diffusion spectrum datasets used here were acquired on special MRI hardware allowing for b‐values up to 10,000 s/mm2, leading to connectivity estimates that are much more robust than those acquired in individual patients. Such normative connectome data has proven valuable in predicting stroke symptoms from patient‐specific lesions [Boes et al., 2015, Darby et al., 2016, Fischer et al., 2016, Laganiere et al., 2016] and has been applied to the context of DBS before, as well [Bonmassar et al., 2014, Horn et al., 2017, Fox et al., 2014]. Despite these advantages, normative connectome data does not include patient‐specific anatomical features. Future work is needed to determine how best to combine the strengths of connectome analysis with individual differences in connectivity from specific patients. The tractography analysis presented here merely contrasts the spatial pattern of (normative) connectivity seeding from two regions from which predominantly high alpha and beta power had been recorded, respectively. These results confirm findings from a recent fiber‐tracking experiment that was based on electrophysiological signatures performed on the single‐subject level using patient‐specific connectome data [Accolla et al., 2016].
In conclusion, we showed a spatial distribution of alpha and beta frequencies within the STN in PD patients in form of a probabilistic atlas. Beta power values were predominantly highest in the dorsolateral part of the STN, corresponding to its sensorimotor functional zone. Our results underline that a high amount of beta power may indicate an optimal target site for DBS within the STN. In the future, beta band activity may help to confirm the target region intraoperatively and to identify best contacts for DBS when using more complex electrodes with multiple contacts. The electrophysiological atlases estimated in this study will be made publicly available with the software package Lead‐DBS (http://www.lead-dbs.org).
CONFLICT OF INTERESTS
AH received a travel stipend from Ipsen Pharma. WJN received a travel stipend from Medtronic. AAK received honoraria from Boston Scientific, St Jude Medical and Medtronic; travel grants from Ipsen Pharma and Boston. G‐HS reports having received lecture fees from Medtronic, St. Jude Medical and Boston Scientific.
ACKNOWLEDGMENTS
This study was supported by Deutsche Forschungsgemeinschaft (DFG; Grant KFO 247), Stiftung Charité, Berlin Institute of Health and Prof. Klaus Thiemann Foundation. Data collection and sharing for this project was provided by the Human Connectome Project (HCP; Principal Investigators: Bruce Rosen, M.D., Ph.D., Arthur W. Toga, Ph.D., Van J. Weeden, MD). HCP funding was provided by the National Institute of Dental and Craniofacial Research (NIDCR), the National Institute of Mental Health (NIMH), and the National Institute of Neurological Disorders and Stroke (NINDS). HCP data are disseminated by the Laboratory of Neuro Imaging at the University of Southern California. The HCP project (Principal Investigators: Bruce Rosen, M.D., Ph.D., Martinos Center at Massachusetts General Hospital; Arthur W. Toga, Ph.D., University of Southern California, Van J. Weeden, MD, Martinos Center at Massachusetts General Hospital) is supported by the National Institute of Dental and Craniofacial Research (NIDCR), the National Institute of Mental Health (NIMH) and the National Institute of Neurological Disorders and Stroke (NINDS). HCP is the result of efforts of co‐investigators from the University of Southern California, Martinos Center for Biomedical Imaging at Massachusetts General Hospital (MGH), Washington University, and the University of Minnesota.
REFERENCES
- Accolla EA, Dukart J, Helms G, Weiskopf N, Kherif F, Lutti A, Chowdhury R, Hetzer S, Haynes J‐D, Kühn AA, Draganski B (2014): Brain tissue properties differentiate between motor and limbic basal ganglia circuits. Hum Brain Mapp 35:5083–5092. [DOI] [PMC free article] [PubMed] [Google Scholar]
- Accolla EA, Herrojo Ruiz M, Horn A, Schneider G‐H, Schmitz‐Hubsch T, Draganski B, Kühn AA (2016): Brain networks modulated by subthalamic nucleus deep brain stimulation. Brain 139 :2503–2515. [DOI] [PubMed] [Google Scholar]
- van Albada SJ, Robinson PA (2007): Transformation of arbitrary distributions to the normal distribution with application to EEG test‐retest reliability. J Neurosci Meth 161:205–211. [DOI] [PubMed] [Google Scholar]
- Alkemade A (2013): Subdivisions and anatomical boundaries of the subthalamic nucleus. J Neurosci 33:9233–9234. 23719792 [Google Scholar]
- Alkemade A, Forstmann BU (2014): Do we need to revise the tripartite subdivision hypothesis of the human subthalamic nucleus (STN)?. NeuroImage 95:326–329. [DOI] [PubMed] [Google Scholar]
- Ashburner J (2007): A fast diffeomorphic image registration algorithm. NeuroImage 38:95–113. [DOI] [PubMed] [Google Scholar]
- Behrens TEJ, Johansen‐Berg H, Woolrich MW, Smith SM, Wheeler‐Kingshott CAM, Boulby PA, Barker GJ, Sillery EL, Sheehan K, Ciccarelli O, Thompson AJ, Brady JM, Matthews PM (2003): Non‐invasive mapping of connections between human thalamus and cortex using diffusion imaging. Nat Neurosci 6:750–757. [DOI] [PubMed] [Google Scholar]
- Boes AD, Prasad S, Liu H, Liu Q, Pascual‐Leone A, Caviness VS, Jr , Fox MD (2015): Network localization of neurological symptoms from focal brain lesions. Brain: J Neurol 138:3061–3075. [DOI] [PMC free article] [PubMed] [Google Scholar]
- Bonmassar G, Angelone LM, Makris N (2014): A virtual patient simulator based on human connectome and 7 T MRI for deep brain stimulation. Int J Adv Life Sci 6:364–372. [PMC free article] [PubMed] [Google Scholar]
- Brown P (2003): Oscillatory nature of human basal ganglia activity: Relationship to the pathophysiology of Parkinson's disease. Mov Disord 18:357–363. [DOI] [PubMed] [Google Scholar]
- Butson CR, Cooper SE, Henderson Jaimie M, Wolgamuth B, McIntyre CC (2011): Probabilistic analysis of activation volumes generated during deep brain stimulation. NeuroImage 54:2096–2104. [DOI] [PMC free article] [PubMed] [Google Scholar]
- Buzsaki G (2011): Rhythms of the Brain. Oxford: Oxford University Press. [Google Scholar]
- Caire F, Ranoux D, Guehl D, Burbaud P, Cuny E (2013): A systematic review of studies on anatomical position of electrode contacts used for chronic subthalamic stimulation in Parkinson's disease. Acta Neurochirurgica 155:1647–1654. [DOI] [PubMed] [Google Scholar]
- Cao C‐Y, Zeng K, Li D‐Y, Zhan S‐K, Li X‐L, Sun B‐M (2017): Modulations on cortical oscillations by subthalamic deep brain stimulation in patients with Parkinson disease: A MEG study. Neurosci Lett 636:95–100. [DOI] [PubMed] [Google Scholar]
- Darby R, Laganiere S, Pascual‐Leone A, Prasad S, Fox MD (2016): Finding the imposter: Brain connectivity of lesions causing delusional misidentifications. Brain: J Neurol 86:1–11. [DOI] [PMC free article] [PubMed] [Google Scholar]
- De Hollander G, Keuken MC, Bazin P‐L, Weiss M, Neumann J, Reimann K, Wähnert M, Turner R, Forstmann BU, Schäfer A (2014): A gradual increase of iron toward the medial‐inferior tip of the subthalamic nucleus. Hum Brain Mapp 35:4440–4449. [DOI] [PMC free article] [PubMed] [Google Scholar]
- Deuschl G, Schade‐Brittinger C, Krack P, Volkmann J, Schäfer H, Bötzel K, Daniels C, Deutschländer A, Dillmann U, Eisner W, Gruber D, Hamel W, Herzog J, Hilker R, Klebe S, Kloss M, Koy J, Krause M, Kupsch A, Lorenz D, Lorenzl S, Mehdorn HM, Moringlane JR, Oertel W, Pinsker MO, Reichmann H, Reuss A, Schneider G‐H, Schnitzler A, Steude U, Sturm V, Timmermann L, Tronnier V, Trottenberg T, Wojtecki L, Wolf E, Poewe W, Voges J, German Parkinson Study Group , Neurostimulation Section (2006): A randomized trial of deep‐brain stimulation for Parkinson's disease. N Engl J Med 355:896–908. [DOI] [PubMed] [Google Scholar]
- Dormont D, Ricciardi KG, Tandé D (2004): Is the subthalamic nucleus hypointense on T2‐weighted images? A correlation study using MR imaging and stereotactic atlas data. AJNR Am J Neuroradiol 25:1516–1523. [PMC free article] [PubMed] [Google Scholar]
- Eickhoff SB, Stephan KE, Mohlberg H, Grefkes C, Fink GR, Amunts K, Zilles K (2005): A new SPM toolbox for combining probabilistic cytoarchitectonic maps and functional imaging data. NeuroImage 25:1325–1335. [DOI] [PubMed] [Google Scholar]
- Eisenstein SA, Koller JM, Black KD, Campbell MC, Lugar HM, Ushe M, Tabbal SD, Karimi M, Hershey T, Perlmutter JS, Black KJ (2014): Functional anatomy of subthalamic nucleus stimulation in Parkinson disease. Ann Neurol 76:279–295. [DOI] [PMC free article] [PubMed] [Google Scholar]
- Eusebio A, Thevathasan W, Doyle Gaynor L, Pogosyan A, Bye E, Foltynie T, Zrinzo L, Ashkan K, Aziz T, Brown P (2011): Deep brain stimulation can suppress pathological synchronisation in parkinsonian patients. J Neurol Neurosurg Psychiatr 82:569–573. [DOI] [PMC free article] [PubMed] [Google Scholar]
- Fischer DB, Boes AD, Demertzi A, Evrard HC, Laureys S, Edlow BL, Liu H, Saper CB, Pascual‐Leone A, Fox MD, Geerling JC (2016): A human brain network derived from coma‐causing brainstem lesions. Neurology 87:2427–2434. [DOI] [PMC free article] [PubMed] [Google Scholar]
- Fox MD, Buckner RL, Liu H, Chakravarty MM, Lozano AM, Pascual‐Leone A (2014): Resting‐state networks link invasive and noninvasive brain stimulation across diverse psychiatric and neurological diseases. Proc Natl Acad Sci 111:E4367–E4375. [DOI] [PMC free article] [PubMed] [Google Scholar]
- Friston KJ, Ashburner JT, Kiebel SJ, Nichols TE, Penny WD (2011): Statistical Parametric Mapping: The Analysis of Functional Brain Images. New York: Academic Press. [Google Scholar]
- Geng X, Zhang J, Jiang Y, Ashkan K, Foltynie T, Limousin P, Zrinzo L, Green A, Aziz T, Brown P, Wang S (2017): Comparison of oscillatory activity in subthalamic nucleus in Parkinson's disease and dystonia. Neurobiol Dis 98:100–107. [DOI] [PMC free article] [PubMed] [Google Scholar]
- Gradinaru V, Mogri M, Thompson KR, Henderson JM, Deisseroth K (2009): Optical deconstruction of parkinsonian neural circuitry. Science (New York, NY) 324:354–359. [DOI] [PMC free article] [PubMed] [Google Scholar]
- Hammond C, Bergman H, Brown P (2007): Pathological synchronization in Parkinson's disease: Networks, models and treatments. Trends Neurosci 30:357–364. [DOI] [PubMed] [Google Scholar]
- Haynes WIA, Haber SN (2013): The organization of prefrontal‐subthalamic inputs in primates provides an anatomical substrate for both functional specificity and integration: Implications for Basal Ganglia models and deep brain stimulation. J Neurosci 33:4804–4814. [DOI] [PMC free article] [PubMed] [Google Scholar]
- Herzog J, Fietzek U, Hamel W, Morsnowski A, Steigerwald F, Schrader B, Weinert D, Pfister G, Müller D, Mehdorn HM, Deuschl G, Volkmann J (2004): Most effective stimulation site in subthalamic deep brain stimulation for Parkinson's disease. Mov Disord 19:1050–1054. [DOI] [PubMed] [Google Scholar]
- Hirschmann J, Hartmann CJ, Butz M, Hoogenboom N, Ozkurt TE, Elben S, Vesper J, Wojtecki L, Schnitzler A (2013): A direct relationship between oscillatory subthalamic nucleus‐cortex coupling and rest tremor in Parkinson's disease. Brain 136:3659–3670. [DOI] [PubMed] [Google Scholar]
- Horn A, Kühn AA (2015): Lead‐DBS: A toolbox for deep brain stimulation electrode localizations and visualizations. NeuroImage 107:127–135. [DOI] [PubMed] [Google Scholar]
- Horn A, Blankenburg F (2016): Toward a standardized structural‐functional group connectome in MNI space. NeuroImage 124:310–322. [DOI] [PubMed] [Google Scholar]
- Horn A, Ostwald D, Reisert M, Blankenburg F (2014): The structural‐functional connectome and the default mode network of the human brain. NeuroImage 102:142–151. [DOI] [PubMed] [Google Scholar]
- Horn A, Kühn AA, Merkl A, Shih L, Alterman R, Fox M (2017): Probabilistic conversion of neurosurgical DBS electrode coordinates into MNI space. NeuroImage 150:395–404. [DOI] [PMC free article] [PubMed] [Google Scholar]
- Jakab A, Blanc R, Berenyi EL, Szekely G (2012): Generation of individualized thalamus target maps by using statistical shape models and thalamocortical tractography. AJNR Am J Neuroradiol 33:2110–2116. [DOI] [PMC free article] [PubMed] [Google Scholar]
- Johnson H, Harris G, Williams K (2007): BRAINSFit: Mutual information rigid registrations of whole‐brain 3D images, using the insight toolkit. Insight J 57:1. [Google Scholar]
- Juergens E, Guettler A, Eckhorn R (1999): Visual stimulation elicits locked and induced gamma oscillations in monkey intracortical‐ and EEG‐potentials, but not in human EEG. Exp Brain Res 129:247–259. [DOI] [PubMed] [Google Scholar]
- Keuken MC, Bazin PL, Crown L, Hootsmans J, Laufer A, Müller‐Axt C, Sier R, van der Putten EJ, Schäfer A, Turner R, Forstman BU (2014): Quantifying inter‐individual anatomical variability in the subcortex using 7T structural MRI. NeuroImage 94:40–46. [DOI] [PubMed] [Google Scholar]
- Klein A, Andersson J, Ardekani BA, Ashburner J, Avants B, Chiang M‐C, Christensen GE, Collins DL, Gee J, Hellier P, Song JH, Jenkinson M, Lepage C, Rueckert D, Thompson P, Vercauteren T, Woods RP, Mann JJ, Parsey RV (2009) Evaluation of 14 nonlinear deformation algorithms applied to human brain MRI registration. NeuroImage 46:786–802. [DOI] [PMC free article] [PubMed] [Google Scholar]
- Kühn AA, Volkmann J (2017): Innovations in deep brain stimulation methodology. Mov Disord 32:11–19. [DOI] [PubMed] [Google Scholar]
- Kühn AA, Doyle L, Pogosyan A, Yarrow K, Kupsch A, Schneider G‐H, Hariz M, Trottenberg T, Brown P (2006a) Modulation of beta oscillations in the subthalamic area during motor imagery in Parkinson's disease. Brain 129:695–706. [DOI] [PubMed] [Google Scholar]
- Kühn AA, Kupsch A, Schneider G‐H, Brown P (2006b): Reduction in subthalamic 8–35 Hz oscillatory activity correlates with clinical improvement in Parkinson's disease. Eur J Neurosci 23:1956–1960. [DOI] [PubMed] [Google Scholar]
- Kühn AA, Kempf F, Brücke C, Gaynor Doyle L, Martinez‐Torres I, Pogosyan A, Trottenberg T, Kupsch A, Schneider G‐H, Hariz M, Vandenberghe W, Nuttin B, Brown P (2008): High‐frequency stimulation of the subthalamic nucleus suppresses oscillatory beta activity in patients with Parkinson's disease in parallel with improvement in motor performance. J Neurosci 28:6165–6173. [DOI] [PMC free article] [PubMed] [Google Scholar]
- Kühn AA, Tsui A, Aziz T, Ray N, Brücke C, Kupsch A, Schneider G‐H, Brown P (2009): Pathological synchronisation in the subthalamic nucleus of patients with Parkinson's disease relates to both bradykinesia and rigidity. Exp Neurol 215:380–387. [DOI] [PubMed] [Google Scholar]
- Krack P, Batir A, Van Blercom N, Chabardes S, Fraix V, Ardouin C, Koudsie A, Limousin P, Benazzouz A, LeBas JF, Benabid A‐L, Pollak P (2003): Five‐year follow‐up of bilateral stimulation of the subthalamic nucleus in advanced Parkinson's disease. N Engl J Med 349:1925–1934. [DOI] [PubMed] [Google Scholar]
- Krauth A, Blanc R, Poveda A, Jeanmonod D, Morel A, Székely G (2010): A mean three‐dimensional atlas of the human thalamus: Generation from multiple histological data. NeuroImage 49:2053–2062. [DOI] [PubMed] [Google Scholar]
- Laganiere S, Boes AD, Fox MD (2016): Network localization of hemichorea‐hemiballismus. Neurology 86:2187–2195. [DOI] [PMC free article] [PubMed] [Google Scholar]
- Lambert C, Zrinzo L, Nagy Z, Lutti A, Hariz M, Foltynie T, Draganski B, Ashburner J, Frackowiak R (2012): Confirmation of functional zones within the human subthalamic nucleus: Patterns of connectivity and sub‐parcellation using diffusion weighted imaging. NeuroImage 60:83–94. [DOI] [PMC free article] [PubMed] [Google Scholar]
- Little S, Pogosyan A, Neal S, Zavala B, Zrinzo L, Hariz M, Foltynie T, Limousin P, Ashkan K, Fitzgerald J, Green AL, Aziz TZ, Brown P (2013): Adaptive deep brain stimulation in advanced Parkinson disease. Ann Neurol 74:449–457. [DOI] [PMC free article] [PubMed] [Google Scholar]
- Litvak V, Jha A, Eusebio A, Oostenveld R, Foltynie T, Limousin P, Zrinzo L, Hariz M, Friston K, Brown P (2011): Resting oscillatory cortico‐subthalamic connectivity in patients with Parkinson's disease. Brain 134:359–374. [DOI] [PubMed] [Google Scholar]
- Maier‐Hein K, Neher P, Houde J‐C, Cote M‐A, Garyfallidis E, Zhong J, Chamberland M, Yeh F‐C, Lin YC, Ji Q, Reddick WE, Glass JO, Chen DQ, Feng Y, Gao DQ, Wu Y, Ma J, Renjie H, Li Q, Westin C‐F, Deslauriers‐Gauthier S, Gonzalez J, Paquette M, St‐Jean S, Girard G, Rheault F, Sidhu J, Tax CMW, Guo F, Mesri HY, David S, Froeling M, Heemskerk AM, Leemans A, Bore A, Pinsard B, Bedetti C, Desrosiers M, Brambati S, Doyon J, Sarica A, Vasta R, Cerasa A, Quattrone A, Yeatman J, Khan AR, Hodges W, Alexander S, Romanscano D, Barakovic M, Auria A, Esteban O, Lemkaddem A, Thiran J‐P, Cetingul HE, Odry BL, Mailhe B, Nadar M, Pizzagalli F, Prasad G, Villalon‐Reina J, Galvis J, Thompson P, Requejo F, Laguna P, Lacerda L, Barrett R, Dell'Acqua F, Catani M, Petit L, Caruyer E, Daducci A, Dyrby T, Holland‐Letz T, Hilgetag C, Stieltjes B, Descoteaux M (2016). Tractography‐based connectomes are dominated by false‐positive connections. bioRxiv 2016:084137. [Google Scholar]
- Maks CB, Butson CR, Walter BL, Vitek JL, McIntyre CC (2009): Deep brain stimulation activation volumes and their association with neurophysiological mapping and therapeutic outcomes. J Neurol Neurosurg Psychiatr 80:659–666. [DOI] [PMC free article] [PubMed] [Google Scholar]
- Massey LA, Miranda MA, Zrinzo L, Al‐Helli O, Parkes HG, Thornton JS, So PW, White MJ, Mancini L, Strand C, Holton JL, Hariz MI, Lees AJ, Revesz T, Yousry TA (2012): High resolution MR anatomy of the subthalamic nucleus: Imaging at 9.4T with histological validation. NeuroImage 59(3):2035–2044. [DOI] [PubMed] [Google Scholar]
- Mathai A, Smith Y (2011): The corticostriatal and corticosubthalamic pathways: Two entries, one target. So what?. Front Syst Neurosci 5:64. [DOI] [PMC free article] [PubMed] [Google Scholar]
- Mädler B, Coenen VA (2012): Explaining clinical effects of deep brain stimulation through simplified target‐specific modeling of the volume of activated tissue. AJNR Am J Neuroradiol 33:1072–1080. [DOI] [PMC free article] [PubMed] [Google Scholar]
- Morel A (2013): Stereotactic Atlas of the Human Thalamus and Basal Ganglia. Boca Raton: CRC Press. [Google Scholar]
- Nambu A, Takada M, Inase M, Tokuno H (1996): Dual somatotopical representations in the primate subthalamic nucleus: Evidence for ordered but reversed body‐map transformations from the primary motor cortex and the supplementary motor area. J Neurosci 16:2671–2683. [DOI] [PMC free article] [PubMed] [Google Scholar]
- Nambu A, Tokuno H, Inase M, Takada M (1997): Corticosubthalamic input zones from forelimb representations of the dorsal and ventral divisions of the premotor cortex in the macaque monkey: Comparison with the input zones from the primary motor cortex and the supplementary motor area. Neurosci Lett 239:13–16. [DOI] [PubMed] [Google Scholar]
- Neumann WJ, Huebl J, Brücke C, Gabriëls L, Bajbouj M, Merkl A, Schneider GH, Nuttin B, Brown P, Kühn AA (2014): Different patterns of local field potentials from limbic DBS targets in patients with major depressive and obsessive compulsive disorder. Mol Psychiatry 19:1186–1192. [DOI] [PMC free article] [PubMed] [Google Scholar]
- Neumann W‐J, Jha A, Bock A, Huebl J, Horn A, Schneider G‐H, Sander TH, Litvak V, Kühn AA (2015a): Cortico‐pallidal oscillatory connectivity in patients with dystonia. Brain 138:1894–1906. [DOI] [PubMed] [Google Scholar]
- Neumann W‐J, Staub F, Horn A, Schanda J, Mueller J, Schneider G‐H, Brown P, Kühn AA (2015b): Deep brain recordings using an implanted pulse generator in Parkinson's disease. Neuromodulation 19:20–24. [DOI] [PMC free article] [PubMed] [Google Scholar]
- Neumann W‐J, Degen K, Schneider G‐H, Brücke C, Huebl J, Brown P, Kühn AA (2016): Subthalamic synchronized oscillatory activity correlates with motor impairment in patients with Parkinson's disease. Mov Disord 31:1748–1751. [DOI] [PMC free article] [PubMed] [Google Scholar]
- Nowinski WL, Belov D, Pollak P, Benabid A‐L (2005): Statistical analysis of 168 bilateral subthalamic nucleus implantations by means of the probabilistic functional atlas. Neurosurgery 57:319–330. [DOI] [PubMed] [Google Scholar]
- Oostenveld R, Fries P, Maris E, Schoffelen J‐M (2011): FieldTrip: Open source software for advanced analysis of MEG, EEG, and invasive electrophysiological data. Comput Intell Neurosci 2010 1–9. [DOI] [PMC free article] [PubMed] [Google Scholar]
- Richter EO, Hoque T, Halliday W, Lozano AM, Saint‐Cyr JA (2004): Determining the position and size of the subthalamic nucleus based on magnetic resonance imaging results in patients with advanced Parkinson disease. J Neurosurg 100:541–546. [DOI] [PubMed] [Google Scholar]
- Robson JG, Troy JB (1987): Nature of the maintained discharge of Q, X, and Y retinal ganglion cells of the cat. J Opt Soc Am A Opt Image Sci 4:2301–2307. [DOI] [PubMed] [Google Scholar]
- Schäfer A, Forstmann BU, Neumann J, Wharton S, Mietke A, Bowtell R, Turner R (2012): Direct visualization of the subthalamic nucleus and its iron distribution using high‐resolution susceptibility mapping. Hum Brain Mapp 33:2831–2842. [DOI] [PMC free article] [PubMed] [Google Scholar]
- Schuepbach WMM, Rau J, Knudsen K, Volkmann J, Krack P, Timmermann L, Hälbig TD, Hesekamp H, Navarro SM, Meier N, Falk D, Mehdorn M, Paschen S, Maarouf M, Barbe MT, Fink GR, Kupsch A, Gruber D, Schneider GH, Seigneuret E, Kirstner A, Chaynes P, Ory‐Magne F, Brefel Courbon C, Vesper J, Schnitzler A, Wojtecki L, Houeto J‐L, Bataille BB, Maltête D, Damier P, Raoul S, Sixel‐Doering F, Hellwig D, Gharabaghi A, Krüger R, Pinsker MO, Amtage F, Régis J‐M, Witjas T, Thobois S, Mertens P, Kloss M, Hartmann A, Oertel WH, Post B, Speelman H, Agid Y, Schade ‐Brittinger C, Deuschl G, EARLYSTIM Study Group (2013): Neurostimulation for Parkinson's disease with early motor complications. N Engl J Med 368:610–622. [DOI] [PubMed] [Google Scholar]
- Setsompop K, Kimmlingen R, Eberlein E, Witzel T, Cohen‐Adad J, McNab JA, Keil B, Tisdall MD, Hoecht P, Dietz P, Cauley SF, Tountcheva V, Matschl V, Lenz VH, Heberlein K, Potthast A, Thein H, Van Horn J, Toga A, Schmitt F, Lehne D, Rosen BR, Wedeen V, Wald LL (2013): Pushing the limits of in vivo diffusion MRI for the Human Connectome Project. NeuroImage 80:220–233. [DOI] [PMC free article] [PubMed] [Google Scholar]
- Takada M, Tokuno H, Hamada I, Inase M, Ito Y, Imanishi M, Hasegawa N, Akazawa T, Hatanaka N, Namu A (2001): Organization of inputs from cingulate motor areas to basal ganglia in macaque monkey. Eur J Neurosci 14:1633–1650. [DOI] [PubMed] [Google Scholar]
- Trottenberg T, Kupsch A, Schneider G‐H, Brown P, Kühn AA (2007): Frequency‐dependent distribution of local field potential activity within the subthalamic nucleus in Parkinson's disease. Exp Neurol 205:287–291. [DOI] [PubMed] [Google Scholar]
- Tzourio‐Mazoyer N, Landeau B, Papathanassiou D, Crivello F, Etard O, Delcroix N, Mazoyer B, Joliot M (2002): Automated anatomical labeling of activations in SPM using a macroscopic anatomical parcellation of the MNI MRI single‐subject brain. NeuroImage 15:273–289. [DOI] [PubMed] [Google Scholar]
- Van Essen DC, Glasser MF, Dierker DL, Harwell J, Coalson T (2012): Parcellations and hemispheric asymmetries of human cerebral cortex analyzed on surface‐based atlases. Cereb Cortex 22:2241–2262. [DOI] [PMC free article] [PubMed] [Google Scholar]
- Van Wijk BCM, Beudel M, Jha A, Oswal A, Foltynie T, Hariz MI, Limousin P, Zrinzo L, Aziz TZ, Green AL, Brown P, Litvak V (2016): Subthalamic nucleus phase‐amplitude coupling correlates with motor impairment in Parkinson's disease. Clin Neurophysiol 127:2010–2019. [DOI] [PMC free article] [PubMed] [Google Scholar]
- Weinberger M, Mahant N, Hutchison WD, Lozano AM, Moro E, Hodaie M, Lang AE, Dostrovsky JO (2006): Beta oscillatory activity in the subthalamic nucleus and its relation to dopaminergic response in Parkinson's disease. J Neurophysiol 96:3248–3256. [DOI] [PubMed] [Google Scholar]
- Welter M‐L, Schüpbach M, Czernecki V, Karachi C, Fernandez‐Vidal S, Golmard J‐L, Serra G, Navarro S, Welaratne A, Hartmann A, Mesnage V, Pineau F, Cornu P, Pidoux B, Worbe Y, Zikos P, Grabli D, Galanaud D, Bonnet A, Belaid H, Dormont D, Vidailhet M, Mallet L, Houeto JL, Bardinet E, Yelnik J, Agid Y (2014): Optimal target localization for subthalamic stimulation in patients with Parkinson disease. Neurology 82:1352–1361. [DOI] [PMC free article] [PubMed] [Google Scholar]
- Wodarg F, Herzog J, Reese R, Falk D, Pinsker MO, Steigerwald F, Jansen O, Deuschl G, Mehdorn HM, Volkmann J (2012): Stimulation site within the MRI‐defined STN predicts postoperative motor outcome. Mov Disord 27:874–879. [DOI] [PubMed] [Google Scholar]
- Wright MCM, Winter IM, Forster JJ, Bleeck S (2014): Response to best‐frequency tone bursts in the ventral cochlear nucleus is governed by ordered inter‐spike interval statistics. Hear Res 317:23–32. [DOI] [PubMed] [Google Scholar]
- Yeh F‐C, Wedeen VJ, Tseng W‐YI (2010): Generalized q‐sampling imaging. IEEE Trans Med Imaging 29:1626–1635. [DOI] [PubMed] [Google Scholar]
- Zaidel A, Spivak A, Grieb B, Bergman H, Israel Z (2010): Subthalamic span of β oscillations predicts deep brain stimulation efficacy for patients with Parkinson's disease. Brain 133:awq144–aw2021. [DOI] [PubMed] [Google Scholar]