

Abstract
The human left inferior parietal lobule (LIPL) plays a pivotal role in many cognitive functions and is an important node in the default mode network (DMN). Although many previous studies have proposed different parcellation schemes for the LIPL, the detailed functional organization of the LIPL and the exact correspondence between the DMN and LIPL subregions remain unclear. Mounting evidence indicates that spontaneous fluctuations in the brain are strongly associated with cognitive performance at the behavioral level. However, whether a consistent functional topographic organization of the LIPL during rest and under task can be revealed remains unknown. Here, they used resting‐state functional connectivity (RSFC) and task‐related coactivation patterns separately to parcellate the LIPL and identified seven subregions. Four subregions were located in the supramarginal gyrus (SMG) and three subregions were located in the angular gyrus (AG). The subregion‐specific networks and functional characterization revealed that the four anterior subregions were found to be primarily involved in sensorimotor processing, movement imagination and inhibitory control, audition perception and speech processing, and social cognition, whereas the three posterior subregions were mainly involved in episodic memory, semantic processing, and spatial cognition. The results revealed a detailed functional organization of the LIPL and suggested that the LIPL is a functionally heterogeneous area. In addition, the present study demonstrated that the functional architecture of the LIPL during rest corresponds with that found in task processing. Hum Brain Mapp 38:1659–1675, 2017. © 2017 Wiley Periodicals, Inc.
Keywords: left inferior parietal lobule, resting‐state, coactivation, parcellation, correspondent functional topography
INTRODUCTION
The inferior parietal lobule (IPL) is an important node in the parietal association cortex and plays a key role in integrating visual, auditory, and somatosensory information to guide movement [Battaglia‐Mayer and Caminiti, 2002; Lacquaniti et al., 1995; Marconi et al., 2001]. In humans, the left IPL (LIPL) is considered to specifically contribute to language processing and recognition memory [Amici et al., 2006; Gorno‐Tempini et al., 2004; Graves et al., 2010; Wagner et al., 2005]. Recent functional neuroimaging studies have revealed that the LIPL is also involved in other processing domains, including attention [Corbetta and Shulman, 2002; Fan et al., 2005], action and salience processing [Behrmann et al., 2004; Caspers et al., 2010; Iacoboni, 2005].
To investigate whether distinct subregions within the parietal cortex subserve specific functional domains, recent studies have parcellated the LIPL into component subregions based on regional cytoarchitectonic properties [Caspers et al., 2006], receptor distribution patterns [Caspers et al., 2013], and distinct anatomical connectivity profiles [Ruschel et al., 2014; Wang et al., 2012]. However, the association between these LIPL‐subregions and specific functions remains an open question. By integrating resting‐state and task‐dependent functional MRI, Nelson et al. [2010] identified six subdivisions in the left lateral parietal cortex and two subdivisions in the LIPL. However, this subdivision may not completely characterize the functional segregation of the LIPL. For example, several previous studies employed whole‐brain resting‐state functional connectivity (RSFC) to parcellate the entire cortex and identified more fine‐grained subdivisions for the LIPL [Blumensath et al., 2013; Craddock et al., 2012; Shen et al., 2013; Yeo et al., 2011]. However, these studies proposed different LIPL parcellation schemes and the functional organization of this area remains controversial. Thus, a detailed consensus regarding the functional topography of the LIPL is still lacking.
Resting‐state functional MRI (rs‐fMRI) primarily reflects the ongoing spontaneous fluctuations in the human brain [Fox and Raichle, 2007]. By measuring the low‐frequency blood oxygen level dependent (BOLD) signal, rs‐fMRI has been widely used to explore the functional coupling between brain areas and to identify the intrinsic functional modules of the brain [Cohen et al., 2008; Goulas et al., 2012; Kahnt et al., 2012; Power et al., 2011; Yeo et al., 2011]. A growing number of studies have demonstrated that the functional architecture of the human brain during the resting state corresponds with that during task processing [Cole et al., 2014; Smith et al., 2009; Wang et al., 2015b]. These findings suggested that RSFC can inform task‐related behavioral performance. However, whether the functional architecture of the LIPL remains consistent during rest and task processing still needs to be explored.
Recent studies produced mounting evidence that the human brain is a complex network which consists of different functional modules [Cole et al., 2014; Power et al., 2011]. The default mode network (DMN) is one of the most important functional modules in the human brain and plays a crucial role in retrieving autobiographical memories, envisioning the future, and conceiving the perspectives of others [Buckner et al., 2008]. Previous PET and rs‐fMRI studies revealed that the LIPL is an important node of the default mode network (DMN) [Greicius et al., 2003; Raichle et al., 2001]. A previous anatomical connectivity‐based parcellation of the IPL showed that the most posterior subregion located on the supramarginal gyrus (SMG) was primarily involved in the DMN network [Wang et al., 2012]. However, Uddin et al. [2010] subdivided the angular gyrus into the anterior PGa and posterior PGp based on an existing cytoarchitectonic parcellation of the IPL and found that the posterior PGp area was primarily involved in the DMN. Thus, the exact correspondence between the DMN and LIPL subregions is still unknown.
In the macaque, the architecture and connections of the IPL have been well investigated using cytoarchitectonic and tract‐tracing techniques. The cytoarchitecture‐based mapping of the macaque IPL identified four subregions (areas PF, PFG, PG, and Opt arranged rostrally to caudally) [Pandya and Seltzer, 1982]. Subsequently, a tract‐tracing technique was used to map the anatomical connections of each IPL cytoarchitectonic subregion and revealed that each subregion displays distinct anatomical connectivity patterns [Rozzi et al., 2006]. However, whether the human IPL shares the same topography and connectivity patterns with the macaque is a matter of debate. Clarifying the similarity and differences in the IPL connectivity patterns in humans and macaques might shed light on how this area has evolved.
Here, we aimed to identify the functional topography of the LIPL during rest and under task using resting‐state fMRI and coactivation based parcellation approaches to discover whether the two were correspondent and to further characterize its detailed functional organization. The task‐related connectivity pattern was mapped using a meta‐analytic connectivity modeling (MACM) approach based on the BrainMap database (http://www.brainmap.org). MACM can look for global coactivation patterns across a diverse range of tasks. The theory behind MACM is that groups of coordinates that coactivate across experiments can be pooled to identify functionally connected networks in the brain [Robinson et al., 2010]. First, the LIPL was parcellated into distinct subregions using intrinsic RSFC patterns and task‐related coactivation patterns. Next, RSFC, task‐related coactivation patterns, and functional characterizations were used to determine specific connectivity patterns and functional associations for each subregion.
MATERIALS AND METHODS
Subjects
Twenty healthy, right‐handed subjects (10 males and 10 females, mean age = 18.5 years, standard deviation = 0.76) were recruited via advertisement. The data‐set has been used in our previous study [Wang et al., 2015b]. This number of subjects has been demonstrated to obtain reliable parcellation results [Klein et al., 2007]. The participants were free of MRI‐contraindications, and past or current psychiatric or neurological disorders. Before the MRI scanning, they signed an informed consent. The study was in accordance with the latest revision of the declaration of Helsinki and had full ethical approval from the local Research Ethics Committee of the University of Electronic Science and Technology of China.
Resting‐State fMRI Data Acquisition
The MRI data were acquired using a 3.0 Tesla GE MR Scanner. During the resting‐state fMRI scanning, subjects were instructed to lie still and close their eyes. Cushions were used to reduce head motion. During the resting‐state fMRI, 255 volumes of echo planar images were acquired (repetition time = 2,000 ms, echo time = 30 ms; no gap; 40 axial slices, voxel size, 3.75 × 3.75 × 4 mm).
Resting‐State fMRI Data Preprocessing
The resting‐state fMRI data was preprocessed using SPM8 software with DPARSF (http://www.restfmri.net/forum/DPARSF). The first 10 volumes were discarded to allow for magnetization equilibrium. After slice timing correction the time series was realigned to the first volume for head motion correction. The data was discarded if the head‐movement exceeded 2 mm of translation or 2 degrees of rotation in any direction. On the basis of these criteria, no subjects were excluded. The fMRI images were then normalized to the MNI EPI template and resampled to a 3 × 3 × 3 mm voxel‐size. Subsequently, the functional images were smoothed using a Gaussian kernel of 6 mm full‐width at half maximum (FWHM) and filtered with a temporal band‐path of 0.01–0.1 Hz. Six motion parameters, white matter, cerebrospinal fluid, and global mean signals were regressed out. Because a recent study showed that motion influenced measures of functional connectivity [Power et al., 2012], the time course for each run was “scrubbed” by eliminating images before 2 time points and after 1 time point of the bad images that exceeded pre‐set criteria (frame displacement: FD, FD < 0.5) for excessive motion.
Definition of the LIPL
The LIPL was defined on the basis of probabilistic cytoarchitectonic maps. This approach takes into account the retention of quantitative inter‐subject variability information by calculating a maximum probability map (MPM) for the LIPL using the SPM Anatomy Toolbox [Caspers et al., 2008; Eickhoff et al., 2005]. Based on the cytoarchitectonic approach, the postcentral sulcus and the parieto‐occipital sulcus were defined as the anterior and posterior boundaries of the LIPL. The intraparietal sulcus was defined as the dorsal cytoarchitectonic boundary of LIPL. The cytoarchitectonic anterior ventral boundary of the LIPL reaches into the depth of the Sylvian fissure and Rolandic Operculum; the posterior ventral border of the LIPL adjoins the temporal cortex. Next, the LIPL seed mask in MNI space was resampled into 3 and 2 mm cubic voxels for resting‐state functional connectivity analyses and coactivation map calculations for each voxel in the LIPL, respectively.
Resting‐State Functional Connectivity‐Based Parcellation
The RSFC patterns were used to identify the intrinsic functional organization of the LIPL at rest. Initially, the whole brain RSFC for each voxel in the LIPL was computed using Pearson correlation coefficients and next converted to z‐values using the Fisher's z transformation. Next, The similarity for the functional connectivity maps of every pair of voxels within the LIPL was defined using eta2 [Cohen et al., 2008; Kelly et al., 2012; Nebel et al., 2012; Wang et al., 2015b, 2016] to obtain the correlation matrix which is the fraction of the variance in one functional connectivity map accounted for by the variance in a second functional connectivity map. Subsequently, spectral clustering, which can determine a global optimum for clustering results by reducing the dimensions of the similarity matrix, was used to parcellate the LIPL into distinct numbers of clusters (2–9) [Wang et al., 2015b, 2016]. Finally, the group maximum probability map (MPM) across all the subjects was computed for each cluster number. The population‐based MPM was calculated based on all 20 parcellation results in MNI space. The MPM was calculated by assigning each voxel to the cluster in which it was most likely to be located. If two clusters showed the same probability at a particular voxel, this voxel was assigned to the cluster that had the higher average probability among the adjacent voxels.
where ai and bi are the values at position i in the functional connectivity maps a and b, respectively. mi is the mean value of the two functional connectivity maps at position i and is the grand mean across all locations in both correlation maps.
Coactivation Patterns‐Based Parcellation
Coactivation‐based parcellation approaches have been widely used to explore the task‐dependent functional organization of the human brain. The findings were generally consistent with the results from cytoarchitectonic and anatomically tractographic mapping approaches [Bzdok et al., 2013; Clos et al., 2013; Wang et al., 2015b]. In the present study, a coactivation connectivity pattern‐based parcellation was used to investigate the functional architecture of the LIPL during task processing. First, the whole brain coactivation pattern for each voxel of the LIPL was derived based on the BrainMap database [Laird et al., 2009, 2011]. These analyses used a database of PET and fMRI experiments with neuroimaging data from healthy subjects (no interventions, no group comparisons) which reported coordinates in stereotaxic space. The task data included from the BrainMap database ranged from sensory perception to executive functions and cognition, such as somesthesis, spatial perception, semantic and speech processing, working memory, and inhibition control. To reliably define the task‐based functional connectivity, voxels in the neighborhood of each seed voxel were pooled, and those experiments that reported activations closest to the current seed voxel, with the extent of this spatial filter ranging from 20 to 200 experiments in steps of 5, were identified. The mean distance in LIPL voxel varied ranging from the minimum distance 1.9776 to maximum distance 5.0678. This was achieved by computing and subsequently sorting the Euclidian distances between a given seed voxel and any reported activation. Then, the whole brain coactivation pattern for each LIPL voxel was calculated by an activation likelihood estimation (ALE) meta‐analysis of the experiments that were associated with that particular voxel [Eickhoff et al., 2009, 2012; Turkeltaub et al., 2012]. The ALE scores for each voxel in the gray matter were then recorded as the coactivation connectivity pattern for this voxel [Bzdok et al., 2013; Cieslik et al., 2013]. The coactivation connectivity for all the seed voxels was subsequently combined into an N × M matrix where N was the number of seed voxels in the LIPL and M was the number of target voxels throughout the whole brain. Finally, the parcellation of the LIPL was performed with K = 2, 3… 9 using one minus the correlation between the connectivity patterns of the individual seed voxels as the correlation distance measure in the optimal filter range from 80 to 120. The filter sizes were determined to match the consensus solution [Clos et al., 2013]. To this end the optimal filter range was determined by assessing the consistency of the cluster assignments for individual voxels across different filter sizes, and the range was selected with the lowest number of deviants (i.e., voxels that were assigned differently, when compared with the cluster that a voxel was most frequently assigned to across all filter sizes).
Determination of the Cluster Numbers
Hierarchically inconsistent voxels
Different approaches exist to determine the exact number of subdivision clusters in functional brain parcellations. In the present study, we used the hierarchically inconsistent voxels index which quantifies the percentage of voxels not related to the dominant parent cluster compared with the K − 1 clustering number to select the final clustering resolution, and the lowest lost voxel was considered to be the optimal clustering solution. That is, voxels assigned, for example, to cluster 3 in the K = 3 solution stemming from a subset of voxels previously assigned to cluster 2 (in the K = 2 solution) would be excluded if the majority of cluster 3 voxels actually stemmed from cluster 1 (in the K = 2 solution). A given K cluster parcellation qualified as a good solution if the percentage of lost voxels was below the median across all steps and the next clustering step featured a local maximum in the percentage of lost voxels [Clos et al., 2013; Kahnt et al., 2012].
Overlap degree
In addition, we used the Dice coefficient to evaluate the overlap degree of RSFC‐based parcellation results and coactivation‐based parcellation results for the LIPL to provide a complementary reference for determining the cluster numbers [Dice, 1945]. Since the overlap degree usually decreased gradually with an increase in cluster numbers, we chose the final cluster number of the parcellation results according to the appearance of a new peak value of overlap not using the maximum overlap.
Overlap with Cytoarchitectonic Mapping
In order to determine the correspondence of the functional and cytoarchitectonic topography of the LIPL, the RSFC and coactivation‐based parcellation results of the LIPL and the overlap of the RSFC and coactivation based parcellation of the LIPL were separately anatomically assigned to each subregion of cytoarchitectonic MPMs of the LIPL as defined by the SPM Anatomy toolbox [Caspers et al., 2008; Eickhoff et al., 2005]. The nomenclature of cytoarchitectonic subregions of the human LIPL was adopted from Caspers et al. [2006]. The overlap was defined using the Dice coefficient between each subregion of the LIPL yielded by the RSFC, and subsequently the coactivation‐based parcellation and each cytoarchitectonic subregion was calculated. In addition, the overlap between the overlapped part of each subregion yielded by the RSFC and the coactivation‐based parcellation and cytoarchitectonic subregions was computed.
Whole Brain RSFC Patterns of Each Subregion
To map the whole brain RSFC and coactivation patterns of each subregion, we initially obtained the overlap part of each subregion yielded by the RSFC and coactivation patterns based parcellation and resampled to 3 mm3 voxels in MNI space. Then, we mapped the whole brain RSFC to identify the main cortical network for each subregion. The FC was defined using Pearson correlation coefficients between the mean time series of each subregion and each voxel at the whole‐brain level. The FC was calculated for each subject and converted to z values using Fisher's z transformation to improve normality. Subsequently, the z‐values maps were entered into a voxel‐wise random effects one‐sample t‐test to identify the regions showing significant correlations with each subregion. Finally, the FC maps were thresholded at a cluster‐level FWE‐corrected threshold of P < 0.05 (cluster‐forming threshold at voxel‐level P < 0.001).
Whole Brain Coactivation Patterns of Each Subregion
We used structure‐based meta‐analysis and MACM approaches to obtain the task‐related coactivation patterns for each subregion yielded by overlapping the RSFC and coactivation‐based parcellation results for the LIPL in the BrainMap database which featured at least one focus of activation in the particular connectivity‐based parcellation‐yielded subregion [Eickhoff et al., 2010; Laird et al., 2013; Robinson et al., 2010]. Subsequently, we performed an ALE meta‐analysis on the obtained experiments and made statistical inference calculations to establish which brain regions were significantly coactivated with a particular subregion. The ALE score was compared with a null‐distribution that reflected a random spatial association between experiments with a fixed within‐experiment distribution of foci [Eickhoff et al., 2009]. This random‐effects inference evaluates the above‐chance convergence between experiments rather than the clustering of foci within a particular experiment. The ALE scores from the actual meta‐analysis of the experiments activated within a particular subregion were then tested against the ALE scores obtained under this null‐distribution yielding a P‐value based on the proportion of equal or higher random values [Eickhoff et al., 2012]. These non‐parametric P‐values were then converted to z‐scores and thresholded at P < 0.05 (cluster‐level FWE‐corrected, cluster‐forming threshold at voxel‐level P < 0.001).
Overlap and Specific Networks of Each Subregion
In order to identify the common network shared by the whole brain RSFC patterns and coactivation patterns of each subregion, we initially computed whole brain RSFC and task‐related coactivation networks for each LIPL subregion, as described above. Next, both the coactivation and RSFC maps were thresholded at a FWE‐corrected cluster‐level threshold of P < 0.05 (cluster‐forming threshold at voxel‐level P < 0.001). Finally, a conjunction analysis (i.e., the intersection connectivity analysis) which tested what parts of the brain relate to the delineated subregions congruently in the presence and absence of defined psychological tasks was performed to calculate the overlap between the two networks (task‐related coactivation network and resting‐state network) for each subregion. In addition, to quantitatively evaluate the correspondence between the resting‐state and task‐related coactivation networks of each subregion, the spatial correlation between the resting‐state functional network and coactivation network of each LIPL subregion was computed. To calculate the spatial correlation, the whole brain resting‐state and coactivation networks thresholded at a FWE‐corrected cluster‐level threshold of P < 0.05 (cluster‐forming threshold at voxel‐level P < 0.001) were binarized and resampled to the same resolution (in our current study, we resampled the two networks to voxel size resolution of 3 mm). Next, the whole brain resting‐state and coactivation networks were reshaped into two vectors (e.g., the whole brain has about 76,508 voxels at current resolution, thus, the resting‐state and coactivation networks were reshaped to two vectors with the size of 1 × 76,508). Then, all the voxels where both are zeros in the two vectors were masked out. Finally, the Pearson correlation coefficient was calculated between the two vectors. The correlation coefficients for each LIPL subregion indicated that its respective network of resting‐state functional connectivity is also likely to be involved in specific cognitive tasks.
Finally, we mapped the specific overlap networks to reveal the unique RSFC and task‐dependent coactivation patterns for each subregion than other sic LIPL subregions. The specific networks were the brain areas that were significantly more coupled with a given subregion than with any of the others.
DMN‐Related Subregion
Many previous studies demonstrated that the LIPL was involved in the DMN [Buckner et al., 2008; Raichle et al., 2001]. To determine which subregion belonged to the DMN, we calculated the overlap between the DMN and the resting‐state functional network, the task‐dependent coactivation network of each LIPL subregion. We first defined the DMN based on a previous study which used independent component analysis (ICA) to identify the intrinsic networks of the human brain and showed correspondence of functional architecture at rest and under task [Smith et al., 2009]. Subsequently, the overlap degree between each subregion's resting‐state functional network, coactivation network, and the DMN was separately computed to identify which subregion was mostly overlapped with the DMN.
Functional Characterization of Each Subregion
The functional decoding of each subregion of the LIPL was based on behavioral domain and paradigm class analyses in the BrainMap database, which includes different behavior domains and different paradigm classes for the specific task employed. Functional decoding of each LIPL subregion was determined using forward and reverse inferences [Bzdok et al., 2013; Cieslik et al., 2013; Clos et al., 2013; Rottschy et al., 2013; Wang et al., 2015a, 2015b]. In the forward inference approach, the functional profile of a specific subregion was determined by identifying the domains or subdomains for which the probability of activation was significantly higher than the overall chance of activation in that particular subregion. Significance was established using a binomial test (P < 0.05 corrected for multiple comparisons using FDR method) [Eickhoff et al., 2011]. In the reverse inference approach, the functional profile of a subregion was determined by identifying the most likely behavioral domains and paradigm classes associated with activation in a particular subregion using Bayes’ rule. Significance (P < 0.05 corrected for multiple comparisons using Bonferroni's method) was then assessed by means of a chi‐squared test [Clos et al., 2013].
RESULTS
Connectivity‐Based Parcellation of the LIPL
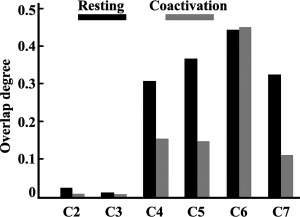
The present study combined resting‐state functional connectivity and task‐related coactivation patterns to parcellate the human LIPL to determine whether a corresponding functional topography exists during rest and under task. In order to determine the number of subregions in the LIPL, a hierarchical inconsistency index and the overlap degree between the MPMs from the resting‐state functional connectivity‐based parcellation and the coactivation‐based parcellation results of the LIPL were calculated. The optimal number of parcels for the LIPL was estimated to be 7, which resulted in the lowest number of hierarchically inconsistent voxels and a new peak value for Dice's coefficient between clustering solutions for the two types of parcellation (Fig. 1A, B). Therefore, a seven‐way parcellation of the LIPL was selected as a guide for further analyses (Fig. 1C).
Figure 1.
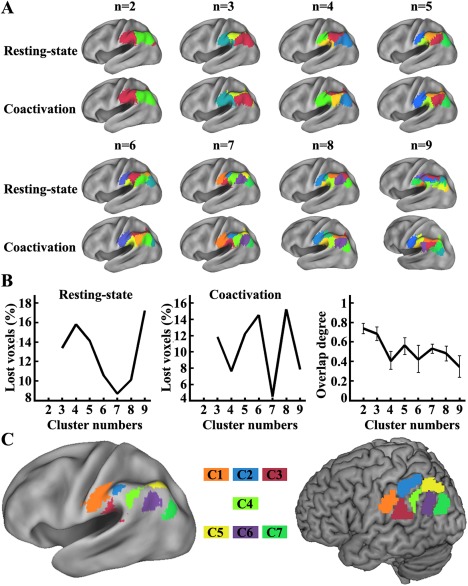
Resting‐state functional connectivity (RSFC) and coactivation‐based parcellation of the left inferior parietal lobule (LIPL). A. RSFC and coactivation patterns were used to parcellate the LIPL into distinct numbers of clusters (2–9), respectively. And the maximum probability map (MPM) for each solution at rest was calculated. B. The hierarchical inconsistency index and overlap degree with standard deviation between the RSFC and coactivation patterns based parcellation results for the LIPL were used to determine the final cluster numbers for the LIPL. C. We overlapped the optimal parcellation results of the LIPL obtained using RSFC and coactivation‐based parcellation to obtain the final results. Finally, the seven‐way parcellation of the LIPL was used to guide further analyses. [Color figure can be viewed at http://wileyonlinelibrary.com]
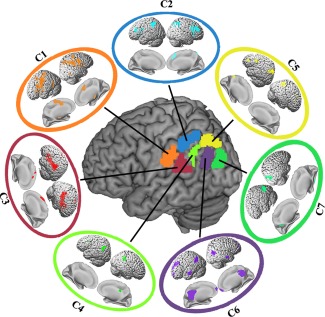
The most rostral cluster of the LIPL was Cluster 1 (ochre/label C1, MNI center coordinate: [−55 −25 33]) which is behind the postcentral sulcus. The overlap between C1 and the cytoarchitectonic map of the LIPL showed that C1 corresponded with cytoarchitectonic PFt [Caspers et al., 2006] (Fig. 2). Cluster 2 (cyan/label C2, MNI center coordinate: [−51 −44 49]) which was dorsal to C1 corresponded well with the cytoarchitectonically defined area PF [Caspers et al., 2006] (Fig. 2). Cluster 3 (sanguine/label C3, MNI center coordinate: [−56 −37 22]) was ventral to C2 and posterior to C1. The overlap degree with the cytoarchitectonic map of the LIPL showed that C3 corresponded with the cytoarchitectonically defined area PFcm [Caspers et al., 2006] (Fig. 2). The most posterior subregion in the supramarginal gyrus was Cluster 4 (light green/label C4, MNI center coordinate: [−53 −51 34]) which corresponded to the cytoarchitectonic area PFm [Caspers et al., 2006] (Fig. 2). In the angular gyrus (AG), we identified three subregions. The dorsal subregion in the AG was Cluster 5 (yellow/label C5, MNI center coordinate: [−38 −69 45]). The overlap analysis showed that this area primarily corresponded to the cytoarchitectonically defined area PGa [Caspers et al., 2006] (Fig. 2). In the ventral AG, we identified two subregions, Cluster 6 (purple/label C6, MNI center coordinate: [−49 −66 29]) and Cluster 7 (dark green/label C7, MNI center coordinate: [−41 −79 24]). The two subregions primarily overlapped with the cytoarchitectonically defined PGp [Caspers et al., 2006] (Fig. 2). Additionally, C6 also contained part of the PGa defined by cytoarchitecture (Fig. 2).
Figure 2.
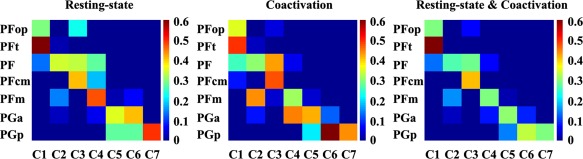
Overlap with the cytoarchitectonic map of the LIPL. The cytoarchitectonic Maximum probability map (MPM) of each LIPL subregion was extracted using the SPM Anatomy Toolbox. Then, the overlap between the cytoarchitectonic map of each LIPL subregion and the map of each LIPL subregion derived by different RSFC and coactivation patterns‐based parcellations was calculated. In the left panel, the overlap between each cytoarchitectonic subregion of the LIPL and each LIPL subregion yielded by resting‐state functional connectivity based parcellation was calculated. In the middle panel, the overlap between each cytoarchitectonic subregion of the LIPL and each LIPL subregion yielded by coactivation‐based parcellation was calculated. In the right panel, the overlap between the overlap part of each subregion yielded by RSFC and the coactivation‐based parcellation and each cytoarchitectonic subregion was also computed. [Color figure can be viewed at http://wileyonlinelibrary.com]
Whole Brain RSFC Pattern for Each Subregion
The whole brain RSFC for each subregion revealed by connectivity‐based parcellation was calculated to identify its involved cortical network (Fig. 3A). For C1, the main functional connections were located in the anterior middle frontal gyrus (MFG), ventral premotor cortex (PMv), anterior and posterior insula, dorsal premotor cortex (PMd), anterior superior parietal lobule (SPL), supplementary motor area (SMA), and postcentral gyrus. C2 was primarily functionally associated with the frontal pole (FP), inferior frontal gyrus (IFG), inferior temporal gyrus (ITG), pre‐SMA, and dorsal lateral prefrontal cortex (DLPFC). C3 was primarily functionally connected with the FP, anterior and posterior insula, SMA, pre‐SMA posterior middle temporal gyrus (MTG), and superior temporal gyrus (STG). The functionally associated brain areas for C4 were located in the MFG, precuneus (PCUN), posterior cingulate cortex, IFG, dorsal medial prefrontal cortex (dmPFC), and anterior MTG. C5 showed associations with the FP, superior frontal gyrus (SFG), MFG, pre‐SMA, middle MTG, and DLPFC. C6 was primarily associated with the DLPFC, anterior MTG, PCUN, and medial prefrontal cortex (mPFC). C7 primarily connected with the anterior and posterior parahippocampus and the PCUN.
Figure 3.
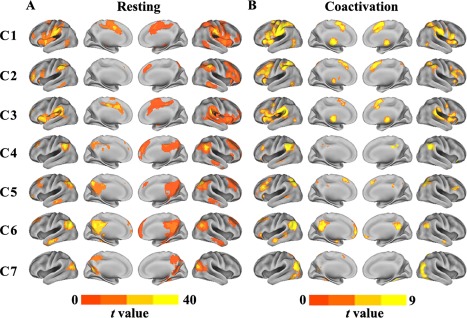
Whole brain resting‐state functional connectivity (RSFC) and coactivation patterns for each LIPL subregion. A. Whole brain RSFC patterns for each cluster were obtained using one sample t‐tests (thresholded at P < 0.05, cluster‐level FWE‐corrected, cluster‐forming threshold at voxel‐level P < 0.001). B, The whole brain coactivation connectivity pattern for each subregion of the LIPL was obtained using meta‐analytical connectivity modeling (MACM) (thresholded at P < 0.05, cluster‐level FWE‐corrected, cluster‐forming threshold at voxel‐level P < 0.001). [Color figure can be viewed at http://wileyonlinelibrary.com]
Whole Brain Coactivation Pattern of Each Subregion
The whole brain coactivation connectivity pattern for each subregion of LIPL was mapped using MACM. The coactivation connectivity pattern of each subregion was very consistent with the observed subregion‐specific RSFC pattern (Fig. 3B). In addition, different coactivation patterns of each LIPL subregion were identified. For C1, coactivation connectivity was additionally found in the precentral gyrus, thalamus (THA), and temporo‐parieto‐occipital junction. For C2, different coactivation connectivity was observed in the anterior insula, intraparietal sulcus, and THA. C3 was additionally coactivated with the IFG, MFG, PMd, THA, and temporo‐parieto‐occipital junction. C4 was additionally coactivated with the inferior frontal sulcus (IFS) and posterior superior temporal sulcus (STS). Additional coactivation for C5 was primarily found in the IFG, posterior STS, and IFS. The additional coactivation connections with C6 were located in the FP. The main additional coactivation connections for C7 were observed in the ITG, V3, V5, SPL, and SMA.
Overlap Network of Each Subregion
We delineated the intersection of the RSFC and coactivation connectivity to obtain the correspondent connectivity profiles at rest and task (Fig. 4). The conjunct connectivity of C1 was found in the PMv, PMd, IFG, SMA, THA, and ITG. For C2, the conjunct connectivity was primarily observed in the IFG, PMv, IFS, DLPFC, and pre‐SMA. The conjunction between the two types of connectivity for C3 was found in IFG, STG, PMd, and SMA. The overlap of the functional and coactivation connectivities of C4 was primarily in IFS and posterior cingulate cortex. The conjunct functional and coactivation connectivity for C5 was predominantly in anterior and posterior IFS, DLPFC, pre‐SMA, and posterior cingulate cortex. The overlap connectivity between rest and task for C6 was mainly found in MFG, FP, PCUN, mPFC, and anterior MTG. The overlap connectivity for C7 was mainly observed in posterior parahippocampus.
Figure 4.
Overlapping connectivities between resting‐state functional connectivity (RSFC) and coactivation patterns of each LIPL subregion. We firstly obtained thresholded whole brain RSFC and coactivation maps of each LIPL subregion and then computed the intersection connectivities between the two modalities. [Color figure can be viewed at http://wileyonlinelibrary.com]
In addition, we quantitatively assessed the consistency of resting‐state functional network and coactivation‐derived network using spatial correlation (Fig. 5). The higher correlation coefficients between the two networks showed the higher consistency at rest and task conditions.
Figure 5.
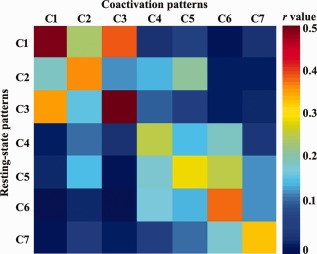
The spatial correlation analyses between resting‐state network and coactivation network of each LIPL subregion. First, the resting‐state functional network and coactivation network of each LIPL subregion were obtained as described above. Then, the spatial Pearson correlation coefficient between the two type networks of any pair of subregions was calculated. [Color figure can be viewed at http://wileyonlinelibrary.com]
Specific Network of Each Subregion
We mapped the specifically overall RSFC and coactivation connectivity to identify the specific network that each subregion participated in (Fig. 6). The specific connectivity for C1 was found in PMv, PMd, IFG THA, SMA, and ITG. The specific resting‐state and coactivation connectivity for C2 was mainly observed in IFS, PMv, IFG, and DLPFC. For C3, the specific connections with STG, IFG, and PMd were identified. The C4 specifically connected with posterior IFS and posterior cingulate cortex at rest and task. The primary specific connections for C5 were found in IFS. For C6, the specific connectivity in rest and task was identified in DLPFC, PCUN, mPFC, and anterior MTG. The specific connectivity of C7 was mainly observed in posterior parahippocampus.
Figure 6.
The specific resting‐state and coactivation connectivity pattern of the seven clusters. The brain areas significantly more correlated and coactivated with a given subregions than with any of the other subregions of LIPL. [Color figure can be viewed at http://wileyonlinelibrary.com]
Determination of DMN‐Related Subregion
We calculated the overlap degree between the DMN network and each subregion's resting‐state and coactivation network to identify which subregion's functional network corresponded to the DMN. The overlap analysis revealed that the DMN‐related subregion was Cluster 6 (Fig. 7).
Figure 7.
Default model network (DMN) related subregions of LIPL. We first extracted the DMN according to the previous study which defined the DMN using independent component analysis method [Smith et al., 2009]. Then, the overlap degree between the DMN and each subregion's resting‐state functional network, task‐dependent coactivation network was calculated to determine which subregion belonged to DMN. The overlap analysis revealed that the Cluster 6 was mainly included in DMN.
Functional Characterization of Each Subregion
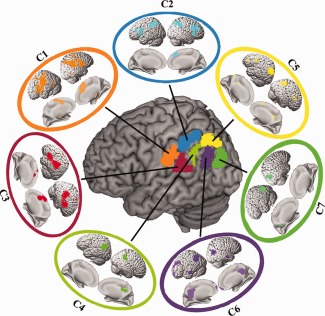
Finally, quantitative forward and reverse inferences on the behavioral domains and paradigm classes were applied to determine the primary functions of each LIPL subregion. This analysis revealed a unique pattern of associations between each subregion and specific cognitive domains (Fig. 8). In summary, the functions that were significantly associated with C1 were somesthesis and action execution. C2 was significantly associated with movement imagination, reasoning, working memory, and inhibition. For C3, the significantly associated functions were music cognition, auditory perception, and speech. C4 was significantly associated with social cognition. C5 was significantly associated with vision, explicit memory, working memory, and language semantics. The main functions associated with C6 were social cognition, language orthography, explicit memory, and language semantics. The posterior subregion of C7 primarily participated in space cognition, perception of visual shape, and motion.
Figure 8.
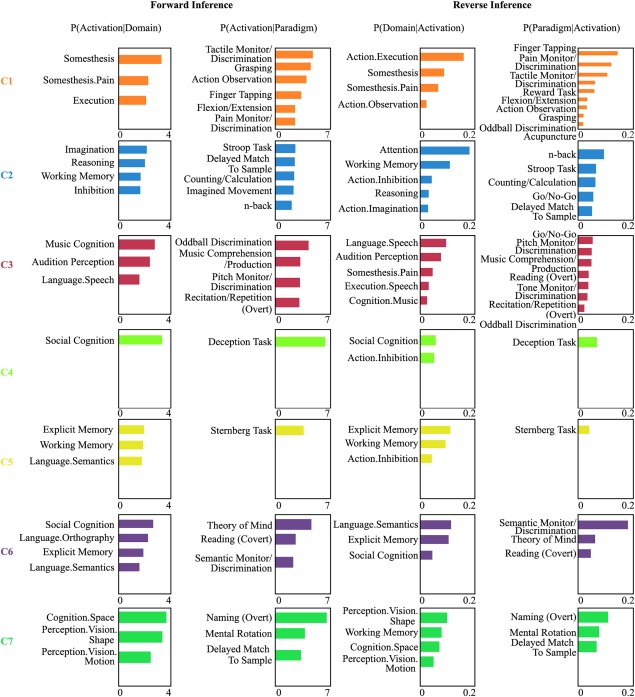
Behavioral domains and paradigm classes of the LIPL subregions. Forward inference and reverse inference were used to determine the functional organization of each LIPL subregion. The significant activation probabilities for each subregion with respect to a given domain or paradigm and the significant probability of a domain's or paradigm's occurrence given activation in a cluster are depicted separately. [Color figure can be viewed at http://wileyonlinelibrary.com]
DISCUSSION
Using RSFC and task‐dependent coactivation patterns, the present study revealed a consistent functional topography of the LIPL during both rest and task processing. The seven‐way parcellation scheme for the LIPL provides detailed information on the functional organization for this area. The proposed functional mapping of the LIPL suggested that activity during the resting‐state reflects the task‐dependent activity in the LIPL and the behavioral performance associated with LIPL functioning.
Previously, the LIPL has been parcellated using different neuroimaging modalities and techniques. Caspers et al. [2006] used observer‐independent cytoarchitectonic mapping to identify seven subareas in the LIPL. Five subareas were located on the supramarginal gyrus and two subareas were located on the posterior angular gyrus. In a subsequent study Caspers et al. [2013] found that the seven subareas could be clustered into three superordinate regions based on different receptor distribution patterns. These seven and three subregion models of the LIPL were further confirmed by anatomical connectivity‐based parcellation [Ruschel et al., 2014; Wang et al., 2012]. In the current study, we combined RSFC and task‐coactivation patterns to identify seven subregions in the LIPL. Our parcellation was in striking accordance with previous cytoarchitectonic and anatomical connectivity information based parcellation of the LIPL. Compared with cytoarchitecture‐based mapping of the LIPL, we consistently identified four subregions in the supramarginal gyrus and two subregions in the angular gyrus. Moreover, our previous anatomical connectivity based parcellation of the LIPL [Wang et al., 2012] revealed similar findings to the resting‐state functional connectivity and task‐related coactivation‐based map of the LIPL in the present study. The consistency of the parcellation of the LIPL between different MRI modalities and techniques suggested that different properties can provide complementary information to reveal the fundamental functional organization of the LIPL. The main difference between our current LIPL mapping results and the cytoarchitecture‐based mapping of the LIPL is that the LIPL subregions yielded by connectivity‐based parcellation showed little overlap with the cytoarchitectonic area PFop. In addition, our current parcellation of the LIPL identified an additional subregion of C5 which is located dorsal to the angular gyrus. The additionally defined C5 subregion in the dorsal angular gyrus is in accordance with a parcellation scheme for the angular gyrus as revealed by task‐based fMRI mapping of this region [Seghier et al., 2010]. Differences in the LIPL parcellation results between studies may be associated with information that is provided by the respective methodological modality used. The cytoarchitecture and receptor distribution patterns primarily reflect the local regional properties of the brain; whereas anatomical connectivity primarily reflects direct axonal connections. In contrast the functional connectivity approach enables not only the identification of direct axonal connections but also indirect axonal connections between brain areas. A recent macaque‐based study further revealed that the intrinsic RSFC reflected the structure of anatomical connectivity only in the anesthetized state [Barttfeld et al., 2015].
Although some differences in the LIPL parcellation schemes based on different information, that is, anatomical connectivity patterns and cytoarchitectonic properties, were observed, a striking correspondence between the resting‐state functional connectivity and the task‐related coactivation patterns based parcellation of the LIPL was found. The correspondent functional topography at rest and under task and the consistent connectivity pattern between resting‐state functional connectivity and coactivation for the LIPL subregions suggested that task‐independent connectivity contributes to keeping functional systems in an active state, thereby improving performance and control whenever functional connectivity is needed [Van den Heuvel and Hulshoff Pol, 2010]. In addition, the convergent evidence between the two states very strongly indicated functional coupling with this area, and the coordinated activation of the cortical networks during behavior shapes the organized pattern of correlated spontaneous activity at rest [Eickhoff and Grefkes, 2011; Shirer et al., 2012]. Hence, ongoing brain spontaneous fluctuations are sculpted by the history of task‐evoked coactivation [Deco and Corbetta, 2011; Lewis et al., 2009].
Functional lateralization of left and right IPL has been documented in many previous studies. The left IPL primarily participated in language processing such as reading [Price and Mechelli, 2005], phonology processing, and semantic processing [Turkeltaub and Coslett, 2010; Vigneau et al., 2006], whereas the right IPL was mainly involved in visuospatial attention and spatial selective attention [Arsalidou and Taylor, 2011; Corbetta and Shulman, 2002; Shulman et al., 2010], especially for attention orientiation/shifting [Fan et al., 2005; Shulman et al., 2010]. The functional asymmetry of the left and right IPL may result from inherently different connectivity patterns of the IPL subregions in the left and right hemispheres [Caspers et al., 2011; Koch et al., 2011; Mars et al., 2011; Parker et al., 2005; Powell et al., 2006; Vernooij et al., 2007; Wang et al., 2012]. Recently, using anatomical and functional connectivity patterns based parcellation approach, we consistently identified five subregions in right IPL [Wang et al., 2016]. In our current study, based on different resting‐state functional connectivity and task‐related coactivation patterns, we identified seven subregions in left IPL. The main difference is that the left IPL contained two additional subregions, C3 and C5, which were specifically participated in language speech and language semantic processing, respectively. Our findings suggested that the functional asymmetry was reflected by its asymmetric topographical architecture of the left and right IPL. Moreover, the functional lateralization of IPL in the two hemispheres was mainly due to the different roles of left and right IPL in language and visuospatial attention processing.
Previous anatomical connectivity analyses in human and tract‐tracing studies in macaques revealed different connectivity patterns in the LIPL subregions. The main functional connectivity with Cluster 1 was in the somatosensory and ventral premotor cortex. These areas are anatomically connected by the superior longitudinal fasciculus (SLF) III [Makris et al., 2005]. The involved cortical network of C1 suggested that this area primarily participated in sensorimotor processing. Recent task‐based functional MRI and meta‐analysis indicated that this area was also involved in tool use and imitation, indicating that this area is an important part of the mirror neuron system [Caspers et al., 2010; Peeters et al., 2009]. Furthermore, functional retinotopic mapping studies have revealed that the intraparietal and super parietal cortex primarily participant in visual object recognition and object manipulation [Konen and Kastner, 2008; Konen et al., 2013; Silver and Kastner, 2009], thus, its connection to the inferior parietal lobule may play a key role in contribution to visually guided reaching and grasping [Garcea and Mahon, 2014]. Although many previous studies have regarded tool use as an important substrate of evolution, emerging evidence from non‐human primate studies demonstrated that non‐human primates, such as macaques, are capable of using tools [Carvalho et al., 2009; Sanz et al., 2010; Vaesen, 2012]. Here, we showed that the connectivity profile of Cluster 1 was similar to the connectivity patterns of the PF [Pandya and Seltzer, 1982] found in macaques, implying that the two areas might be homologous between the two species [Rozzi et al., 2006].
The functional decoding for C2 found that this area participated in movement imagination. This was supported by its specific connections with the pre‐SMA and BA 44. The identified connectivity pattern of human C2 was similar to the connectivity pattern of the PFG [Pandya and Seltzer, 1982] in macaques [Caspers et al., 2011; Rozzi et al., 2006]. The similar connectivity patterns between humans and macaques suggest that the human C2 and macaque PFG may be homologous. A recent meta‐based parcellation of BA 44 also revealed that the specific connection between the posterior BA 44 subregion and the dorsally anterior IPL was related to imagination [Clos et al., 2013]. Moreover, the specific cortical connections with the inferior frontal sulcus and dorsolateral prefrontal cortex of C2 suggested that this area may also be involved in working memory and executive control. The subsequent functional characterization of C2 uncovered that this area was related to working memory and inhibition, which is in line with the specific connectivity patterns of this area. The connected brain areas of C2 and the dorsolateral prefrontal cortex have been described as part of the dorsal attention network [Corbetta and Shulman, 2002]. Further evidence from task‐based fMRI using attention paradigms confirmed that this area is primarily involved in attention orientation [Fan et al., 2005].
The ventral C3 was strongly associated with language processing including music comprehension, auditory perception, and speech processing. The functional characterization of this cluster is in line with its specific connections with the superior temporal gyrus, BA 45, and dorsal premotor area. The subsequent meta‐analysis of phonological discrimination in our study indicated that this area might correspond to the traditional Geschwind area, which plays an important role in language comprehension [Geschwind, 1970]. Moreover, this finding is in accordance with a previous study which found that this LIPL subregion was specifically involved in the phonological processing of Chinese characters and alphabetic words [Tan et al., 2005]. One previous diffusion tensor imaging tractography‐based study suggested that C3 serves as a relay station to connect the anterior Broca's area and posterior Wernicke's area for language and speech processing [Catani et al., 2005]. Clinical studies in schizophrenia and dyslexia patients indicated that disruptions in the white matter pathway between C3 and Broca's area, as well as Wernicke's area, resulted in auditory verbal hallucinations and reading impairment [Catani et al., 2011; Vandermosten et al., 2012].
The most posterior subregion in the supramarginal gyrus identified in our study was C4, which was specifically connected with the inferior frontal sulcus, posterior cingulate cortex, and inferior frontal gyrus. Previous anatomical connection analyses of the cytoarchitectonic area PFm revealed that this area displays unique connectivity patterns and indicated that the area may be an evolutionary young area in humans [Caspers et al., 2011; Husain and Nachev, 2007]. This finding was supported by a comparative neuroanatomical study which found great expansion of the IPL in humans compared with non‐human primates [Eidelberg and Galaburda, 1984; Zilles and Palomero‐Gallagher, 2001]. The functional characterization of C4 revealed that this area was primarily involved in social cognition of deception. Although humans and primates may share basic social network characteristics and basic social functioning [Rushworth et al., 2013], the anatomical connectivity patterns of the PFm might suggest that deception may be a better evolutional social function that is unique to humans.
The functional subdivision of the angular gyrus in the LIPL identified three subregions. The dorsal C5 specially connected with the dorsal precuneus and inferior frontal sulcus, which has consistently been found to be involved in working memory processing [Nee et al., 2013]. The functional characterization for C5 showed that this area was primarily engaged in explicit memory, semantic processing, and working memory. A functional decoding of this area using behavioral domain analysis was in agreement with its specific connectivity patterns. A recent task‐based fMRI study parcellated the angular gyrus into three subregions: the dorsomesial dAG, the middle region mAG, and the ventrolateral vAG. The dorsal subregion of the dAG, which was mainly included in C5, was found to be activated by non‐semantic as well as semantic stimuli, indicating that the dAG plays an key role in semantic representation [Seghier et al., 2010].
The ventral anterior subregion in the angular gyrus corresponds to C6 which mainly connected with brain regions within the default mode network [Greicius et al., 2003; Raichle et al., 2001]. The specific connectivity pattern is in accordance with a previous resting‐state functional connectivity study in human [Uddin et al., 2010]. This finding was also consistent with tract‐tracing based studies in macaque, which have demonstrated that there are direct axonal connections between IPL and anterior‐ventral inferotemporal cortex (TEav) for sensorimotor transformations for grasping with areas involved in object recognition [Borra et al., 2008, 2010; Zhong and Rockland, 2003]. The functional characterization showed that this area is involved in theory of mind, orthography, explicit memory, and semantic processing. These findings indicated that this area is the reading center in the angular gyrus [Houde et al., 2010]. A recent fMRI study revealed that mind wandering was closely related to the default mode network and was specifically associated with retrieving autobiographical memories, envisioning the future, and conceiving the perspectives of others [Buckner et al., 2008; Christoff et al., 2009; Fox et al., 2015]. Recent functional neuroimaging studies in macaques also identified the default mode network, suggesting that the human C6 may be homologous to the macaque PG [Pandya and Seltzer, 1982] and that the two areas may have co‐evolved in humans and macaques [Hutchison et al., 2011; Mantini et al., 2013]. In addition, one of the most prominent functions for this area in the human LIPL is theory of mind or mentalizing processing, during which subjects attempt to infer the intentions or beliefs of others [Behrens et al., 2009; Hampton et al., 2008]. Previous studies demonstrated that macaques make inferences about what their conspecifics see and monitor their actions and action‐outcomes, indicating that macaques have at least basic mentalizing abilities [Chang et al., 2013; Flombaum and Santos, 2005; Yoshida et al., 2012].
Resting‐state and coactivation functional network maps of the ventral posterior angular gyrus subregion, C7, revealed that this area was primarily involved in spatial and visual information processing, suggesting that this area is part of the dorsal visual system [Goodale and Westwood, 2004]. C7 was specifically connected to the posterior parahippocampus via the inferior longitudinal fasciculus. The specific connectivity pattern was in agreement with the functional characterization of this area, which mainly involved space recognition and memory, particularly memory retrieval [Henson et al., 1999]. The specific connectivity pattern indicated that this area also participated in spatial navigation [Epstein and Kanwisher, 1998; Epstein, 2008]. The functional connectivity pattern for Cluster 7 was consistent with a previous anatomical connectivity‐based map of the IPL [Mars et al., 2011; Rushworth et al., 2006]. A tract tracer technique‐based map in macaques also identified the connection between the Opt [Pandya and Seltzer, 1982] and the parahippocampus, suggesting a possible homology between the human PGp and the macaque Opt [Rozzi et al., 2006].
The IPL which was considered to be a part of dorsal visual stream plays an important role in visuospatial processing, whereas the ventral anterior temporal lobe which is the ventral visual stream primarily participates in object recognition. The tract‐tracing based study in macaque have revealed the direct axon connection between IPL and anterior‐ventral TE (TEav) for sensorimotor transformations. However, in our current study, although we identified the subregion of C6 connecting with anterior middle temporal gyrus, we did not find the functional connectivity between LIPL subregions and anterior inferior temporal gyrus. The functional connectivity analyses of LIPL subregions revealed the functional network that each subregion participated in. however, the functional connectivity analysis for human LIPL subregions did not identify the connectivity to ventral anterior temporal lobe, which has been found in macaque using tract‐tracing based study. The inferior parietal lobule was considered to be a part of dorsal visual stream
In summary, we revealed a correspondent functional architecture of the LIPL during rest and task processing using a connectivity‐based parcellation approach. The parcellation scheme for the LIPL was further supported by utilizing specific connectivity pattern mapping analyses and functional characterization. Our findings provide more detailed information about the functional organization of the LIPL and may facilitate future clinical and cognitive research addressing this area.
Contributor Information
Jiaojian Wang, Email: jiaojianwang@uestc.edu.cn.
Tianzi Jiang, Email: jiangtz@nlpr.ia.ac.cn.
REFERENCES
- Amici S, Gorno‐Tempini ML, Ogar JM, Dronkers NF, Miller BL (2006): An overview on Primary Progressive Aphasia and its variants. Behav Neurol 17:77–87. [DOI] [PMC free article] [PubMed] [Google Scholar]
- Arsalidou M, Taylor MJ (2011): Is 2 + 2=4? Meta‐analyses of brain areas needed for numbers and calculations. NeuroImage 54:2382–2393. [DOI] [PubMed] [Google Scholar]
- Barttfeld P, Uhrig L, Sitt JD, Sigman M, Jarraya B, Dehaene S (2015): Signature of consciousness in the dynamics of resting‐state brain activity. Proc Natl Acad Sci U S A 112:887–892. [DOI] [PMC free article] [PubMed] [Google Scholar]
- Battaglia‐Mayer A, Caminiti R (2002): Optic ataxia as a result of the breakdown of the global tuning fields of parietal neurones. Brain: J Neurol 125:225–237. [DOI] [PubMed] [Google Scholar]
- Behrens TE, Hunt LT, Rushworth MF (2009): The computation of social behavior. Science 324:1160–1164. [DOI] [PubMed] [Google Scholar]
- Behrmann M, Geng JJ, Shomstein S (2004): Parietal cortex and attention. Curr Opin Neurobiol 14:212–217. [DOI] [PubMed] [Google Scholar]
- Blumensath T, Jbabdi S, Glasser MF, Van Essen DC, Ugurbil K, Behrens TE, Smith SM (2013): Spatially constrained hierarchical parcellation of the brain with resting‐state fMRI. NeuroImage 76:313–324. [DOI] [PMC free article] [PubMed] [Google Scholar]
- Borra E, Belmalih A, Calzavara R, Gerbella M, Murata A, Rozzi S, Luppino G (2008): Cortical connections of the macaque anterior intraparietal (AIP) area. Cereb Cortex 18:1094–1111. [DOI] [PubMed] [Google Scholar]
- Borra E, Ichinohe N, Sato T, Tanifuji M, Rockland KS (2010): Cortical connections to area TE in monkey: Hybrid modular and distributed organization. Cereb Cortex 20:257–270. [DOI] [PMC free article] [PubMed] [Google Scholar]
- Buckner RL, Andrews‐Hanna JR, Schacter DL (2008): The brain's default network: Anatomy, function, and relevance to disease. Ann N Y Acad Sci 1124:1–38. [DOI] [PubMed] [Google Scholar]
- Bzdok D, Laird AR, Zilles K, Fox PT, Eickhoff SB (2013): An investigation of the structural, connectional, and functional subspecialization in the human amygdala. Hum Brain Mapp 34:3247–3266. [DOI] [PMC free article] [PubMed] [Google Scholar]
- Carvalho S, Biro D, McGrew WC, Matsuzawa T (2009): Tool‐composite reuse in wild chimpanzees (Pan troglodytes): archaeologically invisible steps in the technological evolution of early hominins?. Anim Cogn 12: S103–S114. [DOI] [PubMed] [Google Scholar]
- Caspers S, Geyer S, Schleicher A, Mohlberg H, Amunts K, Zilles K (2006): The human inferior parietal cortex: Cytoarchitectonic parcellation and interindividual variability. NeuroImage 33:430–448. [DOI] [PubMed] [Google Scholar]
- Caspers S, Eickhoff SB, Geyer S, Scheperjans F, Mohlberg H, Zilles K, Amunts K (2008): The human inferior parietal lobule in stereotaxic space. Brain Struct Funct 212:481–495. [DOI] [PubMed] [Google Scholar]
- Caspers S, Zilles K, Laird AR, Eickhoff SB (2010): ALE meta‐analysis of action observation and imitation in the human brain. NeuroImage 50:1148–1167. [DOI] [PMC free article] [PubMed] [Google Scholar]
- Caspers S, Eickhoff SB, Rick T, von Kapri A, Kuhlen T, Huang R, Shah NJ, Zilles K (2011): Probabilistic fibre tract analysis of cytoarchitectonically defined human inferior parietal lobule areas reveals similarities to macaques. NeuroImage 58:362–380. [DOI] [PMC free article] [PubMed] [Google Scholar]
- Caspers S, Schleicher A, Bacha‐Trams M, Palomero‐Gallagher N, Amunts K, Zilles K (2013): Organization of the human inferior parietal lobule based on receptor architectonics. Cereb Cortex 23:615–628. [DOI] [PMC free article] [PubMed] [Google Scholar]
- Catani M, Jones DK, ffytche DH (2005): Perisylvian language networks of the human brain. Ann Neurol 57:8–16. [DOI] [PubMed] [Google Scholar]
- Catani M, Craig MC, Forkel SJ, Kanaan R, Picchioni M, Toulopoulou T, Shergill S, Williams S, Murphy DG, McGuire P (2011): Altered integrity of perisylvian language pathways in schizophrenia: Relationship to auditory hallucinations. Biol Psychiatry 70:1143–1150. [DOI] [PubMed] [Google Scholar]
- Chang SW, Gariepy JF, Platt ML (2013): Neuronal reference frames for social decisions in primate frontal cortex. Nat Neurosci 16:243–250. [DOI] [PMC free article] [PubMed] [Google Scholar]
- Christoff K, Gordon AM, Smallwood J, Smith R, Schooler JW (2009): Experience sampling during fMRI reveals default network and executive system contributions to mind wandering. Proc Natl Acad Sci U S A 106:8719–8724. [DOI] [PMC free article] [PubMed] [Google Scholar]
- Cieslik EC, Zilles K, Caspers S, Roski C, Kellermann TS, Jakobs O, Langner R, Laird AR, Fox PT, Eickhoff SB (2013): Is there “one” DLPFC in cognitive action control? Evidence for heterogeneity from co‐activation‐based parcellation. Cereb Cortex 23:2677–2689. [DOI] [PMC free article] [PubMed] [Google Scholar]
- Clos M, Amunts K, Laird AR, Fox PT, Eickhoff SB (2013): Tackling the multifunctional nature of Broca's region meta‐analytically: Co‐activation‐based parcellation of area 44. NeuroImage 83:174–188. [DOI] [PMC free article] [PubMed] [Google Scholar]
- Cohen AL, Fair DA, Dosenbach NU, Miezin FM, Dierker D, Van Essen DC, Schlaggar BL, Petersen SE (2008): Defining functional areas in individual human brains using resting functional connectivity MRI. NeuroImage 41:45–57. [DOI] [PMC free article] [PubMed] [Google Scholar]
- Cole MW, Bassett DS, Power JD, Braver TS, Petersen SE (2014): Intrinsic and task‐evoked network architectures of the human brain. Neuron 83:238–251. [DOI] [PMC free article] [PubMed] [Google Scholar]
- Corbetta M, Shulman GL (2002): Control of goal‐directed and stimulus‐driven attention in the brain. Nat Rev Neurosci 3:201–215. [DOI] [PubMed] [Google Scholar]
- Craddock RC, James GA, Holtzheimer PE, 3rd , Hu XP, Mayberg HS (2012): A whole brain fMRI atlas generated via spatially constrained spectral clustering. Hum Brain Mapp 33:1914–1928. [DOI] [PMC free article] [PubMed] [Google Scholar]
- Deco G, Corbetta M (2011): The dynamical balance of the brain at rest. Neuroscientist 17:107–123. [DOI] [PMC free article] [PubMed] [Google Scholar]
- Dice LR (1945): Measures of the amount of ecologic association between species. Ecology 26:297–302. [Google Scholar]
- Eickhoff SB, Grefkes C (2011): Approaches for the integrated analysis of structure, function and connectivity of the human brain. Clin EEG Neurosci 42:107–121. [DOI] [PMC free article] [PubMed] [Google Scholar]
- Eickhoff SB, Stephan KE, Mohlberg H, Grefkes C, Fink GR, Amunts K, Zilles K (2005): A new SPM toolbox for combining probabilistic cytoarchitectonic maps and functional imaging data. NeuroImage 25:1325–1335. [DOI] [PubMed] [Google Scholar]
- Eickhoff SB, Laird AR, Grefkes C, Wang LE, Zilles K, Fox PT (2009): Coordinate‐based activation likelihood estimation meta‐analysis of neuroimaging data: A random‐effects approach based on empirical estimates of spatial uncertainty. Hum Brain Mapp 30:2907–2926. [DOI] [PMC free article] [PubMed] [Google Scholar]
- Eickhoff SB, Jbabdi S, Caspers S, Laird AR, Fox PT, Zilles K, Behrens TE (2010): Anatomical and functional connectivity of cytoarchitectonic areas within the human parietal operculum. J Neurosci 30:6409–6421. [DOI] [PMC free article] [PubMed] [Google Scholar]
- Eickhoff SB, Bzdok D, Laird AR, Roski C, Caspers S, Zilles K, Fox PT (2011): Co‐activation patterns distinguish cortical modules, their connectivity and functional differentiation. NeuroImage 57:938–949. [DOI] [PMC free article] [PubMed] [Google Scholar]
- Eickhoff SB, Bzdok D, Laird AR, Kurth F, Fox PT (2012): Activation likelihood estimation meta‐analysis revisited. NeuroImage 59:2349–2361. [DOI] [PMC free article] [PubMed] [Google Scholar]
- Eidelberg D, Galaburda AM (1984): Inferior parietal lobule. Divergent architectonic asymmetries in the human brain. Arch Neurol 41:843–852. [DOI] [PubMed] [Google Scholar]
- Epstein RA (2008): Parahippocampal and retrosplenial contributions to human spatial navigation. Trends Cogn Sci 12:388–396. [DOI] [PMC free article] [PubMed] [Google Scholar]
- Epstein R, Kanwisher N (1998): A cortical representation of the local visual environment. Nature 392:598–601. [DOI] [PubMed] [Google Scholar]
- Fan J, McCandliss BD, Fossella J, Flombaum JI, Posner MI (2005): The activation of attentional networks. NeuroImage 26:471–479. [DOI] [PubMed] [Google Scholar]
- Flombaum JI, Santos LR (2005): Rhesus monkeys attribute perceptions to others. Curr Biol 15:447–452. [DOI] [PubMed] [Google Scholar]
- Fox MD, Raichle ME (2007): Spontaneous fluctuations in brain activity observed with functional magnetic resonance imaging. Nat Rev Neurosci 8:700–711. [DOI] [PubMed] [Google Scholar]
- Fox KC, Spreng RN, Ellamil M, Andrews‐Hanna JR, Christoff K (2015): The wandering brain: Meta‐analysis of functional neuroimaging studies of mind‐wandering and related spontaneous thought processes. NeuroImage 111:611–621. [DOI] [PubMed] [Google Scholar]
- Garcea FE, Mahon BZ (2014): Parcellation of left parietal tool representations by functional connectivity. Neuropsychologia 60:131–143. [DOI] [PMC free article] [PubMed] [Google Scholar]
- Geschwind N (1970): The organization of language and the brain. Science 170:940–944. [DOI] [PubMed] [Google Scholar]
- Goodale MA, Westwood DA (2004): An evolving view of duplex vision: Separate but interacting cortical pathways for perception and action. Curr Opin Neurobiol 14:203–211. [DOI] [PubMed] [Google Scholar]
- Gorno‐Tempini ML, Dronkers NF, Rankin KP, Ogar JM, Phengrasamy L, Rosen HJ, Johnson JK, Weiner MW, Miller BL (2004): Cognition and anatomy in three variants of primary progressive aphasia. Ann Neurol 55:335–346. [DOI] [PMC free article] [PubMed] [Google Scholar]
- Goulas A, Uylings HB, Stiers P (2012): Unravelling the intrinsic functional organization of the human lateral frontal cortex: A parcellation scheme based on resting state fMRI. J Neurosci 32:10238–10252. [DOI] [PMC free article] [PubMed] [Google Scholar]
- Graves WW, Desai R, Humphries C, Seidenberg MS, Binder JR (2010): Neural systems for reading aloud: A multiparametric approach. Cereb Cortex 20:1799–1815. [DOI] [PMC free article] [PubMed] [Google Scholar]
- Greicius MD, Krasnow B, Reiss AL, Menon V (2003): Functional connectivity in the resting brain: A network analysis of the default mode hypothesis. Proc Natl Acad Sci U S A 100:253–258. [DOI] [PMC free article] [PubMed] [Google Scholar]
- Hampton AN, Bossaerts P, O'Doherty JP (2008): Neural correlates of mentalizing‐related computations during strategic interactions in humans. Proc Natl Acad Sci U S A 105:6741–6746. [DOI] [PMC free article] [PubMed] [Google Scholar]
- Henson RN, Rugg MD, Shallice T, Josephs O, Dolan RJ (1999): Recollection and familiarity in recognition memory: An event‐related functional magnetic resonance imaging study. J Neurosci 19:3962–3972. [DOI] [PMC free article] [PubMed] [Google Scholar]
- Houde O, Rossi S, Lubin A, Joliot M (2010): Mapping numerical processing, reading, and executive functions in the developing brain: An fMRI meta‐analysis of 52 studies including 842 children. Dev Sci 13:876–885. [DOI] [PubMed] [Google Scholar]
- Husain M, Nachev P (2007): Space and the parietal cortex. Trends Cogn Sci 11:30–36. [DOI] [PMC free article] [PubMed] [Google Scholar]
- Hutchison RM, Leung LS, Mirsattari SM, Gati JS, Menon RS, Everling S (2011): Resting‐state networks in the macaque at 7 T. NeuroImage 56:1546–1555. [DOI] [PubMed] [Google Scholar]
- Iacoboni M (2005): Neural mechanisms of imitation. Curr Opin Neurobiol 15:632–637. [DOI] [PubMed] [Google Scholar]
- Kahnt T, Chang LJ, Park SQ, Heinzle J, Haynes JD (2012): Connectivity‐based parcellation of the human orbitofrontal cortex. J Neurosci 32:6240–6250. [DOI] [PMC free article] [PubMed] [Google Scholar]
- Kelly C, Toro R, Di Martino A, Cox CL, Bellec P, Castellanos FX, Milham MP (2012): A convergent functional architecture of the insula emerges across imaging modalities. NeuroImage 61:1129–1142. [DOI] [PMC free article] [PubMed] [Google Scholar]
- Klein JC, Behrens TEJ, Robson MD, Mackay CE, Higham DJ, Johansen‐Berg H (2007): Connectivity‐based parcellation of human cortex using diffusion MRI: Establishing reproducibility, validity and observer independence in BA 44/45 and SMA/pre‐SMA. NeuroImage 34:204–211. [DOI] [PubMed] [Google Scholar]
- Koch G, Cercignani M, Bonni S, Giacobbe V, Bucchi G, Versace V, Caltagirone C, Bozzali M (2011): Asymmetry of parietal interhemispheric connections in humans. J Neurosci 31:8967–8975. [DOI] [PMC free article] [PubMed] [Google Scholar]
- Konen CS, Kastner S (2008): Representation of eye movements and stimulus motion in topographically organized areas of human posterior parietal cortex. J Neurosci 28:8361–8375. [DOI] [PMC free article] [PubMed] [Google Scholar]
- Konen CS, Mruczek RE, Montoya JL, Kastner S (2013): Functional organization of human posterior parietal cortex: Grasping‐ and reaching‐related activations relative to topographically organized cortex. J Neurophysiol 109:2897–2908. [DOI] [PMC free article] [PubMed] [Google Scholar]
- Lacquaniti F, Guigon E, Bianchi L, Ferraina S, Caminiti R (1995): Representing spatial information for limb movement: Role of area 5 in the monkey. Cereb Cortex 5:391–409. [DOI] [PubMed] [Google Scholar]
- Laird AR, Eickhoff SB, Kurth F, Fox PM, Uecker AM, Turner JA, Robinson JL, Lancaster JL, Fox PT (2009): ALE meta‐analysis workflows via the brainmap database: Progress towards a probabilistic functional brain atlas. Front Neuroinform 3:23. [DOI] [PMC free article] [PubMed] [Google Scholar]
- Laird AR, Eickhoff SB, Fox PM, Uecker AM, Ray KL, Saenz JJ, Jr , McKay DR, Bzdok D, Laird RW, Robinson JL, Turner JA, Turkeltaub PE, Lancaster JL, Fox PT (2011): The BrainMap strategy for standardization, sharing, and meta‐analysis of neuroimaging data. BMC Res Notes 4:349. [DOI] [PMC free article] [PubMed] [Google Scholar]
- Laird AR, Eickhoff SB, Rottschy C, Bzdok D, Ray KL, Fox PT (2013): Networks of task co‐activations. NeuroImage 80:505–514. [DOI] [PMC free article] [PubMed] [Google Scholar]
- Lewis CM, Baldassarre A, Committeri G, Romani GL, Corbetta M (2009): Learning sculpts the spontaneous activity of the resting human brain. Proc Natl Acad Sci U S A 106:17558–17563. [DOI] [PMC free article] [PubMed] [Google Scholar]
- Makris N, Kennedy DN, McInerney S, Sorensen AG, Wang R, Caviness VS, Jr , Pandya DN (2005): Segmentation of subcomponents within the superior longitudinal fascicle in humans: A quantitative, in vivo, DT‐MRI study. Cereb Cortex 15:854–869. [DOI] [PubMed] [Google Scholar]
- Mantini D, Corbetta M, Romani GL, Orban GA, Vanduffel W (2013): Evolutionarily novel functional networks in the human brain?. J Neurosci 33:3259–3275. [DOI] [PMC free article] [PubMed] [Google Scholar]
- Marconi B, Genovesio A, Battaglia‐Mayer A, Ferraina S, Squatrito S, Molinari M, Lacquaniti F, Caminiti R (2001): Eye‐hand coordination during reaching. I. Anatomical relationships between parietal and frontal cortex. Cereb Cortex 11:513–527. [DOI] [PubMed] [Google Scholar]
- Mars RB, Jbabdi S, Sallet J, O'Reilly JX, Croxson PL, Olivier E, Noonan MP, Bergmann C, Mitchell AS, Baxter MG, Behrens TE, Johansen‐Berg H, Tomassini V, Miller KL, Rushworth MF (2011): Diffusion‐weighted imaging tractography‐based parcellation of the human parietal cortex and comparison with human and macaque resting‐state functional connectivity. J Neurosci 31:4087–4100. [DOI] [PMC free article] [PubMed] [Google Scholar]
- Nebel MB, Joel SE, Muschelli J, Barber AD, Caffo BS, Pekar JJ, Mostofsky SH (2012): Disruption of functional organization within the primary motor cortex in children with autism. Hum Brain Mapp 35:567–580. [DOI] [PMC free article] [PubMed] [Google Scholar]
- Nee DE, Brown JW, Askren MK, Berman MG, Demiralp E, Krawitz A, Jonides J (2013): A meta‐analysis of executive components of working memory. Cereb Cortex 23:264–282. [DOI] [PMC free article] [PubMed] [Google Scholar]
- Nelson SM, Cohen AL, Power JD, Wig GS, Miezin FM, Wheeler ME, Velanova K, Donaldson DI, Phillips JS, Schlaggar BL, Petersen SE (2010): A parcellation scheme for human left lateral parietal cortex. Neuron 67:156–170. [DOI] [PMC free article] [PubMed] [Google Scholar]
- Pandya DN, Seltzer B (1982): Intrinsic connections and architectonics of posterior parietal cortex in the rhesus monkey. J Comp Neurol 204:196–210. [DOI] [PubMed] [Google Scholar]
- Parker GJ, Luzzi S, Alexander DC, Wheeler‐Kingshott CA, Ciccarelli O, Lambon Ralph MA (2005): Lateralization of ventral and dorsal auditory‐language pathways in the human brain. NeuroImage 24:656–666. [DOI] [PubMed] [Google Scholar]
- Peeters R, Simone L, Nelissen K, Fabbri‐Destro M, Vanduffel W, Rizzolatti G, Orban GA (2009): The representation of tool use in humans and monkeys: Common and uniquely human features. J Neurosci 29:11523–11539. [DOI] [PMC free article] [PubMed] [Google Scholar]
- Powell HW, Parker GJ, Alexander DC, Symms MR, Boulby PA, Wheeler‐Kingshott CA, Barker GJ, Noppeney U, Koepp MJ, Duncan JS (2006): Hemispheric asymmetries in language‐related pathways: A combined functional MRI and tractography study. NeuroImage 32:388–399. [DOI] [PubMed] [Google Scholar]
- Power JD, Cohen AL, Nelson SM, Wig GS, Barnes KA, Church JA, Vogel AC, Laumann TO, Miezin FM, Schlaggar BL, Petersen SE (2011): Functional network organization of the human brain. Neuron 72:665–678. [DOI] [PMC free article] [PubMed] [Google Scholar]
- Power JD, Barnes KA, Snyder AZ, Schlaggar BL, Petersen SE (2012): Spurious but systematic correlations in functional connectivity MRI networks arise from subject motion. NeuroImage 59:2142–2154. [DOI] [PMC free article] [PubMed] [Google Scholar]
- Price CJ, Mechelli A (2005): Reading and reading disturbance. Curr Opin Neurobiol 15:231–238. [DOI] [PubMed] [Google Scholar]
- Raichle ME, MacLeod AM, Snyder AZ, Powers WJ, Gusnard DA, Shulman GL (2001): A default mode of brain function. Proc Natl Acad Sci U S A 98:676–682. [DOI] [PMC free article] [PubMed] [Google Scholar]
- Robinson JL, Laird AR, Glahn DC, Lovallo WR, Fox PT (2010): Metaanalytic connectivity modeling: Delineating the functional connectivity of the human amygdala. Hum Brain Mapp 31:173–184. [DOI] [PMC free article] [PubMed] [Google Scholar]
- Rottschy C, Caspers S, Roski C, Reetz K, Dogan I, Schulz JB, Zilles K, Laird AR, Fox PT, Eickhoff SB (2013): Differentiated parietal connectivity of frontal regions for “what” and “where” memory. Brain Struct Funct 218:1551–1567. [DOI] [PMC free article] [PubMed] [Google Scholar]
- Rozzi S, Calzavara R, Belmalih A, Borra E, Gregoriou GG, Matelli M, Luppino G (2006): Cortical connections of the inferior parietal cortical convexity of the macaque monkey. Cereb Cortex 16:1389–1417. [DOI] [PubMed] [Google Scholar]
- Ruschel M, Knosche TR, Friederici AD, Turner R, Geyer S, Anwander A (2014): Connectivity architecture and subdivision of the human inferior parietal cortex revealed by diffusion MRI. Cereb Cortex 24:2436–2448. [DOI] [PubMed] [Google Scholar]
- Rushworth MF, Behrens TE, Johansen‐Berg H (2006): Connection patterns distinguish 3 regions of human parietal cortex. Cereb Cortex 16:1418–1430. [DOI] [PubMed] [Google Scholar]
- Rushworth MF, Mars RB, Sallet J (2013): Are there specialized circuits for social cognition and are they unique to humans?. Curr Opin Neurobiol 23:436–442. [DOI] [PubMed] [Google Scholar]
- Sanz CM, Schoning C, Morgan DB (2010): Chimpanzees prey on army ants with specialized tool set. Am J Primatol 72:17–24. [DOI] [PubMed] [Google Scholar]
- Seghier ML, Fagan E, Price CJ (2010): Functional subdivisions in the left angular gyrus where the semantic system meets and diverges from the default network. J Neurosci 30:16809–16817. [DOI] [PMC free article] [PubMed] [Google Scholar]
- Shen X, Tokoglu F, Papademetris X, Constable RT (2013): Groupwise whole‐brain parcellation from resting‐state fMRI data for network node identification. NeuroImage 82:403–415. [DOI] [PMC free article] [PubMed] [Google Scholar]
- Shirer WR, Ryali S, Rykhlevskaia E, Menon V, Greicius MD (2012): Decoding subject‐driven cognitive states with whole‐brain connectivity patterns. Cereb Cortex 22:158–165. [DOI] [PMC free article] [PubMed] [Google Scholar]
- Shulman GL, Pope DL, Astafiev SV, McAvoy MP, Snyder AZ, Corbetta M (2010): Right hemisphere dominance during spatial selective attention and target detection occurs outside the dorsal frontoparietal network. J Neurosci 30:3640–3651. [DOI] [PMC free article] [PubMed] [Google Scholar]
- Silver MA, Kastner S (2009): Topographic maps in human frontal and parietal cortex. Trends Cogn Sci 13:488–495. [DOI] [PMC free article] [PubMed] [Google Scholar]
- Smith SM, Fox PT, Miller KL, Glahn DC, Fox PM, Mackay CE, Filippini N, Watkins KE, Toro R, Laird AR, Beckmann CF (2009): Correspondence of the brain's functional architecture during activation and rest. Proc Natl Acad Sci U S A 106:13040–13045. [DOI] [PMC free article] [PubMed] [Google Scholar]
- Tan LH, Laird AR, Li K, Fox PT (2005): Neuroanatomical correlates of phonological processing of Chinese characters and alphabetic words: A meta‐analysis. Hum Brain Mapp 25:83–91. [DOI] [PMC free article] [PubMed] [Google Scholar]
- Turkeltaub PE, Coslett HB (2010): Localization of sublexical speech perception components. Brain Lang 114:1–15. [DOI] [PMC free article] [PubMed] [Google Scholar]
- Turkeltaub PE, Eickhoff SB, Laird AR, Fox M, Wiener M, Fox P (2012): Minimizing within‐experiment and within‐group effects in Activation Likelihood Estimation meta‐analyses. Hum Brain Mapp 33:1–13. [DOI] [PMC free article] [PubMed] [Google Scholar]
- Uddin LQ, Supekar K, Amin H, Rykhlevskaia E, Nguyen DA, Greicius MD, Menon V (2010): Dissociable connectivity within human angular gyrus and intraparietal sulcus: Evidence from functional and structural connectivity. Cereb Cortex 20:2636–2646. [DOI] [PMC free article] [PubMed] [Google Scholar]
- Vaesen K (2012): The cognitive bases of human tool use. Behav Brain Sci 35:203–218. [DOI] [PubMed] [Google Scholar]
- Van den Heuvel MP, Hulshoff Pol HE (2010): Exploring the brain network: A review on resting‐state fMRI functional connectivity. Eur Neuropsychopharmacol 20:519–534. [DOI] [PubMed] [Google Scholar]
- Vandermosten M, Boets B, Poelmans H, Sunaert S, Wouters J, Ghesquiere P (2012): A tractography study in dyslexia: Neuroanatomic correlates of orthographic, phonological and speech processing. Brain: J Neurol 135:935–948. [DOI] [PubMed] [Google Scholar]
- Vernooij MW, Smits M, Wielopolski PA, Houston GC, Krestin GP, van der Lugt A (2007): Fiber density asymmetry of the arcuate fasciculus in relation to functional hemispheric language lateralization in both right‐ and left‐handed healthy subjects: A combined fMRI and DTI study. NeuroImage 35:1064–1076. [DOI] [PubMed] [Google Scholar]
- Vigneau M, Beaucousin V, Herve PY, Duffau H, Crivello F, Houde O, Mazoyer B, Tzourio‐Mazoyer N (2006): Meta‐analyzing left hemisphere language areas: Phonology, semantics, and sentence processing. NeuroImage 30:1414–1432. [DOI] [PubMed] [Google Scholar]
- Wagner AD, Shannon BJ, Kahn I, Buckner RL (2005): Parietal lobe contributions to episodic memory retrieval. Trends Cogn Sci 9:445–453. [DOI] [PubMed] [Google Scholar]
- Wang J, Fan L, Zhang Y, Liu Y, Jiang D, Zhang Y, Yu C, Jiang T (2012): Tractography‐based parcellation of the human left inferior parietal lobule. NeuroImage 63:641–652. [DOI] [PubMed] [Google Scholar]
- Wang J, Fan L, Wang Y, Xu W, Jiang T, Fox PT, Eickhoff SB, Yu C, Jiang T (2015a): Determination of the posterior boundary of Wernicke's area based on multimodal connectivity profiles. Hum Brain Mapp 36:1908–1924. [DOI] [PMC free article] [PubMed] [Google Scholar]
- Wang J, Yang Y, Fan L, Xu J, Li C, Liu Y, Fox PT, Eickhoff SB, Yu C, Jiang T (2015b): Convergent functional architecture of the superior parietal lobule unraveled with multimodal neuroimaging approaches. Hum Brain Mapp 36:238–257. [DOI] [PMC free article] [PubMed] [Google Scholar]
- Wang J, Zhang J, Rong M, Wei X, Zheng D, Fox PT, Eickhoff SB, Jiang T (2016): Functional topography of the right inferior parietal lobule structured by anatomical connectivity profiles. Hum Brain Mapp 37:4316–4332. [DOI] [PMC free article] [PubMed] [Google Scholar]
- Yeo BT, Krienen FM, Sepulcre J, Sabuncu MR, Lashkari D, Hollinshead M, Roffman JL, Smoller JW, Zollei L, Polimeni JR, Fischl B, Liu H, Buckner RL (2011): The organization of the human cerebral cortex estimated by intrinsic functional connectivity. J Neurophysiol 106:1125–1165. [DOI] [PMC free article] [PubMed] [Google Scholar]
- Yoshida K, Saito N, Iriki A, Isoda M (2012): Social error monitoring in macaque frontal cortex. Nat Neurosci 15:1307–1312. [DOI] [PubMed] [Google Scholar]
- Zhong YM, Rockland KS (2003): Inferior parietal lobule projections to anterior inferotemporal cortex (area TE) in macaque monkey. Cereb Cortex 13:527–540. [DOI] [PubMed] [Google Scholar]
- Zilles K, Palomero‐Gallagher N (2001): Cyto‐, myelo‐, and receptor architectonics of the human parietal cortex. NeuroImage 14:S8–20. [DOI] [PubMed] [Google Scholar]