

Abstract
The organization of functional brain networks changes across human lifespan. The present study analyzed functional brain networks in healthy full‐term infants (N = 139) within 1–6 days from birth by measuring neural synchrony in EEG recordings during quiet sleep. Large‐scale phase synchronization was measured in six frequency bands with the Phase Lag Index. Macroscopic network organization characteristics were quantified by constructing unweighted minimum spanning tree graphs. The cortical networks in early infancy were found to be significantly more hierarchical and had a more cost‐efficient organization compared with MST of random control networks, more so in the theta and alpha than in other frequency bands. Frontal and parietal sites acted as the main hubs of these networks, the topological characteristics of which were associated with gestation age (GA). This suggests that individual differences in network topology are related to cortical maturation during the prenatal period, when functional networks shift from strictly centralized toward segregated configurations. Hum Brain Mapp 38:4019–4033, 2017. © 2017 Wiley Periodicals, Inc.
Keywords: electroencephalography, neonate, functional connectivity, network analysis, graph theory, minimum spanning tree
INTRODUCTION
Efficient communication between brain regions in both micro‐ and macroscopic scales is essential for healthy cognitive functioning [Bassett et al., 2009; Uhlhaas et al., 2010; Van den Heuvel et al., 2017; Varela et al., 2001]. The establishment of synaptic connections between cortical neurons forming highly organized cortical networks has been suggested as a hallmark of neuronal maturation [Boersma et al., 2011]. Previous infant studies found that genetic factors and sensory input are both crucial for the development of cortical networks [for a review, see Khazipov and Luhmann, 2006]. Neuronal communication between brain areas, assessed through temporal coupling/dependency between spatially remote neuronal assemblies [termed “functional connectivity” (FC)] can be measured by phase synchronization of neural rhythms. FC has been shown to develop throughout the human lifespan [Fransson et al., 2007, Uhlhaas et al., 2009, 2010]. Therefore, it is important to determine the characteristics of functional cortical networks at birth, the point at which the environmental stimulation radically changes from that of the preceding fetal period. The aim of the present study was to assess the organization of large‐scale functional brain networks in newborn infants during quiet sleep and explore its relationship with gestational age (index of prenatal maturation) and variables characterizing possible prenatal influences on brain maturation, such as some general clinical risk factors of the mother and the offspring.
The structural and functional organizational principles of brain networks can be examined by brain networks represented as graphs, an abstract mathematical description of the elements of the network and their interactions [for reviews, see Stam, 2014; Varela et al., 2001]. In healthy adults, in rest or in a no‐task condition, EEG/MEG functional networks take the form of the cost‐efficient “small‐world” organization, which provides optimal ratio of direct communication between closely spaced and separated brain areas [Stam and van Straaten, 2012]. The small‐world network organization combines the high‐level functional segregation/clustering of ordered regular networks (which enable fast information flow within local subnetworks) with the short path length of random networks (which enable efficient large‐scale integration of subnetworks). These neuronal networks also display hierarchical modular topology [see De Haan et al., 2012; Van den Heuvel and Pol, 2010], and include densely connected “hub” regions, which can serve as coordination centers [Achard et al., 2006].
The large majority of studies investigating the development of FC in infancy have assessed either FC differences between preterm or extremely low birth‐weight infants and full‐term newborns [González et al., 2011; Grieve et al., 2008; Meijer et al., 2014; Omidvarnia et al., 2014; Pereda et al., 2006] or longitudinal changes in FC following preterm birth [Jennekens et al., 2012; Myers et al., 2012]. Important observations of these studies are (1) rapid increase in fronto‐parietal connectivity in preterm population from day one to three [Schumacher et al., 2015] and (2) stronger connectivity in healthy relative to extremely low birth‐weight newborns [Grieve et al., 2008]. So far, only few studies assessed the early development EEG brain networks in healthy newborns [Omidvarnia et al., 2014, Tokariev et al., 2015]. During the first 2 weeks from birth, an increase in interhemispheric phase synchrony was observed together with a concurrent decrease in the ratio of intra‐/interhemispheric connections in the low delta range [Tokariev et al., 2015]. Omidvarnia et al. [2014] showed that functional network organization during late gestation exhibits salient spatially selective developmental trajectories: subnetwork clustering increases in anterior and decreases in posterior cortical areas, as was shown both for the 3–8 Hz and even stronger for the 5–18 Hz frequency range. These results represent network reorganization resulting from maturation or change in the external stimulation after birth. Subnetworks further develop later during infancy and they are gradually differentiated during childhood possibly in relation to the development of cognitive abilities [Ferreira and Busatto, 2013; Van den Heuvel and Pol, 2010]. From a graph‐theoretical perspective, FC between 5 and 7 years of age already exhibits the economical trade‐off between high level clustering and short path [Bathelt et al., 2013, Boersma et al., 2011; Fair et al., 2008; Micheloyannis et al., 2006; Power et al., 2010; Supekar et al., 2009; Smit et al., 2012]. Although these and similar results clearly demonstrate that FC patterns are potential indicators of cortical immaturity, yet little is known about the effects of prenatal development on FC in healthy newborn infants.
In the present study, EEG has been recorded during quiet sleep in healthy newborn infants born to term. The most frequent quiet sleep state [Prechtl, 1974] was chosen because it is easily identifiable and it is the dominant vigilance state of the newborns; further, it has been associated with postmenstrual age [Dulce et al., 2007; Duffy et al., 2003]. The characteristic features of FC have been extracted from EEG by calculating phase synchronization (measured as phase lag index, PLI; [Stam et al., 2007]) and represented using the graph‐theoretical measures of minimum spanning tree (MST) topologies [Boersma et al., 2013, Stam and van Straaten, 2012; Stam et al., 2014; Tewarie et al., 2015]. The PLI measure reduces the effects of volume conduction (the effects of common sources on the EEG signal) and it is (largely) independent of the reference electrode [Martin and Chao, 2001]. PLI has been previously employed in measuring newborn infants' EEG‐based FC [González et al., 2011]. The MST network representation was chosen, because the common measures of network topology are highly dependent on the connections available in a network and the number of connections per network node. This leads to biased differences in network comparisons [Stam et al., 2014]. The MST calculation overcomes the bias of network density and degree without any additional normalization step by forming an acyclic sub‐network that connects all nodes via a fixed number of edges [Stam et al., 2014; Tewarie et al., 2015]. Therefore, MST was used to filter each network in order to increase comparability between measures extracted for different infants and frequency ranges. Further, using the MST subset of connections allows calculation of additional network properties, such as the degree of hierarchical organization across infant functional networks. Medical/biological data about the gestation age, the mother, and the infant were collected and their relationship with the characteristics of the functional networks was determined for assessing their possible association with brain maturation. In particular, we expected that (1) the topology of functional networks will vary as a function of the underlying oscillatory frequencies and that (2) longer gestation age, higher birth‐weight, and optimal cardiovascular measures of the mother will result in more mature infantile network topologies (closer to the organization that combines the optimal ratio between functionally integrated and segregated networks).
MATERIALS AND METHODS
Participants
EEG was recorded in 164 healthy, full‐term (gestation age (GA) 36 weeks and above) newborn infants (90 male) during day 1–6 postpartum. Data of 25 infants were excluded based on the criterion of retaining overall 140 seconds of EEG signal after artifact rejection (at least 35 epochs of 4,096 ms duration). Thus, 139 healthy, full‐term new‐born infants (76 male) were included in the final sample. Table 1 summarizes descriptive statistics of medical/biological measures, whereas Supporting Information Table 1 shows the distribution of categorical data in our sample.
Table 1.
Descriptive statistics of the medical/biological measures
| Missing | Mean | SD | Range | Skewness | Kurtosis | |
|---|---|---|---|---|---|---|
| Postmenstrual age at birth (weeks) | 1 | 38.84 | 1.10 | 36–41 | −0.59 | 0.45 |
| Baby's birth weight (g) | − | 3321.69 | 396.63 | 2170–4160 | −0.25 | −0.29 |
| Chronological age at the recording (days) | − | 2.39 | 0.76 | 1–6 | 0.64 | 2.81 |
| Mother's age (years) | 1 | 31.45 | 4.47 | 20–43 | 0.27 | −0.12 |
| Mother's pre‐pregnancy weight (kg) | 2 | 66.02 | 12.81 | 42–124 | 1.22 | 2.76 |
| Mother's postpartum weight (kg) | 2 | 78.63 | 13.92 | 49–127 | 0.78 | 0.83 |
| Mother's height (m) | 2 | 1.66 | 0.07 | 1.48–1.84 | 0.06 | 0.20 |
| Mother's systolic BP (mm Hg) | 3 | 112.63 | 13.30 | 70–160 | 0.42 | 2.40 |
| Mother's diastolic BP (mm Hg) | 3 | 69.63 | 8.84 | 50–100 | 1.19 | 2.72 |
Note. The mother's pre‐pregnancy weight and the length of the pregnancy were based on self‐reports. BP = blood pressure.
Procedure, Electroencephalographic Recording
EEG was recorded in a dedicated experimental room at the Department of Obstetrics‐Gynecology and Perinatal Intensive Care Unit, Military Hospital, Budapest. Informed consent was obtained from one or both parents. The mother of the infant could opt to be present during the recording. The study was conducted in full accordance with the World Medical Association Helsinki Declaration and all applicable national laws; it was approved by the relevant ethics committee: Medical Research Council—Committee of Scientific and Research Ethics (ETT‐TUKEB), Hungary. The infants in our sample participated in one or more other EEG studies on sound processing within the same session. The EEG data reported here was always recorded first within the session.
Five minutes of spontaneous EEG was recorded during quiet sleep with Ag/AgCl electrodes attached to the scalp at the Fp1, Fp2, Fz, F3, F4, F7, F8, T3, T4, Cz, C3, C4, Pz, P3, P4 locations according to the International 10–20 system. The reference electrode was placed on the tip of the nose and the ground electrode on the forehead. Eye movements were monitored with two bipolarly connected electrodes: one placed lateral to the outer canthus of left eye and the other above the left eye. EEG was digitized with 24 bit resolution at a sampling rate of 1 kHz by a direct‐coupled amplifier (V‐Amp, Brain Products GmbH). The signals were on‐line low‐pass filtered at 110 Hz. The impedance values were monitored throughout the recording session (average impedance 9.89 kΩ ± 9.72). Although high impedance can introduce additional noise into the recordings, it should not be systematic in the entire group and its effects are mitigated by filtering out the very low frequencies, which may be contaminated by drifts. Furthermore, the strict impedance criteria used in adults is unfeasible in newborn infants where abrasive preparation must be milder. Infants' sleep state was determined based on behavioral criteria set up by Anders et al. [1971]. Only infants that were in quiet sleep for the whole 5 minute duration were included in the study. In addition to the behavioral criteria employed, the EEG signal was visually inspected (ensuring that muscle tension was tonic, respiration regular, and eyes movements were absent).
EEG Data Analysis
The raw EEG signals were off‐line filtered (band‐bass, Hamming windowed Fast Fourier Transform) in the 0.5–45 Hz frequency range. EEG data were then segmented into 4,096 ms long epochs. If physiological (eye movements, muscle artifacts) or external (i.e., environmental noise) artefacts were found, the epoch was rejected from the further analysis. A minimum of 35 epochs was considered sufficient [Hillebrand et al., 2012; Tewarie et al., 2015] for further functional connectivity analysis. The final dataset consisted on average of 55.54 (SD = 14.88) epochs/participant. The selected EEG epochs were band‐pass filtered (without phase distortion using zero phase band‐bass, Hamming windowed Fast Fourier Transform; [Delorme and Makeig, 2004]) into five frequency bands (delta: 0.5–4 Hz; theta: 4–8 Hz, lower alpha: 8–10 Hz, upper alpha: 10–12 Hz, beta: 13–30 Hz, gamma 30–45 Hz). The 4‐s segments cover at least 2 cycles of the lowest frequency and 16 cycles the highest frequency of the slowest (delta) band of oscillations, which is sufficient to assess oscillatory activity [Fraschini, et al., 2016; Hillebrand et al., 2012; Omidvarnia et al., 2014]. The strength of FC was quantified by measuring phase synchronization between EEG channels, separately in five frequency bands and for each epoch. The level of FC between any two signals is defined as the phase lag synchronization strength measured by PLI. PLI reflects the consistency by which one signal is phase leading or lagging with respect to another signal [Stam et al., 2007]. Specifically, the PLI measures the asymmetry in the distribution of the phase differences obtained from the instantaneous phases of the two time series (here the time series corresponding to the recordings from two EEG channels). It can be expressed in the following way:
where refers to the time series of phase differences (t) calculated over all k = 1…N time points of a trial, sign refers to the signum function, 〈〉 refers to the mean value, and || denotes the absolute value. PLI is expressed as a value between 0 (random phase difference: minimum strength of functional connectivity) and 1 (constant phase difference: maximum strength of functional connectivity). PLI was calculated by using the BrainWave software version 0.9.151.5 [available at http://home.kpn.nl/stam7883/brainwave.html]. Graph construction was based on the full connectivity matrix constructed from the PLI values obtained for each pair of electrodes.
Graph‐Theoretical Analysis
In order to investigate the global topological organization of infant functional brain networks, the graph theoretical representation of the functional connectivity matrix was created by the MST approach [Boersma et al., 2013, Stam and van Straaten, 2012]. The MST graph of a connectivity matrix is a graph in which all nodes (electrodes) are connected using the strongest available connections and without forming loops. As a consequence, only one path connects any pair of nodes. MST graphs were generated separately for each infant, epoch, and frequency band. Graph metrics computed from MSTs are strongly related to those computed from the original network as characterized by weighted connections between each pair of nodes [Tewarie et al., 2015]. The characteristics extracted from the graphs derived by the MST approach have been successfully employed for describing FC network properties (e.g., hierarchical structure, degree distribution, etc.) of healthy adults and patient groups with neurodegenerative disorders, such as epilepsy and multiple sclerosis [for review, see Stam et al., 2014]. For the current analysis, MST connectivity networks were derived by the Kruskal's algorithm [Kruskal, 1956]. Following the construction of MSTs, global and node‐specific network characteristics (see Fig. 4) were quantified based on the measures described by Stam et al. [2014]. “Degree Centrality” (DEG) is the number of edges connected to a node. “Betweenness Centrality” (BC) is a measure of the node's “hubness” within the network. It is defined as the normalized fraction of all shortest paths connecting two nodes that pass through the particular node [for detailed mathematical description see Newman and Girvan, 2004; Stam et al., 2014]. The DEG and BC measures were calculated for each node separately and the maximum values within each MST were included in the statistical analyses as global characteristics of the MST (MaxDEG and MaxBC, respectively). “Leaf Fraction” (LF) is the number of nodes with only 1 connected edge divided by the total number of nodes in the MST. “Diameter” (DIAM) is the largest distance between any two nodes within the MST, where distance refers to the minimum number of edges required to proceed from one node to another (the shortest path). “Tree Hierarchy” (TH) assesses how hierarchical a given network is compared with the so called “star‐like network organization.” The calculation of TH is based on the values of MaxBC and LF [for a detailed mathematical description, see Boersma et al., 2013; Tewarie et al., 2015]. TH ranges from 0 (indicating a line‐like topology) to 1; for the star‐like topology, TH approaches 0.5. The optimal TH is somewhere between a line and a star‐like topology; the higher the TH, the better the tradeoff between integration and differentiation in an MST. MST network characteristics values were normalized by dividing them by the number of EEG signals measured. The global MST network characteristics were averaged across epochs, separately for each infant and frequency band.
Figure 4.
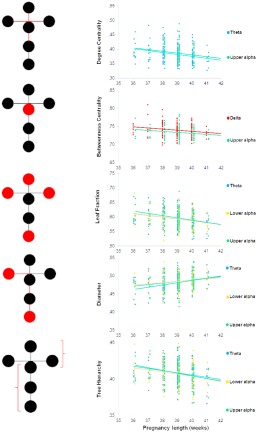
Relationship between GA and network characteristics. The network characteristic is marked by the schematic diagram on the left. Circles indicate vertices (nodes), lines edges. Diagrams represent the linear relationship between GA (x axis) and the corresponding network characteristics (y axis) shown by different colors for the different frequency bands. Dots correspond to the individual infants' data. [Color figure can be viewed at http://wileyonlinelibrary.com]
For assessing whether the graph‐theory based descriptions of the FCs represent common tendencies for the current group of infants, brain network characteristics were compared with those of referential random networks. Random networks were generated by a permutation based procedure preserving the degree distribution of the original network: (1) the PLI values within the connectivity matrix were permuted for each epoch, yielding identical number of connectivity matrices for random network assessment that was extracted for the actual infant network; (2) random‐network MST graphs and their characteristics were quantified the same way as was described above for the actual data. Additionally, for testing the robustness of the above random‐network creation procedure, the procedure was repeated 1,000 times for each epoch and the extracted network metrics were averaged separately for each infant. Statistical testing the difference between the actual infant and the referential networks was then done twice (see next section).
MST graphs may also be used for extracting information about the common topography of functional networks within the group of infants. Therefore, the distribution of the node characteristics Betweeness Centrality and Degree Centrality over the scalp was calculated. The scalp distributions of these centrality values allow identifying regions of the brain that serve as hubs for the information flow in each frequency bands. Thus, for each node (electrode), infant, and frequency band, the average DEG and BC values were computed and their scalp distributions were calculated.
Statistical Analysis
Statistical analysis was performed with the SPSS software package [version 20.0; IBM Corp., 2011]. For testing whether the observed functional networks represent characteristics of the infant's brain, repeated‐measures Analyses of Variance (ANOVA) were used to compare the characteristics of random network and the infant FC networks of each frequency band (NETWORK TYPE × BAND) separately for each MST network characteristic (MaxDEG, MaxBC, LF, DIAM, and TH). Greenhouse‐Geisser correction was employed to correct for sphericity violations [Greenhouse and Geisser, 1959] and Mauchly's W (ε) and the significance value of the sphericity test (pε) are listed for the affected analyses. Effect sizes (partial eta squared, η 2) are also shown for each ANOVA test. For testing the homogeneity of the scalp distributions of the node indices of the infant brain networks, one‐way ANOVAs were used to compare the spatial characteristics of these node measures (NODE LOCATION), separately for each frequency band and network characteristic (DEG, BC). Bonferroni correction was applied to the post‐hoc pairwise comparisons. For testing the robustness of the random‐network creation procedure, the networks resulting from the 1,000 repetition of the random‐network procedure were compared with the actual infant networks by Mann–Whitney U tests, separetaly for each MST measure and frequency band.
By following a data‐driven Forward algorithm1, linear regression models [Pearson, 1895] were constructed for assessing the relationship between medical/biological data and functional network characteristics (DEGMax, BCMax, LF, DIAM, and TH), separately for each frequency band. To avoid distorted results, we controlled the skewness value of variables with the “rule of thumb” threshold of −1.0 1.0 [Pearson, 1895]. This type of filtering allowed us to enter into analyses the following variables: “gestation age” (GA), “infant's birth weight” (BW), “infant's age at the time of the recording” (IA), “mother's age” (MA), “mother's postpartum weight” (MW), and “mother's height” (MH). Given that we assume that regression models are independent from each other and also that a relatively small number of predictors and models were analyzed, the alpha level of 0.05 was used to evaluate statistical results [see also at Gelman et al., 2012]. In order to test whether the observed correlations between GA and some MST metrics are independent of the average spectral power, average connectivity strength and average MST connectivity strength, Pearson's correlation was calculated between these variables and GA. Furthermore Pearson's correlation was also calculated between the average connectivity strength average on one hand and MST connectivity strength and MST metrics on the other hand. All PLI values from the connectivity matrix were averaged for the average connectivity matrix strength index, separately for each infant. For the average MST strength index, all PLI values from each MST graph were averaged, separately for each infant. The relative spectral power of each EEG channel was calculated and then averaged across channels, yielding average spectral power indices, separately for each frequency band and infant. The relative spectral power for each frequency band was defined as the ratio of absolute power (defined as the sum of all power within the frequency band) to total power of the signal (expressed in percentage). Multiple comparisons were corrected using a randomization (permutation) method. First, all EEG indices (MST strength index, average PLI and spectral power, for all frequency bands) were collected into a “family,” then correlated with the GA. The significance levels were determined the following way: the distribution of the absolute value of correlation coefficients under the null hypothesis was estimated for GA by permuting its values 10,000 times and correlating the family of EEG measures. The highest absolute correlation was registered from each permutation run. The P‐value of the observed correlation was established as the proportion of the extracted maximal absolute correlation coefficients that were higher than or equal to the absolute value of the actual correlation.
RESULTS
For illustrating the topologies of the FC networks, a group‐averaged connectivity matrix was constructed for each frequency band. To eliminate spurious connections, the PLI values for all epochs were sorted separately for each electrode pair in each frequency band and the upper and lower 5% was removed before averaging and constructing the MST. Furthermore, consistency maps of MST matrices were also constructed for each frequency band. Consistency refers to the probability that an edge is part of an MST considering the MST graphs of each individual epoch. The visualized MSTs of these mean matrices and the consistency matrices are shown in Figure 1. Note that the topology of the EEG networks varies across frequency bands (see detailed statistical results below). In the delta band, temporal–posterior nodes (T4, P4) showed the highest centrality values, strongest functional connections, and the highest consistency while in the theta and alpha frequency bands, fronto‐central nodes (Fz and Cz) dominated these characteristics. In the faster frequency bands, the nodes of the temporal lobe displayed the highest centrality values and strongest functional connectivity. Generally, the scalp map of the MST constructed from the group‐average connectivity matrix were observed to be highly overlapping with the distribution of the most consistent network edges derived from the consistency maps. Edges with high consistency in the theta and alpha frequency bands were relatively local while the highly consistent edges in the delta band network included large scale links as well. The infant FC networks are quite hierarchical in all frequency bands (see detailed statistical analysis below): they are generally organized into 3–4 hierarchical layers (see Fig. 1). Therefore, the functional connections of infant brain networks appear to be organized in a highly centralized manner.
Figure 1.
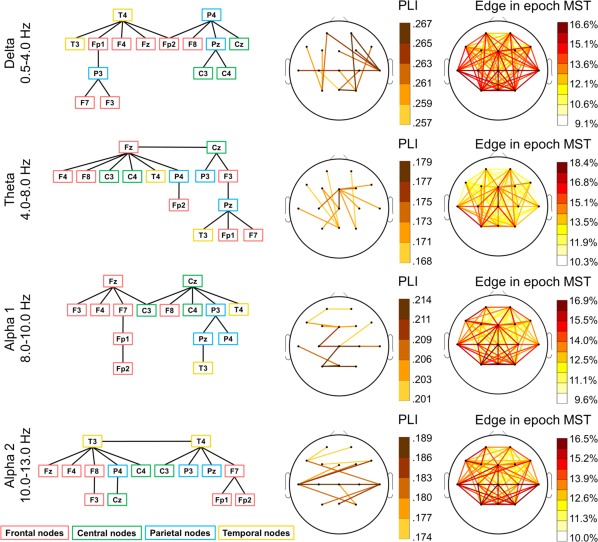
Group‐average (N = 139) MSTs of newborn infants represented as hierarchical graphs (A) and projected on the scalp (B), separately for each frequency band. The node color refers to the large‐scale scalp location (red: frontal nodes; green: central nodes; blue: parietal nodes; yellow: temporal nodes). The edge colors on the head plots show the strength of functional connectivity (PLI) between nodes (see color calibration at the right side). [Color figure can be viewed at http://wileyonlinelibrary.com]
Comparing Network Characteristics Between Infant FC Networks and Corresponding Random Networks
Figure 2 shows the group‐average network measures for the actual and the referential random data, separately for each frequency band. Overall, the topological organization of the actual functional networks was significantly nonrandom. That is, relative to the control random networks, newborns' neural networks were typically strongly hierarchical (see TH), consisting of more peripheral nodes (LF), and had higher centrality measures with a combination of shorter pathways (DIAM). Further, in contrast to the random networks, the characteristics of infant FC networks differed across the different frequency bands. The statistical results comparing between actual and random networks are summarized in Table 2.
Figure 2.
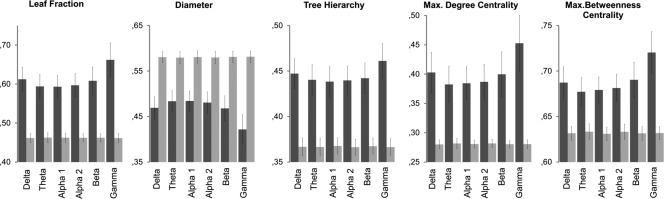
Descriptive statistics of the MST metrics of for the actual and corresponding random networks, separetaly for each frequency band. Dark bars represent the actual networks, light ones the random ones.
Table 2.
MST network characteristics and their comparison between actual and random functional networks, separately for the different frequency bands
| ANOVA results | ||||||
|---|---|---|---|---|---|---|
| Variable | Effect | Ε | F | df | P | η 2 |
| MaxDEG | NETWORK TYPE | 3,209.56 | 1,138 | *** | 0.96 | |
| BAND | 0.29 | 117.01 | 5,690 | *** | 0.46 | |
| Interaction | 0.29 | 127.77 | 5,690 | *** | 0.48 | |
| MaxBC | NETWORK TYPE | 3,605.91 | 1,138 | *** | 0.96 | |
| BAND | 0.73 | 123.13 | 5,690 | *** | 0.47 | |
| Interaction | 0.71 | 128.60 | 5,690 | *** | 0.48 | |
| LF | NETWORK TYPE | 4,751.59 | 1,138 | *** | 0.97 | |
| BAND | 0.40 | 126.10 | 5,690 | *** | 0.48 | |
| Interaction | 0.43 | 144.39 | 5,690 | *** | 0.51 | |
| Diam | NETWORK TYPE | 5,502.26 | 1,138 | *** | 0.98 | |
| BAND | 0.65 | 130.50 | 5,690 | *** | 0.49 | |
| Interaction | 0.68 | 156.03 | 5,690 | *** | 0.53 | |
| TH | NETWORK TYPE | 4,946.51 | 1,138 | *** | 0.97 | |
| BAND | 0.72 | 40.99 | 5,690 | *** | 0.23 | |
| Interaction | 0.79 | 44.26 | 5,690 | *** | 0.24 | |
Note. The presence of ε indicates the employment of Greenhouse–Geisser correction due to sphericity violation. *** P < 0.001.
Maximal degree
The MaxDEG values were significantly higher for the infant FC networks than for the random networks (main effect of NETWORK TYPE). The BAND × NETWORK TYPE interaction was significant because unlike for random networks, MaxDEG significantly varied across frequency bands for the infant FC networks (P < 0.001 in all pairwise comparisons between the gamma and any other band as well as between the delta/beta and the theta/lower‐alpha/higher‐alpha comparisons).
Maximal betweenness centrality
The MaxBC values were significantly higher for the infant FC networks than for the random networks. Significant BAND × NETWORK TYPE interaction was observed due to the frequency specific differences of MaxBC values of the infant's brain networks only. Post‐hoc pairwise comparisons revealed higher MaxBC values in the gamma compared with all other bands, and higher MaxBC values for delta and beta bands relative to theta and lower, higher alpha (P < 0.001 in all pairwise comparisons except for the comparison between the delta and the upper alpha band, which yielded a P‐value of 0.002).
Leaf fraction
The main effect of NETWORK TYPE was found significant due to the higher LF values for the infant FC networks compared with LF values for the random networks. Post hoc analysis of the significant BAND × NETWORK TYPE interaction showed that LF values significantly different across the frequency bands for the infant but not for the random networks. The gamma band LF was higher compared with that in all other frequency bands (P < 0.001 in all pairwise comparisons). The LF values in the delta and beta bands were significantly higher compared with the LF values in theta, low and high alpha rhythms (P < 0.001 in all pairwise comparisons).
Diameter
Relative to DIAM values observed for random networks, the infant FC networks showed significantly lower values (main effect of NETWORK TYPE). Only the infant FC networks' DIAM values varied significantly across the frequency bands (interaction of the BAND × NETWORK TYPE). Pairwise comparisons of the DIAM values across frequency bands showed again significantly higher values in the gamma relative to all other bands and higher values for the delta and beta, than in the alpha and theta bands (P < 0.001 in all pairwise comparisons).
Tree hierarchy
The infant FC networks were found to be more hierarchical (higher TH values) compared with the random networks (main effect of NETWORK TYPE). The BAND × NETWORK TYPE interaction was significant, because TH values of the FC networks of the newborns showed differences between frequency bands. Specifically, TH values in the gamma and delta bands were significantly higher than these values in any other frequency band (P < 0.001 in all case).
The robustness of the random network construction was evaluated by the repeated permutation procedure described in section “Graph‐theoretical analysis.” A secondary statistical comparison between the resulting random network characteristics and the measured infant data was then performed (see section “Statistical analysis”). Random network assessment was highly robust because the Mann–Whitney U tests replicated the above described differences between the random and infant networks: all network characteristics (MaxDeg; MaxBC; LF; TH; DIAM) in all frequency bands differed highly significantly between the two types of networks (P < 0.001).
Scalp Distribution of Betweenness Centrality and Degree Centrality
Figure 3 (left panel) shows the scalp distribution of the BC values, separately for the different frequency bands. The main effect of NODE LOCATION was significant for all frequency bands (see the main effects in Table 3). Post‐hoc comparisons indicated a parietal maximum in the delta, midline fronto‐central maximum in the theta, midline frontal maximum in the lower alpha, centro‐temporal maximum in the higher alpha, and lateral fronto‐temporal maxima in the beta and gamma bands (P < 0.001 in most comparisons, see Supporting Information Table 2). Figure 3 (right panel) shows the scalp distribution of the DEG values, separately for the different frequency bands. The main effect of NODE LOCATION was significant in all frequency bands (see the main effects in Table 3). Post‐hoc comparisons indicated temporo‐parietal maximum in the delta, midline fronto‐central maximum in the theta, midline fronto‐central and temporo‐parietal maxima in the lower and upper alpha, and lateral fronto‐temporal maxima in the beta and gamma bands (P < 0.001 in most comparisons, see Supporting Information Table 3).
Figure 3.
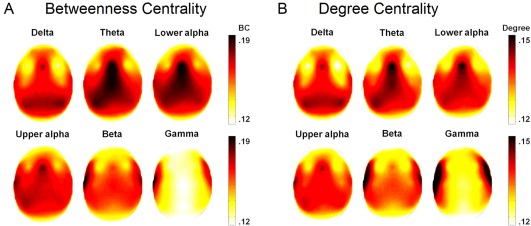
Scalp distribution of Betweenness Centrality (BC; Panel A) and Degree Centrality (DEG; Panel B), separately for each frequency band (top view). Color calibration is shown at the right of each figure. Note that regions with high BC usually also show high DEG values. [Color figure can be viewed at http://wileyonlinelibrary.com]
Table 3.
The effects (ANOVA results) of Node Location on the Betweenness Centrality and Degree Centrality MST network characteristics, separately for the different frequency bands
| BAND | F | df | P | η 2 | |
|---|---|---|---|---|---|
| Max BC | Delta | 21.225 | 14, 19 | *** | 0.133 |
| Theta | 21.663 | 14, 19 | *** | 0.136 | |
| Lower alpha | 23.043 | 14, 19 | *** | 0.143 | |
| Upper alpha | 15.741 | 14, 19 | *** | 0.111 | |
| Beta | 17.250 | 14, 19 | *** | 0.178 | |
| Gamma | 29.957 | 14, 19 | *** | 0.188 | |
| Max Deg | Delta | 21.337 | 14, 19 | *** | 0.134 |
| Theta | 21.462 | 14, 19 | *** | 0.135 | |
| Lower alpha | 21.073 | 14, 19 | *** | 0.132 | |
| Upper alpha | 14.518 | 14, 19 | *** | 0.095 | |
| Beta | 18.997 | 14, 19 | *** | 0.121 | |
| Gamma | 32.007 | 14, 19 | *** | 0.188 |
Relationship Between Network Characteristics and Medical/Biological Measures
Table 4 and Figure 4 summarize the significant results yielded by the linear regression models. For the delta band we found only one significant regression model, with GA explaining R 2 = 3% of the variance accounted for MaxBC. For the beta, and gamma bands no significant linear regression models were obtained.
Table 4.
Summary of the linear regression model results
| MaxDEG | MaxBC | LF | DIAM | TH | |
|---|---|---|---|---|---|
| Delta band | |||||
| β of Gestation age | −0.18* | ||||
| t, df of Gestation age | −2.10 (134) | ||||
| R 2 | 0.03 | ||||
| df, error, df of model | 1,133 | ||||
| F | 7.73* | ||||
| Theta band | |||||
| β of Gestation age | −0.24** | −0.22* | 0.21* | −0.23* | |
| t, df of Gestation age | −2.78 (132) | −2.46 (132) | 2.46 (132) | −2.68 (131) | |
| β of Mother's height | 0.19* | ||||
| t, df of Mother's height | 2.30 (131) | ||||
| R 2 | 0.06 | 0.05 | 0.04 | 0.08 | |
| df, error, df of model | 1,132 | 1,132 | 1,132 | 1,131 | |
| F | 7.73** | 6.74* | 6.07* | 5.75** | |
| Lower alpha band | |||||
| β of Gestation age | −0.22* | 0.18* | −0.19* | ||
| t, df of Gestation age | −2.63 (132) | 2.10 (134) | −2.26 (132) | ||
| R 2 | 0.05 | 0.03 | 0.04 | ||
| df, error, df of model | 1,132 | 1,133 | 1,132 | ||
| F | 6.90* | 4.39* | 5.10* | ||
| Upper alpha band | |||||
| β of Gestation age | −0.23** | −0.22* | −0.28*** | 0.33*** | −0.27** |
| t, df of Gestation age | −2.69 (132) | −2.59 (131) | −3.38 (132) | 3.94 (131) | −3.23 (132) |
| β of Mother's age | −0.19* | 0.02* | |||
| t, df of Mother's age | −2.21 (131) | 2.35 (131) | |||
| R 2 | 0.05 | 0.07 | 0.08 | 0.12 | 0.07 |
| df, error df of model | 1,132 | 1,131 | 1,132 | 1,132 | 1,132 |
| F | 10.42** | 5.01** | 11.45*** | 9.31*** | 10.42** |
Note. * P < 0.05, ** P < 0.01, *** P < 0.001. In the F row, the asterisks indicate the level of significance for the final regression model. In the β rows of the biomedical variables, the asterisks indicate the level of significance of the independent predictive power of the variable, separately.
Linear regression models for the theta (4.0–8.0 Hz) frequency band
In the theta frequency band, MaxDeg had R 2 = 6%, LF had R 2 = 5%, and DIAM had R 2 = 4% of the variance accounted for by Gestation Age length (GA). TH had R 2 = 8% of the variance explained by GA and Mother's height (MH). Thus, MST network characteristics in the theta band were mainly associated with GA.
Linear regression models for the lower alpha (8.0–10.0 Hz) frequency band
In the lower alpha frequency band, LF had R 2 = 5% and TH had R 2 = 4% of the variance accounted for by GA. DIAM had R 2 = 3% of the variance explained by GA. Thus, similarly to theta frequency band, MST network characteristics in the lower alpha band were mainly associated with GA.
Linear regression models for the upper alpha (10.0–13.0 Hz) frequency band
In the upper alpha frequency band, MaxDeg had R 2 = 5%, LF had R 2 = 8%, and TH had R 2 = 7% of the variance accounted for by GA. MaxBC had R 2 = 7% while DIAM had R 2 = 12% of the variance explained by GA and Mother's age (MA). Thus again, MST network characteristics in the upper alpha band were mainly associated with GA, while MA has also appeared in two models.
Overall, these results suggest that GA affects the properties of neonatal infant FC networks in the theta, lower and upper alpha bands (see Fig. 4). Collinearity measures showed no significant collinearity when two medical/biological variables appeared in the same model: tolerance, which is the percent of explained variance in independent variables not explained by other independent variables, was always greater than 1 − R 2, suggesting that our predictors were not redundant.
Post hoc linear correlation analysis was performed for testing whether the observed relationship between GA and some of the graph metrics of the delta, theta, lower and upper alpha band's networks could be explained by a relationship between the GA and (1) the average resting state connectivity strength, (2) the average MST network connectivity strength, and/or (3) the average spectral power. The descriptive statistics of these three measures and the correlations are shown separately for each frequency band in Supporting Information Table 4. No significant correlation was found between GA and either one of the three measures. Thus the relationship between some MST metrics and GA could not have been mediated by specral power or networks connectivity strength.
Correlations between the average resting state connectivity strength on one hand and the average MST network connectivity strength and the various MST metrics on the other hand have been also calculated. The descriptive statistics of these tree measures and the correlation values are reported separately for each frequency band in Supporting Information Table 5. The average resting state connectivity strength was found to be positively correlated with the nodal centrality MST metrics (MaxDeg; MaxBC) in all frequency bands. In addition, in the upper alpha band, significant correlation was observed between the average resting state connectivity strength and the MST network's DIAM and LF inidces: higher LF and lower DIAM were associated with stronger average connectivity. Thus some of the graph metrics are dependent on the global connectivity strength, but these effects are not related to the observed associations between the graph metrics and GA.
DISCUSSION
The aim of the present study was to characterize the topological organization of the human EEG‐based functional networks in a large sample of healthy full‐term neonates. By comparing the brain FC network topology with referential random networks, the presence of an early organization and hierarchical architecture has been demonstrated in all EEG frequency bands. The results also suggested that the FC networks of theta and alpha oscillations are characterized by a more optimal ratio between functionally segregated and integrated network topology than those appearing in the other frequency bands. We found that fronto‐central and parieto‐central sites appear to be the main hubs of these networks. Furthermore, some characteristics of the theta‐ and alpha‐band FC network topologies were found to be associated with gestational age. This suggests that individual differences in the functional network organization are related to the level of cortical maturity at birth. Results are discussed in detail in the following sections.
Topology of Functional Networks in Newborn Infants
FC networks extracted from the EEG of newborn infants in quiet sleep were compared with referential random networks (constructed by randomly rewiring graphs connections). In all studied EEG frequency bands (delta, theta, lower and higher alpha, beta and gamma), the empirically obtained FC networks exhibited significantly higher maximal degree (MAXDEG) and betweenness centrality (MAXBC), tree hierarchy (TH), and leaf fraction (LF) together with lower diameter (DIAM) relative to random networks. These results suggest that the organization of the neuronal activity follows a hierarchical pattern (high TH) composed of few layers of subnetworks and some densely connected nodes (high MAXBC and MAXDEG) with the majority of nodes serving as periphery within the network (high LF). Low path length promotes long‐range connections optimized for maximal processing speed, while high clustering supports a high level of local connectivity optimized for minimal wiring cost and resilience [Watts and Strogatz, 1998]. MST diameter positively correlates with the path length and with the clustering coefficients while the leaf fraction is negatively associated with path length and positively with clustering [Tewarie et al., 2015]. Random networks have low clustering and a short average path length while networks in a regular, lattice‐like configuration are characterized by high clustering and a long average path length [Bullmore and Sporns, 2009; Stam et al., 2014]. Finally, scale‐free networks with star‐like topology combine the lower path length compared with regular or random networks but lower clustering than regular. Scale‐free networks are characterized by the relative commonness of nodes with a degree that greatly exceeds the average [so‐called hub nodes; Barabási and Albert, 1999]. Our findings suggest that the neonatal FC networks show scale‐free network organizational principles, which are thus likely to be present from an early stage of the cortical connectome. It is important to note that regardless that the network size was smaller than what that was reported in studies on MST topology [i.e., Boersma et al., 2013; Tewarie et al., 2015], the observed values of most network characteristics are comparable in terms of its value range. In the study of Tewarie et al. [2015], changes of MST characteristics was tested for simulated regular and scale‐free networks that were gradually rewired to random networks. These simulated scale‐free networks possessed similar tree hierarchy (∼0.4), leaf fraction (0.6–0.7), and max BC (0.6) values to the current infant networks. Tewarie et al. reported that network size mainly affected the diameter and the degree MST characteristics, with higher values associated with smaller network size. The current results of the early architecture of the functional connectome is consistent with studies reporting small‐world modular topological properties in infants, children, and adults [Bassett and Bullmore, 2006; Bathelt et al., 2013; Boersma et al., 2011, 2013; Bullmore and Sporns, 2009; Fair et al., 2008; Hagmann et al., 2010; Omidvarnia et al., 2014; Otte et al., 2015; Power et al., 2010; Supekar et al., 2009; Tymofiyeva et al., 2013].
We also found that the topology of the FC networks obtained for the theta and alpha frequency bands characteristically differed from those of the other frequency bands suggesting the emergence of distinct FC networks already at birth. The networks in the theta and alpha bands displayed lower level of MaxBC, TH, and LF with higher DIAM relative to the gamma‐, beta‐, and delta‐band networks. The alpha and theta networks also exhibited high consistency over fronto‐ parietal connections across trials with higher percentage of short‐distance edges relative to the other frequency bands. These results indicate that theta‐ and alpha‐band FC networks are shifted toward the regular network topology with more ordered chain‐like configuration and higher level clustering. This topology favors the segregation of subnetworks. Therefore, these functional networks are better suited for local processes versus the networks working in the other bands. Concordant to our results, Omidvarnia et al. [2014] obtained evidence supporting a similar frequency‐specific network organization. Specifically, they found that for theta and alpha oscillations, the level of clustering in the precentral regions and general modularity were higher in full‐term relative to preterm newborns, suggesting developmental changes during late gestation at these frequency bands. Oscillations in different frequency bands are often linked to different physiological mechanisms: slower oscillations associated with variation in large‐scale excitability (probably through neuromodulation; Miller et al., 2009), while higher‐frequency oscillations were reported to correspond to local field potentials [Buzsáki and Draguhn, 2004]. It has been proposed that the emergence of discrete bands in infancy and childhood may reflect the maturation of distinct cortical generators producing the observed rhythms [Bollimunta et al., 2011] and the processes of synaptogenesis and pruning [Kurth et al., 2010; Tarokh et al., 2010, 2011; for review see Uhlhaas et al., 2009].
Topography of Functional Networks in Newborns
The observed high nodal centrality (MaxBC and MaxDEG) of the newborn brain networks indicates that most information is routed via a few central nodes. These hub nodes serve the integration of the functional networks. Midline frontal, central and posterior electrodes displayed the highest BC and DEG values in the lower frequency‐band (delta to low alpha) MSTs. Lateral temporal electrodes were most likely to serve as hubs in the MSTs for faster bands (beta and gamma bands) with the high‐alpha band BC and DEG showing an intermediate scalp distribution pattern. It is important to note that the spatial resolution of the present EEG recording was limited and there were no measurements from occipital sites, which may hamper the importance of the observed regions. However, clear spatial differences between hub nodes for low versus high frequency oscillations were seen, which are unlikely to have been produced by the limitations of the measurements. Analysis of MST graphs on a large sample of EEG data (N = 227) recorded from 5 to 7 years old children showed similar fronto‐parietal dominance of BC and DEG, and the connectivity strength further increased between these hub nodes during development [Boersma et al., 2013]. The hub regions observed here also overlap with both structural and functional hub regions as reported for the adult brain [Bullmore and Sporns, 2009; Hagmann et al., 2008; Hoff et al., 2013]. This suggests an early presence of connectivity hubs in the human brain. Our results are compatible with evidence about the topography of FC in pre‐ and full‐term newborns [Omidvarnia et al., 2014]. These authors showed that the anterior region exhibits the strongest clustering and DEG in the theta and low alpha frequency bands. The crucial role of hub nodes in development is supported by findings showing that frontal and parietal areas might be affected in neurodevelopmental disorders, such as autism [Courchesne and Pierce, 2005; Just et al., 2012] and attention deficit/hyperactivity disorder [Tomasi and Volkow, 2011 for reviews see Uhlhaas et al., 2009, 2010].
Developmental Changes of Functional Networks Topology
From the investigated variables of prenatal influences and general clinical risk factors, only gestation age was found to be consistently associated with the FC network characteristics, and only in the theta and alpha bands. The relationship between GA and FC network organization metrics was independent of effects of the spectral power or the average strength of connectivity. Thus, reorganization of functional connectivity may provide a sensitive biomarker during the last trimester of the prenatal life. Linear regression analysis showed that functional networks of more mature infants (longer prenatal development, as measured by GA) were less centralized (lower leaf number, MAXDEG, and MAXBC) and less hierarchical (longer DIAM) than of infants with shorter prenatal development. Larger diameter and lower leaf number both point to a more chainlike, elongated shape of the MSTs. In other words, more mature infants are ahead in terms of resting state network topology, having more decentralized network organization than infants with shorter prenatal development time. Thus, it appears that the human connectome is mainly star‐like during the late prenatal development. Possibly at about the time of birth, its functional specialization increases through improved effectiveness of information transfer between neighboring nodes. These connectivity changes may reflect intermediate cost‐efficient topology that optimizes communication without overloading central nodes by segregation of sub‐networks that subserve different functions and integration of areas involved in the same function. The observed early architecture of the functional connectome is consistent with recent studies showing a small‐world organization of the infant functional brain networks as derived from EEG recordings [Bassett and Bullmore, 2006; Bullmore and Sporns, 2009; Fair et al., 2008; Hagmann et al., 2008; Omidvarnia et al., 2014; Power et al., 2010; Supekar et al., 2009; Tymofiyeva et al., 2013]. In sum, the current findings suggest that developmental changes of FC occur as early as the third trimester of gestation (36–41 week). It is important to note that the observed relationship between gestation age and network topology was rather weak (explaining 5%–12% of the variance, only). Therefore, several other factors likely influence the organization of functional brain network at this early age.
The maturation of body systems of the human fetus including the brain's connectome genesis during the last trimester of gestation are regarded as a critical period of prenatal ontogenesis [see Fransson et al., 2007; Uhlhaas et al., 2010]. Myelination is one of the core developmental events in the late prenatal period by which maturation of the neuronal fibers in the neuronal feedback loops are realized and the signal transmission speed increases [Bollimunta et al., 2011; Cayre et al., 2009; Goldman et al., 1997]. Thus, one may hypothesize that structural and functional connectivity between regions develops similarly with the maturation of the neuronal fibers in these areas. Our speculation regarding the early development of FC network topology during this period may thus reflect, to some extent, anatomical maturation processes.
Previous cross‐sectional studies investigating the strength of cortical coupling in relation to prenatal development reported stronger FC in fronto‐central and temporal regions in the delta and theta bands [Dulce et al., 2007; González et al., 2011; Omidvarnia et al., 2014] in full‐term compared with preterm infants. Further, weaker coupling of the posterior areas in the delta band and lower intra‐hemispheric FC in the theta and alpha bands were observed in full‐term than in preterm neonates [Batuev et al., 2008]. However, the few existing longitudinal studies measuring FC topology in full term healthy newborns showed somewhat different associations with gestational age. For instance, alpha‐band FC was found to be weakening over time between frontal and parieto‐temporal electrode locations, while increases in fronto‐occipital FC strength was associated with low medical risk and optimal neurobehavioral measures [Duffy et al., 2003]. Consistently, a follow‐up study of preterm infants reported weakening functional coupling in the theta and delta bands with gestation age and postnatal maturation while more mature infants displayed stronger coupling at higher frequencies at occipital recording sites [Meijer et al., 2014]. These discrepancies between the findings of cross‐sectional and longitudinal studies could be explained by the assumption of Thatcher [Thatcher et al., 2008; Thatcher, 1992], who suggested that development in children is programmed in cycles with periods of increasing and decreasing coherence which have different on‐ and offsets in different regions. The current results are compatible with this hypothesis.
We speculate that the gradual decentralization of the neuronal networks with maturation may be related to the emergence of functional specialization of regions (such as the primary sensory cortical areas). This would appear in the EEG measures as a weakening of the strong FC connectivity of the most overloaded hub regions in the midline fronto‐posterior areas (indexed by decreasing BC and DEG) after prenatal development, in line with the previously observed weakening of both long‐range and local posterior connectivity [Batuev et al., 2008; Duffy et al., 2003; Meijer et al., 2014]. Pruning or elimination of some non‐optimal connections may underlie this developmental change. This idea also is compatible with the suggestion by Thatcher who argued that development involves local excessive production of synaptic connections followed by pruning of the unused connections [Thatcher et al., 2008; Thatcher, 1992].
LIMITATION AND FUTURE DIRECTIONS
The present study provided data describing the general characteristics and developmental changes in global network integrity of the neonatal brain. Nevertheless, some of the technical limitations should be stated. The present results are based on the topology of a subset of the strongest connections. This does not mean the other connections are not functional during resting‐state brain activity. We constructed the resting state graphs via the MST algorithm (which uses proportional thresholding to ensure fixed node density across networks). A recent study demonstrated that proportional thresholding may affect network characteristics (Van den Heuvel et al., 2017). These authors found that lower overall FC levels may lead to differences in network efficiency between the two thresholding procedures: compared with absolute thresholded networks, in proportional thresholded networks, there is a higher probability that some edges result from spurious connections, resulting in higher randomness of these networks. Indeed we have found significant effects of the average resting state connectivity strength on some graph metrics. However, because the average FC strength was not significantly correlated with GA, proportional thresholding did not systematically bias the observed associations between some graph metrics and GA.
Most studies assessing infant brain activity by electrophysiological means (including the current one) have limited spatial resolution and coverage due to practical limitations [Tokariev et al., 2015]. As a result, the networks consists of small number of nodes, which certainly limits the scope of inferences regarding the general topological characteristics of the networks in newborns. Similarly, lack of full coverage limits inferences about the topographical aspects of the networks. The length of analyzed EEG segments may limit the amount of variance of delta rhythm captured relative to higher frequency bands. Lower consistency of the scalp distribution of the delta‐band measures may be attributed to this fact. It has been reported that longer epoch length results generally in lower connectivity values [Fraschini et al., 2016; Van Diessen et al., 2015]. However, it has also been shown that MST parameters are relatively robust to (nearly unaffected by) epoch length changes [Fraschini et al., 2016]. Therefore, these measures are likely undistorted by the epoch length. Further, using a common reference may confound some phase‐related indices. However, the PLI measure works better than other coherence based measures in detecting reliable and robust phase coupling with the common reference derivation [Stam et al., 2007].
Neural network analysis may provide a functional biomarker for monitoring clinical conditions in newborn infants. Future studies may wish to validate the observed network architecture of newborns using non‐stationary multivariate signal processing, such as the generalized phase synchrony analysis [Omidvarnia et al., 2013]. Further longitudinal studies are needed to establish the relationship between early brain network organization and later neurocognitive development, while simultaneous fMRI and electrophysiological recording could potentially improve our understanding of the joint development of structural and functional connectivity of the infant brain.
Supporting information
Supporting Information Table 1.
Supporting Information Table 2.
Supporting Information Table 3.
Supporting Information Table 4.
Supporting Information Table 5.
ACKNOWLEDGMENTS
The authors declare no actual or potential conflict of interest. All authors have reviewed the contents of the submitted manuscript, approve of its contents and the accuracy of the data.
Footnotes
The Forward algorithm adds independent variables into the model as long as it significantly changes the value of explained variance. In the current analysis, other linear regression methods (Backward, Stepwise, etc.) yielded the same results. Therefore, we do not mention these alternatives.
REFERENCES
- Achard S, Salvador R, Whitcher B, Suckling J, Bullmore ED (2006): A resilient, low‐frequency, small‐world human brain functional network with highly connected association cortical hubs. J Neurosci 26:63–72. [16399673] [DOI] [PMC free article] [PubMed] [Google Scholar]
- Anders TF, Emde RN, Parmelee AH (1971): A Manual of Standardized Terminology, Techniques and Criteria for Scoring of States of Sleep and Wakefulness in Newborn Infants. Los Angeles, CA: UCLA Brain Information Service/BRI Publications Office, NINDS Neurological Information Network. [Google Scholar]
- Barabási AL, Albert R (1999): Emergence of scaling in random networks. Science 286:509–512. [DOI] [PubMed] [Google Scholar]
- Bassett DS, Bullmore ED (2006): Small‐world brain networks. Neuroscientist 12:512–523. [DOI] [PubMed] [Google Scholar]
- Bassett DS, Bullmore ET, Meyer‐Lindenberg A, Apud JA, Weinberger DR, Coppola R (2009): Cognitive fitness of cost‐efficient brain functional networks. Proc Natl Acad Sci U S A 106:11747–11752. [DOI] [PMC free article] [PubMed] [Google Scholar]
- Bathelt J, O'Reilly H, Clayden JD, Cross JH, de Haan M (2013): Functional brain network organisation of children between 2 and 5 years derived from reconstructed activity of cortical sources of high‐density EEG recordings. Neuroimage 82:595–604. [DOI] [PubMed] [Google Scholar]
- Batuev AS, Iovleva NN, Koshchavtsev AG (2008): Comparative analysis of the EEG in babies in the first month of life with gestation periods of 30–42 weeks. Neurosci Behav Physiol 38:621–626. [DOI] [PubMed] [Google Scholar]
- Boersma M, Smit DJ, de Bie H, Van Baal GCM, Boomsma DI, de Geus EJ, Delemarre‐van de Waal HA, Stam CJ (2011): Network analysis of resting state EEG in the developing young brain: Structure comes with maturation. Hum Brain Mapp 32:413–425. [DOI] [PMC free article] [PubMed] [Google Scholar]
- Boersma M, Smit DJ, Boomsma DI, De Geus EJ, Delemarre‐van de Waal HA, Stam CJ (2013): Growing trees in child brains: Graph theoretical analysis of electroencephalography‐derived minimum spanning tree in 5‐and 7‐year‐old children reflects brain maturation. Brain Connect 3:50–60. [DOI] [PubMed] [Google Scholar]
- Bollimunta A, Mo J, Schroeder CE, Ding M (2011): Neuronal mechanisms and attentional modulation of corticothalamic alpha oscillations. J Neurosci 31:4935–4943. [DOI] [PMC free article] [PubMed] [Google Scholar]
- Bullmore E, Sporns O (2009): Complex brain networks: Graph theoretical analysis of structural and functional systems. Nat Rev Neurosci 10:186–198. [DOI] [PubMed] [Google Scholar]
- Buzsáki G, Draguhn A (2004): Neuronal oscillations in cortical networks. Science 304:1926–1929. [DOI] [PubMed] [Google Scholar]
- Cayre M, Canoll P, Goldman JE (2009): Cell migration in the normal and pathological postnatal mammalian brain. Prog Neurobiol 88:41–63. [DOI] [PMC free article] [PubMed] [Google Scholar]
- Courchesne E, Pierce K (2005): Brain overgrowth in autism during a critical time in development: Implications for frontal pyramidal neuron and interneuron development and connectivity. Int J Dev Neurosci 23:153–170. [DOI] [PubMed] [Google Scholar]
- De Haan W, van der Flier WM, Koene T, Smits LL, Scheltens P, Stam CJ (2012): Disrupted modular brain dynamics reflect cognitive dysfunction in Alzheimer's disease. Neuroimage 59:3085–3093. [DOI] [PubMed] [Google Scholar]
- Delorme A, Makeig S (2004): EEGLAB: An open source toolbox for analysis of single‐trial EEG dynamics including independent component analysis. J Neurosci Methods 134:9–21. [DOI] [PubMed] [Google Scholar]
- Dulce M, Mañas S, Pereda E, Garrido J, López S, De Vera L, González JJ (2007): Maturational changes in the interdependencies between cortical brain areas of neonates during sleep. Cereb Cortex 17:583–590. [DOI] [PubMed] [Google Scholar]
- Duffy FH, Als H, McAnulty GB (2003): Infant EEG spectral coherence data during quiet sleep: Unrestricted principal components analysis—relation of factors to gestational age, medical risk, and neurobehavioral status. Clin EEG Neurosci 34:54–69. [DOI] [PubMed] [Google Scholar]
- Fair DA, Cohen AL, Dosenbach NU, Church JA, Miezin FM, Barch DM, Raichle ME, Petersen SE, Schlaggar BL (2008): The maturing architecture of the brain's default network. Proc Natl Acad Sci U S A 105:4028–4032. [DOI] [PMC free article] [PubMed] [Google Scholar]
- Ferreira LK, Busatto GF (2013): Resting‐state functional connectivity in normal brain aging. Neurosci Biobehav Rev 37:384–400. [DOI] [PubMed] [Google Scholar]
- Fransson P, Skiöld B, Horsch S, Nordell A, Blennow M, Lagercrantz H, Åden U (2007): Resting‐state networks in the infant brain. Proc Natl Acad Sci U S A 104:15531–15536. [DOI] [PMC free article] [PubMed] [Google Scholar]
- Fraschini M, Demuru M, Crobe A, Marrosu F, Stam CJ, Hillebrand A (2016): The effect of epoch length on estimated EEG functional connectivity and brain network organization. J Neural Eng 13:036015. [DOI] [PubMed] [Google Scholar]
- Gelman A, Hill J, Yajima M (2012): Why we (usually) don't have to worry about multiple comparisons. JREE 5:189–211. [Google Scholar]
- Goldman JE, Zerlin M, Newman S, Zhang L, Gensert J (1997): Fate determination and migration of progenitors in the postnatal mammalian CNS. Dev Neurosci 19:42–48. [DOI] [PubMed] [Google Scholar]
- González JJ, Mañas S, De Vera L, Méndez LD, López S, Garrido JM, Pereda E (2011): Assessment of electroencephalographic functional connectivity in term and preterm neonates. Clin Neurophysiol 122:696–702. [DOI] [PubMed] [Google Scholar]
- Greenhouse SW, Geisser S (1959): On methods in the analysis of profile data. Psychometrika 24:95–112. [Google Scholar]
- Grieve PG, Isler JR, Izraelit A, Peterson BS, Fifer WP, Myers MM, Stark RI (2008): EEG functional connectivity in term age extremely low birth weight infants. Clin Neurophysiol 119:2712–2720. [DOI] [PMC free article] [PubMed] [Google Scholar]
- Hagmann P, Cammoun L, Gigandet X, Meuli R, Honey CJ, Wedeen VJ, Sporns O (2008): Mapping the structural core of human cerebral cortex. PLoS Biol 6:e159. [DOI] [PMC free article] [PubMed] [Google Scholar]
- Hagmann P, Sporns O, Madan N, Cammoun L, Pienaar R, Wedeen VJ, Meuli R, Thiran JP, Grant PE (2010): White matter maturation reshapes structural connectivity in the late developing human brain. Proc Natl Acad Sci U S A 107:19067–19072. [DOI] [PMC free article] [PubMed] [Google Scholar]
- Hillebrand A, Barnes GR, Bosboom JL, Berendse HW, Stam CJ (2012): Frequency‐dependent functional connectivity within resting‐state networks: An atlas‐based MEG beamformer solution. Neuroimage 59:3909–3921. [DOI] [PMC free article] [PubMed] [Google Scholar]
- Hoff GAJ, Van den Heuvel MP, Benders MJ, Kersbergen KJ, De Vries LS (2013): On development of functional brain connectivity in the young brain. Front Hum Neurosci 7:1–7. [DOI] [PMC free article] [PubMed] [Google Scholar]
- Jennekens W, Niemarkt HJ, Engels M, Pasman JW, van Pul C, Andriessen P (2012): Topography of maturational changes in EEG burst spectral power of the preterm infant with a normal follow‐up at 2years of age. Clin Neurophysiol 123:2130–2138. [DOI] [PubMed] [Google Scholar]
- Just MA, Keller TA, Malave VL, Kana RK, Varma S (2012): Autism as a neural systems disorder: A theory of frontal‐posterior underconnectivity. Neurosci Biobehav Rev 36:1292–1313. [DOI] [PMC free article] [PubMed] [Google Scholar]
- Khazipov R, Luhmann HJ (2006): Early patterns of electrical activity in the developing cerebral cortex of humans and rodents. Tins 29:414–418. [DOI] [PubMed] [Google Scholar]
- Kruskal JB (1956): On the shortest spanning subtree of a graph and the traveling salesman problem. Proc Am Math Soc 7:48–50. [Google Scholar]
- Kurth S, Ringli M, Geiger A, LeBourgeois M, Jenni OG, Huber R (2010): Mapping of cortical activity in the first two decades of life: A high‐density sleep electroencephalogram study. J Neurosci 30:13211–13219. [DOI] [PMC free article] [PubMed] [Google Scholar]
- Martin A, Chao LL (2001): Semantic memory and the brain: Structure and processes. Curr Opin Neurobiol 11:194–201. [DOI] [PubMed] [Google Scholar]
- Meijer EJ, Hermans KHM, Zwanenburg A, Jennekens W, Niemarkt HJ, Cluitmans PJM, van Pul C, Wijn PFF, Andriessen P (2014): Functional connectivity in preterm infants derived from EEG coherence analysis. Eur J Paediatr Neurol 18:780–789. [DOI] [PubMed] [Google Scholar]
- Micheloyannis S, Pachou E, Stam CJ, Vourkas M, Erimaki S, Tsirka V (2006): Using graph theoretical analysis of multi channel EEG to evaluate the neural efficiency hypothesis. Neurosci Lett 402:273–277. [DOI] [PubMed] [Google Scholar]
- Miller KJ, Sorensen LB, Ojemann JG, den Nijs M (2009): Power‐law scaling in the brain surface electric potential. PLoS Comput Biol 5:e1000609. [DOI] [PMC free article] [PubMed] [Google Scholar]
- Myers MM, Grieve PG, Izraelit A, Fifer WP, Isler JR, Darnall RA, Stark RI (2012): Developmental profiles of infant EEG: Overlap with transient cortical circuits. Clin Neurophysiol 123:1502–1511. [DOI] [PMC free article] [PubMed] [Google Scholar]
- Newman MEJ, Girvan M (2004): Finding and evaluating community structure in networks. Phys Rev E Stat Nonlin Soft Matter Phys 69:026113. [DOI] [PubMed] [Google Scholar]
- Omidvarnia A, Azemi G, Colditz PB, Boashash B (2013): A time–frequency based approach for generalized phase synchrony assessment in nonstationary multivariate signals. Digital Signal Process 23:780–790. [Google Scholar]
- Omidvarnia A, Fransson P, Metsäranta M, Vanhatalo S (2014): Functional bimodality in the brain networks of preterm and term human newborns. Cereb Cortex 24:2657–2668. [DOI] [PubMed] [Google Scholar]
- Otte WM, van Diessen E, Paul S, Ramaswamy R, Subramanyam Rallabandi VP, Stam CJ, Roy PK (2015): Aging alterations in whole‐brain networks during adulthood mapped with the minimum spanning tree indices: The interplay of density, connectivity cost and life‐time trajectory. Neuroimage 1:171–189. [DOI] [PubMed] [Google Scholar]
- Pearson K (1895): Contributions to the mathematical theory of evolution. II. Skew variation in homogeneous material. Philos Trans R Soc Lond A 10:343–414. [Google Scholar]
- Pereda E, de La Cruz DM, Manas S, Garrido JM, López S, González JJ (2006): Topography of EEG complexity in human neonates: Effect of the postmenstrual age and the sleep state. Neurosci Lett 394:152–157. [DOI] [PubMed] [Google Scholar]
- Power JD, Fair DA, Schlaggar BL, Petersen SE (2010): The development of human functional brain networks. Neuron 7:735–748. [DOI] [PMC free article] [PubMed] [Google Scholar]
- Prechtl HF (1974): The behavioural states of the newborn infant (a review). Brain Res 76:185–212. [DOI] [PubMed] [Google Scholar]
- Schumacher EM, Stiris TA, Larsson PG (2015): Effective connectivity in long‐term EEG monitoring in preterm infants. Clin Neurophysiol 126:2261–2268. [DOI] [PubMed] [Google Scholar]
- Smit DJ, Boersma M, Schnack HG, Micheloyannis S, Boomsma DI, Hulshoff Pol HE, Stam CJ, de Geus EJ (2012): The brain matures with stronger functional connectivity and decreased randomness of its network. PloS ONE 7:e36896. [DOI] [PMC free article] [PubMed] [Google Scholar]
- Stam CJ (2014): Modern network science of neurological disorders. Nat Rev Neurosci 15:683–695. [DOI] [PubMed] [Google Scholar]
- Stam CV, Van Straaten ECW (2012): The organization of physiological brain networks. Clin Neurophysiol 123:1067–1087. [DOI] [PubMed] [Google Scholar]
- Stam CJ, Nolte G, Daffertshofer A (2007): Phase lag index: Assessment of functional connectivity from multi channel EEG and MEG with diminished bias from common sources. Hum Brain Mapp 28:1178–1193. [DOI] [PMC free article] [PubMed] [Google Scholar]
- Stam CJ, Tewarie P, Van Dellen E, Van Straaten ECW, Hillebrand A, Van Mieghem P (2014): The trees and the forest: Characterization of complex brain networks with minimum spanning trees. Int J Psychophysiol 92:129–138. [DOI] [PubMed] [Google Scholar]
- Supekar K, Musen M, Menon V (2009): Development of large‐scale functional brain networks in children. PLoS Biol 7:e1000157. [DOI] [PMC free article] [PubMed] [Google Scholar]
- Tarokh L, Carskadon MA, Achermann P (2010): Developmental changes in brain connectivity assessed using the sleep EEG. Neuroscience 171:622–634. [DOI] [PMC free article] [PubMed] [Google Scholar]
- Tarokh L, Van Reen E, LeBourgeois M, Seifer R, Carskadon MA (2011): Sleep EEG provides evidence that cortical changes persist into late adolescence. Sleep 34:1385–1393 [DOI] [PMC free article] [PubMed] [Google Scholar]
- Thatcher RW (1992): Cyclic cortical reorganization during early childhood. Brain Cogn 20:24–50. [DOI] [PubMed] [Google Scholar]
- Thatcher RW, North DM, Biver CJ (2008): Development of cortical connections as measured by EEG coherence and phase delays. Hum Brain Mapp 29:1400–1415. [DOI] [PMC free article] [PubMed] [Google Scholar]
- Tewarie P, Van Dellen E, Hillebrand A, Stam CJ (2015): The minimum spanning tree: An unbiased method for brain network analysis. Neuroimage 104:177–188. [DOI] [PubMed] [Google Scholar]
- Tokariev A, Videman M, Palva JM, Vanhatalo S (2015): Functional brain connectivity develops rapidly around term age and changes between vigilance states in the human newborn. Cereb Cortex 26:4540–4550. [DOI] [PubMed] [Google Scholar]
- Tomasi D, Volkow ND (2011): Functional connectivity hubs in the human brain. Neuroimage 57:908–917. [DOI] [PMC free article] [PubMed] [Google Scholar]
- Tymofiyeva O, Hess CP, Ziv E, Lee PN, Glass HC, Ferriero DM, Barkovich AJ, Xu D (2013): A DTI‐based template‐free cortical connectome study of brain maturation. PloS ONE 8:e63310. [DOI] [PMC free article] [PubMed] [Google Scholar]
- Uhlhaas PJ, Roux F, Singer W, Haenschel C, Sireteanu R, Rodriguez E (2009): The development of neural synchrony reflects late maturation and restructuring of functional networks in humans. Proc Natl Acad Sci U S A 106:9866–9871. [DOI] [PMC free article] [PubMed] [Google Scholar]
- Uhlhaas PJ, Roux F, Rodriguez E, Rotarska‐Jagiela A, Singer W (2010): Neural synchrony and the development of cortical networks. Trends Cogn Sci (Regul Ed) 14:72–80. [DOI] [PubMed] [Google Scholar]
- Van Diessen E, Numan T, Van Dellen E, Van Der Kooi AW, Boersma M, Hofman D, Stam CJ (2015): Opportunities and methodological challenges in EEG and MEG resting state functional brain network research. Clin Neurophysiol 126:1468–1481. [DOI] [PubMed] [Google Scholar]
- Van den Heuvel MP, Pol HEH (2010): Exploring the brain network: A review on resting‐state fMRI functional connectivity. Eur Neuropsychopharmacol 20:519–534. [DOI] [PubMed] [Google Scholar]
- Van den Heuvel MP, Stam CJ, Kahn RS, Pol HEH (2009): Efficiency of functional brain networks and intellectual performance. J Neurosci 29:7619–7624. [DOI] [PMC free article] [PubMed] [Google Scholar]
- Van den Heuvel MP, de Lange SC, Zalesky A, Seguin C, Yeo BTT, Schmidt R (2017): Proportional thresholding in resting‐state fMRI functional connectivity networks and consequences for patient‐control connectome studies: Issues and recommendations. Neuroimage 152:437–449. [DOI] [PubMed] [Google Scholar]
- Varela F, Lachaux JP, Rodriguez E, Martinerie J (2001): The brainweb: Phase synchronization and large‐scale integration. Nat Rev Neurosci 2:229–239. [DOI] [PubMed] [Google Scholar]
- Watts DJ, Strogatz SH (1998): Collective dynamics of ‘small‐world'networks. Nature 393:440–442. [DOI] [PubMed] [Google Scholar]
Associated Data
This section collects any data citations, data availability statements, or supplementary materials included in this article.
Supplementary Materials
Supporting Information Table 1.
Supporting Information Table 2.
Supporting Information Table 3.
Supporting Information Table 4.
Supporting Information Table 5.