

Abstract
Conditioned pain modulation (CPM) is a powerful endogenous analgesic mechanism which can completely inhibit incoming nociceptor signals at the primary synapse. The circuitry responsible for CPM lies within the brainstem and involves the subnucleus reticularis dorsalis (SRD). While the brainstem is critical for CPM, the cortex can significantly modulate its expression, likely via the brainstem circuitry critical for CPM. Since higher cortical regions such as the anterior, mid‐cingulate, and dorsolateral prefrontal cortices are activated by noxious stimuli and show reduced activations during other analgesic responses, we hypothesized that these regions would display reduced responses during CPM analgesia. Furthermore, we hypothesized that functional connectivity strength between these cortical regions and the SRD would be stronger in those that express CPM analgesia compared with those that do not. We used functional magnetic resonance imaging to determine sites recruited during CPM expression and their influence on the SRD. A lack of CPM analgesia was associated with greater signal intensity increases during each test stimulus in the presence of the conditioning stimulus compared to test stimuli alone in the mid‐cingulate and dorsolateral prefrontal cortices and increased functional connectivity with the SRD. In contrast, those subjects exhibiting CPM analgesia showed no change in the magnitude of signal intensity increases in these cortical regions or strength of functional connectivity with the SRD. These data suggest that during multiple or widespread painful stimuli, engagement of the prefrontal and cingulate cortices prevents the generation of CPM analgesia, raising the possibility altered responsiveness in these cortical regions underlie the reduced CPM observed in individuals with chronic pain. Hum Brain Mapp 37:2630–2644, 2016. © 2016 Wiley Periodicals, Inc.
Keywords: diffuse noxious inhibitory control, endogenous analgesia, subnucleus reticularis dorsalis, dorsolateral prefrontal cortex, cingulate cortex
INTRODUCTION
The endogenous analgesic mechanism known as conditioned pain modulation (CPM) has gained considerable attention, primarily due to reports that reduced CPM is associated with increased postoperative pain [Yarnitsky, 2010], the presence of persistent pain conditions [Julien et al., 2005; King et al., 2009; Nahman‐Averbuch et al., 2011], and the effectiveness of analgesic medications [Yarnitsky et al., 2012]. It is thought that CPM is a similar analgesic process to that described in experimental animals as diffuse noxious inhibitory control (DNIC). This analgesic mechanism is extremely powerful as it has been shown to be capable of completely inhibiting incoming nociceptor signals at the primary afferent synapse [Le Bars et al., 1979].
Experimental animal investigations have shown that the circuitry responsible for DNIC lies within the brainstem [Le Bars et al., 1979] and, in humans, CPM is absent in patients with complete spinal cord transection [Roby‐Brami et al., 1987] and lateral medullary lesions [De Broucker et al., 1990]. Using functional magnetic resonance imaging (fMRI), we recently found that, in addition to a decrease in activity within the medullary dorsal horn, CPM was associated with decreased activity in the region of the subnucleus reticularis dorsalis (SRD) and the dorsolateral pons in the region of the parabrachial nucleus [Youssef et al., 2015]. These sites are similar to those previously reported to be critical for the expression of DNIC in experimental animals [Le Bars et al., 1979].
Although the brainstem contains the neural circuitry critical for CPM expression, CPM can be modulated by higher brain centers as it is significantly influenced by an individual's trait anxiety, pain catastrophizing or even analgesic expectation and is reduced in individuals with chronic pain [Brock et al., 2012; Edwards et al., 2003; Goffaux et al., 2007; Goodin et al., 2009; Julien et al., 2005; King et al., 2009; Vidor et al., 2014; Weissman‐Fogel et al., 2008; Yarnitsky et al., 2012]. Furthermore, CPM efficiency is variable in healthy, pain‐free individuals with accounts that only approximately half of healthy, pain‐free individuals display CPM analgesia and individual differences in the subjective experience of pain may result from underlying differences in cortical influences of endogenous analgesic mechanisms such as CPM [Coghill and Eisenach, 2003; Edwards et al., 2003; Youssef et al., 2015]. Indeed, it was recently shown that the strength of signal coupling between regions of the cortex and brainstem were associated with individual differences in pain processing [Cheng et al., 2015; Ossipov et al., 2010], which suggests that differences in signal coupling between the cortex and brainstem regions critical for CPM expression are also important for CPM expression.
Although previous studies have reported CPM‐related activity changes in regions such as the cingulate and prefrontal cortices, they did not investigate differences in brain activation patterns in those that did compared to those that did not express CPM analgesia; furthermore, they did not assess the influence of these cortical regions on brainstem sites responsible for CPM such as the SRD [Bogdanov et al., 2015; Piche et al., 2009; Sprenger et al., 2011]. This is important if we are to understand why some individuals display CPM analgesia and others do not and whether an alteration in brain circuitry predisposes an individual to developing chronic pain following injury. The aim of this investigation was to use fMRI to determine if CPM responsiveness is associated with differential brain activation patterns in healthy individuals. We extend our previous analysis of brainstem sites responsible for CPM by exploring the role of sites above the brainstem in CPM expression. Furthermore, to assess the influence of these higher centers on the brainstem circuitry responsible for CPM such as the SRD, we will assess the strength of signal coupling, i.e., functional connectivity, between higher centers and the SRD and its relationship with CPM expression. We hypothesize that CPM analgesia will be associated with reduced activation of the somatosensory cortex and increased activation in the cingulate and prefrontal cortices, in addition to altered signal coupling strength between the cingulate and prefrontal cortices and the SRD.
MATERIALS AND METHODS
Subjects
Fifty‐four pain‐free subjects (22 males, 32 females; mean [±SEM] age: 23.1 ± 0.6 years, range 18–44 years) were recruited for the study. Informed written consent was obtained for all procedures, which were conducted under the approval by local Institutional Human Research Ethics Committees and satisfied the Declaration of Helsinki.
MRI Scans and Psychophysics
Prior to entering the MRI scanner, a 3 × 3 cm MRI‐compatible Peltier‐element thermode (Medoc) was placed on the right side of the mouth covering the upper and lower lips. Care was taken to secure the thermode in the same location in each individual subject and to ensure it did not cross the midline. The thermode was then secured in place with a velcro strap and foam padding. To determine a temperature that evoked moderate pain ratings in each individual, the thermode temperature was raised with a Thermal Sensory Analyser (TSA‐II, Medoc) from a resting temperature of 32°C to various temperatures at 0.5°C intervals between 44 and 49°C. Temperatures were randomly applied in 15 s intervals for 10 s, during which each subject rated the pain intensity using a Computerised Visual Analogue Scale (CoVAS, Medoc). The temperature which generated a pain intensity rating of approximately 6 out of 10 (0 = no pain, 10 = worse imaginable pain) was used for the remainder of the experiment.
Each subject was then positioned supine onto the MRI scanner bed and placed into a 3 T MRI scanner (Achieva, Philips Medical Systems, The Netherlands), the head immobilized in a 32‐channel head coil to which padding was added to prevent head movement. A fine, stainless‐steel butterfly cannula (23 G), connected via a 10 cm tube to a 1 ml syringe filled with sterile hypertonic (5%) saline, was placed ∼1 cm into the rostral belly of the tibialis anterior muscle of the right leg. Two series of 140 gradient echo echo‐planar image sets with blood oxygen level‐dependent (BOLD) contrast were then collected. Each image volume covered the entire brain, extending caudally to include the upper cervical spinal cord (38 axial slices, repetition time = 2500 ms, raw voxel size = 1.5 × 1.5 × 4.0 mm thick). During the first functional MRI (fMRI) series, following a 30 volume baseline period, 8 painful thermal stimuli (test stimuli) were delivered (Fig. 1A). Each painful stimulus was delivered for 15 s (including ramp up and down periods of 2.5 s each), followed by a 6 volume baseline (32°C) period. During each period of painful stimulation, the subject was asked to rate the pain intensity online using the CoVAS. During the second fMRI series, an identical stimulus paradigm was performed. However, following the fourth painful stimulus, a bolus injection of 1 ml of hypertonic (5%) saline was made into the right tibialis anterior muscle (conditioning stimulus) (Fig. 1B). The subject was not informed as to when the painful stimulus to the leg would be delivered and was instructed to continue to rate the thermal stimulus on the lip and not the stimulus in the leg. A T1‐weighted anatomical image was then collected (288 axial slices, repetition time = 5600 ms, raw voxel size = 0.87 × 0.87 × 0.87 mm thick).
Figure 1.
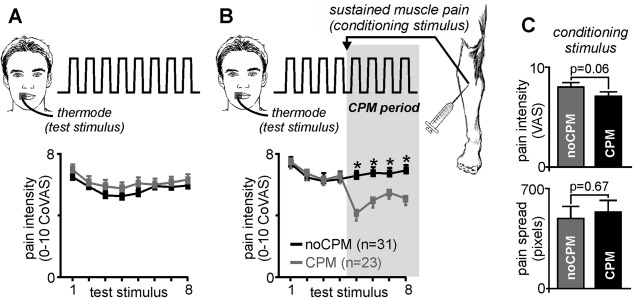
Participants undertook two experimental paradigms. (A) Paradigm 1 consisted of 8 painful heat stimuli (test stimuli) applied to the right lip during which each participant rated the pain intensity on a Computerised Visual Analog Scale (CoVAS), where 0 = no pain and 10 = most pain imaginable. The mean (±SEM) pain intensity ratings for each of the 8 test stimuli are shown for those subjects subsequently categorized as displaying a conditioned pain modulation (CPM) response (grey shading) and those not showing a CPM response (noCPM; black shading). It is clear that all 54 subjects consistently rated the pain intensity during these 8 painful stimuli at approximately 6 out of 10. (B) Paradigm 2 also comprised 8 test stimuli; however, between test stimuli 4 and 5, a bolus of hypertonic saline was injected into the tibialis anterior muscle, producing sustained muscle pain (conditioning stimulus). This period of test and conditioning stimuli is the CPM period (grey shaded region). In 23 of the 54 subjects, the conditioning stimulus resulted in a significant reduction in pain intensity of the test stimuli (CPM subjects; grey shading), whereas in the remaining 31 subjects, the conditioning stimulus had no effect on the pain intensity of the test heat stimuli (noCPM; black shading)(*p < 0.05). (C) Plots of mean (±SEM) pain intensity and pain spread of the conditioning stimulus in CPM and noCPM groups. Note that there is no difference in the conditioning pain stimulus parameters in the CPM compared with noCPM groups.
At the completion of the MRI scanning session, each subject was asked to rate the intensity of the conditioning painful stimulus, draw the distribution of pain on a standard drawing of the leg, and complete a McGill pain questionnaire. In addition, immediately following the MRI session, each subject completed a pain catastrophizing questionnaire [Sullivan et al., 1995] and the fear of pain questionnaire [McNeil and Rainwater, 1998]. Using the two‐standard deviation band method [Nourbakhsh and Ottenbacher, 1994], subjects were placed into either a CPM or noCPM group based on their analgesic response during the second fMRI scan. For each subject, the mean and standard deviation pain intensity ratings of the first four test stimuli were calculated. The mean of test stimuli 5 and 6 (during the conditioned pain stimulus period) were then averaged and if this value was more than 2 standard deviations lower than the mean of the first four test stimuli, the subject was placed into the CPM group (n = 23). The remaining 31 subjects were placed into the noCPM group. For each subject, CPM ability was then determined by calculating the mean percentage change in pain intensity rating during the test stimuli in the presence of the conditioning stimulus with the mean of the first four test stimuli alone. Significant differences in age, pain catastrophizing, and fear of pain between CPM and noCPM subjects were determined (two‐sample, two‐tailed t‐test, p < 0.05), gender, and CPM ability (chi‐squared test, p < 0.05) and the linear relationship between CPM ability and these variables, as well as age, were also determined (p < 0.05).
MRI Scan Analysis
Using SPM12 [Friston et al., 1994] and custom software, fMRI images were realigned, linearly detrended to remove global signal intensity changes and then coregistered to the same subjects' T1‐weighted anatomical image set. The T1‐weighted image set was then spatially normalized to the Montreal Neurological Institute (MNI) template and the normalization parameters then applied to the fMRI images. In addition, the normalized T1‐weighted anatomical image sets were segmented into grey matter only images and averaged to create a “grey‐matter mask” which was subsequently used to limit the fMRI analysis to grey matter regions only. The fMRI images were then spatially smoothed using a 6 mm full‐width at half‐maximum (FWHM) Gaussian filter and finally temporally smoothed using a 5 s FWHM Gaussian filter. Significant changes in signal intensity were determined using a repeated box‐car model convolved with a canonical hemodynamic response function and time dispersions. In each subject, their 6 direction movement parameters obtained during the realignment step were included as nuisance variables. In addition, to remove any effects of cerebrospinal fluid movement, signal intensity changes derived from a 2 mm sphere placed in the lateral ventricle was also included as a nuisance variable.
Four separate random effects, second level analyses were then performed. For all second level analyses, a grey matter mask derived from a mean fMRI image set was applied so that only signal intensity changes within grey matter above the level of the brainstem were explored. First, signal intensity changes evoked by the 8 test stimuli applied during the first fMRI scan were determined in all 54 subjects (p < 0.05, false discovery rate corrected for multiple comparisons). Second, signal intensity changes evoked by the conditioning stimulus applied during the second fMRI scan were determined in all 54 subjects (p < 0.05, false discovery rate corrected for multiple comparisons). Third, the effects of CPM on brain activity were determined by comparing signal intensity changes during the four test stimuli in the presence of the conditioning stimulus in the CPM and noCPM groups (p < 0.05, false discovery rate corrected for multiple comparisons). To explore the patterns of signal intensity change differences between CPM and noCPM subjects, for each significant cluster, the percentage change in signal intensity was extracted by comparing the signal intensity of the 25 baseline volumes immediately prior to the first test stimulus with the mean signal intensity during the four volumes during each of the 8 test stimuli. Significant differences in signal intensity change between CPM and noCPM subjects were determined for each test stimulus (p < 0.05, two‐sample, two‐tailed t‐test). Fourth, to compare our data with previous reports that have explored CPM circuitry by executing correlation analyses, we also determined the relationship between individual subjects' CPM ability and signal intensity changes during the four test stimuli in the presence of the conditioning stimulus. Following an initial uncorrected threshold of p < 0.001, we applied small volume correction (p < 0.05) to reduce the likelihood of Type II errors. The volumes of interest used to perform these small volume corrections were clusters derived from our initial analysis comparing the effects of CPM on brain activity as well as from medial prefrontal and orbitofrontal clusters derived from the AAL atlas [Tzourio‐Mazoyer et al., 2002] since previous investigations have shown CPM‐related activity changes in these regions [Bogdanov et al., 2015; Davis, 2013]. In addition, the overlap between the results of this correlation analysis and the effects of CPM on brain activity were determined, i.e., brain regions that were different in CPM subjects compared to noCPM subjects and whose activity was significantly correlated to CPM ability. Parameter estimates indicating extent of signal change during the test and conditioning period were then extracted for each of these overlapping regions, plotted against CPM ability and statistical significance determined (p < 0.05, Bonferroni corrected for multiple comparisons).
Finally, we performed functional connectivity analysis between the region of the subnucleus reticularis dorsalis (SRD), which we have previously shown to display differential responses in CPM subjects compared with noCPM subjects, and all other voxels above the brainstem [Youssef et al., 2015]. In this previous investigation, we assessed CPM‐related signal intensity changes within the brainstem in the same subjects as those used for this investigation. Using the realigned, linearly detrended and coregistered whole‐brain fMRI image sets, we isolated just the brainstem from each subject's whole‐brain images using brainstem‐specific isolation software (SUIT toolbox). These brainstem‐only image sets were then spatially normalized to a brainstem‐specific template in MNI space, temporally filtered to reduce the effects of noise and movement and CSF signal intensity added as nuisance variables. To maintain anatomical accuracy, we did not spatially smooth these brainstem‐only image sets. To explore functional connectivity between the SRD within the brainstem and areas above the brainstem, we first extracted the signal intensity changes from the SRD in each subject from our brainstem‐only image sets. Then, using the whole‐brain fMRI images sets, we placed these SRD signal intensity changes into a first level analysis and performed a voxel‐by‐voxel analysis to determine brain regions above the brainstem that displayed significant signal intensity covariations with the SRD during the second first four test stimuli and also during the four test stimuli in the presence of the conditioning stimulus. Using a second level, random effects procedure, significant differences in connectivity strength between CPM and noCPM subjects during the test stimuli in the presence of the conditioning stimulus were determined. Following an initial uncorrected threshold of p < 0.001, we applied small volume correction (p < 0.05) using clusters derived from our initial analysis comparing the effects of CPM on brain activity, to reduce the likelihood of Type II errors. For the resulting significant clusters, in each subject, the parameter estimate values indicating connectivity strength were extracted during the first four test stimuli and during the four test stimuli in the presence of the conditioning stimulus. Differences in connectivity were determined within the CPM and noCPM groups during the test period compared with the test/conditioning period (p < 0.05, paired, two‐tailed t‐test) and between CPM and noCPM groups as well (p < 0.05, two‐group t‐test).
RESULTS
Psychophysics
During the initial fMRI scan, the 8 brief painful heat stimuli (test stimuli) evoked similar pain intensity ratings in all 54 subjects (Fig. 1A). In contrast, during the second fMRI scan, 23 subjects displayed a significant analgesic response during the CPM period (CPM subjects; mean [±SEM] change in pain intensity: −29.0 ± 2.9%), whereas the remaining 31 subjects did not show a significant analgesic response (noCPM subjects: change in pain intensity: 3.7 ± 3.2%) (Fig. 1B). There were no significant differences in thermode temperatures of the test stimuli, or in perceived intensity or spread of the conditioning stimulus between CPM and noCPM groups (test stimuli temperature: noCPM: 47.7 ± 0.2, CPM: 47.4 ± 0.2°C; conditioning pain intensity: noCPM: 7.1 ± 0.3, CPM: 7.9 ± 0.4 VAS; conditioning pain spread: noCPM: 541 ± 77, CPM: 492 ± 81 pixels; p > 0.05) (Fig. 1C). Furthermore, there was no significant difference in CPM responsiveness between males and females (mean [±SEM] change in pain intensity: females: −8.4 ± 5.1%, males: −10.3 ± 6.1%, p > 0.05) or in the proportion of males and females categorized as CPM or noCPM (noCPM: 55% of males, 59% of females; CPM: 45% of males; 41% of females, p > 0.05). There were also no significant differences between CPM and noCPM groups with respect to pain catastrophizing scores (mean [±SEM]: noCPM: 14.8 ± 1.8, CPM: 15.8 ± 2.0; p > 0.05) or fear of pain scores (mean [±SEM]: noCPM: 71.7 ± 3.2, CPM: 79.6 ± 4.0; p > 0.05). Finally, there was no significant linear relationship between CPM ability and age (r = −0.10, p = 0.47), pain catastrophizing (R = −0.21, p = 0.12) or fear of pain (R = −0.18, p = 0.18).
Signal Intensity Changes
In all subjects, during the initial fMRI scan, 8 painful test stimuli applied to the right side of the mouth evoked signal intensity changes in a number of brain regions (Fig. 2A and Table 1). Signal intensity increased bilaterally in the primary somatosensory cortices (S1) in the region representing the face, bilaterally in the secondary somatosensory (S2) cortices, primary motor cortices (M1), insular cortex, mid‐cingulate cortex (MCC) spreading into the supplementary motor cortex, dorsolateral prefrontal cortex (dlPFC), parietal association cortices, and cerebellar cortex. Significant signal decreases occurred bilaterally in the posterior cingulate cortex (PCC) and medial prefrontal cortex (mPFC). Similarly, during the conditioning stimulus, signal intensity increased bilaterally in S1, in the region representing the leg, S2, M1, insular cortex, MCC spreading into the supplementary motor cortex, dlPFC, precuneus, parietal association cortices, and cerebellar cortex (Fig. 2B and Table 2). In contrast to the test stimuli alone, the conditioning stimulus did not evoke signal intensity decreases in the mPFC or PCC.
Figure 2.
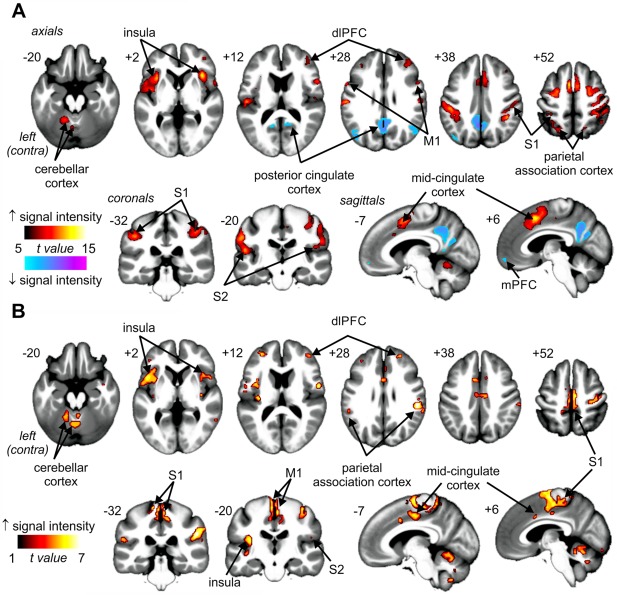
(A) Signal intensity increases (hot color scale) and decreases (cool color scale) during 8 brief painful thermal stimuli (test stimuli) applied to the right side of the mouth in 54 subjects. (B) Signal intensity increases (hot color scale) during a pain evoked by a bolus injection of hypertonic saline (5%) into the right tibialis anterior muscle in 54 subjects. Significant clusters are overlaid onto a mean T1‐weighted anatomical image set created from all 54 subjects. The left side of the image is the side contralateral to the noxious stimuli. Slice locations in Montreal Neurological Institute space are indicated at the upper left of each slice. dlPFC: dorsolateral prefrontal cortex; mPFC: medial prefrontal cortex; M1: primary motor cortex; S1: primary somatosensory cortex; S2: secondary somatosensory cortex. [Color figure can be viewed in the online issue, which is available at http://wileyonlinelibrary.com.]
Table 1.
Location of significant signal intensity changes in all individuals during painful heat applied to the skin of the right side of the mouth (locations are in Montreal Neurological Institute space)
| Signal intensity increases | X | Y | Z | t value | Cluster size |
|---|---|---|---|---|---|
| Primary somatosensory cortex | |||||
| Left | −56 | −20 | 30 | 11.33 | 57 |
| Right | 56 | −20 | 24 | 9.58 | 57 |
| Secondary somatosensory cortex | |||||
| Left | −50 | −20 | 12 | 11.21 | 43 |
| Right | 46 | −22 | 18 | 8.92 | 16 |
| Primary motor cortex | |||||
| Left | −56 | 6 | 26 | 9.64 | 28 |
| Right | 56 | 10 | 18 | 9.75 | 22 |
| Insula | |||||
| Left | −32 | 16 | 4 | 12.14 | 35 |
| −42 | −2 | 2 | 10.51 | 28 | |
| Right | 36 | 20 | 4 | 13.28 | 55 |
| Mid‐cingulate cortex/supplementary motor area | |||||
| Left | −2 | 10 | 48 | 13.94 | 124 |
| −8 | 20 | 30 | 7.90 | 14 | |
| Right | 6 | −12 | 46 | 13.29 | 118 |
| 8 | 20 | 34 | 9.12 | 6 | |
| Dorsolateral prefrontal cortex | |||||
| Left | −34 | 34 | 26 | 7.61 | 14 |
| Right | 42 | 46 | 6 | 8.66 | 21 |
| 34 | 36 | 24 | 9.07 | 51 | |
| Parietal association cortex | |||||
| Left | −46 | −30 | 40 | 11.57 | 45 |
| Right | 42 | −44 | 40 | 11.21 | 116 |
| Cerebellar cortex | |||||
| Left | −32 | −52 | −32 | 11.96 | 30 |
| Right | 14 | −62 | −48 | 6.07 | 21 |
| Signal intensity decreases | |||||
| Posterior cingulate cortex | |||||
| Left | −2 | −56 | 34 | 11.38 | 34 |
| Right | 2 | −58 | 34 | 10.90 | 18 |
| Medial prefrontal cortex | |||||
| Left | −2 | 54 | −16 | 8.15 | 10 |
| Right | 6 | 56 | −14 | 7.77 | 11 |
Table 2.
Location of significant signal intensity changes in all individuals during painful conditioning stimulus applied to the right lower leg (locations are in Montreal Neurological Institute space)
| Signal intensity increases | X | Y | Z | t value | Cluster size |
|---|---|---|---|---|---|
| Primary somatosensory cortex | |||||
| Left | −12 | −32 | 64 | 6.58 | 43 |
| −4 | −32 | 64 | 6.49 | 23 | |
| Right | 2 | −26 | 66 | 6.61 | 21 |
| Secondary somatosensory cortex | |||||
| Left | −54 | −30 | 20 | 5.37 | 11 |
| Right | 50 | −26 | 20 | 8.15 | 34 |
| Primary motor cortex | |||||
| Left | −6 | −12 | 68 | 7.45 | 26 |
| Right | 6 | −12 | 62 | 6.98 | 36 |
| Insula | |||||
| Left | −38 | 6 | 10 | 7.36 | 35 |
| −34 | −20 | 16 | 6.44 | 10 | |
| Right | 36 | 10 | −6 | 5.50 | 31 |
| Mid‐cingulate cortex/supplementary motor area | |||||
| Left | −2 | −12 | 44 | 6.89 | 33 |
| −6 | 8 | 38 | 5.46 | 13 | |
| Right | 4 | −16 | 50 | 6.73 | 50 |
| 4 | 10 | 30 | 5.38 | 16 | |
| Precuneus | |||||
| Left | −12 | −42 | 62 | 6.19 | 15 |
| Right | 14 | −52 | 66 | 4.61 | 19 |
| Dorsolateral prefrontal cortex | |||||
| Left | −30 | 46 | 14 | 6.10 | 33 |
| Right | 38 | 38 | 6 | 6.24 | 25 |
| 36 | 44 | 20 | 7.32 | 26 | |
| Parietal association cortex/secondary somatosensory cortex | |||||
| Left | −54 | −30 | 20 | 5.37 | 51 |
| Right | 50 | −26 | 20 | 8.15 | 77 |
| 52 | −30 | 26 | 8.04 | ||
| Cerebellar cortex | |||||
| Left | −26 | −44 | −28 | 5.82 | 21 |
| Right | 26 | −72 | −26 | 5.89 | 30 |
Comparison of signal changes during the second fMRI scan revealed that CPM analgesia was associated with differential signal changes in a number of brain regions (Fig. 3A and Table 3). Signal intensity changes were significantly increased during each test stimulus in the presence of the conditioning stimulus in noCPM subjects compared with CPM subjects bilaterally in the orofacial regions of S1, insula cortex, precuneus, parietal association cortex, PCC, MCC, cerebellar cortex, putamen, and the right caudate nucleus, S2, primary motor cortex, amygdala, orbitofrontal cortex, dmPFC, and the dlPFC. In no region was signal intensity change greater in CPM than in noCPM subjects.
Figure 3.
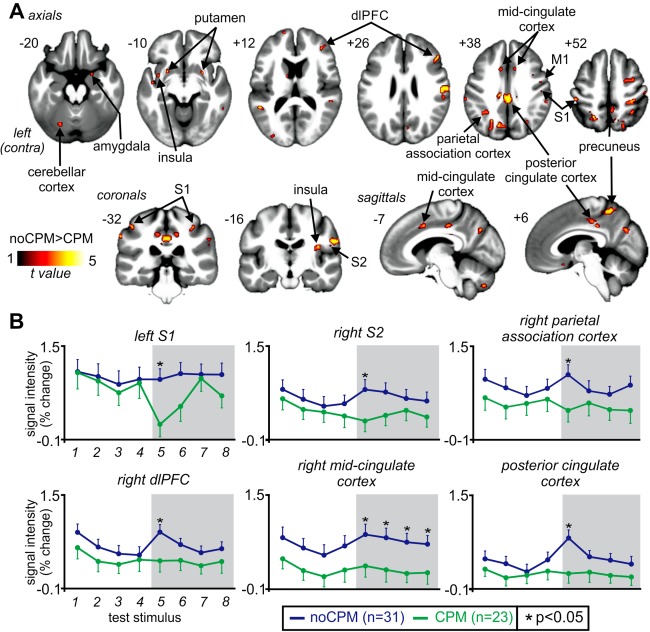
Brain regions associated with conditioned pain modulation (CPM). (A) Regions in which signal intensity changes during test stimuli in the presence of a conditioning stimulus were significantly greater in noCPM compared to CPM subjects (hot color scale). Significant clusters are overlaid onto a mean T1‐weighted anatomical image set created from all 54 subjects. The left side of the image is the side contralateral to the test stimuli. Slice locations in Montreal Neurological Institute space are indicated at the upper left of each slice. (B) Plots of mean (±SEM) percentage signal intensity changes during each of the four test stimuli alone and during the four test stimuli in the presence of the conditioning stimulus (grey shading) in noCPM (blue shading) and CPM (green shading) subjects. dlPFC: dorsolateral prefrontal cortex; M1: primary motor cortex; S1: primary somatosensory cortex; S2: secondary somatosensory cortex. *p < 0.05. [Color figure can be viewed in the online issue, which is available at http://wileyonlinelibrary.com.]
Table 3.
Location of significant signal intensity change differences associated with conditioned pain modulation (CPM) (locations are in Montreal Neurological Institute space)
| X | Y | Z | t value | Cluster size | |
|---|---|---|---|---|---|
| noCPM>CPM | |||||
| Primary somatosensory cortex | |||||
| Left | −46 | −32 | 50 | 3.80 | 14 |
| Right | 54 | −22 | 52 | 3.65 | 7 |
| 32 | −36 | 48 | 3.99 | 86 | |
| Right secondary somatosensory cortex | 54 | −18 | 22 | 4.19 | 7 |
| Right primary motor cortex | 40 | 4 | 34 | 3.40 | 10 |
| Insula | |||||
| Left | −36 | 2 | −10 | 3.49 | 9 |
| Right | 38 | −16 | 18 | 3.65 | 22 |
| Right dorsolateral prefrontal cortex | 48 | 28 | 24 | 4.04 | 41 |
| 38 | 38 | 12 | 3.52 | 16 | |
| Right dorsomedial prefrontal cortex | 16 | 62 | 12 | 3.23 | 9 |
| Right dorsal posterior insula | 38 | −16 | 18 | 3.65 | 22 |
| Mid‐cingulate cortex | |||||
| Left | −8 | 8 | 40 | 3.58 | 31 |
| Right | 12 | 14 | 36 | 3.26 | 4 |
| Posterior cingulate cortex | |||||
| Left | −10 | −26 | 40 | 4.15 | 22 |
| Right | 4 | −28 | 36 | 4.19 | 67 |
| Precuneus | |||||
| Left | −4 | −70 | 34 | 4.07 | 16 |
| Right | 4 | −50 | 56 | 3.94 | 21 |
| Putamen | |||||
| Left | −24 | 8 | −10 | 3.73 | 9 |
| Right | 28 | 6 | −8 | 4.22 | 46 |
| Right caudate nucleus | 10 | 10 | 0 | 3.40 | 7 |
| Cerebellar cortex | |||||
| Left | −24 | −58 | −52 | 3.30 | 12 |
| Right | 24 | −46 | −56 | 3.61 | 43 |
| Parietal association cortex | |||||
| Left | −56 | −50 | 32 | 3.74 | 24 |
| Right | 38 | −56 | 46 | 4.09 | 21 |
| Right amygdala | 22 | 2 | −20 | 3.45 | 5 |
| Right orbitofrontal cortex | 16 | 12 | −16 | 3.45 | 19 |
Inspection of the signal intensity changes in each of these regions revealed two distinct patterns of signal intensity changes during the test and conditioning stimulus periods. Within S1, S2, and parietal association cortex, although similar during the first four test stimuli, signal intensity increases during the first test stimulus in the presence of the conditioning stimulus were significantly reduced in CPM subjects compared to noCPM subjects (mean ± SEM signal intensity change: left S1: noCPM: 0.88 ± 0.18%, CPM: 0.11 ± 0.29%, p = 0.030; right S2: noCPM: 0.74 ± 0.17%, CPM: 0.20 ± 0.18%, p = 0.041; right parietal association cortex: noCPM: 0.99 ± 0.17%, CPM: 0.38 ± 0.20%, p = 0.025) (Fig. 3B). In direct contrast, within the right dlPFC, MCC, and PCC, signal intensity increases during the first test stimulus in the presence of the conditioning stimulus were significantly increased in the noCPM subjects compared to CPM subjects (right dlPFC: noCPM: 0.86 ± 0.13%, CPM: 0.37 ± 0.19%, p = 0.035; right MCC: noCPM: 0.85 ± 0.17%, CPM: 0.28 ± 0.19%, p = 0.041; PCC: noCPM: 0.78 ± 0.14%, CPM: 0.17 ± 0.17%, p = 0.001). Although in the PCC and MCC signal intensity changes during the test stimuli alone were similar in CPM and noCPM subjects, within the right dlPFC, they were significantly elevated in the noCPM subjects.
In addition to differences between CPM and noCPM subjects, we performed a correlation analysis to determine the relationship between signal intensity changes and individual CPM abilities (mean percentage change in pain intensity rating during the test stimuli in the presence of the conditioning stimulus with the mean of the first four test stimuli alone). We found positive correlations between CPM ability and signal intensity increases in the right S1 (r = 0.37, p = 0.006), S2 (r = 0.39, p = 0.004), dlPFC (r = 0.44, p = 0.001), amygdala (r = 0.40, p = 0.003), MCC (r = 0.33, p = 0.015), and PCC (r = 0.36, p = 0.008) and the left nucleus accumbens (r = 0.43, p = 0.001), putamen (r = 0.37, p = 0.006), insula (r = 0.39, p = 0.004), and orbitofrontal cortex (r = 0.34, p = 0.012), and bilateral parietal association cortex (left: r = 0.42, p = 0.002; right: r = 0.38, p = 0.005) (Fig. 4A,B). We also found a significant negative correlation between signal intensity changes and CPM abilities in the left medial prefrontal cortex (r = −0.37, p = 0.006). Except for the orbitofrontal, nucleus accumbens, and medial prefrontal cortices, these significantly correlated clusters overlapped with clusters derived from the noCPM versus CPM analysis. That is, in addition to being significantly greater in noCPM compared with CPM subjects, they were positively correlated with individual CPM abilities. We also assessed the relationships between changes in signal intensity in each significant cluster and scores for pain catastrophizing and fear of pain; we found no significant relationship in any of the significant clusters (all p > 0.05).
Figure 4.
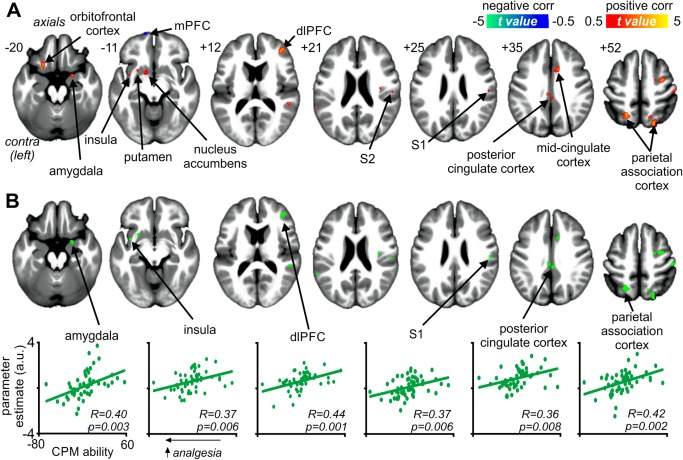
Brain regions significantly correlated with conditioned pain modulation (CPM) ability. (A) Regions in which signal intensity changes during test stimuli in the presence of a conditioning stimulus were significantly positively (hot color scale) and negatively (cool color scale) correlated with CPM ability. In each subject, CPM ability was defined as the mean percentage change in pain intensity rating during the test stimuli in the presence of the conditioning stimulus with the mean of the first four test stimuli alone. Thus, lower values indicate greater analgesic responses. Significant clusters are overlaid onto a mean T1‐weighted anatomical image set created from all 54 subjects. The left side of the image is the side contralateral to the test stimuli. Slice locations in Montreal Neurological Institute space are indicated at the upper left of each slice. (B) Overlap between regions correlated with CPM ability and differences between noCPM and CPM subjects. Below are plots of parameter estimate values for areas that were significantly different between noCPM and CPM subjects and that were significantly correlated with individual CPM abilities, i.e., magnitude of CPM analgesic response. dlPFC: dorsolateral prefrontal cortex; mPFC: medial prefrontal cortex; S1: primary somatosensory cortex; S2: secondary somatosensory cortex. [Color figure can be viewed in the online issue, which is available at http://wileyonlinelibrary.com.]
Functional Connectivity Changes
Finally, we assessed functional connectivity of the subnucleus reticularis dorsalis in CPM and noCPM subjects. During the four test stimuli in the presence of the conditioning stimulus, noCPM subjects displayed greater connectivity bilaterally in the insula cortex, dlPFC, dmPFC, MCC, and the parietal association cortices, whereas CPM subjects displayed greater connectivity bilaterally within the precuneus and orbitofrontal cortex (Fig. 5A and Table 4). Although SRD connectivity strengths were significantly different during the CPM period in all these regions, when connectivity during the test only period was evaluated, two different connectivity patterns emerged. Within the orbitofrontal cortex, SRD connectivity was also significantly different during the test period alone; indeed, the conditioning stimulus did not alter SRD connectivity. In direct contrast, bilaterally within the insula, right dmPFC, left dlPFC, and the left parietal association cortex, connectivity increased significantly during the test/conditioning period compared with the test stimuli alone in the noCPM subjects (Table 5).
Figure 5.
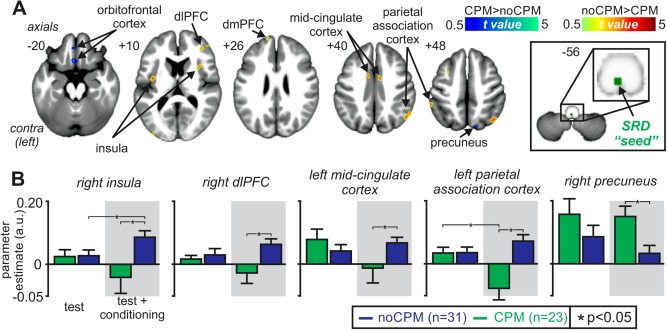
Functional connectivity changes associated with conditioned pain modulation (CPM). (A) Regions in which functional connectivity strength with the subnucleus reticularis dorsalis (SRD) were either greater (hot color scale) or lesser (cool color scale) in noCPM compared with CPM subjects. Significant clusters are overlaid onto a mean T1‐weighted anatomical image set created from all 54 subjects. The left side of the image is the side contralateral to the test stimuli. Slice locations in Montreal Neurological Institute space are indicated at the upper left of each slice. The seed region of the SRD is indicated by the green shading. (B) Plots of mean (±SEM) parameter estimate values indicating functional connectivity strengths in noCPM (blue shading) and CPM (green shading) subjects during test stimuli alone and during test stimuli in the presence of a conditioning stimulus for some of the clusters. dlPFC: dorsolateral prefrontal cortex; dmPFC: dorsomedial prefrontal cortex. *p < 0.05. [Color figure can be viewed in the online issue, which is available at http://wileyonlinelibrary.com.]
Table 4.
Regions in which functional connectivity strengths with the subnucleus reticularis dorsalis were significantly different in subjects that displayed a conditioned pain modulation (CPM) response compared with those that did not (noCPM)
| X | Y | Z | t value | Cluster size | |
|---|---|---|---|---|---|
| noCPM>CPM | |||||
| Insula | |||||
| Left | −38 | −8 | 8 | 3.29 | 28 |
| Right | 38 | 14 | 4 | 3.39 | 67 |
| Dorsolateral prefrontal cortex | |||||
| Left | −44 | 18 | 34 | 2.92 | 5 |
| Right | 40 | 40 | 12 | 3.69 | 24 |
| 38 | 42 | 30 | 2.97 | 5 | |
| Dorsomedial prefrontal cortex | |||||
| Left | −12 | 56 | 26 | 2.79 | 3 |
| Right | 10 | 68 | 6 | 3.23 | 4 |
| Mid‐cingulate cortex | |||||
| Left | −8 | 0 | 40 | 2.99 | 10 |
| Right | 10 | −4 | 42 | 3.88 | 9 |
| Parietal association cortex | |||||
| Left | −46 | −62 | 44 | 3.12 | 13 |
| Right | 54 | −62 | 30 | 3.77 | 17 |
| CPM>noCPM | |||||
| Orbitofrontal cortex | |||||
| Left | −2 | 20 | −22 | 3.06 | 12 |
| Right | 12 | 24 | −24 | 2.93 | 11 |
| Precuneus | |||||
| Left | −18 | −78 | 44 | 3.19 | 7 |
| Right | 12 | −76 | 50 | 2.99 | 4 |
Locations are in Montreal Neurological Institute (MNI) space. The subnucleus reticularis dorsalis “seed” comprised a 2 mm sphere centered at the MNI coordinate: 0, −44, −57.
Table 5.
Regions in which functional connectivity strengths with the subnucleus reticularis dorsalis were different in subjects that displayed conditioned pain modulation (CPM) analgesia compared with those that did not (noCPM)
| Test stimuli alone | Test stimuli during conditioning stimulus | Test alone vs test during conditioning | ||||||
|---|---|---|---|---|---|---|---|---|
| CPM | noCPM | CPM vs noCPM | CPM | noCPM | CPM vs noCPM | CPM | noCPM | |
| noCPM>CPM | ||||||||
| Insula | ||||||||
| Left | 0.043 ± 0.03 | 0.031 ± 0.02 | p = 0.716 | −0.022 ± 0.03 | 0.088 ± 0.03 | p = 0.06 | p = 0.06 | p = 0.032 |
| Right | 0.021 ± 0.02 | 0.022 ± 0.02 | p = 0.97 | −0.023 ± 0.03 | 0.084 ± 0.02 | p = 0.002 | p = 0.08 | p = 0.019 |
| Dorsolateral prefrontal cortex | ||||||||
| Left | 0.013 ± 0.03 | 0.010 ± 0.02 | p = 0.93 | −0.027 ± 0.02 | 0.070 ± 0.03 | p = 0.008 | p = 0.11 | p = 0.026 |
| Right | 0.011 ± 0.02 | 0.029 ± 0.02 | p = 0.51 | −0.016 ± 0.02 | 0.062 ± 0.01 | p = 0.001 | p = 0.19 | p = 0.26 |
| Dorsomedial prefrontal cortex | ||||||||
| Left | 0.008 ± 0.07 | 0.033 ± 0.03 | p = 0.72 | −0.105 ± 0.05 | 0.052 ± 0.03 | p = 0.008 | p = 0.16 | p = 0.65 |
| Right | 0.136 ± 0.08 | 0.022 ± 0.04 | p = 0.053 | −0.12 ± 0.06 | 0.100 ± 0.04 | p = 0.003 | p = 0.03 | p = 0.045 |
| Mid‐cingulate cortex | ||||||||
| Left | 0.077 ± 0.03 | 0.043 ± 0.02 | p = 0.44 | −0.007 ± 0.02 | 0.083 ± 0.02 | p = 0.004 | p = 0.12 | p = 0.11 |
| Right | 0.008 ± 0.03 | 0.043 ± 0.02 | p = 0.27 | −0.056 ± 0.03 | 0.054 ± 0.02 | p = 0.005 | p = 0.14 | p = 0.63 |
| Parietal association cortex | ||||||||
| Left | 0.041 ± 0.02 | 0.004 ± 0.02 | p = 0.26 | −0.011 ± 0.02 | 0.090 ± 0.02 | p = 0.003 | p = 0.14 | p = 0.022 |
| Right | 0.034 ± 0.02 | 0.034 ± 0.02 | p = 0.99 | −0.045 ± 0.02 | 0.070 ± 0.02 | p = 0.001 | p = 0.02 | p = 0.23 |
| CPM>noCPM | ||||||||
| Orbitofrontal cortex | ||||||||
| Left | 0.015 ± 0.02 | 0.003 ± 0.02 | p = 0.62 | 0.067 ± 0.02 | −0.03 ± 0.02 | p = 0.003 | p = 0.02 | p = 0.29 |
| Right | 0.049 ± 0.02 | −0.05 ± 0.01 | p = 0.035 | 0.035 ± 0.02 | −0.02 ± 0.01 | p = 0.005 | p = 0.59 | p = 0.17 |
| Precuneus | ||||||||
| Left | 0.14 ± 0.03 | 0.085 ± 0.02 | p = 0.130 | 0.13 ± 0.03 | 0.03 ± 0.02 | p = 0.004 | p = 0.88 | p = 0.051 |
| Right | 0.16 ± 0.05 | 0.088 ± 0.04 | p = 0.225 | 0.15 ± 0.03 | 0.03 ± 0.02 | p = 0.004 | p = 0.92 | p = 0.25 |
Mean (±SEM) parameter estimate values indicating connectivity strength and p values of between‐ and within‐groups comparisons are shown. Significant p values are in bold and the cell colored grey.
DISCUSSION
These data show that CPM analgesia is associated with significant differences in signal intensity changes within a number of brain regions, including the primary somatosensory cortex, right dorsolateral prefrontal, and cingulate cortices. Whereas the signal intensity changes within the somatosensory cortex matched the change in perceived pain intensity, i.e., smaller increases associated with lower pain intensity ratings, signal intensity changes within the dlPFC and cingulate cortex increased in those individuals that did not display CPM analgesia and remained stable in those that did. Furthermore, CPM analgesia was associated with greater connectivity between the dlPFC and MCC and the brainstem circuitry critical for CPM expression only in those individuals that did not display CPM analgesia. These data suggest that higher order regions such as the cingulate and prefrontal cortices modulate brainstem circuitry to prevent CPM expression.
Although we did not aim to explore the effects of gender on CPM ability, we found no significant difference in CPM analgesia magnitude in males compared with females or the proportion of males and females categorized as displaying CPM analgesia. Other studies have shown gender differences in CPM magnitude although this difference appears small and can vary depending on experimental methodology [Ge et al., 2004; Popescu et al., 2010; Staud et al., 2003]. In addition, we found that CPM sensitivity was not related to age, temperature used to evoke similar pain intensity ratings during the test stimuli, the perceived pain intensity or the perceived spread of the conditioning stimulus. These results suggest that the properties of the painful conditioning stimulus are not critical for CPM expression, a finding supported by Granot et al. [2008] who also showed that CPM expression was independent of the pain intensity or modality of the conditioning pain stimulus. We also found that psychological variables such as pain catastrophizing and fear of pain were not predictive of CPM expression which is in contrast to findings by Weissman‐Fogel et al. [2008] who report that high catastrophizing scores were associated with reduced analgesic responses, although others have reported the opposite [Granot et al., 2008]. Furthermore, in no brain region did we find a significant relationship between either of these variables and CPM‐related signal intensity changes which is curious as we found CPM‐related signal intensity changes in brain regions previously shown to be altered in individuals with high PCS scores such as the dlPFC and cingulate cortex [Gracely et al., 2004; Hubbard et al., 2014].
Consistent with previous investigations, we found that CPM was associated with reduced activity in S1, S2, and posterior parietal association cortices, changes which likely underlie the reduction in perceived pain intensity itself [Moont et al., 2011]. In addition, in direct contrast to our original hypothesis, we found signal intensity increases within the dlPFC, PCC, and MCC only in individuals that did not display CPM analgesia. In these regions and the amygdala, signal intensity changes were positively correlated to CPM analgesia; that is, greater signal intensity increases were associated with reduced CPM analgesia. Although previous investigations also reported CPM‐related changes most of these brain regions, they did not report changes in the dlPFC or PCC [Bogdanov et al., 2015; Brock et al., 2012; Davis, 2013; Moont et al., 2011; Piche et al., 2009; Song et al., 2006; Sprenger et al., 2011]. There are a number of reasons that may account for the differences including the fact that we used considerably more subjects in our investigation (54 versus 10–22 subjects in previous studies) and, importantly, divided our subjects into two groups corresponding to whether or not individual subjects displayed a CPM response and found that only about half of our subjects displayed CPM analgesia. We suggest that separating subjects into two groups on the basis of the presence or absence of CPM is a more robust method of detecting cortical (and subcortical) changes compared with linear correlation analyses.
The response patterns within the cingulate cortex and dlPFC regions were unique in that they did not follow the change in perceived pain intensity but instead increased during the CPM period only in those subjects that did not display CPM analgesia. Involvement of the cingulate cortex and dlPFC in pain processing is well established. Single unit recordings have identified nociceptive responses in MCC neurons [Hutchison et al., 1999] and brain imaging has shown that painful heat stimuli reliably activates both the MCC and dlPFC [Farrell et al., 2005]. For the main part, investigations linking cingulate activity with analgesia report changes with the anterior cingulate cortex and its influence over the classical midbrain periaqueductal grey—rostral ventromedial medulla circuitry [Xie et al., 2009]. Few studies have shown a similar analgesic role for the MCC and PCC, which are thought to be involved in sensory orientation [Vogt, 2005]. In contrast, numerous investigations have linked dlPFC activity with pain modulation. For example, in placebo analgesia studies, increased dlPFC activity was associated with analgesia and correlated with activity in the PAG [Wager et al., 2004], and the analgesic effects of perceived pain control is correlated with dlPFC activity [Wiech et al., 2006]. It has been postulated that the prefrontal cortex “represents the pivotal source of modulation that, at least within one conceivable pathway, initiates downstream analgesic activity and/or emotional modulation” [Bingel and Tracey, 2008]. Our data furthers this idea and we add that activity within the dlPFC may indeed prevent the expression of an analgesic response such as that mediated by the brainstem circuitry responsible for CPM.
It remains unknown if there is a direct neural connection between the SRD and the dlPFC and cingulate cortex (MCC/PCC) in humans. Whereas one tract‐tracing investigation did not find a projection from the cingulate or dlPFC to the SRD in the rat [Desbois et al., 1999], another study did [Almeida et al., 2002]. Furthermore, tetanic stimulation of the cingulate cortex, in a region akin to the human MCC, facilitates spinal nociception and this effect is abolished following SRD lesions [Vogt, 2005; Zhang et al., 2005]. Although we found no difference in strength of functional connectivity between the SRD–dlPFC and SRD–MCC/PCC in CPM and noCPM subjects during test painful stimuli alone, these strengths increased dramatically in the noCPM group once the conditioning stimulus was applied. This implies direct effects on the SRD by the cingulate and dlPFC, specifically during the application of multiple painful stimuli at distant body locations.
In addition to the cingulate cortex and dlPFC, we found CPM‐related signal changes in the OFC and amygdala. It has been reported that counter‐irritation analgesia is positively correlated to OFC and amygdala activity and that analgesia‐related amygdala changes are altered by the opiate antagonist naloxone [Piche et al., 2009; Sprenger et al., 2011], findings that are consistent with anatomical connections between these structures and endogenous opioid release during sustained pain [Kringelbach and Rolls, 2004; Zubieta et al., 2001]. Although our data also provide support for a role for these regions in CPM, we also found that in striking contrast to the cingulate cortex and dlPFC, connectivity strength between the SRD and the OFC was significantly different between CPM and noCPM subjects during both test stimuli alone and during test stimuli in the presence of the conditioning stimulus, i.e., connectivity strength did not change during CPM. Given this, we speculate that this region is not involved in modulating SRD activity during CPM but may instead be involved in coding the differences in pain intensity and presumably affect between subjects that do and do not expresses an analgesic response.
While a specific role for the SRD in CPM is well established, evidence also suggests a more general role for the SRD in pain modulation. Electrophysiological recordings, lesion investigations, and behavioral analysis in experimental animals report a facilitatory role for the SRD on dorsal horn nociceptive neurons and pain perception. Indeed, in the rat, SRD stimulation enhances the responsiveness of spinal nociceptive neurons and pain‐like responses, whereas SRD lesions produce the inverse [Almeida et al., 1999, 1996; Dugast et al., 2003]. It has been suggested that the degree of descending facilitatory effects of the SRD on spinal nociception is dependent on the integration of supraspinal information [Almeida et al., 2002]. Our data is consistent with this suggestion, in that the absence of CPM analgesia was associated with significant signal increases in the cingulate and dorsolateral prefrontal cortices. It is conceivable that CPM analgesia reflects a reduction in SRD facilitatory influences on the primary afferent synapse, whereas an absence of CPM results from increased cortical control of the SRD, particularly from the cingulate and dorsolateral prefrontal cortices.
Given that increased activity within the cingulate and dlPFC are associated with reduced CPM ability, one could speculate that increased on‐going activity in these brain regions may underlie the reduced CPM ability observed in individuals with chronic pain. Indeed, chronic pain is associated with structural changes within the cingulate cortex and dlPFC [Smallwood et al., 2013], and we have recently reported increased blood flow in the dlPFC in individuals with chronic orofacial pain [Youssef et al., 2014]. It might be that healthy individuals who display CPM‐related increases in cingulate and prefrontal cortex activity are more likely to develop chronic pain following injury or that, following nerve injury, some individuals develop changes in cingulate and prefrontal cortex activity that then reduce CPM ability.
LIMITATIONS
There are a number of limitations of this investigation worth noting. First, we did not account for small differences in the movement required to shift the CoVAS rating system between groups. The noCPM subjects would have on average moved the slider 2.5 cm further than the CPM subjects during the conditioning stimulus and this may have evoked minor differences in brain activation patterns. Although, we suggest that any differences would have been extremely small if any and that the differences we report between noCPM and CPM subjects are associated with the phenomenon of CPM analgesia. Furthermore, it is possible that some of the analgesic effect we have attributed to CPM may have been influenced by distraction due to the salience of the conditioning painful stimulus. It has been reported that hypoalgesia associated with conditioning painful stimuli can be significantly influenced by distraction [Quiton and Greenspan, 2007] although CPM itself has been shown to act independently from the effects of distraction [Moont et al., 2010]. A further possible limitation is that when reporting some of our results, we used a statistical threshold that was not corrected for multiple comparisons. Although this may introduce Type II errors, we limited this possibility by applying small volume corrections. Since, as detailed above, we used clusters from our initial study as well as some based on the results of previous studies, we strongly suggest that small volume corrections of these brainstem regions are entirely appropriate. Furthermore, we extracted signal intensity changes to further confirm the significance of the relevant signal changes. Despite these limitations, we are confident that the cortical circuitry defined here represents that which underlies the phenomenon of CPM.
ACKNOWLEDGMENT
The authors state that there are no conflicts of interest.
REFERENCES
- Almeida A, Cobos A, Tavares I, Lima D (2002): Brain afferents to the medullary dorsal reticular nucleus: A retrograde and anterograde tracing study in the rat. Eur J Neurosci 16:81–95. [DOI] [PubMed] [Google Scholar]
- Almeida A, Storkson R, Lima D, Hole K, Tjolsen A (1999): The medullary dorsal reticular nucleus facilitates pain behaviour induced by formalin in the rat. Eur J Neurosci 11:110–122. [DOI] [PubMed] [Google Scholar]
- Almeida A, Tjolsen A, Lima D, Coimbra A, Hole K (1996): The medullary dorsal reticular nucleus facilitates acute nociception in the rat. Brain Res Bull 39:7–15. [DOI] [PubMed] [Google Scholar]
- Bingel U, Tracey I (2008): Imaging CNS modulation of pain in humans. Physiology (Bethesda) 23:371–380. [DOI] [PubMed] [Google Scholar]
- Bogdanov VB, Vigano A, Noirhomme Q, Bogdanova OV, Guy N, Laureys S, Renshaw PF, Dallel R, Phillips C, Schoenen J (2015): Cerebral responses and role of the prefrontal cortex in conditioned pain modulation: An fMRI study in healthy subjects. Behav Brain Res 281:187–198. [DOI] [PMC free article] [PubMed] [Google Scholar]
- Brock C, Olesen SS, Valeriani M, Arendt‐Nielsen L, Drewes AM (2012): Brain activity in rectosigmoid pain: Unravelling conditioning pain modulatory pathways. Clin Neurophysiol 123:829–837. [DOI] [PubMed] [Google Scholar]
- Cheng JC, Erpelding N, Kucyi A, DeSouza DD, Davis KD (2015): Individual differences in temporal summation of pain reflect pronociceptive and antinociceptive brain structure and function. J Neurosci 35:9689–9700. [DOI] [PMC free article] [PubMed] [Google Scholar]
- Coghill RC, Eisenach J (2003): Individual differences in pain sensitivity: Implications for treatment decisions. Anesthesiology 98:1312–1314. [DOI] [PubMed] [Google Scholar]
- Davis MP (2013): The clinical importance of conditioning pain modulation: A review and clinical implications In: Ko M‐C, Husbands SM, editors. Research and Development of Opioid‐Related Ligands. Washington, DC: American Chemical Society; pp 9–38. [Google Scholar]
- De Broucker T, Cesaro P, Willer JC, Le Bars D (1990): Diffuse noxious inhibitory controls in man. Involvement of the spinoreticular tract. Brain 113:1223–1234. [DOI] [PubMed] [Google Scholar]
- Desbois C, Le Bars D, Villanueva L (1999): Organization of cortical projections to the medullary subnucleus reticularis dorsalis: A retrograde and anterograde tracing study in the rat. J Comp Neurol 410:178–196. [PubMed] [Google Scholar]
- Dugast C, Almeida A, Lima D (2003): The medullary dorsal reticular nucleus enhances the responsiveness of spinal nociceptive neurons to peripheral stimulation in the rat. Eur J Neurosci 18:580–588. [DOI] [PubMed] [Google Scholar]
- Edwards RR, Ness TJ, Weigent DA, Fillingim RB (2003): Individual differences in diffuse noxious inhibitory controls (DNIC): Association with clinical variables. Pain 106:427–437. [DOI] [PubMed] [Google Scholar]
- Farrell MJ, Laird AR, Egan GF (2005): Brain activity associated with painfully hot stimuli applied to the upper limb: A meta‐analysis. Hum Brain Mapp 25:129–139. [DOI] [PMC free article] [PubMed] [Google Scholar]
- Friston KJ, Holmes AP, Worsley KJ, Poline JP, Frith CD, Frackowiak RSJ (1994): Statistical parametric maps in functional imaging: A general linear approach. Hum Brain Mapp 2:189–210. [Google Scholar]
- Ge HY, Madeleine P, Arendt‐Nielsen L (2004): Sex differences in temporal characteristics of descending inhibitory control: An evaluation using repeated bilateral experimental induction of muscle pain. Pain 110:2):72–78. [DOI] [PubMed] [Google Scholar]
- Goffaux P, Redmond WJ, Rainville P, Marchand S (2007): Descending analgesia–when the spine echoes what the brain expects. Pain 130:137–143. [DOI] [PubMed] [Google Scholar]
- Goodin BR, McGuire L, Allshouse M, Stapleton L, Haythornthwaite JA, Burns N, Mayes LA, Edwards RR (2009): Associations between catastrophizing and endogenous pain‐inhibitory processes: Sex differences. J Pain 10:180–190. [DOI] [PubMed] [Google Scholar]
- Gracely RH, Geisser ME, Giesecke T, Grant MA, Petzke F, Williams DA, Clauw DJ (2004): Pain catastrophizing and neural responses to pain among persons with fibromyalgia. Brain 127:835–843. [DOI] [PubMed] [Google Scholar]
- Granot M, Weissman‐Fogel I, Crispel Y, Pud D, Granovsky Y, Sprecher E, Yarnitsky D (2008): Determinants of endogenous analgesia magnitude in a diffuse noxious inhibitory control (DNIC) paradigm: Do conditioning stimulus painfulness, gender and personality variables matter? Pain 136:142–149. [DOI] [PubMed] [Google Scholar]
- Hubbard CS, Khan SA, Keaser ML, Mathur VA, Goyal M, Seminowicz DA (2014): Altered brain structure and function correlate with disease severity and pain catastrophizing in migraine patients. Eneuro 1:e20.14. [DOI] [PMC free article] [PubMed] [Google Scholar]
- Hutchison WD, Davis KD, Lozano AM, Tasker RR, Dostrovsky JO (1999): Pain‐related neurons in the human cingulate cortex. Nat Neurosci 2:403–405. [DOI] [PubMed] [Google Scholar]
- Julien N, Goffaux P, Arsenault P, Marchand S (2005): Widespread pain in fibromyalgia is related to a deficit of endogenous pain inhibition. Pain 114:295–302. [DOI] [PubMed] [Google Scholar]
- King CD, Wong F, Currie T, Mauderli AP, Fillingim RB, 3 Riley JL, (2009): Deficiency in endogenous modulation of prolonged heat pain in patients with irritable bowel syndrome and temporomandibular disorder. Pain 143:172–178. [DOI] [PMC free article] [PubMed] [Google Scholar]
- Kringelbach ML, Rolls ET (2004): The functional neuroanatomy of the human orbitofrontal cortex: Evidence from neuroimaging and neuropsychology. Prog Neurobiol 72:341–372. [DOI] [PubMed] [Google Scholar]
- Le Bars D, Dickenson AH, Besson JM (1979): Diffuse noxious inhibitory controls (DNIC). I. Effects on dorsal horn convergent neurones in the rat. Pain 6:283–304. [DOI] [PubMed] [Google Scholar]
- McNeil DW, 3 Rainwater AJ, (1998): Development of the Fear of Pain Questionnaire–III. J Behav Med 21:389–410. [DOI] [PubMed] [Google Scholar]
- Moont R, Crispel Y, Lev R, Pud D, Yarnitsky D (2011): Temporal changes in cortical activation during conditioned pain modulation (CPM), a LORETA study. Pain 152:1469–1477. [DOI] [PubMed] [Google Scholar]
- Moont R, Pud D, Sprecher E, Sharvit G, Yarnitsky D (2010): 'Pain inhibits pain' mechanisms: Is pain modulation simply due to distraction? Pain. 150:113–120. [DOI] [PubMed] [Google Scholar]
- Nahman‐Averbuch H, Yarnitsky D, Granovsky Y, Sprecher E, Steiner M, Tzuk‐Shina T, Pud D (2011): Pronociceptive pain modulation in patients with painful chemotherapy‐induced polyneuropathy. J Pain Symptom Manage 42:229–238. [DOI] [PubMed] [Google Scholar]
- Nourbakhsh MR, Ottenbacher KJ (1994): The statistical analysis of single‐subject data: A comparative examination. Phys Ther 74:768–776. [DOI] [PubMed] [Google Scholar]
- Ossipov MH, Dussor GO, Porreca F (2010): Central modulation of pain. J Clin Invest 120:3779–3787. [DOI] [PMC free article] [PubMed] [Google Scholar]
- Piche M, Arsenault M, Rainville P (2009): Cerebral and cerebrospinal processes underlying counterirritation analgesia. J Neurosci 29:14236–14246. [DOI] [PMC free article] [PubMed] [Google Scholar]
- Popescu A, LeResche L, Truelove EL, Drangsholt MT (2010): Gender differences in pain modulation by diffuse noxious inhibitory controls: A systematic review. Pain 150:309–318. [DOI] [PubMed] [Google Scholar]
- Quiton RL, Greenspan JD (2007): Sex differences in endogenous pain modulation by distracting and painful conditioning stimulation. Pain 132 Suppl 1:S134–S149. [DOI] [PMC free article] [PubMed] [Google Scholar]
- Roby‐Brami A, Bussel B, Willer JC, Le Bars D (1987): An electrophysiological investigation into the pain‐relieving effects of heterotopic nociceptive stimuli. Probable involvement of a supraspinal loop. Brain 110:1497–1508. [DOI] [PubMed] [Google Scholar]
- Smallwood RF, Laird AR, Ramage AE, Parkinson AL, Lewis J, Clauw DJ, Williams DA, Schmidt‐Wilcke T, Farrell MJ, Eickhoff SB, et al. (2013): Structural brain anomalies and chronic pain: A quantitative meta‐analysis of gray matter volume. J Pain 14:663–675. [DOI] [PMC free article] [PubMed] [Google Scholar]
- Song GH, Venkatraman V, Ho KY, Chee MW, Yeoh KG, Wilder‐Smith CH (2006): Cortical effects of anticipation and endogenous modulation of visceral pain assessed by functional brain MRI in irritable bowel syndrome patients and healthy controls. Pain 126:79–90. [DOI] [PubMed] [Google Scholar]
- Sprenger C, Bingel U, Buchel C (2011): Treating pain with pain: Supraspinal mechanisms of endogenous analgesia elicited by heterotopic noxious conditioning stimulation. Pain 152:428–439. [DOI] [PubMed] [Google Scholar]
- Staud R, Robinson ME, Vierck CJJ, Price DD (2003): Diffuse noxious inhibitory controls (DNIC) attenuate temporal summation of second pain in normal males but not in normal females or fibromyalgia patients. Pain 101:167–174. [DOI] [PubMed] [Google Scholar]
- Sullivan MJL, Bishop S, Pivik J (1995): The pain catastrophizing scale: Development and validation. Psychol Assess 7:432–524. [Google Scholar]
- Tzourio‐Mazoyer N, Landeau B, Papathanassiou D, Crivello F, Etard O, Delcroix N, Mazoyer B, Joliot M (2002): Automated anatomical labeling of activations in SPM using a macroscopic anatomical parcellation of the MNI MRI single‐subject brain. NeuroImage 15:273–289. [DOI] [PubMed] [Google Scholar]
- Vidor LP, Torres IL, Medeiros LF, Dussan‐Sarria JA, Dall'agnol L, Deitos A, Brietzke A, Laste G, Rozisky JR, Fregni F, et al. (2014): Association of anxiety with intracortical inhibition and descending pain modulation in chronic myofascial pain syndrome. BMC Neurosci 15:42. [DOI] [PMC free article] [PubMed] [Google Scholar]
- Vogt BA (2005): Pain and emotion interactions in subregions of the cingulate gyrus. Nat Rev Neurosci 6:533–544. [DOI] [PMC free article] [PubMed] [Google Scholar]
- Wager TD, Rilling JK, Smith EE, Sokolik A, Casey KL, Davidson RJ, Kosslyn SM, Rose RM, Cohen JD (2004): Placebo‐induced changes in FMRI in the anticipation and experience of pain. Science 303:1162–1167. [DOI] [PubMed] [Google Scholar]
- Weissman‐Fogel I, Sprecher E, Pud D (2008): Effects of catastrophizing on pain perception and pain modulation. Exp Brain Res 186:79–85. [DOI] [PubMed] [Google Scholar]
- Wiech K, Kalisch R, Weiskopf N, Pleger B, Stephan KE, Dolan RJ (2006): Anterolateral prefrontal cortex mediates the analgesic effect of expected and perceived control over pain. J Neurosci 26:11501–11509. [DOI] [PMC free article] [PubMed] [Google Scholar]
- Xie YF, Huo FQ, Tang JS (2009): Cerebral cortex modulation of pain. Acta Pharmacol Sin 30:31–41. [DOI] [PMC free article] [PubMed] [Google Scholar]
- Yarnitsky D (2010): Conditioned pain modulation (the diffuse noxious inhibitory control‐like effect): Its relevance for acute and chronic pain states. Curr Opin Anaesthesiol 23:611–615. [DOI] [PubMed] [Google Scholar]
- Yarnitsky D, Granot M, Nahman‐Averbuch H, Khamaisi M, Granovsky Y (2012): Conditioned pain modulation predicts duloxetine efficacy in painful diabetic neuropathy. Pain 153:1193–1198. [DOI] [PubMed] [Google Scholar]
- Youssef AM, Gustin SM, Nash PG, Reeves JM, Petersen ET, Peck CC, Murray GM, Henderson LA (2014): Differential brain activity in subjects with painful trigeminal neuropathy and painful temporomandibular disorder. Pain 155:467–475. [DOI] [PubMed] [Google Scholar]
- Youssef AM, Macefield VG, Henderson LA (2015): Pain inhibits pain; human brainstem mechanisms. NeuroImage 124:54–62. [DOI] [PubMed] [Google Scholar]
- Zhang L, Zhang Y, Zhao ZQ (2005): Anterior cingulate cortex contributes to the descending facilitatory modulation of pain via dorsal reticular nucleus. Eur J Neurosci 22:1141–1148. [DOI] [PubMed] [Google Scholar]
- Zubieta JK, Smith YR, Bueller JA, Xu Y, Kilbourn MR, Jewett DM, Meyer CR, Koeppe RA, Stohler CS (2001): Regional mu opioid receptor regulation of sensory and affective dimensions of pain. Science 293:311–315. [DOI] [PubMed] [Google Scholar]