

Abstract
High plasma glucose (PG) levels can reduce fluorine‐18‐labeled fluorodeoxyglucose (18F‐FDG) uptake, especially in the Alzheimer's disease (AD)‐related regions. This fact is supported by studies showing that the resting‐state activity in diabetes can be altered in the default mode network (DMN)‐related regions, which considerably overlap with the AD‐related regions. In order to expand the current knowledge, we aimed to investigate the relationship between increasing PG levels and the regional cerebral metabolic rates for glucose (CMRglc) as a direct index of brain activity. We performed dynamic 18F‐FDG positron emission tomography with arterial blood sampling once each in the fasting and glucose‐loading conditions on 12 young, healthy volunteers without cognitive impairment or insulin resistance. The absolute CMRglc values were calculated for the volume‐of‐interest (VOI) analysis, and normalized CMRglc maps were generated for the voxelwise analysis. The normalized measurement is known to have smaller intersubject variability than the absolute measurement, and may, thus, lead to greater statistical power. In VOI analysis, no regional difference in the CMRglc was found between the two conditions. In exploratory voxelwise analysis, however, significant clusters were identified in the precuneus, posterior cingulate, lateral parietotemporal, and medial prefrontal regions where the CMRglc decreased upon glucose loading (P < 0.05, corrected). These regions include the representative components of both the DMN and AD pathology. Taken together with the previous knowledge on the relationships between the DMN, AD, and diabetes, it may be inferred that glucose loading induces hypometabolism in the AD‐related and DMN‐related regions. Hum Brain Mapp 37:2823–2832, 2016. © 2016 Wiley Periodicals, Inc.
Keywords: 18F‐FDG, PET, glucose, regional cerebral metabolic rates for glucose, precuneus
INTRODUCTION
Assessment of brain activity by using fluorine‐18‐labeled fluorodeoxyglucose (18F‐FDG) imaging to measure regional glucose metabolism is a powerful tool for the differential diagnosis of dementia and the diagnosis of Alzheimer's disease (AD). Patients with AD demonstrate hypometabolism in the precuneus/posterior cingulate, lateral parietotemporal, and frontal regions [Friedland et al., 1983; Langbaum et al., 2009], resulting in the appearance of a characteristic distribution pattern of 18F‐FDG, called the AD‐pattern. Both the sensitivity and specificity of the pattern in the 18F‐FDG images for the diagnosis of AD are reported to be more than 80% [Patwardhan et al., 2004; Silverman et al., 2001].
Interestingly, recent studies indicate that high plasma glucose (PG) levels can reduce 18F‐FDG uptake especially in AD‐related regions, alter the distribution pattern of 18F‐FDG, and finally induce the appearance of the AD‐like pattern in the 18F‐FDG images. 18F‐FDG uptake in AD‐related regions has been reported to significantly decrease with increasing PG levels in older subjects [Burns et al., 2013] and, also decrease with increasing insulin resistance in older subjects [Baker et al., 2011] as well as in AD patients [Willette et al., 2015]. Glucose loading has been reported to result in the appearance of the AD‐like pattern in older subjects [Kawasaki et al., 2008] as well as in younger ones [Ishibashi et al., 2015a]. A study has reported the appearance of the AD‐like pattern even in cognitively normal subjects with PG levels of 100–110 mg/dL [Ishibashi et al., 2015b]. Additionally, in the case of a patient with mild cognitive impairment, who was negative for Aβ accumulation and the apolipoprotein E ε4 genotype, it was reported that the AD‐like pattern appeared in the 18F‐FDG images during hyperglycemia, but disappeared with decreasing PG levels [Ishibashi et al., 2014].
The results of these previous studies that analyzed the values of 18F‐FDG uptake by static scanning suggest that the AD‐like pattern might be related to hypometabolism in the AD‐related regions in a hyperglycemic state. Supporting with this hypothesis, recent studies using functional magnetic resonance imaging (fMRI) have shown that the resting‐state functional connectivity was altered in patients with diabetes [Chen et al., 2014; Cui et al., 2014; Musen et al., 2012; Xia et al., 2015; Zhou et al., 2010], and some studies have implied that diabetes can decrease the activity in the default mode network (DMN)‐related regions that considerably overlap with the AD‐related regions in the 18F‐FDG images. Since patients with diabetes have increased PG levels, there might be a physiological or pathophysiological link between the findings of the previous 18F‐FDG and fMRI studies.
One of the limitations of these studies is that they considered the values of 18F‐FDG uptake or the blood oxygen level‐dependent signal as an indirect index of brain activity that is possibly associated with physiological or pathophysiological conditions. Therefore, it is necessary to measure the brain activity using more accurate and direct methods, and to verify the previously reported phenomena. The aim of this study was to expand the current knowledge on the relationship between the PG levels and the AD‐like pattern in the 18F‐FDG images using the regional cerebral metabolic rates for glucose (CMRglc) as a direct index of brain activity [Sokoloff et al., 1977]. We performed dynamic 18F‐FDG positron emission tomography (PET) with arterial blood sampling before and after glucose loading in healthy volunteers, and assessed the changes in the CMRglc between the two conditions using volume of interest (VOI) analysis and, subsequently voxelwise analysis.
MATERIALS AND METHODS
Research Participants
The study was conducted in accordance with the Helsinki Protocol, and was approved by the Ethics Committee of the Tokyo Metropolitan Institute of Gerontology. After a detailed explanation of the study, each participant provided written informed consent. The study sample was composed of 12 young volunteers (six male and six female subjects; mean age, 25.3 years; SD, 3.9; range, 20–32). None of the subjects had a history of diabetes, and were all certified as being healthy, based on the results of physical and neurological examinations, medical interview with a neurologist, and MRI findings.
Study Protocol
Each of the subjects visited our institute twice to undergo 18F‐FDG PET under two different conditions: the fasting and glucose‐loading conditions. The order in which the subjects presented for imaging with the two conditions was randomized; three of the six men and three of the six women underwent the first and second scans under the fasting and glucose‐loading conditions, respectively. The other six subjects underwent the two scans in the reverse order of the conditions. The time interval between the two visits was three weeks or less. In the fasting condition, each participant visited the institute for 18F‐FDG PET after fasting overnight for more than 8 h. In the glucose‐loading condition, each participant visited the institute without having been under any dietary restriction, and was administered 75 g of glucose orally (TRELAN‐G75; AY Pharma, Tokyo, Japan) about 30 min prior to the initiation of the scanning procedure.
The PG levels were measured twice, immediately before and after the scanning, by using a medical device (Stat Strip XP2; Nipro, Osaka, Japan), and the two values were averaged. The measurement system used was a glucose oxidase‐based amperometric method. The plasma insulin levels were measured once immediately before the scan using a chemiluminescent enzyme immunoassay (SRL, Tokyo, Japan). The Homeostasis Model Assessment of Insulin Resistance (HOMA‐IR; index of insulin resistance) was calculated by the following formula: HOMA‐IR = (fasting glucose (mmol/L) × fasting insulin (μU/mL))/22.5.
18F‐FDG PET Scanning
The radioligand, 18F‐FDG, was synthesized using a PET synthesizer (F300, Sumitomo Heavy Industries, Tokyo, Japan). The radiochemical purity of 18F‐FDG was greater than 95%. The PET scanning was performed at the Tokyo Metropolitan Institute of Gerontology using the Discovery PET/CT 710 scanner (GE Healthcare, Milwaukee, WI) in the three‐dimensional mode. The in‐plane and axial resolutions of the full width scans at half maximum were 4.52 mm and 4.83 mm, respectively. Forty‐seven‐slice images with 2 × 2 × 3.27 mm3 voxel size and 128 × 128 matrix size were obtained. A CT‐transmission scan was performed to obtain the data for the measured attenuation correction. After the injection of 18F‐FDG, the dynamic emission data were acquired for 60 min. The injection dosages were 231.3 ± 16.4 MBq and 235.1 ± 11.9 MBq in the fasting and glucose‐loading conditions, respectively (mean ± standard deviation). The injection rate of 18F‐FDG in 2.5 mL saline was 5 mL/min. The arterial blood samples were manually drawn from the radial artery at 10‐s intervals from 0–2 min, 15‐s intervals from 2–2.5 min, 30‐s intervals from 2.5–3 min, 2‐min intervals from 3–7 min, 3‐min intervals from 7–10 min, 5‐min intervals from 10–20 min, and 10‐min intervals from 20–60 min. The plasma was then separated, weighed, and measured for radioactivity with a sodium iodide (Tl)‐well scintillation counter (Molecular Imaging Labo, Osaka, Japan). The frame arrangement for the dynamic PET data was 20 s × 3 frames, 30 s × 3 frames, 60 s × 5 frames, 150 s × 5 frames, and 300 s × 8 frames. The data were reconstructed after correction for decay, attenuation, and scatter.
MRI Acquisition and VOIs
The MRI was performed using the Discovery MR750w 3.0T scanner (GE Healthcare, Milwaukee, WI) in the three‐dimensional mode (SPGR: repetition time, 7.648 ms; echo time, 3.092 ms; matrix size, 196 × 256 × 256; and voxel size, 1.2 × 1.0547 × 1.0547 mm3). The MRI and PET data were processed using the FMRIB Software Library version 5.0.4 (FSL; Oxford, UK), and the VOIs were placed on the MRI using a method similar to that described elsewhere [Ishibashi et al., 2013].
The DMN‐related regions (dorsal DMN, ventral DMN and precuneus/posterior cingulate) were defined as VOIs (Fig. 1A‐C) (Shirer et al., 2012). The four cortices (frontal, occipital, parietal, and temporal) and cerebellum were also defined as the VOIs (Fig. 1D,E) to enable comparison with data from a previous, related study [Hasselbalch et al., 2001]. The gray matter and white matter were first segmented in the native space using the FSL's FAST program [Zhang et al., 2001]. Bilateral VOIs for the dorsal and ventral DMN were selected from the atlases of functional regions‐of‐interest (Functional Imaging in Neuropsychiatric Disorders Laboratory, Stanford, CA) [Shirer et al., 2012]. The VOI for the precuneus/posterior cingulate was part of the dorsal DMN. Bilateral VOIs for the four cortices and the cerebellum were selected from the Montreal Neurological Institute (MNI) structural atlas included in FSL. These VOIs were transformed from the MNI space into the native space, and were masked with the native gray matter segmentation mask. A whole DMN VOI was created by combining the VOIs for the dorsal and ventral DMN. A global brain VOI was created by combining the native gray and white matter segmentation masks in the native space (Fig. 1F).
Figure 1.
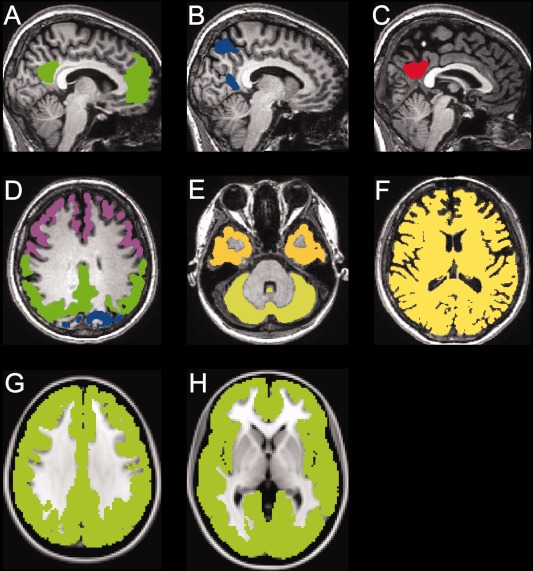
Examples of the volumes‐of‐interest (VOIs) in the native space (A‐F) and a mask created for the voxelwise analysis in the MNI space (G, H). The VOIs placed on the dorsal default mode network (DMN) (A: green), ventral DMN (B: blue) and precuneus/posterior cingulate (C: red) are displayed in the sagittal sections of a representative MRI image (http://findlab.stanford.edu/functional_ROIs.html: accessed March 20, 2016). The VOIs placed on the frontal cortex (D: purple), occipital cortex (D: blue), parietal cortex (D: green), temporal cortex (E: yellow), cerebellum (E: light yellow), and whole brain (F: yellow) are displayed in the axial sections of a representative MRI image. A mask (G, H: light green) of the whole cerebral cortex created for the voxelwise analysis is displayed in the axial sections of the MNI‐standard brain. MNI: Montreal Neurological Institute.
Data Processing in VOI and Voxelwise Analyses
After motion‐correction using the FSL's MCFLIRT program [Jenkinson et al., 2002], the PET images were co‐registered to the corresponding structural MRI using the FSL's FLIRT program [Jenkinson and Smith, 2001]. The VOI kinetic analyses of the time‐activity curves in the brain and plasma were performed. The time–activity data were extracted from the anatomically defined VOIs on the PET images and plasma samples, and imported into the PMOD PKIN version 3.4 (PMOD Technologies, Zurich, Switzerland). The time‐activity curves were fit using the two‐tissue compartment model to provide an estimate of the value of the constants, K1* (mL/cm3/min), k2* (1/min), k3* (1/min), and k4* (1/min) [Sokoloff et al., 1977]. K1* and k2* were defined as the rate constants for the transport from the plasma to the tissue and the transport in the reverse route, respectively; k3* and k4* represented the rate constants for phosphorylation and dephosphorylation, respectively. The dephosphorylation is so slow that k4* was fixed at zero. Then, the CMRglc (μmol/min/100 g) was calculated as CMRglc = (PG/LC) × Ki*, where PG (mmol/L) is the mean PG level during the PET scanning period and LC is the lumped constant accounting for the uptake difference between 18F‐FDG and glucose. Ki* (mL/cm3/min) is the net clearance of 18F‐FDG, and was calculated as Ki* = K1* × k3*/(k2* + k3*) [Kuwabara et al., 1990]. The LC, which decreases with increasing PG levels [Dienel et al., 1991; Schuier et al., 1990], was calculated as LC = (k3*/k3) + [(K1*/K1)–(k3*/k3)] × (Ki*/K1*), where K1 and k3 are the rate constants of glucose [Hasselbalch et al., 1998]. We set the value of the transport coefficient (K1*/K1) at 1.48 and that of the phosphorylation coefficient (k3*/k3) at 0.39, as described in previous studies [Hasselbalch et al., 1996, 1998, 2001].
Voxelwise kinetic analysis was then performed on each voxel using PMOD PXMOD version 3.4. The Ki* maps were generated from the time‐activity curves of the PET and blood data on a voxel‐by‐voxel basis in the native space, using the Patlak graphical plot [Patlak and Blasberg, 1985], because the estimation of the values of K1*, k2*, and k3* on a voxel‐by‐voxel basis using the two‐tissue compartment model is technically unstable. The linear regression in the model was estimated using the data obtained from 30 min after the injection of 18F‐FDG. The slope of its linear segment equals the influx constant, Ki*, of the two‐tissue compartment model, and was used to calculate the CMRglc as described above. After the Ki* map of each subject was multiplied with their PG levels and divided by their global brain LC, which was obtained by VOI analysis, the CMRglc map was finally completed in the native space.
Data Analysis and Statistical Analysis
The VOI analysis was performed to assess the effect of glucose loading on glucose metabolism in the brain. We tested the differences in the CMRglc between the fasting and glucose‐loading conditions using a two‐tailed, paired t‐test using the SPSS software (IBM, Armonk, NY). The statistical significance was set at P < 0.05.
The absolute measurement of the CMRglc in VOI analysis is known to have relatively high intersubject variability [Heiss et al., 1984; Maquet et al., 1990; Tyler et al., 1988; Wang et al., 1994], which may reduce the statistical power. In order to overcome this potential problem in VOI analysis, exploratory voxelwise analysis was performed using the normalized CMRglc values, which have smaller intersubject variability compared to the absolute values [Wang et al., 1994] and may hence increase the statistical power. We focused on identifying significant regions in the cortical area where glucose loading can decrease glucose metabolism. The CMRglc maps were transformed into the MNI space from the native space using MRI‐guided spatial normalization (FSL FNIRT) [Jenkinson et al., 2012]. The whole cerebral cortex in each of the CMRglc maps was masked with the MNI structural atlas (Fig. 1G,H). Then, the mean value within the masked voxels was set to 100, and thus, the whole cerebral cortex was used as a reference region. After applying a Gaussian kernel with a sigma of 8 mm, the normalized CMRglc map was finally completed. Then, we tested the differences between the fasting and glucose‐loading conditions with a paired t‐test, using Statistical Parametric Mapping version 12 (SPM12; Wellcome Trust Center for Neuroscience, London, UK) implemented in MATLAB version R2014a (MathWorks, Natick, MA). A statistical t‐map of the “fasting condition: 1 and glucose‐loading condition: −1” contrast was calculated. To control type I error, the correction for multiple comparisons was performed on the statistical map using the AFNI's 3dClustSim program, which computes the probability of false positive (noise‐only) clusters (https://afni.nimh.nih.gov/pub/dist/doc/program_help/3dClustSim.html: accessed March 20, 2016). The corrected significance level was set at P < 0.05 with a cluster size threshold of 3707 voxels and a per‐voxel height threshold of P < 0.05.
RESULTS
The PG and insulin levels in the fasting and glucose‐loading conditions for the 12 subjects (Table 1) confirm that all subjects were free of insulin resistance and diabetes [Keskin et al., 2005]. After glucose loading, there were significant increases in the PG (P < 0.001, T = 6.25) and insulin (P = 0.001, T = 4.26) levels, using a two‐tailed paired t‐test.
Table 1.
Plasma glucose and insulin levels of the 12 subjects
| Subject | Age (years) | Sex | HbA1C (%) | Fasting | Glucose loading | |||
|---|---|---|---|---|---|---|---|---|
| Glucose | Insulin | Glucose | Insulin | |||||
| (mmol/L) | (μU/mL) | HOMA‐IR | (mmol/L) | (μU/mL) | ||||
| 1 | 22 | M | 5.2 | 5.36 | 7.0 | 1.67 | 7.08 | 137.8 |
| 2 | 27 | M | 5 | 5.44 | 6.1 | 1.48 | 6.11 | 48.8 |
| 3 | 28 | F | 5.2 | 5.14 | 0.4 | 0.09 | 8.06 | 18.6 |
| 4 | 21 | M | 5.1 | 5.06 | 2.2 | 0.49 | 6.72 | 24.2 |
| 5 | 32 | M | 5.3 | 5.25 | 8.5 | 1.98 | 6.97 | 65.4 |
| 6 | 20 | F | 4.8 | 4.36 | 3.7 | 0.72 | 6.19 | 29.1 |
| 7 | 28 | M | 4.9 | 5.50 | 5.4 | 1.32 | 6.44 | 46.3 |
| 8 | 20 | F | 5.1 | 5.14 | 6.1 | 1.39 | 8.42 | 58.3 |
| 9 | 27 | F | 4.5 | 4.69 | 3.5 | 0.73 | 8.94 | 66.7 |
| 10 | 25 | M | 5.2 | 4.92 | 4.0 | 0.87 | 9.42 | 23.6 |
| 11 | 25 | F | 4.8 | 5.53 | 6.8 | 1.67 | 6.86 | 13.2 |
| 12 | 29 | F | 5 | 4.97 | 6.7 | 1.48 | 6.89 | 22.8 |
HOMA‐IR: Homeostasis model assessment of Insulin Resistance.
The time‐activity curves and the kinetic parameters of the whole brain are shown in Figure 2 and Table 2, respectively. On glucose loading, the global brain radioactivity levels decreased obviously, and there were significant reductions in the values of the constants, K1* (P < 0.001), k3* (P < 0.001), Ki* (P < 0.001), and LC (P < 0.001), but not in that of k2* (P = 0.14). These differences in the kinetic parameters between the two conditions were consistent with those reported by a previous, related study in humans [Hasselbalch et al., 2001].
Figure 2.
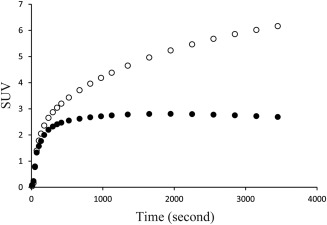
Averaged global brain time‐activity curves. The radioactivity level was normalized using the standardized uptake value (SUV) using the formula: SUV = 18F‐FDG image (Bq/mL) × body weight (g)/injected dose (Bq). The open and solid circles represent the fasting and glucose‐loading conditions, respectively.
Table 2.
Rate constants and lumped constants in the whole brain
| Fasting | Glucose loading | T value | P value | |||
|---|---|---|---|---|---|---|
| mean | SD | mean | SD | |||
| K1* (mL/cm3/min) | 0.096 | 0.008 | 0.082 | 0.009 | 6.71 | <0.001 |
| k2* (1/min) | 0.104 | 0.014 | 0.117 | 0.024 | 1.60 | 0.14 |
| k3* (1/min) | 0.054 | 0.007 | 0.038 | 0.007 | 8.57 | <0.001 |
| Ki* (mL/cm3/min) | 0.033 | 0.004 | 0.020 | 0.004 | 7.49 | <0.001 |
| Lumped constant | 0.766 | 0.048 | 0.659 | 0.039 | 6.34 | <0.001 |
K1* and k2* are the rate constants for the transport from the plasma to the tissue and the reverse transport in the two‐tissue compartment model for 18F‐FDG, respectively, whereas k3* represents the rate constant for phosphorylation. The lumped constant (LC) was determined using LC = (k3*/k3) + [(K1*/K1) ‐ (k3*/k3)] × (Ki*/K1*), where K1 and k3 are the rate constants in the two‐tissue compartment model for glucose. The values for K1*/K1 and k3*/k3 were set at 1.48 and 0.39, respectively [Hasselbalch et al., 1996, 1998, 2001]. The T and P values were calculated using a two‐tailed paired t‐test for comparing the variables between the fasting and glucose‐loading conditions. SD: standard deviation.
The results of the VOI analysis are shown in Table 3. No significant differences in the CMRglc between the fasting and glucose‐loading conditions were found in the dorsal DMN (P = 0.67), ventral DMN (P = 0.62), whole DMN (P = 0.65), precuneus/posterior cingulate (P = 0.73), frontal cortex (P = 0.51), occipital cortex (P = 0.62), parietal cortex (P = 0.58), temporal cortex (P = 0.64), cerebellum (P = 0.67), or global brain (P = 0.59).
Table 3.
Comparison of the cerebral metabolic rates of glucose between the fasting and glucose‐loading conditions
| Fasting | Glucose loading | T value | P value | |||||
|---|---|---|---|---|---|---|---|---|
| Mean | SD | CV | mean | SD | CV | |||
| Dorsal DMN | 27.9 | 2.3 | 0.08 | 28.4 | 4.7 | 0.17 | 0.43 | 0.67 |
| Ventral DMN | 26.9 | 1.8 | 0.07 | 27.5 | 4.1 | 0.15 | 0.52 | 0.62 |
| Whole DMN | 27.6 | 2.1 | 0.08 | 28.1 | 4.5 | 0.16 | 0.47 | 0.65 |
| Precuneus/posterior cingulate | 32.7 | 2.8 | 0.08 | 33.3 | 6.0 | 0.18 | 0.35 | 0.73 |
| Frontal cortex | 26.3 | 2.1 | 0.08 | 27.0 | 4.2 | 0.15 | 0.68 | 0.51 |
| Occipital cortex | 28.8 | 2.0 | 0.07 | 29.4 | 4.7 | 0.16 | 0.51 | 0.62 |
| Parietal cortex | 26.7 | 1.8 | 0.07 | 27.3 | 4.3 | 0.16 | 0.58 | 0.58 |
| Temporal cortex | 23.8 | 1.9 | 0.08 | 24.3 | 4.0 | 0.16 | 0.49 | 0.64 |
| Cerebellum | 25.0 | 2.3 | 0.09 | 25.5 | 4.9 | 0.19 | 0.44 | 0.67 |
| Global brain | 21.8 | 1.4 | 0.06 | 22.3 | 3.6 | 0.16 | 0.56 | 0.59 |
The values are in μmol per 100 g/min.
The whole DMN was created by combining the dorsal and ventral DMN.
The T and P values were calculated using a two‐tailed paired t‐test for comparing the variables between the fasting and glucose‐loading conditions.
The CV was calculated by SD/mean.
CV: coefficient of variance; SD: standard deviation; DMN: default mode network.
Exploratory voxelwise analysis revealed two clusters within the cerebral cortex at a threshold of corrected P < 0.05, where glucose loading decreased the CMRglc (Fig. 3A). These clusters were located in the precuneus, posterior cingulate, lateral parietotemporal, and medial prefrontal areas (Fig. 3B), and considerably overlapped with the main components of the DMN (Fig. 3C).
Figure 3.
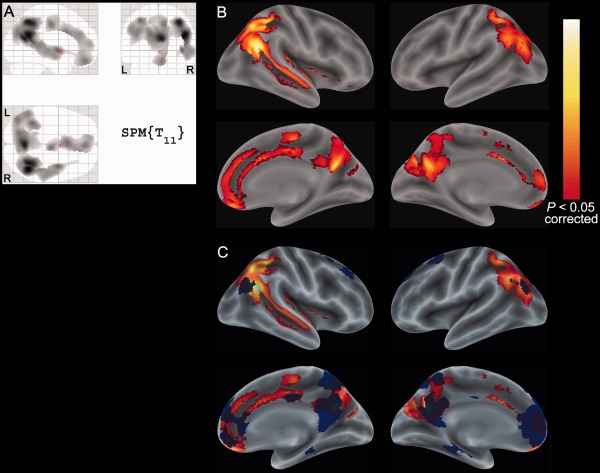
Significant clusters showing the reduced CMRglc upon glucose loading in the voxelwise analysis. Two significant clusters at a threshold of corrected P < 0.05 are displayed on the SPM glass brain (A), and on the rendered brain surface in the MNI space (B) using an SPM extension tool, bspmview (http://www.bobspunt.com/bspmview/: accessed March 20, 2016). The clusters are overlaid with the volume‐of‐interest for the whole default mode network, depicted in blue (C). The hot scale represents the magnitude of the P values. R: right, L: left; CMRglc: cerebral metabolic rates of glucose; MNI: Montreal Neurological Institute; SPM: Statistical Parametric Mapping.
DISCUSSION
The primary objective of this study was to investigate the influence of glucose loading on the CMRglc in healthy subjects using 18F‐FDG PET. We compared the CMRglc between the fasting and glucose‐loading conditions to determine whether any region of the brain showed statistically significant change. Although VOI analysis revealed no significant differences in any region, voxelwise analysis identified the precuneus, posterior cingulate, lateral parietotemporal, and medial prefrontal areas where the CMRglc in the glucose‐loading condition was significantly lower than that in the fasting condition. The inconsistency in the results could be because of the difference in the variability of the CMRglc between the two analyses. The absolute measurement of the CMRglc is known to have higher intersubject and intrasubject variability of the CMRglc, compared to the normalized CMRglc values obtained using an area specified by the investigator as the reference region [Wang et al., 1994]. Additionally, applying smoothing might enhance the statistical power [Friston et al., 1994; Sacchet and Knutson, 2013]. When the coefficient of variance (CV), which is calculated as standard deviation/mean, was used as an index of the intersubject variability in an area of the brain, VOI analysis showed that the CVs of the absolute CMRglc values were 0.06–0.09 and 0.15–0.19 in the fasting and glucose‐loading conditions, respectively (Table 3). On the other hand, the CVs of the normalized CMRglc values in the significant clusters shown in Figure 3 were 0.016 and 0.020 in the fasting and glucose‐loading conditions, respectively. In this respect, our findings suggest that, although glucose loading induces a significant reduction in glucose metabolism, the magnitude of the difference in the CMRglc between the two conditions is relatively small.
In experimental studies with rats, it was found that the CMRglc was unaffected by the induction of hyperglycemia [Brondsted and Gjedde, 1990; Duckrow and Bryan, 1987; Orzi et al., 1988]. A dynamic 18F‐FDG PET study in humans by Hasselbalch et al. showed no change in the CMRglc between the normoglycemic and hyperglycemic conditions in six young healthy subjects [Hasselbalch et al., 2001]. The estimation of the CMRglc in 18F‐FDG PET can vary depending on the LC because the CMRglc is defined as Ki* × PG/LC, as described in the methods section. In order to compare the findings of our study to those of the study by Hasselbalch et al., we adopted their methods for the calculation of the LC in the two‐tissue compartment model. Based on the results of the VOI analysis, the values of the LC and the CMRglc in our study (Tables II and III) were comparable to those in their study. Thus, in line with the results of the previous animal and human studies, the VOI analysis in our study was unable to demonstrate the changes in the CMRglc in any of the cortical regions or in the whole brain upon glucose loading. To our knowledge, voxelwise analysis has not been performed to assess the relationship between glucose metabolism and PG levels in the brain. Although further studies are required for their corroboration, our findings from the voxelwise analysis are important to understand the physiological effects of hyperglycemia on cerebral metabolism and its function.
The precuneus, posterior cingulate, lateral parietotemporal, and medial prefrontal regions are known to be the main components of the DMN. Thus, Figure 3 is surprisingly similar to the functional anatomy of the DMN, which is characterized by high activity when the mind is not engaged in specific behavioral tasks, and low activity during focused attention on the external environment [Anticevic et al., 2012; Raichle, 2015]. While performing a wide variety of active tasks including novel, non‐self‐referential, and goal‐directed tasks, the DMN consistently decreases its activity [Shulman et al., 1997]. Interestingly, some studies with fMRI recently showed that the resting‐state functional connectivity was altered in patients with diabetes whose PG and HbA1C levels were around 8–9 mmol/L and 7–9%, respectively, and suggested that diabetes might decrease the activity of the DMN‐related regions [Chen et al., 2014; Musen et al., 2012; Zhou et al., 2010]. Based on these lines of evidence, Figure 3 might indicate that the activity in the main components of the DMN was decreased on glucose loading, leading to the appearance of the AD‐like pattern, similar to the DMN‐like pattern.
The DMN plays an important role in regulating complex cognition and behavior [Fransson and Marrelec, 2008; Raichle et al., 2001; Utevsky et al., 2014]. Its functional connectivity is impaired in patients with AD and asymptomatic older individuals with Aβ accumulation [Sperling et al., 2009]. Its impairment becomes worse with disease progression [Zhu et al., 2013], and is associated with the current and future cognitive decline [Wang et al., 2013], suggesting that reduced activity in the DMN‐related regions is associated with cognitive decline in patients with AD. The precuneus and posterior cingulate regions comprise the functional core of the DMN [Cavanna and Trimble, 2006; Fransson and Marrelec, 2008; Utevsky et al., 2014], and are also pivotal for the pathology of AD. These regions exhibit glucose hypometabolism, which is a hallmark of early AD [Friedland et al., 1983; Sperling et al., 2011], and are vulnerable to Aβ deposition [Knudsen et al., 2004]. Additionally, the DMN‐related regions are known to overlap with the AD‐related regions [Sperling et al., 2009]. Therefore, considering the close relationship between the DMN and AD, and that between the DMN and diabetes as described above, it is fitting to infer that glucose loading induces hypometabolism in the AD‐related regions as well as the DMN‐related ones.
Voxelwise analysis showed that glucose loading can induce hypometabolism in the precuneus, posterior cingulate and lateral parietal regions, which are also identified as hypometabolic in patients with AD. It should be noted that the magnitude of the reduction between the two situations (i.e., glucose loading and AD) is quite different. When dynamic 18F‐FDG PET was performed on patients with AD whose Mini‐Mental State Examination (MMSE) scores were around 18, the CMRglc in the patients was found to be roughly 60% of controls [Piert et al., 1996]. However, the results of our study showed that the difference in the normalized values of the CMRglc in the significant clusters between the fasting and glucose‐loading conditions was less than 5%. When static 18F‐FDG PET with no arterial blood sampling was performed on patients with AD whose MMSE scores were around 20, 18F‐FDG uptake (not the CMRglc) in the AD‐related regions was decreased by roughly 25% compared to that in the control subjects [Ishibashi et al., 2015b]. On the other hand, the decrease in the uptake of 18F‐FDG was reported to be less than 10% in subjects with mildly increased PG levels [Burns et al., 2013] or those in glucose‐loading condition [Ishibashi et al., 2015a], compared to that in the control subjects. This considerable difference in the magnitude of reduction between the patients with AD and the subjects with high PG levels can be explained by the fact that glucose hypometabolism in patients with AD becomes progressively worse and represents a pathological and irreversible disease status [Langbaum et al., 2009], whereas glucose hypometabolism or reduced 18F‐FDG uptake observed with high PG levels might be reversible, physiological variation [Ishibashi et al., 2014, 2016], possibly reflecting the changes in the functional connectivity of the DMN and the activity of the DMN‐related regions. Another explanation is that there may be variation in the cerebral microvascular landscape, depending on the age and health status of subjects. Patients with AD demonstrate cerebral microvascular degeneration, including disruption of the basement membrane and blood‐brain barrier, reductions in glucose transport and impaired regulation of blood flow [Lai et al., 2015; Winkler et al., 2015], which may reduce cerebral glucose metabolism and 18F‐FDG uptake.
CONCLUSION
The results of the voxelwise analysis indicate that glucose loading can reduce glucose metabolism in the precuneus, posterior cingulate, lateral parietotemporal, and medial prefrontal areas, which include the representative components of both the DMN and AD pathology. Taken together with the previous knowledge on the relationship between the DMN and AD, and that between the DMN and diabetes, it is reasonable to infer that glucose loading induces hypometabolism in the AD‐related and DMN‐related regions.
AUTHOR CONTRIBUTIONS
K.Ishibashi and K.Ishii designed of the study. KIshibashi, K.W. and K.Ishii obtained the data. K.Ishibashi carried out the data processing. K.Ishibashi, K.W., K.Ishiwata, K.Ishii interpreted the data, and drafted and revised the manuscript. All authors read and approved the final manuscript. K.Ishibashi is the guarantor of this work and, as such, had full access to all the data in the study and takes responsibility for the integrity of the data and the accuracy of the data analysis.
CONFLICT OF INTEREST
No potential conflicts of interest relevant to this article were reported.
ACKNOWLEDGMENT
The authors thank the people of Research Team for Neuroimaging at the Tokyo Metropolitan Institute of Gerontology for their technical assistance.
REFERENCES
- Anticevic A, Cole MW, Murray JD, Corlett PR, Wang XJ, Krystal JH (2012): The role of default network deactivation in cognition and disease. Trends Cogn Sci 16:584–592. [DOI] [PMC free article] [PubMed] [Google Scholar]
- Baker LD, Cross DJ, Minoshima S, Belongia D, Watson GS, Craft S (2011): Insulin resistance and Alzheimer‐like reductions in regional cerebral glucose metabolism for cognitively normal adults with prediabetes or early type 2 diabetes. Arch Neurol 68:51–57. [DOI] [PMC free article] [PubMed] [Google Scholar]
- Brondsted HE, Gjedde A (1990): Glucose phosphorylation rate in rat parietal cortex during normoglycemia, hypoglycemia, acute hyperglycemia, and in diabetes‐prone rats. Acta Neurol Scand 81:233–236. [DOI] [PubMed] [Google Scholar]
- Burns CM, Chen K, Kaszniak AW, Lee W, Alexander GE, Bandy D, Fleisher AS, Caselli RJ, Reiman EM (2013): Higher serum glucose levels are associated with cerebral hypometabolism in Alzheimer regions. Neurology 80:1557–1564. [DOI] [PMC free article] [PubMed] [Google Scholar]
- Cavanna AE, Trimble MR (2006): The precuneus: A review of its functional anatomy and behavioural correlates. Brain: A J Neurol 129:564–583. [DOI] [PubMed] [Google Scholar]
- Chen YC, Jiao Y, Cui Y, Shang SA, Ding J, Feng Y, Song W, Ju SH, Teng GJ (2014): Aberrant brain functional connectivity related to insulin resistance in type 2 diabetes: a resting‐state fMRI study. Diabetes Care 37:1689–1696. [DOI] [PubMed] [Google Scholar]
- Cui Y, Jiao Y, Chen YC, Wang K, Gao B, Wen S, Ju S, Teng GJ (2014): Altered spontaneous brain activity in type 2 diabetes: a resting‐state functional MRI study. Diabetes 63:749–760. [DOI] [PubMed] [Google Scholar]
- Dienel GA, Cruz NF, Mori K, Holden JE, Sokoloff L (1991): Direct measurement of the lambda of the lumped constant of the deoxyglucose method in rat brain: determination of lambda and lumped constant from tissue glucose concentration or equilibrium brain/plasma distribution ratio for methylglucose. J Cereb Blood Flow Metab 11:25–34. [DOI] [PubMed] [Google Scholar]
- Duckrow RB, Bryan RM Jr (1987): Regional cerebral glucose utilization during hyperglycemia. J Neurochem 48:989–993. [DOI] [PubMed] [Google Scholar]
- Fransson P, Marrelec G (2008): The precuneus/posterior cingulate cortex plays a pivotal role in the default mode network: Evidence from a partial correlation network analysis. NeuroImage 42:1178–1184. [DOI] [PubMed] [Google Scholar]
- Friedland RP, Budinger TF, Ganz E, Yano Y, Mathis CA, Koss B, Ober BA, Huesman RH, Derenzo SE (1983): Regional cerebral metabolic alterations in dementia of the Alzheimer type: Positron emission tomography with [18F]fluorodeoxyglucose. J Comput Assist Tomogr 7:590–598. [DOI] [PubMed] [Google Scholar]
- Friston KJ, Worsley KJ, Frackowiak RS, Mazziotta JC, Evans AC (1994): Assessing the significance of focal activations using their spatial extent. Human Brain Mapp 1:210–220. [DOI] [PubMed] [Google Scholar]
- Hasselbalch SG, Knudsen GM, Holm S, Hageman LP, Capaldo B, Paulson OB (1996): Transport of D‐glucose and 2‐fluorodeoxyglucose across the blood‐brain barrier in humans. J Cereb Blood Flow Metab 16:659–666. [DOI] [PubMed] [Google Scholar]
- Hasselbalch SG, Madsen PL, Knudsen GM, Holm S, Paulson OB (1998): Calculation of the FDG lumped constant by simultaneous measurements of global glucose and FDG metabolism in humans. J Cereb Blood Flow Metab 18:154–160. [DOI] [PubMed] [Google Scholar]
- Hasselbalch SG, Knudsen GM, Capaldo B, Postiglione A, Paulson OB (2001): Blood‐brain barrier transport and brain metabolism of glucose during acute hyperglycemia in humans. J Clin Endocrinol Metab 86:1986–1990. [DOI] [PubMed] [Google Scholar]
- Heiss WD, Pawlik G, Herholz K, Wagner R, Goldner H, Wienhard K (1984): Regional kinetic constants and cerebral metabolic rate for glucose in normal human volunteers determined by dynamic positron emission tomography of [18F]‐2‐fluoro‐2‐deoxy‐D‐glucose. J Cereb Blood Flow Metab 4:212–223. [DOI] [PubMed] [Google Scholar]
- Ishibashi K, Robertson CL, Mandelkern MA, Morgan AT, London ED (2013): The simplified reference tissue model with 18F‐fallypride positron emission tomography: Choice of reference region. Mol Imaging 12 http://www.ncbi.nlm.nih.gov/pubmed/24447617. [DOI] [PMC free article] [PubMed] [Google Scholar]
- Ishibashi K, Miura Y, Oda K, Ishiwata K, Ishii K (2014): Alzheimer's disease‐like pattern of (18)F‐FDG uptake during a hyperglycemic state and negative (11)C‐PiB binding in a patient with mild cognitive impairment. J Alzheimers Dis 42:385–389. [DOI] [PubMed] [Google Scholar]
- Ishibashi K, Kawasaki K, Ishiwata K, Ishii K (2015a): Reduced uptake of F‐FDG and O‐HO in Alzheimer's disease‐related regions after glucose loading. J Cereb Blood Flow Metab 35:1380–1385. [DOI] [PMC free article] [PubMed] [Google Scholar]
- Ishibashi K, Onishi A, Fujiwara Y, Ishiwata K, Ishii K (2015b): Relationship between Alzheimer disease‐like pattern of 18F‐FDG and fasting plasma glucose levels in cognitively normal volunteers. J Nucl Med 56:229–233. [DOI] [PubMed] [Google Scholar]
- Ishibashi K, Onishi A, Fujiwara Y, Ishiwata K, Ishii K (2016): Plasma glucose levels affect cerebral 18F‐FDG distribution in cognitively normal subjects with diabetes. Clin Nucl Med 2016. http://www.ncbi.nlm.nih.gov/pubmed/26859211. [DOI] [PubMed] [Google Scholar]
- Jenkinson M, Smith S (2001): A global optimisation method for robust affine registration of brain images. Med Image Anal 5:143–156. [DOI] [PubMed] [Google Scholar]
- Jenkinson M, Bannister P, Brady M, Smith S (2002): Improved optimization for the robust and accurate linear registration and motion correction of brain images. NeuroImage 17:825–841. [DOI] [PubMed] [Google Scholar]
- Jenkinson M, Beckmann CF, Behrens TE, Woolrich MW, Smith SM (2012): Fsl. NeuroImage 62:782–790. [DOI] [PubMed] [Google Scholar]
- Kawasaki K, Ishii K, Saito Y, Oda K, Kimura Y, Ishiwata K (2008): Influence of mild hyperglycemia on cerebral FDG distribution patterns calculated by statistical parametric mapping. Ann Nucl Med 22:191–200. [DOI] [PubMed] [Google Scholar]
- Keskin M, Kurtoglu S, Kendirci M, Atabek ME, Yazici C (2005): Homeostasis model assessment is more reliable than the fasting glucose/insulin ratio and quantitative insulin sensitivity check index for assessing insulin resistance among obese children and adolescents. Pediatrics 115:e500–e503. [DOI] [PubMed] [Google Scholar]
- Knudsen GM, Karlsborg M, Thomsen G, Krabbe K, Regeur L, Nygaard T, Videbaek C, Werdelin L (2004): Imaging of dopamine transporters and D2 receptors in patients with Parkinson's disease and multiple system atrophy. Eur J Nucl Med Mol Imaging 31:1631–1638. [DOI] [PubMed] [Google Scholar]
- Kuwabara H, Evans AC, Gjedde A (1990): Michaelis‐Menten constraints improved cerebral glucose metabolism and regional lumped constant measurements with [18F]fluorodeoxyglucose. J Cereb Blood Flow Metab 10:180–189. [DOI] [PubMed] [Google Scholar]
- Lai AY, Dorr A, Thomason LA, Koletar MM, Sled JG, Stefanovic B, McLaurin J (2015): Venular degeneration leads to vascular dysfunction in a transgenic model of Alzheimer's disease. Brain: A J Neurol 138:1046–1058. [DOI] [PubMed] [Google Scholar]
- Langbaum JB, Chen K, Lee W, Reschke C, Bandy D, Fleisher AS, Alexander GE, Foster NL, Weiner MW, Koeppe RA, Jagust WJ, Reiman EM, Alzheimer's Disease Neuroimaging, I (2009): Categorical and correlational analyses of baseline fluorodeoxyglucose positron emission tomography images from the Alzheimer's Disease Neuroimaging Initiative (ADNI). NeuroImage 45:1107–1116. [DOI] [PMC free article] [PubMed] [Google Scholar]
- Maquet P, Dive D, Salmon E, von Frenckel R, Franck G (1990): Reproducibility of cerebral glucose utilization measured by PET and the [18F]‐2‐fluoro‐2‐deoxy‐d‐glucose method in resting, healthy human subjects. Eur J Nucl Med 16:267–273. [DOI] [PubMed] [Google Scholar]
- Musen G, Jacobson AM, Bolo NR, Simonson DC, Shenton ME, McCartney RL, Flores VL, Hoogenboom WS (2012): Resting‐state brain functional connectivity is altered in type 2 diabetes. Diabetes 61:2375–2379. [DOI] [PMC free article] [PubMed] [Google Scholar]
- Orzi F, Lucignani G, Dow‐Edwards D, Namba H, Nehlig A, Patlak CS, Pettigrew K, Schuier F, Sokoloff L (1988): Local cerebral glucose utilization in controlled graded levels of hyperglycemia in the conscious rat. J Cereb Blood Flow Metab 8:346–356. [DOI] [PubMed] [Google Scholar]
- Patlak CS, Blasberg RG (1985): Graphical evaluation of blood‐to‐brain transfer constants from multiple‐time uptake data. Generalizations. J Cereb Blood Flow Metab 5:584–590. [DOI] [PubMed] [Google Scholar]
- Patwardhan MB, McCrory DC, Matchar DB, Samsa GP, Rutschmann OT (2004): Alzheimer disease: Operating characteristics of PET–a meta‐analysis. Radiology 231:73–80. [DOI] [PubMed] [Google Scholar]
- Piert M, Koeppe RA, Giordani B, Berent S, Kuhl DE (1996): Diminished glucose transport and phosphorylation in Alzheimer's disease determined by dynamic FDG‐PET. J Nucl Med 37:201–208. [PubMed] [Google Scholar]
- Raichle ME (2015): The brain's default mode network. Annu Rev Neurosci 38:433–447. [DOI] [PubMed] [Google Scholar]
- Raichle ME, MacLeod AM, Snyder AZ, Powers WJ, Gusnard DA, Shulman GL (2001): A default mode of brain function. Proc Natl Acad Sci USA 98:676–682. [DOI] [PMC free article] [PubMed] [Google Scholar]
- Sacchet MD, Knutson B (2013): Spatial smoothing systematically biases the localization of reward‐related brain activity. NeuroImage 66:270–277. [DOI] [PMC free article] [PubMed] [Google Scholar]
- Schuier F, Orzi F, Suda S, Lucignani G, Kennedy C, Sokoloff L (1990): Influence of plasma glucose concentration on lumped constant of the deoxyglucose method: Effects of hyperglycemia in the rat. J Cereb Blood Flow Metab 10:765–773. [DOI] [PubMed] [Google Scholar]
- Shirer WR, Ryali S, Rykhlevskaia E, Menon V, Greicius MD (2012): Decoding subject‐driven cognitive states with whole‐brain connectivity patterns. Cereb Cortex 22:158–165. [DOI] [PMC free article] [PubMed] [Google Scholar]
- Shulman GL, Corbetta M, Fiez JA, Buckner RL, Miezin FM, Raichle ME, Petersen SE (1997): Searching for activations that generalize over tasks. Hum Brain Mapp 5:317–322. [DOI] [PubMed] [Google Scholar]
- Silverman DH, Small GW, Chang CY, Lu CS, Kung De Aburto MA, Chen W, Czernin J, Rapoport SI, Pietrini P, Alexander GE, Schapiro MB, Jagust WJ, Hoffman JM, Welsh‐Bohmer KA, Alavi A, Clark CM, Salmon E, de Leon MJ, Mielke R, Cummings JL, Kowell AP, Gambhir SS, Hoh CK, Phelps ME (2001): Positron emission tomography in evaluation of dementia: Regional brain metabolism and long‐term outcome. JAMA 286:2120–2127. [DOI] [PubMed] [Google Scholar]
- Sokoloff L, Reivich M, Kennedy C, Des Rosiers MH, Patlak CS, Pettigrew KD, Sakurada O, Shinohara M (1977): The [14C]deoxyglucose method for the measurement of local cerebral glucose utilization: Theory, procedure, and normal values in the conscious and anesthetized albino rat. J Neurochem 28:897–916. [DOI] [PubMed] [Google Scholar]
- Sperling RA, Laviolette PS, O'Keefe K, O'Brien J, Rentz DM, Pihlajamaki M, Marshall G, Hyman BT, Selkoe DJ, Hedden T, Buckner RL, Becker JA, Johnson KA (2009): Amyloid deposition is associated with impaired default network function in older persons without dementia. Neuron 63:178–188. [DOI] [PMC free article] [PubMed] [Google Scholar]
- Sperling RA, Aisen PS, Beckett LA, Bennett DA, Craft S, Fagan AM, Iwatsubo T, Jack CR, Jr , Kaye J, Montine TJ, Park DC, Reiman EM, Rowe CC, Siemers E, Stern Y, Yaffe K, Carrillo MC, Thies B, Morrison‐Bogorad M, Wagster MV, Phelps CH (2011): Toward defining the preclinical stages of Alzheimer's disease: Recommendations from the National Institute on Aging‐Alzheimer's Association workgroups on diagnostic guidelines for Alzheimer's disease. Alzheimers Dement 7:280–292. [DOI] [PMC free article] [PubMed] [Google Scholar]
- Tyler JL, Strother SC, Zatorre RJ, Alivisatos B, Worsley KJ, Diksic M, Yamamoto YL (1988): Stability of regional cerebral glucose metabolism in the normal brain measured by positron emission tomography. J Nucl Med 29:631–642. [PubMed] [Google Scholar]
- Utevsky AV, Smith DV, Huettel SA (2014): Precuneus is a functional core of the default‐mode network. J Neurosci 34:932–940. [DOI] [PMC free article] [PubMed] [Google Scholar]
- Wang GJ, Volkow ND, Wolf AP, Brodie JD, Hitzemann RJ (1994): Intersubject variability of brain glucose metabolic measurements in young normal males. J Nucl Med 35:1457–1466. [PubMed] [Google Scholar]
- Wang L, Brier MR, Snyder AZ, Thomas JB, Fagan AM, Xiong C, Benzinger TL, Holtzman DM, Morris JC, Ances BM (2013): Cerebrospinal fluid Abeta42, phosphorylated Tau181, and resting‐state functional connectivity. JAMA Neurol 70:1242–1248. [DOI] [PMC free article] [PubMed] [Google Scholar]
- Willette AA, Modanlo N, Kapogiannis D, Alzheimer's Disease Neuroimaging I (2015): Insulin resistance predicts medial temporal hypermetabolism in mild cognitive impairment conversion to Alzheimer disease. Diabetes 64:1933–1940. [DOI] [PMC free article] [PubMed] [Google Scholar]
- Winkler EA, Nishida Y, Sagare AP, Rege SV, Bell RD, Perlmutter D, Sengillo JD, Hillman S, Kong P, Nelson AR, Sullivan JS, Zhao Z, Meiselman HJ, Wenby RB, Soto J, Abel ED, Makshanoff J, Zuniga E, De Vivo DC, Zlokovic BV (2015): GLUT1 reductions exacerbate Alzheimer's disease vasculo‐neuronal dysfunction and degeneration. Nat Neurosci 18:521–530. [DOI] [PMC free article] [PubMed] [Google Scholar]
- Xia W, Wang S, Rao H, Spaeth AM, Wang P, Yang Y, Huang R, Cai R, Sun H (2015): Disrupted resting‐state attentional networks in T2DM patients. Sci Rep 5:11148. [DOI] [PMC free article] [PubMed] [Google Scholar]
- Zhang Y, Brady M, Smith S (2001): Segmentation of brain MR images through a hidden Markov random field model and the expectation‐maximization algorithm. IEEE Trans Med Imaging 20:45–57. [DOI] [PubMed] [Google Scholar]
- Zhou H, Lu W, Shi Y, Bai F, Chang J, Yuan Y, Teng G, Zhang Z (2010): Impairments in cognition and resting‐state connectivity of the hippocampus in elderly subjects with type 2 diabetes. Neurosci Lett 473:5–10. [DOI] [PubMed] [Google Scholar]
- Zhu DC, Majumdar S, Korolev IO, Berger KL, Bozoki AC (2013): Alzheimer's disease and amnestic mild cognitive impairment weaken connections within the default‐mode network: A multi‐modal imaging study. J Alzheimers Dis 34:969–984. [DOI] [PubMed] [Google Scholar]