

Abstract
Objectives
Our aim is to assess the subfield‐specific histopathological correlates of hippocampal volume and intensity changes (T1, T2) as well as diff!usion MRI markers in TLE, and investigate the efficacy of quantitative MRI measures in predicting histopathology in vivo.
Experimental Design
We correlated in vivo volumetry, T2 signal, quantitative T1 mapping, as well as diffusion MRI parameters with histological features of hippocampal sclerosis in a subfield‐specific manner. We made use of on an advanced co‐registration pipeline that provided a seamless integration of preoperative 3 T MRI with postoperative histopathological data, on which metrics of cell loss and gliosis were quantitatively assessed in CA1, CA2/3, and CA4/DG.
Principal Observations
MRI volumes across all subfields were positively correlated with neuronal density and size. Higher T2 intensity related to increased GFAP fraction in CA1, while quantitative T1 and diffusion MRI parameters showed negative correlations with neuronal density in CA4 and DG. Multiple linear regression analysis revealed that in vivo multiparametric MRI can predict neuronal loss in all the analyzed subfields with up to 90% accuracy.
Conclusion
Our results, based on an accurate co‐registration pipeline and a subfield‐specific analysis of MRI and histology, demonstrate the potential of MRI volumetry, diffusion, and quantitative T1 as accurate in vivo biomarkers of hippocampal pathology. Hum Brain Mapp 37:1103–1119, 2016. © 2015 Wiley Periodicals, Inc.
Keywords: DTI, hippocampal sclerosis, hippocampal subfields, histology, MRI, temporal lobe epilepsy, volumetry
INTRODUCTION
Temporal lobe epilepsy (TLE) is the most common form of drug‐resistant epilepsy in adults [Engel, 2001]. Hippocampal sclerosis (HS) is the histopathological hallmark of TLE and the most common underlying etiology [Thom et al., 2009]. It is characterized by cell loss and gliosis in the hippocampal formation, with substantial individual variability in the extent and spatial distribution of these changes. Since early pathological descriptions [Sommer, 1880], it has been widely accepted that all Cornu Ammonis (CA) subfields but CA2, as well as the dentate gyrus (DG) present with marked changes [Al Sufiani and Ang, 2012]. Across patients, HS encompasses a broad spectrum of structural changes, which can be categorized into different subtypes based on neuropathological grading systems [Blumcke et al., 2012; Blümcke et al., 2007, 2013]. Previous findings have suggested an association between histopathological subtypes, postsurgical seizure outcomes, and postoperative memory impairment [Blümcke et al., 2007, 2013; Savitr Sastri et al., 2014; Thom et al., 2010].
TLE patients with only subtle pathology have a less favourable prognosis and surgical outcomes than those with HS or other epileptogenic lesions [de Tisi et al., 2011; Hennessy et al., 2000]; moreover, these patients show a higher probability of seizure recurrence after anti‐epileptic drug (AED) discontinuation [McIntosh et al., 2004]. In vivo prediction of distinct subfield pathology may lead to more accurate TLE diagnosis and improved patient management. It may also aid clinicians in treatment selection, and counselling patients regarding ongoing AED use and tapering strategies. In addition, in vivo prediction of pathology might carry a broader impact, as associations between subfield‐specific pathology and disease progression have been described in other neurological disorders, namely Alzheimer's disease [West et al., 2004], stress [McEwen, 1999], and schizophrenia [Harrison, 2004].
MRI has played a key role in the presurgical evaluation of TLE, with in vivo volumetry and T2‐MRI showing a high utility in identifying HS [Briellmann et al., 2002; Cascino et al., 1991; Coan et al., 2003, 2014; Goncalves Pereira et al., 2006; Jackson et al., 1993; Kuzniecky et al., 1997; Lencz et al., 1992; Mackay et al., 2000; Schoene‐Bake et al., 2014; Van Paesschen et al., 1997]. Landmark studies have shown that global hippocampal atrophy correlates with pathological grades of hippocampal cell loss [Cascino et al., 1991]; and that T2 signal mainly relates to glial cell count, particularly in the dentate gyrus [Briellmann et al., 2002]. While these studies represent important steps towards a histopathological validation of MRI markers of HS, assessments have been carried out either on the whole hippocampus or have been restricted to single subfields. Moreover, comparisons between the resected tissue and MRI were not based on rigorous data co‐registration that would allow for a regionally specific correlation between in vivo MRI parameters and histological features. Finally, although previous reports have suggested that diffusion MRI may index HS‐related changes [Wieshmann et al., 1999], its exact histopathological correlates have not been established.
The current study aims to assess histopathological correlates of an ensemble of advanced MRI markers at the subfield‐level. Specifically, we evaluated hippocampal volume, T2 intensity, quantitative T1, and diffusion MRI in TLE, and investigated their efficacy in predicting histopathology in vivo. Our analysis framework is built on a unique co‐registration pipeline that allows for seamless integration of preoperative high‐resolution MRI with postoperative histopathological data, on which metrics of cell loss and gliosis were quantitatively assessed.
MATERIALS AND METHODS
Patients and Samples
We studied 15 subjects with drug‐resistant TLE (seven males and eight females, age = 36 ± 12 years, range = 20–59 years), who underwent anterior temporal lobectomy (ATL) with amygdalohippocampectomy surgery at the London Health Sciences Centre. Hippocampal specimens were obtained from en‐bloc resection by three surgeons at our centre, with minimal use of ultrasonic aspiration. All subjects underwent preoperative 1.5 T clinical MRI, including T1‐weighted, T2‐weighted, FLAIR, and diffusion‐weighted sequences, and neuropsychological testing, as part of their evaluation. Video‐scalp EEG telemetry was employed to identify the epileptogenic zone, with four patients needing subdural electrode placement to better localize the seizure onset zone. In addition to the conventional 1.5 T sequences, all patients underwent a series of 3.0 T research scans as described in the in vivo MRI subsection. Table 1 summarizes clinical and demographic information for our cohort. Among the initially recruited 15 patients, hippocampi in two were fragmented with insufficient tissue to clinically assess HS or perform automated neuron analysis. Informed consent was collected from all participants before their recruitment in the study. This project was approved by the office of Research Ethics of Western University.
Table 1.
Patient demographics and clinical information including age, gender, onset age, seizure origin as well as clinical MRI and pathology findings for our patient cohort
| Patient | Sex | Age | Age of onset | Sz origin |
Sz freq./month |
MRI | Hp. path. | Engel |
Yrssincesurgery |
|---|---|---|---|---|---|---|---|---|---|
| 1 | F | 22 | 15 | R | 8 | Normal | HS | 2 | 3.52 |
| 2 | M | 52 | 45 | L | 2 | L. arachnoid cyst in temporal pole | Gliosis | 2 | 3.37 |
| 3 | F | 40 | 7 | R | 20 | HS, Porencephaly | HS | 2 | 2.5 |
| 4 | M | 20 | 3 | L | 16 | HS | HS | 2 | 2.1 |
| 5 | F | 48 | 36 | L | 28 | HS | HS | 2 | 1.7 |
| 6 | M | 30 | 2 | L | 4 | HS | HS | 1 | 1.87 |
| 7 | M | 31 | 28 | R | 2 | Normal | Gliosis | 1 | 1.3 |
| 8 | F | 49 | 12 | R | 2 | HS | HS | 1 | 1.3 |
| 9 | F | 43 | 3 | R | 4 | HS | HS | 1 | 1.4 |
| 10 | M | 39 | 22 | R | 2 | Mild sylvian bilateral PMG | Gliosis | 1 | 0.94 |
| 11 | M | 23 | 18 | L | 12 | Normal | Gliosis | 2 | 1 |
| 12 | M | 34 | 15 | L | 2 | HS | HS | 3 | 1.2 |
| 13 | F | 33 | 20 | R | 16 | HS | HS | 1 | 1.34 |
| 14 | F | 56 | 15 | R | 8 | Normal | Gliosisa | 1 | 1.12 |
| 15 | M | 39 | 13 | R | 12 | DNET or CD | Gliosisa | 2 | 1.16 |
Not enough tissue to make diagnosis of HS.
HS = hippocampal sclerosis, Hp. Path. = hippocampal pathology.
MRI Acquisition
In vivo imaging
Tesla
Patients underwent in vivo imaging on a 3.0 T Discovery MR750 scanner (General Electric, Milwaukee, WI) using a 32‐channel head coil. The DESPOT1‐HIFI technique [Deoni, 2007] was employed for quantitative T1 mapping, whereby two three‐dimensional (3D) spoiled gradient echo (SPGR) sagittal T1‐weighted scans (TR = 8.36 ms, TE = 3.71 ms, flip angles = 4°/18°, matrix = 220 × 220, slice thickness = 1 mm, FOV = 220 × 220 mm2), as well as an additional sagittal inversion‐prepared SPGR volume for B1 mapping (TR = 6.4 ms, TE = 3.1 ms, flip angle = 5°, matrix = 220 × 128, slice thickness = 1 mm, FOV = 220 × 200 mm2) were acquired. For T2‐weighted MRI, we employed a sagittal balanced steady‐state free precession (bSSFP) sequence (TR = 4.6 ms, TE = 2.3 ms, flip angles = 35°, matrix = 220 × 220, slice thickness = 1 mm, FOV = 220 × 220 mm2). An axial spin‐echo echo‐planar imaging (EPI) sequence was used to obtain diffusion weighted MRI, with a b‐value of 1,000 s/mm2 and 41 diffusion directions (TR = 1,100 ms, TE = 63.2 ms, flip angle = 90°, matrix = 96 × 96, slice thickness = 2.5 mm, FOV = 240 × 240 mm2).
Tesla
We performed an additional high‐resolution scan on a subset of patients (n = 7), to validate our lower resolution in vivo structural data. The scan was acquired on a 7.0 T neuroimaging optimized MRI scanner (Agilent, Santa Clara, CA/Siemens, Erlangen, Germany) using a 16‐channel transmit‐receive head coil array constructed in‐house. The sequence used for this study was a multiecho gradient‐echo sequence with six echoes acquired and a 0.5 mm in‐plane resolution (TR = 40 ms, TE1 = 4.57 ms, echo spacing = 4.89 ms, flip angle = 13°, N = 1, matrix = 256 × 360 × 80, slice thickness = 1.5 mm, FOV = 128 × 180 × 120 mm, total time = 12 min), with slices acquired perpendicular to the long axis of the hippocampus in a coronal oblique orientation.
Ex vivo imaging
To validate our in vivo DTI measurements, high‐resolution ex vivo DTI was performed on cases, where overnight imaging was feasible and not disruptive to the clinical workflow (N = 5). Scanning was performed on a 9.4 T small bore Varian MR magnet (Varian, Palo Alto, CA) in a millipede birdcage MP30 coil (Agilent, Santa Clara, CA) after overnight fixation in 10% formalin. Each specimen was immersed in a fluorine‐based lubricant ‘Christo‐lube MCG 1046’ (Lubrication Technology, Inc.) before imaging to avoid susceptibility artifacts at tissue boundaries. Spin‐echo diffusion sequences were acquired with an in‐plane resolution of 0.1 × 0.1 mm (TR = 7.6 ms, TE = 3.8 ms, matrix = 380 × 256, slice thickness = 0.4mm, FOV = 38 × 25.6 mm2). We also acquired structural images employing a balanced steady‐state free precession sequence for in vivo to ex vivo image registration (TrueFISP, resolution = 0.1 mm isotropic, TR = 7.6 ms, TE = 3.8 ms, flip angle = 30°, FOV = 38 × 25.6 × 19.2 mm2).
MRI Processing
Quantitative T1
The T1‐weighted volumes co‐registered to the first image volume of the session using a rigid transformation obtained with FLIRT (FSL 4.1, http://fsl.fmrib.ox.ac.uk). Quantitative T1 maps were reconstructed using the approach described by Deoni et al. [2007].
Diffusion MRI
Nonlinear distortions were corrected by deformable registration of the average unweighted volume to the undistorted T1 map using a diffeomorphic registration method [Beg et al., 2005; Huang et al., 2008]. FMRIB's Diffusion Toolbox (FDT) was used for motion and eddy current correction and estimation of the diffusion tensor. We computed the two diffusion tensor imaging (DTI) parameters; fractional anisotropy (FA) and mean diffusivity (MD), also known as apparent diffusion coefficient (ADC), which are the most commonly used indices in literature, defined as:
where
are the eigenvalues of the diffusion tensor. Using linear registration (FLIRT), we transformed and resampled the resulting diffusion maps to the coordinate system defined by T1 map (1 mm isotropic voxel size).
Quantitative Histology
Resected specimens underwent accessioning and gross description by the Department of Pathology at London Health Sciences Centre. The numerous challenges in our quantitative histology pipeline include the high complexity of en‐bloc resections, the difficulty in preserving atrophic hippocampi throughout histological processing, and the tendency for the tissue to deform and occasionally form fissures (partially due to the differential shrinkage of gray and white matter). To better preserve specimen architecture, samples were bisected in the coronal plane; each half was embedded in agar for stabilization and support during processing and sectioning. Each half was sectioned into thick coronal slices (4.4 mm spacing), parallel to the initial cut using a deli slicer. Blocks were embedded in paraffin and sectioned at a thickness of 8 µm. Hematoxylin and eosin (H&E) stain was applied to slides from each block, in addition to the following immunohistochemical (IHC) stains: neuronal nuclear protein (NeuN) (monoclonal antibody; 1:400; EMD Millipore, Billerica, Massachusetts) as a marker for neuronal nuclei and the perinuclear soma, and GFAP (polyclonal antibody; 1:4,000; Dako, Agilent Technologies, Santa Clara, CA) as a marker for gliosis. To minimize variability between slides, batch IHC processing was performed on a Dako Autostainer Link 48. Resulting slides were digitized on a ScanScope GL (Aperio Technologies, Vista, CA) bright field slide scanning system at a maximum of 20× optical zoom, and automatically stitched to form full‐frame multiresolution images stored in BigTIFF file format (maximum pixel resolution 0.5 μm).
We quantified NeuN using field fraction estimates (i.e., the proportion of pixels in the field that are positively‐stained). These estimates are sensitive to the packing density and cell‐size of neuronal cell bodies and processes; they have been previously employed to describe neuronal integrity [Eriksson et al., 2007, 2009; Lockwood‐Estrin et al., 2012]. Similarly, we quantified field fraction estimates of GFAP IHC, which is sensitive to reactive astrogliosis, and analyzed the full resolution slides in blocks of 100 × 100 μm using MATLAB (The MathWorks Inc., Natick, MA). To provide local estimates of neuron density and size, we developed a method for segmenting cell bodies of pyramidal and granular neurons. This technique first extracts the colour component related to immunopositive staining using colour deconvolution [Ruifrok and Johnston, 2001] preceding a watershed‐based segmentation procedure [Soille, 2003] for splitting joined or connected neurons, and removes objects smaller than a predefined area defined as noise (less than 14 μm2). Resulting neuron segmentations provide the neuronal density (number of neurons) per field, as well as the mean area (size) of cell bodies within the field. To further discriminate between pyramidal neurons of CA subfields and granular neurons of the DG, we used area thresholds (125 and 50 µm2 respectively). Neuron‐specific quantitative features in each field of these images were extracted using a custom algorithm written in MATLAB. Manual counts taken from two randomly selected fields per slice within the CA subfields and the DG by one rater (blinded to the automated counts) were employed to validate our automated cell segmentation for pyramidal and granular neuron quantification. Automated (A) and manual (M) segmentation achieved a high agreement Kappa (κ) = (A − M)/(1 − M) = 98% for pyramidal cell counts and κ = 96% for granular cell counts. Figure 1 illustrates this procedure and demonstrates the quantitative histological features: neuronal density (for both CA and DG), mean neuron size, and GFAP field fraction. Neuronal density data from the least sclerotic specimens were used as references to compute percent cell loss per subfield for each patient. We also generated a three‐level qualitative HS subtype classification based on expert clinical assessment together with radiological and histology reports: (1) no HS; (2) moderate HS: CA1 atrophy or mild involvement of both CA1 and C4; (3): severe: marked global atrophy in CA1, CA3, and CA4. No subject presented as atypical CA4‐only atrophy in our cohort, either in the histology reports or the quantitative analysis.
Figure 1.
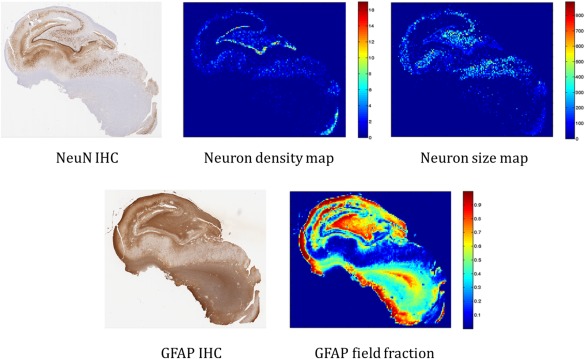
Overview of some of the automated, quantitative histological features. Top row left: original NeuN immunohistochemistry. Top middle: quantitative neuron density map. Top right: mean neuron size map. Bottom row left: original GFAP IHC. Bottom right: quantitative GFAP field fraction. [Color figure can be viewed in the online issue, which is available at http://wileyonlinelibrary.com.]
Histology Feature Extraction
A single rater (MG) manually delineated hippocampal subfields on down sampled histology slices (20 × 20 µm2 pixel size) using ITKSNAP [Yushkevich et al., 2006]. Segmentations were confirmed by a neuropathologist (R.H.). Our segmentation protocol was based on the Duvernoy hippocampus atlas [Duvernoy et al., 2005], with the following boundary definitions: The border between the subiculum and CA1 was defined as a horizontal line at the edge of the subiculum extending from the inferior border of the dentate gyrus and the hippocampal sulcus, shown as black dashed lines in Figure 2. The CA1/CA2 boundary was designated as the point at which a noticeable decrease in width of the CA1 subfield was observed, following the most lateral point of the DG; or the point with a noticeable gradient of higher density of pyramidal neurons from CA1 to CA2 (relative preservation of neurons), as shown in the zoomed‐in window in Figure 2. The CA2/CA3 boundary was defined at the most medial point of the superior curve of the dentate gyrus where a gradient of pyramidal cell density is observed between the subfields. The opening of subfields into the globular region of the hippocampal formation formed the CA3/CA4 border. The remaining globular region of the hippocampal formation was marked as CA4. The DG was divided into two labels, one encompassing the granular layer and another combining both molecular and polymorphic layers surrounding the granular cells. Figure 2 shows examples of subfield delineation on histology slices from three of our subjects with mild, moderate and severe sclerosis.
Figure 2.
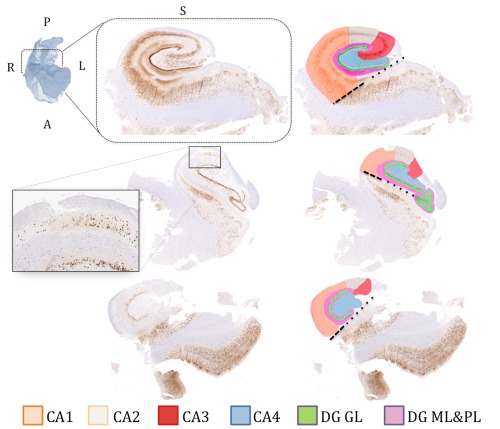
Manual subfield delineation on histology slices (left column: without segmentations, right: with segmentations) from three patients from our cohort showing different examples across the gliosis spectrum (top: mild sclerosis, middle: moderate sclerosis, bottom: severe sclerosis). The labeling scheme (colour representing each subfield) is described at the bottom of the figure. The dashed black line represents the boundary between CA1 and subiculum, extending horizontally from the inferior border of the dentate gyrus and the hippocampal sulcus (dotted lines). CA (1‐4): cornu ammonis, DG GL: dentate gyrus granular layer, DG ML and PL: dentate gyrus molecular and polymorphic layers. [Color figure can be viewed in the online issue, which is available at http://wileyonlinelibrary.com.]
Image Registration and MRI Parameter Extraction
We first applied our previously described MRI to histology [Goubran et al., 2013a, 2015a] registration pipeline, which allowed for the identification of the MRI slice that best corresponded to the cut histology slice (Fig. 3). To summarize the pipeline briefly, after surgical resection the anatomical orientation labels for each specimen were marked by the operating neurosurgeon and photographs taken of the en bloc specimens were for future reference. The orientation was also marked and confirmed during histological grossing and processing. Then, the digitized histology images were similarly reoriented into a standard orientation, with the origin in the top‐left image corner corresponding to superior‐right in anatomical orientation, using the corresponding MRI as a reference. After histology and MRI preprocessing, our image‐based algorithm registered the oriented histology images to the ex vivo MR, then the ex vivo to the in vivo images. Our pipeline combined a 3D and 2D registration algorithm that alternates between slice‐based and volume‐based registration. The resulting transformations and deformation fields provided us with the MRI slice that best corresponded to the histological slices.
Figure 3.
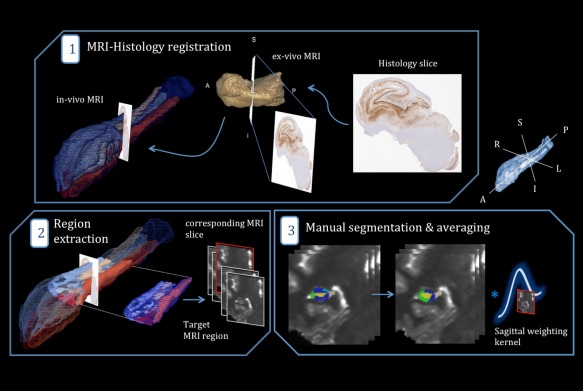
Schematic outline of MRI parameter extraction in the subfields. (1) Determination of the MRI slice best corresponding to a histology cut by employing a MRI‐histology co‐registration pipeline (with the ex vivo MRI as an intermediate step). (2) Extraction of a subject‐specific, target region surrounding the “corresponding MRI slice,” to model registration and sectioning uncertainty. (3) Manual delineation of the subfields within the chosen target region and application of a sinc sagittal weighting kernel (producing lower weighting away from the corresponding slice). [Color figure can be viewed in the online issue, which is available at http://wileyonlinelibrary.com.]
For more robust correlations, instead of relying on imaging parameters from segmented subfields along the entire length of the hippocampus, we analyzed a select target region encompassing the MRI slice corresponding to a given histological slice. Moreover, we modeled uncertainty stemming from registration error (approximately 2.5 mm) [Goubran et al., 2013a, 2015a] and variance in sectioning histology slices from the face of blocks (approximately 1 mm) [Gibson et al., 2012]; specifically, MRI data adjacent to the corresponding slice were cropped and weighted using a sinc function with FWHM = 3mm, giving data adjacent to the closest corresponding MRI slice in the sagittal plane a higher weighting than those more distant.
Within a given target region, subfields were manually segmented by a single rater (M.G.). This segmentation protocol mirrored that employed on histology and is similar to that described in our previous work at 7.0 T [Goubran et al., 2013b]. The MRI protocol was confirmed by consensus with a neurologist (N.B.) and a neuropathologist (R.H.). Assessment was restricted to CA1, CA2/3, and CA4/DG. It should be noted that MRI parameter extraction was performed in the intrinsic in vivo space (1 mm isotropic) and not the upsampled space to avoid resampling of the quantitative maps. All reported subfield volumes in this study were normalized by the intracranial volume (ICV) as estimated by the Freesurfer software [Buckner, 2004].
Statistical Analysis
Statistical analyses were performed using SPSS (version 20, IBM, Armonk, NY) and JMP statistical software (version 10, SAS, Cary, NC). Before analysis, MRI parameters and histological features were internally z‐scored. Analysis was stratified into four experiments:
MRI‐histology correlations
Univariate analysis
We systematically assessed pair‐wise, nonparametric (Spearman Rho) correlations between individual histological parameters relating to neuronal characteristics (neuronal size and density) and putative MRI markers of neuronal loss (subfield volume and T1 intensity [Goubran et al., 2015b]. In a second step, we evaluated correlations between histological GFAP field fraction and MRI‐derived T2‐w intensity. T2 intensity values were normalized with respect to mean intensity in a spherical region in the lateral ventricle ipsilateral to the HS for each patient. In a more exploratory diffusion‐histology assessment, we correlated histological parameters with FA and MD. Multiple comparisons were corrected with family‐wise error rate (FWER) control of α < 0.05 using nonparametric permutation tests [Groppe et al., 2011; Nichols and Holmes, 2002], implemented in MATLAB (The MathWorks Inc., Natick, MA). For each comparison (i.e. the assessment of correlations between a given pair of two variables), we calculated a correlation coefficient rho using a two‐tailed Spearman rank correlation. Comparing this rho value against a permutation distribution of rhos (in which both variables were randomly shuffled) can be used to determine the test‐wise P values of the original observations. To further control for multiple comparisons at a FWER of P < 0.05, we subsequently pooled across the most extreme permutation‐based rhos (maximum absolute rho for each test), and then took the 95th percentile of this maximum rho distribution as a critical coefficient to compute the corrected family‐wise P value. A large number of random permutations (100,000) was computed instead of the typically suggested 1,000 for an α of 0.05 [Manly, 2006; Nichols and Holmes, 2002] to account for the multiple statistical tests performed in our analysis.
Multiple linear regression
To test the efficacy of quantitative, multiparametric MRI in preoperatively predicting neuronal loss per subfield, multiple linear regression analyses were performed between (a) subfield‐specific MRI parameters and percent loss of neurons for each subfield, (b) MRI parameters from all subfields and percent neuronal loss for each subfield.
Clinical correlations
We assessed the relationship between each of the above variables and clinical parameters such as age of seizure onset, duration of epilepsy and postsurgical seizure outcome. Only significant correlations after multiple comparison correction are reported in the results section. The clinical outcome data were obtained by our neurologist on follow‐up visits for each patient. We relied on the Engel classes' classification to categorize the clinical outcomes, where Class I is free of disabling seizures, Class II: rare disabling seizures, Class III: worthwhile improvement and Class IV: no improvement.
Validation experiments
We performed four experiments to validate our in vivo DTI measurements and segmentation labels, as well as ensure that our correlation analysis was not driven by single outliers or confounds such as the partial volume effect.
High‐resolution ex vivo DTI
This experiment was performed with the aim of validating our in vivo DTI measurements with higher resolution ex vivo data. We first employed our registration pipeline to obtain a mapping between ex vivo data and histology, to warp labels drawn on histology to the ex vivo space. These labels were then used to initialize the segmentation and to define the ex vivo corresponding slices. Segmentation adjustments were applied by the same rater (if needed postregistration) on T2‐weighted structural images, before extraction of diffusion parameters from FA and MD maps and comparison with in vivo measurements. Voxels at the gray matter‐CSF boundary were not segmented to avoid CSF contamination in our validation datasets. Correlation coefficients were computed between both scanning sessions for both diffusion parameters.
Label erosion
We eroded the subfield segmentation labels inward and repeated all the univariate correlation analysis as a further demonstration that partial volume effects did not influence our results.
Bootstrapping
We employed a bootstrapping technique, with 1,000 bootstrap samples and 95% bias corrected confidence intervals on all correlations, to better estimate the confidence intervals of the correlation coefficients and ensure the reliability of our results. Results of this experiment are presented alongside the univariate correlation results, where each correlation coefficient is followed by its 95% bias corrected lower and upper confidence intervals.
Reproducibility and reliability analysis
To assess the accuracy and reproducibility of our segmentation protocol, all patients were re‐segmented by the same operator, and the resulting labels compared with the first segmentation using the dice similarity coefficient (DSC), as well as absolute percentage volume difference (δV p). The intraclass correlation coefficient (ICC) was also computed for intra‐rater reliability analysis with values near unity indicating consistent volume measurements.
For those patients where we had high‐resolution (0.5 × 0.5 × 1.5 mm) T2 images from an additional 7 T scanning session (n = 7), we have independently segmented the subfields in order to assess its reliability in accurately delineating the subfields. Dice similarity and percent volume difference were computed between the 3 T and 7 T segmentations.
RESULTS
MRI‐Histology Correlations
Univariate correlations
Across all subfields, we observed a consistent positive correlation between MRI‐derived subfield volume and histology‐derived neuronal density and size, with highest effect sizes in CA1 (density: r s = 0.907 (0.63, 0.99), p fwe < 0.001, and size: r s = 0.833 (0.34, 0.99), p fwe < 0.001) (Table 2 and Fig. 4). Correlations for the other parameters were confined to single subfields. Specifically, MD was negatively correlated with pyramidal cell density within CA4/DG (r s = −0.833 (−0.48, −0.98), p fwe < 0.001) and T1 negatively correlated with both neuronal markers in the same subfield (size: r s = −0.830 (−0.50, −0.99), p fwe < 0.001, and density: r s = −0.781 (−0.32, −0.97), p fwe = 0.006). On the other hand, higher T2‐weighted intensity related to increased GFAP fraction in CA1 (r s = 0.835 (0.52, 0.95), p fwe < 0.001).
Table 2.
Significance of Spearman correlations between MR parameters and neuronal density and size for subfield‐specific analyses
| Subfield‐specific MRI parameters | ||||
|---|---|---|---|---|
| Histology features | CA1 | CA1 | ||
| Volume | T1 | MD | ||
| Density | r = 0.907*; P < 0.001 | NS | NS | |
| Size | r = 0.833a < 0.001 | NS | NS | |
| CA2/3 | CA2/3 | |||
| Volume | T1 | MD | ||
| Density | r = 0.736*; P = 0.004 | NS | — | |
| Size | r = 0.610; p = 0.027 | NS | — | |
| CA4 | CA4/DG | |||
| Volume | T1 | MD | ||
| Density | r = 0.683; P = 0.010 | r = −0.781*; P = 0.006 | r = −0.833*; P < 0.001 | |
| Size | r = 0.730*; P = 0.005 | r = −0.830*; P < 0.001 | r = −0.841; P = 0.039 | |
*Corrected P value at FWE significant at <0.01.
All volume measurements were corrected by the intracranial volume (ICV).
Figure 4.
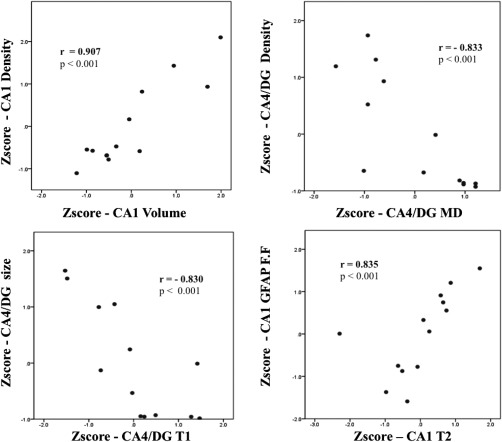
Selection of significant associations from Spearman's correlation analysis for subfield‐specific MRI parameters with histological features.
Multiple linear regressions
Subfield‐specific
Multiple linear regression analysis demonstrated that multiparametric MRI could accurately predict subfield neuronal loss. Across all subfields, volume was a consistent feature, and was selected together with T2 in CA1 (R 2 = 0.90, adjusted R 2 = 0.87, P < 0.001), with T1 in CA2/3 (R 2 = 0.73, adjusted R 2 = 0.68, P = 0.001) and second to MD in CA4/DG (R 2 = 0.72, adjusted R 2 = 0.67, P = 0.005).
Cross subfields regressions
CA4/DG volume as well as CA1 T1 and FA, predicted CA1 percent neuronal loss with high accuracy (R 2 = 0.90, adjusted R 2 = 0.87, P < 0.001). Volume and T1 parameters from CA2/3 as well as CA4/DG MD and T2 predicted CA2/3 percent loss with very high accuracy (R 2 = 0.88, adjusted R 2 = 0.83, P < 0.001). Finally, loss in CA4 was predicted with equivalent accuracy using CA4/DG and CA2/3 volume and MD (R 2 = 0.94, adjusted R 2 = 0.90, P < 0.001). Table 3 summarizes the multiple linear regression results for subfield‐specific experiments. The model fit for the prediction of neuronal loss of the four analyzed subfields from subfield‐specific parameters is presented in Figure 5.
Table 3.
Model fit of multiple linear regression analysis for predicting percent neuron loss per subfield using subfield‐specific MRI parameters
| Dependent variable | Independent variables | Standardized coefficient (β) | Significance (P) | F‐statistic | R 2 | Adjusted R 2 | Prob > F |
|---|---|---|---|---|---|---|---|
| % Cell loss CA1 | 27.9 | 0.903 | 0.871 | <0.001 | |||
| CA4/DG Vol. | 0.823 | <0.001** | |||||
| CA1 FA | 0.280 | 0.022* | |||||
| CA1 T2 | 0.175 | 0.086 | |||||
| % Cell loss CA2/3 | 19.2 | 0.881 | 0.835 | <0.001 | |||
| CA2/3 Vol. | 1.050 | <0.001** | |||||
| CA2/3 T1 | 0.869 | 0.005** | |||||
| CA4/DG MD | −0.544 | 0.030* | |||||
| CA4/DG T2 | 0.209 | 0.034* | |||||
| % Cell loss CA4 | 29.3 | 0.936 | 0.904 | <0.001 | |||
| CA4/DG MD | −0.857 | 0.004** | |||||
| CA2/3 Vol. | 1.207 | <0.001** | |||||
| CA2/3 MD | −0.102 | 0.039* | |||||
| CA4/DG Vol. | 0.863 | 0.009** |
Corrected P value at FWE significant at < 0.01.
Corrected P value at FWE significant at < 0.001.
Figure 5.
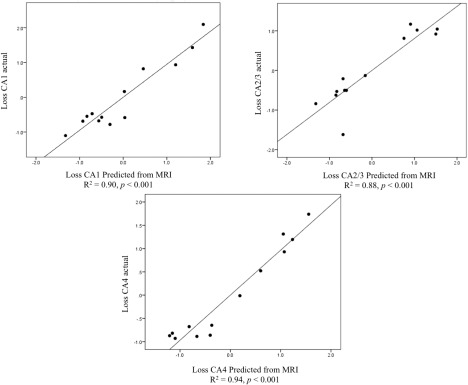
Multiple linear regression results for subfield‐specific parameters depicting predicted vs. actual percent neuron loss for each of the four CA subfields.
Clinical Correlations
T1 of CA2/3 negatively correlated with outcome, i.e., prolonged T1 values relating to better outcomes (r = −0.701, p fwe = 0.012). CA4 GFAP field fraction was the only histological feature to correlate with outcomes, with increased gliosis in CA4 associating with worse outcomes (r = 0.695, p fwe = 0.012). Moreover, duration of epilepsy negatively correlated with CA2/3 volume (r = −0.701, pfwe = 0.018). Our qualitative HS subtypes classification (based on clinical MRI and histology reports) correlated with quantitative neuronal density within the three CA subfields (CA1: r = 0.842, P < 0.001, CA2/3: r = 0.755, P = 0.003, CA4: r = 0.920, P < 0.001).
Validation Experiments
High‐resolution ex vivo DTI
Figure 6 presents the comparison between in vivo and ex vivo diffusion parameters (FA and MD) for five subjects. The good agreement between the two sessions, in both CA4 as well CA1, provides support for the much larger voxel size present in the in vivo diffusion measurements. CA4 had higher correlations, between ex vivo and in vivo DTI for both MD (r = 0.88) and FA (r = 0.72), than CA1 (MD: r = 0.58, FA = r = 0.52). This could be due to the curved shape of CA1, which compromises gray matter values adjacent to CSF in in vivo imaging. The shift in diffusion measurements, as highlighted by the graphs in the figure, between in vivo and ex vivo is probably attributed to fixation and tissue processing effects on the specimens' microstructure. CA2 and 3 were not included in this analysis due to their relatively smaller size compared with our in vivo DTI voxel size.
Figure 6.
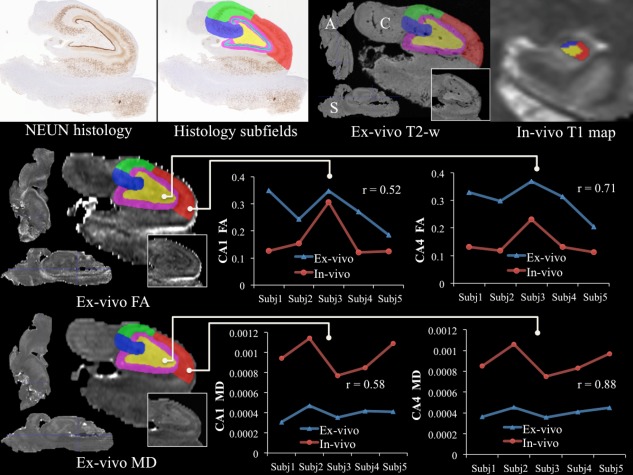
High‐resolution ex vivo validation of in vivo DTI measurements. The top row depicts warping of the subfields from histology to the registered ex vivo space for one subject and compares them to the in vivo subfield segmentation (A: axial, S: sagittal, C: coronal). Rows two and three demonstrate the comparison between in vivo and ex vivo DTI parameters [fractional anisotropy (FA) (middle row) and mean diffusivity (MD) (bottom row)] for both CA1 (middle) and CA4 (right). [Color figure can be viewed in the online issue, which is available at http://wileyonlinelibrary.com.]
Label erosion
Findings remained highly significant even when subfield labels were eroded before analysis as described earlier, suggesting minimal confounds due to partial volume effect.
Reproducibility and reliability analysis
Table 4 summarizes the results for the reproducibility experiment (repeat segmentation by the same rater). Both Dice similarity (range: 0.867–0.911) and percent volume difference (range: 5.3–6.1%) demonstrated a very good correspondence between the two sets of labels. The lowest Dice similarity coefficient was in the CA2 + CA3, which is expected due to the effects of label volume on the index computation. The ICC was equally high for all subfields with the lowest correlation being 0.88.
Similarly, our 7 T validation experiment demonstrated a good agreement between labels delineated on high‐resolution (0.5 × 0.5 × 1.5) images and 3 T labels segmented on our 1 × 1 × 1 mm resolution maps (DSC range: 0.81–0.87, δV p range: 5.7–9.3%). Figure 7 depicts an example subject from this validation experiment, showing the higher resolution 7 T T2‐w scan, the 3 T T1‐weighted as well as T1 map of the same slice (with and without segmentations for visual comparison).
Table 4.
Segmentation reproducibility analysis computed using the Dice similarity coefficient, (DSC) absolute percentage volume error (δV p), and intraclass correlation coefficient (ICC) metrics
| 3 T (same images) | CA1 | CA2 + CA3 | CA4 + DG | Total |
|---|---|---|---|---|
| DSC | 0.895 | 0.867 | 0.911 | 0.893 |
| δV p | 5.3 | 6.1 | 5.4 | 5.6 |
| ICC rater | 0.905 | 0.884 | 0.926 | − |
| 7 T vs. 3 T (seven patients) | CA1 | CA2 + CA3 | CA4 + DG | Total |
| DSC | 0.854 | 0.819 | 0.872 | 0.840 |
| δV p | 7.0 | 9.3 | 5.7 | 7.4 |
Figure 7.
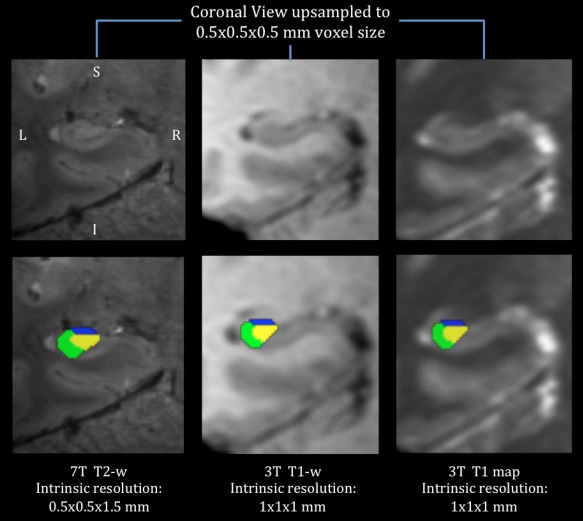
An example subject from the 7 T validation of our 3 T hippocampal segmentation protocol, showing the higher resolution 7 T T2‐w scan (left), the 3 T T1‐w (middle) and T1 map (right) of the same slice (with the segmentations overlaid ‘bottom’). [Color figure can be viewed in the online issue, which is available at http://wileyonlinelibrary.com.]
DISCUSSION
This work correlates volume, T2, quantitative T1 relaxometry with histology within the subfields, using high‐resolution maps and a comprehensive mapping between MRI and pathology. A number of studies previously correlated T2 and volumetry with pathology in the context of hippocampal sclerosis [Bernhardt et al., 2015; Briellmann et al., 2002; Cascino et al., 1991; Coan et al., 2003, 2014; Goncalves Pereira et al., 2006; Jackson et al., 1993; Kuzniecky et al., 1997; Lencz et al., 1992; Mackay et al., 2000; Schoene‐Bake et al., 2014; Van Paesschen et al., 1997]. However, they only focused on whole hippocampus MRI parameters or correlated pathology findings on a histology slice with subfield parameters extracted from the entire hippocampus or employed in vivo scans with low out‐of‐plane resolution (>3 mm) and no registration was preformed to establish correspondences between MRI and histology [Coan et al., 2003, 2014; Goncalves Pereira et al., 2006; Jackson et al., 1993; Mackay et al., 2000; Van Paesschen et al., 1997]. Although previous studies investigated diffusion changes in patients with HS and demonstrated increased MD as well as decreased FA in the ipsilateral hippocampi and white matter [Cantor‐Rivera et al., 2015; Focke et al., 2008; Khan et al., 2014; Rugg‐Gunn et al., 2002; Thivard et al., 2005], this is the first to investigate histopathological correlates of diffusion metrics in TLE within the hippocampal subfields. Our registration protocol validates our high‐resolution MRI maps with quantitative histology to better understand the pathological substrates of our imaging findings. These features may be more sensitive to neuronal degeneration as distinct from qualitative assessment or quantitative grading of neuronal loss as they provide a continuous measurement of pathologies.
The past decade has seen the advent of multiple hippocampal subfield analyses based on neuroimaging. Protocols for subfield volumetry have been developed based on in vivo MRI across different field strengths, commonly ranging from 3 T to 7 T [Malykhin et al., 2010; Mueller et al., 2007; Winterburn et al., 2013; Wisse et al., 2012], based on 9.4 T postmortem MRI [Yushkevich et al., 2009], and more recently on the combination of histological reconstruction and postmortem MRI [Adler et al., 2014]. There have also been attempts to standardize delineation guidelines across protocols to produce a unified protocol [Yushkevich et al., 2015]. Other groups devised high‐resolution imaging paradigms to assess the feasibility of subfield‐specific analysis [Prudent et al., 2010], study neurodegeneration [Kerchner et al., 2012], construct quantitative reference atlases [Goubran et al., 2013b], or visualize micro‐pathways of the hippocampus [Parekh et al., 2015]. While these studies are important steps towards subfield analysis of normative and disease states, the presented pipeline is the first to combine in vivo MRI, ex vivo MRI, and histology to derive subfield‐specific pathological features from quantitative imaging.
Biological Interpretations
In our correlation analysis, preoperative subfield volumetry was highly correlated with subfield density (specifically in CA1). Numerous studies have reported that neuronal density within the subfield may directly relate to volume atrophy [Briellmann et al., 2002; Cascino et al., 1991; Lencz et al., 1992; Schoene‐Bake et al., 2014; Van Paesschen et al., 1997]. The presented subfield‐specific correlation analyses confirmed these previous findings.
Mean diffusivity was the most prominent MRI marker, other than volume, for neuronal density. In our subfield‐specific analysis, MD was negatively correlated with neuronal density and size of CA4, demonstrating the importance of this MRI parameter in determining subtypes preoperatively. A previous study analyzing relationships between diffusion maps and cell density in malignant brain tumours described an analogous association between MD and tumour core cell density [Kinoshita et al., 2008]. The loss of neurons in the hippocampal subfields may lead to less restricted, water diffusion and thus higher diffusivity. A similar interpretation can be described for the relationship between MD and neuronal size: as neuronal cell bodies shrink, the proportion of intra‐neuronal water is reduced thereby increasing diffusivity. Given the limitations of in vivo DTI, we cannot precisely assess the nature of the architectural changes related to MD, but we hope to explore these issues further using high‐resolution ex vivo DTI of the resected specimens.
It has been suggested [Briellmann et al., 2002] that in vivo T2 relaxation relates to DG glial count, whereas a more recent study found no correlation between ex vivo T2‐w and GFAP field fraction in the subfields [Coras et al., 2014]. In our results, T2 also correlated with increased GFAP field fraction expression in CA1, which represents reactive gliosis (astrocytic and microglial proliferation), but failed to show a significant correlation in the DG. This disparity could be to methodological differences in histology processing and quantification, as Briellmann et al. [2002] quantified gliosis by manually counting glial cells in the dentate, whereas in our study we automatically quantified GFAP field fraction as a measure of gliosis. Although GFAP field fraction estimates are widely employed for gliosis and reactive astrocytes assessment [Coras et al., 2014; Lockwood‐Estrin et al., 2012; Thom et al., 2009], the stain's field fraction in the dentate may not be as sensitive or as specific counting all the glial cell within the subfield. T1 was correlated as well with neuronal size/density in CA4. An analogous relationship between ex vivo GM T1 values and neuronal density has been previously described in patients with multiple sclerosis [Schmierer et al., 2010]. Cell loss will likely result in an increase in the extra‐cellular space, thus the intra‐cellular water will decrease as extra‐cellular water increases, which in turn would increase T1 [Jurcoane et al., 2013]. The presence of a significant association between T1 and neuronal markers in CA4/DG may be due to the high content of zinc in the mossy fiber projections from the dentate gyrus [Howell et al., 1984]. In addition, more signal averaging within the CA4/DG as compared with CA1 (due to the different shapes of both subfields) could be another factor contributing to these correlations. Our previous study [Goubran et al., 2015b], focused on investigating the histopathological correlates of quantitative MRI within the neocortex, demonstrated that in vivo T1 and FA negatively correlated with density of small caliber neurons. We did not see this relationship for FA in this analysis of the hippocampus, which could be due to the inherent differences in myeloarchitecture and cytoarchitecture that exist between the hippocampus and lateral neocortex. Both studies confirm the power of quantitative T1 mapping and diffusion MRI as in vivo biomarkers for hippocampal and neocortical pathology in TLE, and their potential use to detect pathology in other neurological disorders.
Clinical Findings and Insights
Multiple linear regression analysis revealed that volume and MD are the most prominent parameters in predicting neuronal loss, with increased accuracy when adding T2. This observation mirrors the correlation analysis where MD and volume were the parameters with the highest number of associations with histological features. T2 was correlated with GFAP field fraction in CA1 whereas MD was correlated with density in CA4, while both have similar insignificant trends in other subfields. A larger cohort may be needed to observe their predictive ability in other subfields. Hippocampal neuronal loss has been previously shown to potentially predict patient outcomes [Jardim et al., 2012] and memory deficits [Pauli et al., 2006]. Predicting subfield loss from in vivo quantitative MRI has the potential to noninvasively localize pathology and determine the extent of hippocampal atrophy, with a precision previously unachievable. It may also help classify patients into different HS subtypes and decide on the merit of their surgical candidacy. Moreover, it may help identify select hippocampal subfields for targeting electrodes used for neurostimulation therapy or MRI‐guided laser ablation, as an alternative to resective surgical intervention.
The association between the qualitative HS subtype classification and neuronal density within the CA subfields, validates the accuracy of our automated neuron quantification procedure. Some reports have previously shown that hippocampal sclerosis subtypes have different postoperative outcomes [Blümcke et al., 2007; Savitr Sastri et al., 2014; Thom et al., 2010], and correlate with seizure duration and onset [Fuerst et al., 2001]. The Engel outcomes presented in this study are reported in the short‐term follow‐up with the average time since surgery for our cohort being just under two years (22 months). There was one patient in Engel class III and no class IV patients in our cohort. CA2/3 T1 was the only in vivo MRI parameter to correlate with outcomes in our cohort, and CA2/3 volume negatively correlated with duration of epilepsy, which mirrors the classification results demonstrating CA2's ability to represent the spectrum of atrophy across patients. One explanation for not observing a correlation between subfield volume and outcome could be the presence of neocortical pathology in patients with normal hippocampal volume or patients considered as ‘HS negative’ in our cohort. On the histology side CA4 GFAP field fraction was the only feature that negatively correlated with clinical outcomes.
Histological studies have extensively demonstrated that hippocampal subfields are selectively affected in Alzheimer's disease (AD) [Mueller et al., 2010; West et al., 2004] and that neuronal loss patterns differ across the spectrum of neurodegeneration: aging [Morrison and Hof, 1997], mild impairment [Gómez‐Isla et al., 1996] and advanced AD [Šimić and Bogdanović, 1997]. Imaging studies have shifted their focus to hippocampal subfield analysis (instead of whole hippocampus volumetry) using high‐field MRI as more specific markers of atrophy and dementia [Ali et al., 2015]. The presented pipeline for in vivo assessment of neuronal integrity within the subfields has the potential to complement standard imaging and morphometry biomarkers of dementia and AD. Moreover, accurate prediction of histological features through multiparametric MRI is applicable to numerous other neuroscience disciplines, as unique subfield atrophy is also present in neurological disorders such as post‐traumatic stress [McEwen, 1999] and schizophrenia [Harrison, 2004].
Limitations and Technical Considerations
A limitation of this work is the lack of normative control data for histology, and hence in our assessment, the least sclerotic specimens were used as reference for computation of percentage cell loss. We also employed histological measurements from one optimal slide per subject, which may have biased the results. This was due to the restricted size of the resected specimens (only a fraction of the hippocampus is resected at times) and the large variability in specimen sizes, as well as effects of tissue breakage and fragmentations. These limitations, in addition to the need to reserve part of the specimen in tissue banks for clinical use, restricted the analysis to a maximum of one histology slide (for some subjects) where all the CA subfields are clearly visible. In addition, we employed an approximation of T2 values using intensity‐normalized T2‐weighted images, as some failed T2‐weighted acquisitions for an earlier subset of patients prevented us from computing DESPOT2 for all subjects.
Obtaining higher resolution images, than those employed in this study would help better delineate the subfields. This is because 1 mm images limit the rater, as layers such as stratum‐laconosum moleculare or small structures as the endfolial pathway are not resolvable. In our protocol, we ensured accurate subfield analysis by relying on manually delineated subfields (since automated techniques, particularly those based on in vivo atlases, may not perform optimally on very sclerotic cases), as well as expert assessment of the segmentations after delineation by the rater. Although this approach is more time consuming and possibly prone to rater‐bias, it produces more accurate labels specifically in very sclerotic hippocampi, and those with malrotation where the image signal to noise, contrast and resolution, as well as morphology are not sufficient to guide the automated technique. Another way to correlate preoperative MRI and pathology is through direct registration of both modalities [Goubran et al., 2013a] and warping of regions of interest from histology to in vivo space. However, for this technique to be effective, image resolution of preoperative volumes needs to be submillimetric. For example, if in vivo maps have a 1 mm isotropic resolution, smaller subfields (i.e. CA2 and CA3) warped from histology would only occupy two or three voxels on a slice in the in vivo space, which would challenge the accuracy of the results.
CONCLUSION
This is the first study to investigate the histopathological substrates of in vivo volume, T2, quantitative T1 relaxometry in the subfields while employing high resolution maps at 3.0 T and a comprehensive mapping between MRI and pathology. It is also the first direct investigation of histopathological correlates of diffusion metrics in TLE within the hippocampal subfields. Moreover, we developed and validated an automated quantitative histology procedure for quantification of neuronal density, size and NeuN and GFAP field fractions. We have demonstrated that volume, MD and T1 are sensitive markers for neuronal integrity in the subfields and confirmed that T2 is a marker of gliosis. Finally, we have shown that in vivo multiparametric MRI can predict subfield neuronal loss in all subfields with very high accuracy. This work suggests that in vivo subfield volumetry, diffusion and quantitative MRI have the potential to noninvasively localize pathology and determine the extent of hippocampal subfield atrophy, with increased precision.
ACKNOWLEDGMENT
The authors thank Cathie Crukley, Robert Mayer, and Catherine Currie for their assistance and support throughout the study.
REFERENCES
- Adler DH, Pluta J, Kadivar S, Craige C, Gee JC, Avants BB, Yushkevich PA (2014): Histology‐derived volumetric annotation of the human hippocampal subfields in postmortem MRI. Neuroimage 84:505–523. [DOI] [PMC free article] [PubMed] [Google Scholar]
- Al Sufiani F, Ang LC (2012): Neuropathology of temporal lobe epilepsy. Epilepsy Res Treat 2012:1–13. [DOI] [PMC free article] [PubMed] [Google Scholar]
- Ali R, Goubran M, Choudhri O, Zeineh MM (2015): Seven‐Tesla MRI and neuroimaging biomarkers for Alzheimer's disease. Neurosurg Focus 39:E4. [DOI] [PubMed] [Google Scholar]
- Beg MF, Miller MI, Trouvé A, Younes L (2005): Computing large deformation metric mappings via geodesic flows of diffeomorphisms. Int J Comput Vis 61:139–157. [Google Scholar]
- Bernhardt BC, Hong SJ, Bernasconi A, Bernasconi N (2015): Magnetic resonance imaging pattern learning in temporal lobe epilepsy: Classification and prognostics. Ann Neurol 77:436–446. [DOI] [PubMed] [Google Scholar]
- Blumcke I, Coras R, Miyata H, Ozkara C (2012): Defining clinico‐neuropathological subtypes of mesial temporal lobe epilepsy with hippocampal sclerosis. Brain Pathol 22:402–411. [DOI] [PMC free article] [PubMed] [Google Scholar]
- Blümcke I, Pauli E, Clusmann H, Schramm J, Becker A, Elger C, Merschhemke M, Meencke HJ, Lehmann T, von Deimling A (2007): A new clinico‐pathological classification system for mesial temporal sclerosis. Acta Neuropathol 113:235–244. [DOI] [PMC free article] [PubMed] [Google Scholar]
- Blümcke I, Thom M, Aronica E, Armstrong DD, Bartolomei F, Bernasconi A, Bernasconi N, Bien CG, Cendes F, Coras R (2013): International consensus classification of hippocampal sclerosis in temporal lobe epilepsy: A Task Force report from the ILAE Commission on Diagnostic Methods. Epilepsia 54:1315–1329. [DOI] [PubMed] [Google Scholar]
- Briellmann RS, Kalnins RM, Berkovic SF, Jackson GD (2002): Hippocampal pathology in refractory temporal lobe epilepsy T2‐weighted signal change reflects dentate gliosis. Neurology 58:265–271. [DOI] [PubMed] [Google Scholar]
- Buckner RL (2004): A unified approach for morphometric and functional data analysis in young, old, and demented adults using automated atlas‐based head size normalization: Reliability and validation against manual measurement of total intracranial volume. Neuroimage 23:724–738. [DOI] [PubMed] [Google Scholar]
- Cantor‐Rivera D, Khan AR, Goubran M, Mirsattari SM, Peters TM (2015): Detection of temporal lobe epilepsy using support vector machines in multi‐parametric quantitative MR imaging. Comput Med Imaging Graph 41:14–28. [DOI] [PubMed] [Google Scholar]
- Cascino GD, Jack CR, Parisi JE, Sharbrough FW, Hirschorn KA, Meyer FB, Marsh WR, O'Brien PC (1991): Magnetic resonance imaging–based volume studies in temporal lobe epilepsy: Pathological correlations. Ann Neurol 30:31–36. [DOI] [PubMed] [Google Scholar]
- Coan AC, Kobayashi E, Li LM, Cendes F (2003): Quantification of hippocampal signal intensity in patients with mesial temporal lobe epilepsy. J Neuroimaging 13:228–233. [PubMed] [Google Scholar]
- Coan AC, Kubota B, Bergo FP, Campos BM, Cendes F (2014): 3T MRI quantification of hippocampal volume and signal in mesial temporal lobe epilepsy improves detection of hippocampal sclerosis. Am J Neuroradiol 35:77–83. [DOI] [PMC free article] [PubMed] [Google Scholar]
- Coras R, Milesi G, Zucca I, Mastropietro A, Scotti A, Figini M, Mühlebner A, Hess A, Graf W, Tringali G (2014): 7T MRI features in control human hippocampus and hippocampal sclerosis: An ex vivo study with histologic correlations. Epilepsia 55:2003–2016. [DOI] [PubMed] [Google Scholar]
- de Tisi J, Bell GS, Peacock JL, McEvoy AW, Harkness WFJ, Sander JW, Duncan JS (2011): The long‐term outcome of adult epilepsy surgery, patterns of seizure remission, and relapse: A cohort study. Lancet 378:1388–1395. [DOI] [PubMed] [Google Scholar]
- Deoni SC (2007): High‐resolution T1 mapping of the brain at 3T with driven equilibrium single pulse observation of T1 with high‐speed incorporation of RF field inhomogeneities (DESPOT1‐HIFI). J Magn Reson Imaging 26:1106–1111. [DOI] [PubMed] [Google Scholar]
- Duvernoy HM, Naidich T, Fatterpekar GM, Raybaud C, Risold PY, Sakvolini U, Scarabino T. (2005): The human Hippocampus: Functional Anatomy, Vascularization and Serial Sections with MRI. Berlin, Heidelberg: Springer Verlag; pp 232. [Google Scholar]
- Engel J (2001): A proposed diagnostic scheme for people with epileptic seizures and with epilepsy: Report of the ILAE Task Force on Classification and Terminology. Epilepsia 42:796–803. [DOI] [PubMed] [Google Scholar]
- Eriksson SH, Free SL, Thom M, Martinian L, Symms MR, Salmenpera TM, McEvoy AW, Harkness W, Duncan JS, Sisodiya SM (2007): Correlation of quantitative MRI and neuropathology in epilepsy surgical resection specimens–T2 correlates with neuronal tissue in gray matter. Neuroimage 37:48–55. [DOI] [PMC free article] [PubMed] [Google Scholar]
- Eriksson SH, Free SL, Thom M, Symms MR, Martinian L, Duncan JS, Sisodiya SM (2009): Quantitative grey matter histological measures do not correlate with grey matter probability values from in vivo MRI in the temporal lobe. J Neurosci Methods 181:111–118. [DOI] [PMC free article] [PubMed] [Google Scholar]
- Focke NK, Yogarajah M, Bonelli SB, Bartlett PA, Symms MR, Duncan JS (2008): Voxel‐based diffusion tensor imaging in patients with mesial temporal lobe epilepsy and hippocampal sclerosis. Neuroimage 40:728–737. [DOI] [PubMed] [Google Scholar]
- Fuerst D, Shah J, Kupsky W, Johnson R, Shah A, Hayman–Abello B, Ergh T, Poore Q, Canady A, Watson C (2001): Volumetric MRI, pathological, and neuropsychological progression in hippocampal sclerosis. Neurology 57:184–188. [DOI] [PubMed] [Google Scholar]
- Gibson E, Gómez JA, Moussa M, Crukley C, Bauman G, Fenster A, Ward AD (2012): 3D reconstruction of prostate histology based on quantified tissue cutting and deformation parameters. In: International Society for Optics and Photonics, San Diego, California. p 83170N‐83170N‐7.
- Gómez‐Isla T, Price JL, McKeel J,DW, Morris JC, Growdon JH, Hyman BT (1996): Profound loss of layer II entorhinal cortex neurons occurs in very mild Alzheimer's disease. J Neurosci 16:4491–4500. [DOI] [PMC free article] [PubMed] [Google Scholar]
- Goncalves Pereira PM, Oliveira E, Rosado P (2006): Relative localizing value of amygdalo‐hippocampal MR biometry in temporal lobe epilepsy. Epilepsy Res 69:147–164. [DOI] [PubMed] [Google Scholar]
- Goubran M, Crukley C, de Ribaupierre S, Peters TM, Khan AR (2013a): Image registration of ex vivo MRI to sparsely sectioned histology of hippocampal and neocortical temporal lobe specimens. Neuroimage 83:770–781. [DOI] [PubMed] [Google Scholar]
- Goubran M, de Ribaupierre S, Hammond RR, Currie C, Burneo JG, Parrent AG, Peters TM, Khan AR (2015a): Registration of in vivo to ex vivo MRI of surgically resected specimens: A pipeline for histology to in vivo registration. J Neurosci Methods 241:53–65. [DOI] [PubMed] [Google Scholar]
- Goubran M, Hammond RR, de Ribaupierre S, Burneo JG, Mirsattari S, Steven DA, Parrent AG, Peters TM, Khan AR (2015b): Magnetic resonance imaging and histology correlation in the neocortex in temporal lobe epilepsy. Ann Neurol 77:237–250. [DOI] [PubMed] [Google Scholar]
- Goubran M, Rudko DA, Santyr B, Gati J, Szekeres T, Peters TM, Khan AR (2013b): In vivo normative atlas of the hippocampal subfields using multi‐echo susceptibility imaging at 7 Tesla. Hum Brain Mapp 35:3588–3601. [DOI] [PMC free article] [PubMed] [Google Scholar]
- Groppe DM, Urbach TP, Kutas M (2011): Mass univariate analysis of event‐related brain potentials/fields I: A critical tutorial review. Psychophysiology 48:1711–1725. [DOI] [PMC free article] [PubMed] [Google Scholar]
- Harrison PJ (2004): The hippocampus in schizophrenia: A review of the neuropathological evidence and its pathophysiological implications. Psychopharmacology 174:151–162. [DOI] [PubMed] [Google Scholar]
- Hennessy MJ, Elwes RD, Binnie CD, Polkey CE (2000): Failed surgery for epilepsy A study of persistence and recurrence of seizures following temporal resection. Brain 123:2445–2466. [DOI] [PubMed] [Google Scholar]
- Howell GA, Welch MG, Frederickson CJ (1984): Stimulation‐induced uptake and release of zinc in hippocampal slices. Nature 308:736–738. [DOI] [PubMed] [Google Scholar]
- Huang H, Ceritoglu C, Li X, Qiu A, Miller MI, van Zijl P, Mori S (2008): Correction of B0 susceptibility induced distortion in diffusion‐weighted images using large‐deformation diffeomorphic metric mapping. Magn Reson Imaging 26:1294–1302. [DOI] [PMC free article] [PubMed] [Google Scholar]
- Jackson G, Connelly A, Duncan J, Grünewald R, Gadian D (1993): Detection of hippocampal pathology in intractable partial epilepsy Increased sensitivity with quantitative magnetic resonance T2 relaxometry. Neurology 43:1793–1793. [DOI] [PubMed] [Google Scholar]
- Jardim AP, Neves RSdC, Caboclo LOSF, Lancellotti CLP, Marinho MM, Centeno RS, Cavalheiro EA, Scorza CA, Yacubian EMT (2012): Temporal lobe epilepsy with mesial temporal sclerosis: Hippocampal neuronal loss as a predictor of surgical outcome. Arquivos De Neuro‐Psiquiatria 70:319–324. [DOI] [PubMed] [Google Scholar]
- Jurcoane A, Wagner M, Schmidt C, Mayer C, Gracien RM, Hirschmann M, Deichmann R, Volz S, Ziemann U, Hattingen E (2013): Within‐lesion differences in quantitative MRI parameters predict contrast enhancement in multiple sclerosis. J Magn Reson Imaging 38:1454–1461. [DOI] [PubMed] [Google Scholar]
- Kerchner GA, Deutsch GK, Zeineh M, Dougherty RF, Saranathan M, Rutt BK (2012): Hippocampal CA1 apical neuropil atrophy and memory performance in Alzheimer's disease. Neuroimage 63:194–202. [DOI] [PMC free article] [PubMed] [Google Scholar]
- Khan AR, Goubran M, de Ribaupierre S, Hammond RR, Burneo JG, Parrent AG, Peters TM (2014): Quantitative relaxometry and diffusion MRI for lateralization in MTS and non‐MTS temporal lobe epilepsy. Epilepsy Res 108:506–516. [DOI] [PubMed] [Google Scholar]
- Kinoshita M, Hashimoto N, Goto T, Kagawa N, Kishima H, Izumoto S, Tanaka H, Fujita N, Yoshimine T (2008): Fractional anisotropy and tumor cell density of the tumor core show positive correlation in diffusion tensor magnetic resonance imaging of malignant brain tumors. Neuroimage 43:29–35. [DOI] [PubMed] [Google Scholar]
- Kuzniecky R, Bilir E, Gilliam F, Faught E, Palmer C, Morawetz R, Jackson G (1997): Multimodality MRI in mesial temporal sclerosis: Relative sensitivity and specificity. Neurology 49:774–778. [DOI] [PubMed] [Google Scholar]
- Lencz T, McCarthy G, Bronen RA, Scott TM, Inserni JA, Sass KJ, Novelly RA, Kim JH, Spencer DD (1992): Quantitative magnetic resonance imaging in temporal lobe epilepsy: Relationship to neuropathology and neuropsychological function. Ann Neurol 31:629–637. [DOI] [PubMed] [Google Scholar]
- Lockwood‐Estrin G, Thom M, Focke NK, Symms MR, Martinian L, Sisodiya SM, Duncan JS, Eriksson SH (2012): Correlating 3T MRI and histopathology in patients undergoing epilepsy surgery. J Neurosci Methods 205:182–189. [DOI] [PubMed] [Google Scholar]
- Mackay C, Webb J, Eldridge P, Chadwick D, Whitehouse G, Roberts N (2000): Quantitative magnetic resonance imaging in consecutive patients evaluated for surgical treatment of temporal lobe epilepsy. Magn Reson Imaging 18:1187–1199. [DOI] [PubMed] [Google Scholar]
- Malykhin NV, Lebel RM, Coupland NJ, Wilman AH, Carter R (2010): In vivo quantification of hippocampal subfields using 4.7 T fast spin echo imaging. Neuroimage 49:1224–1230. [DOI] [PubMed] [Google Scholar]
- Manly BF (2006): Randomization, Bootstrap and Monte Carlo Methods in Biology. Boca Raton, FL: CRC Press. [Google Scholar]
- McEwen BS (1999): Stress and hippocampal plasticity. Annu Rev Neurosci 22:105–122. [DOI] [PubMed] [Google Scholar]
- McIntosh AM, Kalnins RM, Mitchell LA, Fabinyi GC, Briellmann RS, Berkovic SF (2004): Temporal lobectomy: Long‐term seizure outcome, late recurrence and risks for seizure recurrence. Brain 127:2018–2030. [DOI] [PubMed] [Google Scholar]
- Morrison JH, Hof PR (1997): Life and death of neurons in the aging brain. Science 278:412–419. [DOI] [PubMed] [Google Scholar]
- Mueller S, Stables L, Du A, Schuff N, Truran D, Cashdollar N, Weiner M (2007): Measurement of hippocampal subfields and age‐related changes with high resolution MRI at 4T. Neurobiol Aging 28:719–726. [DOI] [PMC free article] [PubMed] [Google Scholar]
- Mueller SG, Schuff N, Yaffe K, Madison C, Miller B, Weiner MW (2010): Hippocampal atrophy patterns in mild cognitive impairment and Alzheimer's disease. Hum Brain Mapp 31:1339–1347. [DOI] [PMC free article] [PubMed] [Google Scholar]
- Nichols TE, Holmes AP (2002): Nonparametric permutation tests for functional neuroimaging: A primer with examples. Hum Brain Mapp 15:1–25. [DOI] [PMC free article] [PubMed] [Google Scholar]
- Parekh MB, Rutt BK, Purcell R, Chen Y, Zeineh MM (2015): Ultra‐high resolution in vivo 7.0 T structural imaging of the human hippocampus reveals the endfolial pathway. Neuroimage 112:1–6. [DOI] [PMC free article] [PubMed] [Google Scholar]
- Pauli E, Hildebrandt M, Romstöck J, Stefan H, Blümcke I (2006): Deficient memory acquisition in temporal lobe epilepsy is predicted by hippocampal granule cell loss. Neurology 67:1383–1389. [DOI] [PubMed] [Google Scholar]
- Prudent V, Kumar A, Liu S, Wiggins G, Malaspina D, Gonen O (2010): Human hippocampal subfields in young adults at 7.0 T: Feasibility of imaging 1. Radiology 254:900–906. [DOI] [PMC free article] [PubMed] [Google Scholar]
- Rugg‐Gunn FJ, Eriksson SH, Symms MR, Barker GJ, Thom M, Harkness W, Duncan JS (2002): Diffusion tensor imaging in refractory epilepsy. Lancet 359:1748–1751. [DOI] [PubMed] [Google Scholar]
- Ruifrok AC, Johnston DA (2001): Quantification of histochemical staining by color deconvolution. Anal Quant Cytol Histol 23:291–299. [PubMed] [Google Scholar]
- Savitr Sastri BV, Arivazhagan A, Sinha S, Mahadevan A, Bharath RD, Saini J, Jamuna R, Kumar JK, Rao SL, Chandramouli BA, Shankar SK, Satishchandra P (2014): Clinico‐pathological factors influencing surgical outcome in drug resistant epilepsy secondary to mesial temporal sclerosis. J Neurol Sci 340:183–190. [DOI] [PubMed] [Google Scholar]
- Schmierer K, Parkes HG, So PW, An SF, Brandner S, Ordidge RJ, Yousry TA, Miller DH (2010): High field (9.4 Tesla) magnetic resonance imaging of cortical grey matter lesions in multiple sclerosis. Brain 133:858–867. [DOI] [PubMed] [Google Scholar]
- Schoene‐Bake JC, Keller SS, Niehusmann P, Volmering E, Elger C, Deppe M, Weber B (2014): In vivo mapping of hippocampal subfields in mesial temporal lobe epilepsy: Relation to histopathology. Hum Brain Mapp 35:4718–4728. [DOI] [PMC free article] [PubMed] [Google Scholar]
- Šimić G, Bogdanović N (1997): Volume and number of neurons of the human hippocampal formation in normal aging and Alzheimer's disease. J Comp Neurol 379:482–494. [DOI] [PubMed] [Google Scholar]
- Soille, P. (2003): Morphological Image Analysis: Principles and applications. New York: Springer‐Verlag. [Google Scholar]
- Sommer W (1880): Erkrankung des Ammonshorns als aetiologisches Moment der Epilepsie. Eur Arch Psychiatry Clin Neurosci 10:631–675. [Google Scholar]
- Thivard L, Lehéricy S, Krainik A, Adam C, Dormont D, Chiras J, Baulac M, Dupont S (2005): Diffusion tensor imaging in medial temporal lobe epilepsy with hippocampal sclerosis. Neuroimage 28:682–690. [DOI] [PubMed] [Google Scholar]
- Thom M, Eriksson S, Martinian L, Caboclo LO, McEvoy AW, Duncan JS, Sisodiya SM (2009): Temporal lobe sclerosis associated with hippocampal sclerosis in temporal lobe epilepsy: Neuropathological features. J Neuropathol Exp Neurol 68:928–938. [DOI] [PMC free article] [PubMed] [Google Scholar]
- Thom M, Liagkouras I, Elliot KJ, Martinian L, Harkness W, McEvoy A, Caboclo LO, Sisodiya SM (2010): Reliability of patterns of hippocampal sclerosis as predictors of postsurgical outcome. Epilepsia 51:1801–1808. [DOI] [PubMed] [Google Scholar]
- Van Paesschen W, Revesz T, Duncan J, King M, Connelly A (1997): Quantitative neuropathology and quantitative magnetic resonance imaging of the hippocampus in temporal lobe epilepsy. Ann Neurol 42:756–766. [DOI] [PubMed] [Google Scholar]
- West MJ, Kawas CH, Stewart WF, Rudow GL, Troncoso JC (2004): Hippocampal neurons in pre‐clinical Alzheimer's disease. Neurobiol Aging 25:1205–1212. [DOI] [PubMed] [Google Scholar]
- Wieshmann UC, Symms MR, Barker GJ, Birnie KD, Shorvon SD (1999): Water diffusion in the human hippocampus in epilepsy. Magn Reson Imaging 17:29–36. [DOI] [PubMed] [Google Scholar]
- Winterburn JL, Pruessner JC, Chavez S, Schira MM, Lobaugh NJ, Voineskos AN, Chakravarty MM (2013): A novel in vivo atlas of human hippocampal subfields using high‐resolution 3T magnetic resonance imaging. Neuroimage 74:254–265. [DOI] [PubMed] [Google Scholar]
- Wisse LE, Gerritsen L, Zwanenburg JJ, Kuijf HJ, Luijten PR, Biessels GJ, Geerlings MI (2012): Subfields of the hippocampal formation at 7 T MRI: in vivo volumetric assessment. Neuroimage 61:1043–1049. [DOI] [PubMed] [Google Scholar]
- Yushkevich PA, Amaral RS, Augustinack JC, Bender AR, Bernstein JD, Boccardi M, Bocchetta M, Burggren AC, Carr VA, Chakravarty MM (2015): Quantitative comparison of 21 protocols for labeling hippocampal subfields and parahippocampal subregions in in vivo MRI: Towards a harmonized segmentation protocol. Neuroimage 111:526–541. [DOI] [PMC free article] [PubMed] [Google Scholar]
- Yushkevich PA, Avants BB, Pluta J, Das S, Minkoff D, Mechanic‐Hamilton D, Glynn S, Pickup S, Liu W, Gee JC (2009): A high‐resolution computational atlas of the human hippocampus from postmortem magnetic resonance imaging at 9.4 T. Neuroimage 44:385–398. [DOI] [PMC free article] [PubMed] [Google Scholar]
- Yushkevich PA, Piven J, Hazlett HC, Smith RG, Ho S, Gee JC, Gerig G (2006): User‐guided 3D active contour segmentation of anatomical structures: Significantly improved efficiency and reliability. Neuroimage 31:1116–1128. [DOI] [PubMed] [Google Scholar]