

Abstract
Cognitive control is adaptive in the sense that it inhibits automatic processes to optimize goal‐directed behavior, but high levels of control may also have detrimental effects in case they suppress beneficial automatisms. Until now, the system neurophysiological mechanisms and functional neuroanatomy underlying these adverse effects of cognitive control have remained elusive. This question was examined by analyzing the automatic exploitation of a beneficial implicit predictive feature under conditions of high versus low cognitive control demands, combining event‐related potentials (ERPs) and source localization. It was found that cognitive control prohibits the beneficial automatic exploitation of additional implicit information when task demands are high. Bottom‐up perceptual and attentional selection processes (P1 and N1 ERPs) are not modulated by this, but the automatic exploitation of beneficial predictive information in case of low cognitive control demands was associated with larger response‐locked P3 amplitudes and stronger activation of the right inferior frontal gyrus (rIFG, BA47). This suggests that the rIFG plays a key role in the detection of relevant task cues, the exploitation of alternative task sets, and the automatic (bottom‐up) implementation and reprogramming of action plans. Moreover, N450 amplitudes were larger under high cognitive control demands, which was associated with activity differences in the right medial frontal gyrus (BA9). This most likely reflects a stronger exploitation of explicit task sets which hinders the exploration of the implicit beneficial information in case of high cognitive control demands. Hum Brain Mapp 37:4511–4522, 2016. © 2016 Wiley Periodicals, Inc.
Keywords: automatic processing, cognitive control, EEG, rIFG, source localization
INTRODUCTION
The ability to exert volitional cognitive control over one's actions is an important faculty that allows us to control our behavior and to adapt to dynamic environments [Gruber and Goschke, 2004; Larson et al., 2014; Mansouri et al., 2009]. Yet, exerting great amounts of cognitive control is not only effortful, but may sometimes also be detrimental to behavior, especially in situations where we would benefit from automated behavior or routines—think giving a piano concert or demonstrating a long‐practiced magic trick. To better understand the currently largely neglected field of potential detrimental effects of cognitive control in healthy individuals as well as the underlying neural mechanisms, we need to take a closer look at the interplay of controlled and automated behavior and the associated neurophysiological mechanisms:
By common definition, cognitive control is adaptive in the sense that it inhibits automatic processes to optimize goal‐directed behavior [e.g., Bocanegra and Hommel, 2014; Botvinick et al., 2001]. Today, different types of automatic and volitionally controlled processes are distinguished [for review: Sherman et al., 2008], but within the field of response selection and control, it has been suggested that one process operates on task‐relevant information (i.e., controlled processes that are required to adhere to explicit task instructions/rules) while another one operates on task‐irrelevant information (i.e., automatic processes that are triggered by stimulus features etc.) [e.g., Botvinick et al., 2001; Ulrich et al., 2015]. In most experimental paradigms, cognitive control is adaptive because subjects have to overcome the automatic activation of an incorrect response triggered by an irrelevant feature which is similar or identical to those that need to be attended [Botvinick et al., 2001]. Yet, cognitive control can also have negative effects because it may impair automatic processes which could be beneficial for a certain task. In this context, Bocanegra and Hommel [2014] showed that a predictive feature (an implicit S–R contingency that the study participants were unaware of), which was clearly task‐irrelevant but would nevertheless improve performance if (automatically) taken into account, improved task performance only when participants performed the task rather automatically (i.e., with little cognitive control requirements) but not when they had been required to exert high levels of cognitive control (which actually had a detrimental effect on performance). Bocanegra and Hommel [2014] explain their findings by suggesting that it is necessary to distinguish between the processes responsible for stimulus–response (S–R) translation and the processes responsible for the ultimate selection of a response: They assume that an S–R translation (i.e., the processing of their predictive feature) operates automatically whenever there is a statistical association between a given stimulus feature and a required response [Hommel, 1998]. Yet, only in case of easy and consistent mapping (i.e., in case of low cognitive control demands), all outcomes of S–R translation should have automated access to response selection so that the predictive feature may impinge on behavior. Following from this, detrimental effects of cognitive control should mainly unfold at the response selection level, but only in the automatic condition.
To the best of our knowledge, the neurophysiological mechanisms and the functional neuroanatomy related to these processes have remained elusive. The advantage of electrophysiological (EEG) techniques and event‐related potentials (ERPs) in this context is that they allow to dissociate different cognitive sub‐processes involved in information processing on the basis of their temporal occurrence (e.g., processes of early attentional stimulus processing and processes related to response selection). When combined with source localization techniques, it is furthermore possible to identify brain regions contributing to these sub‐processes and their modulation by the experimental manipulations.
ERPs like the mid‐central N2 and N450, which both reflect cognitive control processes, are likely to depict differences in task‐associated cognitive control demands [for review, see Larson et al., 2014]. The N2 and N450 are both generated in the ACC and adjacent prefrontal structures including the medial frontal gyrus [e.g., Beste et al., 2012; Janssen et al., 2015; Larson et al., 2014; Zhang et al., 2016]. The amplitudes of both ERPs have been reported to be enhanced in case of elevated cognitive control demands [Botvinick et al., 2004; Folstein and Van Petten, 2008; Larson et al., 2014]. The difference between the two ERPs is not yet entirely clear, but the N2 is generally considered to be an indicator of conflict adaptation and monitoring as well as cognitive effort [Botvinick et al., 2004; Chmielewski et al., 2016; Folstein and Van Petten, 2008; Larson et al., 2014]. The N450 may reflect parallel processing of incoming information [Naylor et al., 2012] and has been demonstrated to reflect conflict detection and monitoring [Larson et al., 2014; Vanderhasselt et al., 2012], as well as conflict resolution [Szűcs and Soltész, 2012]. For all of these reasons, it seems likely that the N2 and/or N450 amplitudes are enlarged in case of higher task‐induced control demands. Nevertheless, Bocanegra and Hommel [2014] suggested that the detrimental effects of should mainly unfold at the level of response selection; that is, at the level of stimulus response (S–R) translation. This processing stage is best reflected by the P3 component, which is known to reflect the process of mapping a stimulus onto an appropriate response [Twomey et al., 2015; Verleger et al., 2005, 2015]. Together with the finding that P3 amplitudes are also modulated by conflict and vary with task/control demands [e.g., Barceló et al., 2007; Gajewski et al., 2008; Mückschel et al., 2014; Stock et al., 2015], we hypothesize that the detrimental effect of high control demands on automatic processes will be best reflected by amplitude differences of the P3 ERP. Given that the P3 amplitude has been reported to be increased by task‐relevant stimulus complexity [Schubö et al., 2001], we expect P3 amplitudes to increase in the presence of the predictive feature. In contrast to the ERPs listed above, the P1 and N1 should not be affected in the same manner. The rationale behind this is that they reflect early attentional processing of incoming stimulus material [see Beste et al., 2010; Gajewski et al., 2013; Luck et al., 2000; Schneider et al., 2012], which should not be strongly influenced by the difference between high and low control demands as there is no difference in the used stimuli (compare methods section) [Bocanegra and Hommel, 2014]. To provide a comprehensive analysis of the most commonly analyzed ERPs, we decided to nevertheless include the P1 and N1 in our analyses.
Regarding the brain regions associated with the above neurophysiological parameters, the prefrontal cortex is of special importance as it plays a key role in cognitive control [e.g., Hanna‐Pladdy, 2007; Miller and Cohen, 2001; Stuss and Knight, 2013; Volle et al., 2013]. It has furthermore been shown that several (pre)frontal structures are concerned with the adaptation of response strategies toward statistically optimal behavior [Koechlin, 2015]. One prefrontal region which may be of particular importance is the inferior frontal gyrus (IFG) [Hampshire et al., 2010; Hinaut and Dominey, 2013; Kahn et al., 2015]. Traditionally, the rIFG has been considered to contribute to cognitive control by playing a key role in response inhibition [Aron et al., 2004, 2014] but it has recently become clear that this view is too simplified as the rIFG seems to be involved in cognitive control in a much broader sense [Hampshire et al., 2010; Hampshire, 2015]. Generally speaking, the IFG seems to be concerned with the decoding and acquisition of (implicit) rules/grammar and development of strategies to cope with complex logic input [Hampshire et al., 2010; Hampshire, 2015; Hinaut and Dominey, 2013]. Also, it has been linked to switching to the exploitation of alternative task sets which could improve behavioral outcomes compared with the currently applied behavioral strategy [Koechlin, 2015]. This makes the IFG a likely candidate for the processing of the implicit S–R contingencies used as a predictive feature in our task (see methods section). Opposed to the left IFG, which is known to be heavily involved in the decoding of grammatical structures/rules, syntactic context, semantic processing, grammar learning, and the processing of implicit information [e.g., Dominey and Inui, 2009; Frühholz et al., 2012; Hinaut and Dominey, 2013], the right IFG is more strongly activated by pictures [Krieger‐Redwood et al., 2015], as used in our paradigm. More important, however, it was recently demonstrated that the rIFG plays a key role in implementing response strategies [Dippel and Beste, 2015] where it facilitates the acquisition of expedient response strategies, which is what we expect to be hampered by high cognitive control demands in our study. Furthermore, the rIFG has been shown play a major role in the detection of relevant task cues [Hampshire et al., 2010] and in the automatic (bottom‐up) reprogramming of action plans [Lenartowicz et al., 2011]. In other words, the rIFG should enable us to make use of the implicit S–R contingencies, even when we are not consciously aware of this predictive feature. Based thereon, we hypothesize that the automatic exploitation of the implicit S–R contingency is reflected by the rIFG and impaired in case of high cognitive control demands.
In summary, we expect that behavior only benefits from implicit predictive features in case of low cognitive control requirements, but not in case of high cognitive control requirements. Differences in cognitive control levels should be reflected by the N2 and N450 ERPs. The differential effect of implicit predictive features should become evident at the level of S–R mapping, as reflected by the P3 component. The automatic exploitation of the implicit S–R contingency should be reflected by the rIFG and impaired in case of high cognitive control demands.
MATERIAL AND METHODS
Sample
For this study, n = 43 healthy young participants (28 ♀, 15 ♂) between 18 and 29 years of age (mean 23.8, SD 3.1) were recruited via an advertisement in a local newspaper. All participants stated to be right‐handed and had normal or corrected‐to‐normal vision. None one them reported any history of psychiatric or neurologic diseases. Depression could be ruled out based on Beck Depression Inventory (BDI) [Beck et al., 1961] scores (mean 3.7, SD 3.7). Each participant received a financial reimbursement of 10€. All participants gave written informed consent and were treated in accordance with the declaration of Helsinki. The study was approved by the ethics committee of the TU Dresden.
Task
In this study, we used an experimental paradigm by Bocanegra and Hommel [2014]. The paradigm comprises two separate tasks, namely an “automatic” task and a″ control″ task, which require low vs. high levels of cognitive control due to differences in the complexity of task rules. Furthermore, each task comprises two conditions. One of the conditions encompasses an implicit predictive stimulus feature indicative of the correct response while the other condition does not have a predictive feature and thus serves as a baseline condition. Contrasting the two tasks, one may investigate how much cognitive control impairs the automatic exploitation of implicit stimulus‐response contingencies.
Participants were seated at a distance of 57 cm from a 17″ monitor on which stimuli were presented on a black background. The software “Presentation” (Neurobehavioral Systems Inc.) was used to present stimuli, record responses and send EEG triggers. Responses had to be given by pressing the “Ctrl” buttons on a regular keyboard using the index fingers of each hand.
Except for the instructions given to the participants, the two tasks (control and automatic) were identical: Each comprised 192 trials which were subdivided into 6 equally sized blocks. Stimuli could have two different colors (green or red), two different shapes (square or diamond) and two different sizes (small/∼2.5 cm in diameter or large/∼5 cm in diameter). All four combinations of features (i.e., big red diamond, small green diamond, big green square, small green square) that were employed in this experiment were used equally often and are illustrated in Figure 1. Each trial started with a central presentation of a target stimulus (refer Fig. 1A) which remained on the screen until the participants made a response. In case the participants failed to make a response, stimulus presentation was discontinued after 2,000 ms and the trial was coded as a “miss”. 700 ms after the stimulus offset, a feedback sign indicating correct (“+”) or incorrect (“−”) responses was presented for 500 ms. After a 500 ms presentation of a fixation cross, the following trial was started.
Figure 1.
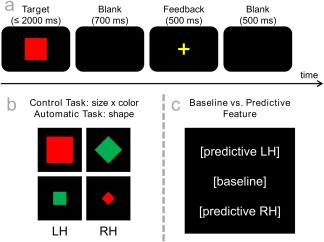
(a) Illustration of the task. Each trial started with the target presentation which was either terminated by the first response or after 2,000 ms had elapsed (in this case, it was coded as a “miss”). It was followed by a 700 ms blank screen, a 500 ms feedback (“+” for correct and “−” for incorrect or missed responses) and a second 500 ms blank screen. (b) Illustration of all employed target stimuli. While targets could vary in color, shape, and size, only four combinations of these features were used. The two stimuli on the left of this graph required a left hand (LH) response while the two stimuli on the right on the graph required a right hand (RH) response. As explained in the methods section, this made the rules used for the control and automatic tasks (theoretically) arbitrary. (c) Illustration of the baseline vs. predictive condition. In the baseline condition, all stimuli were presented in the center of the screen while they were shifted either slightly (3 cm) upward or downward in the predictive condition. Unbeknownst to the participants, all upward stimuli required a left hand response while all downward stimuli required a right hand response. [Color figure can be viewed at http://wileyonlinelibrary.com]
In the control task, participants were asked to respond to the combination of stimulus size and color (refer Fig. 1B). When the target was either large and red or small and green, they were asked to press the left button with their left index fingers. Likewise, they had to use their right index finger on the right button when stimuli were either large and green or small and red. In the automatic task, the instruction only referred to the shape of the stimuli: a left hand response was required for diamonds and a right hand response for squares. In accordance with the study design by Bocanegra and Hommel [2014] and as can be seen in Figure 1, both rules would have been equally applicable in both tasks. In other words, all stimuli could have been correctly answered following either of the instructions, so that all participants began with the control task and performed the automatic task thereafter [compare Bocanegra and Hommel, 2014]. Participants were, however, not provided with this information and when asked at the end of their study participation, none of them stated having “discovered” the fact that the two rules had been arbitrary. Furthermore, half of the trials in each condition were presented in the middle of the screen while the other half was presented slightly but noticeably (∼3 cm/3° visual angle) above or below the middle of the screen. While the central position provided a “baseline” condition, the shifts in the other condition constituted a “predictive feature” where trials requiring a left‐hand response were shifted upward while trials requiring a right‐hand response were shifted downward (refer Fig. 1C). Again, participants were not informed about this and did not report any explicit knowledge about the predictive feature when asked at the end of their participation.
For further analyses, we collected behavioral measures (accuracy and the mean response times of correct responses) for each of the combinations of “task” (control vs. automatic) and “condition” (baseline vs. predictive).
EEG Recording and Data Processing
The EEG war recorded in a shielded 8 m2 lab in the basement of our clinic. While the participants worked on the two tasks, an EEG was recorded with a sampling rate of 500 Hz using a standard 72‐channel Quickamp amplifier and the BrainVision Recorder by Brain Products. Electrode Fpz served as the reference for 60 sintered Ag/AgCl ring electrodes located at standard equidistant scalp positions (customized BrainCap Fast'n Easy sub‐inion model EEG caps). Electrode impedances were kept below 5 kΩ. After recording, the data was down‐sampled to 256 Hz and a band‐pass filter (IIR filter from 0.5 to 20 Hz at a slope of 48 db/oct) was applied. A raw data inspection was conducted to manually remove pauses and technical artifacts. Periodically recurring artifacts including eye‐movements and ECG artifacts were removed by means of an independent component analysis (ICA; Infomax algorithm). Stimulus‐locked segments ranging from −500 ms before to 1,500 ms after the onset of the target stimulus were formed for all trials with correct responses. Segments which still contained artifacts were automatically removed (rejection criteria allowed for a maximal value difference of 200 μV in a 200 ms interval and excluded activity below 0.5 μV in a 100 ms interval). Subsequently, a current source density (CSD) transformation was run to obtain a reference‐free evaluation of the electrophysiological data [Perrin et al., 1989]. Aside from eliminating the reference potential, the CSD transformation serves as a spatial filter that accentuates scalp topography and thus helps to identify electrodes that best reflect activity related to cognitive processes [Nunez and Pilgreen, 1991; Tenke and Kayser, 2012]. Lastly, a baseline correction was applied to the interval from −300 to 0 ms before stimulus onset before the segments were averaged for each participant and condition.
Based on these averages, we quantified the P1 and N1 ERP at electrodes P7/8, the N2 and N450 ERPs at electrode Cz, and the P3 ERP at electrodes PO1/2 and Pz. These electrodes were chosen based on scalp topography maps (see Figs. 3, 4, 5). To verify the choice of electrodes, the mean amplitudes of each single electrode were compared against an average of all other electrodes for each search interval using Bonferroni‐correction for multiple comparisons (critical threshold, P = 0.0008) [Mückschel et al., 2014]. This procedure revealed the same electrode sites as identified by visual inspection. For the quantification of each ERP peak, we chose to average time windows with a minimum length of 10 ms and a maximum length of 20 ms. The length and placement of the time windows for each ERP were chosen so that the averaged ERP peaks of all conditions fell within this time window [for information on how to choose appropriate time windows, see Keil et al., 2014]. The amplitude of the P1 was quantified by extracting the average voltage in the time window from 95 to 105 ms post‐stimulus onset. The amplitude of the N1 was quantified by extracting the average voltage in the time window from 165 to 180 ms post‐stimulus onset. The amplitude of the N2 was quantified by extracting the average voltage in the time window from 235 to 255 ms post‐stimulus onset and the amplitude of the N450 was quantified by extracting the average voltage in the time window from 385 to 405 ms post‐stimulus onset. The amplitude of the P3 was quantified by extracting the average voltage in the time window from 310 to 330 ms post‐stimulus onset. Since the post‐P3 negativity showed amplitude differences for the time window in which participants responded (457 ms for the automatic task and 678 ms for the control task, compare Fig. 4), we furthermore quantified the P3 in a response‐locked fashion. Segments ranged from −1,000 ms before to 1,000 ms after the onset of the response were formed for all trials with correct responses. An artifact rejection procedure and a CSD interpolation were run using the same criteria and settings as for the stimulus‐locked segments. Lastly, a baseline correction was applied to the interval from 300 to 400 ms after the response onset before the segments were averaged for each participant and condition. The response‐locked P3 was then quantified by extracting the average voltage in the time window from −70 to −50 ms pre‐response.
Figure 3.
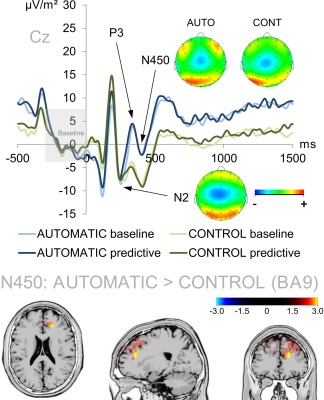
Illustration of the N2 and N450 ERPs at electrode Cz (ERP baseline from −300 to 0 ms). Time point zero denotes the time point of stimulus delivery. The baseline condition of the automatic task is denoted in light blue while the predictive condition of the automatic task is denoted in dark blue. The baseline and predictive conditions of the control task are denoted in light and dark green, respectively. Of note, the N2 was neither modulated by task, nor by condition. By contrast, the N450 showed a main effect of task which was based on activation differences within the right medial frontal gyrus (BA9). The sLORETA color denotes the critical t‐values. [Color figure can be viewed at http://wileyonlinelibrary.com]
Figure 4.
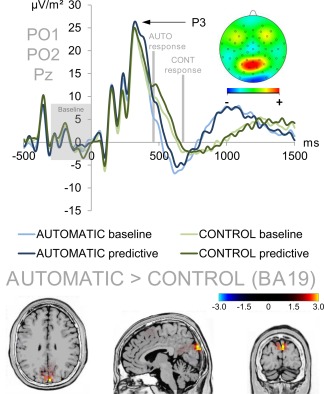
Stimulus‐locked P3 ERP averaged over electrodes PO1, PO2, and Pz (ERP baseline from −300 to 0 ms). Time point zero denotes the time point of stimulus delivery. The baseline condition of the automatic task is denoted in light blue while the predictive condition of the automatic task is denoted in dark blue. The baseline and predictive conditions of the control task are denoted in light and dark green, respectively. The mean response times in the automatic and control tasks are denoted in gray. The P3 amplitude difference between the automatic and the control task was due to a higher activation of the cuneus (BA19) in the automatic task. Due to the visible division between the two average response times, the P3 was also analyzed in a response‐locked fashion (see Fig. 5). The sLORETA color denotes the critical t‐values. [Color figure can be viewed at http://wileyonlinelibrary.com]
Figure 5.
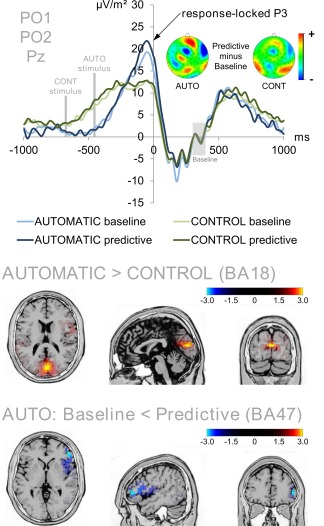
Response‐locked P3 averaged over electrodes PO1, PO2, and Pz (ERP baseline from 300 to 400 ms). Time point zero denotes the time point of the response (button press). The baseline condition of the automatic task is denoted in light blue while the predictive condition of the automatic task is denoted in dark blue. The baseline and predictive conditions of the control task are denoted in light and dark green, respectively. The mean onset of the stimuli in the automatic and control tasks are denoted in gray. The P3 amplitude difference between the automatic and the control task was due to a higher activation of the cuneus (BA18) in the automatic task. The difference between the baseline and predictive conditions was only significant for the automatic task (compare difference maps). The condition difference in the automatic task was due to a higher activation of the rIFG (BA47) in the predictive condition than the baseline condition. The sLORETA color denotes the critical t‐values. [Color figure can be viewed at http://wileyonlinelibrary.com]
Source Localization
Source localization was conducted using sLORETA (standardized low resolution brain electromagnetic tomography; Pascual‐Marqui, 2002], which gives a single linear solution to the inverse problem based on extra‐cranial measurements [Marco‐Pallarés et al., 2005; Pascual‐Marqui, 2002; Sekihara et al., 2005]. For sLORETA, the intracerebral volume is partitioned into 6,239 voxels at 5 mm spatial resolution. The standardized current density at each voxel is calculated in a realistic head model [Fuchs et al., 2002] using the MNI152 template [Mazziotta et al., 2001]. It has been mathematically proven that sLORETA provides reliable results without localization bias [Sekihara et al., 2005]. There is also evidence from EEG/fMRI and neuronavigated EEG/TMS studies underlining the validity of the sources estimated using sLORETA [e.g., Dippel and Beste, 2015; Sekihara et al., 2005]. In this study, the voxel‐based sLORETA images were compared across conditions using the sLORETA‐built‐in voxel‐wise randomization tests with 2,000 permutations, based on statistical nonparametric mapping (SnPM). Voxels with significant differences (P < 0.05, corrected for multiple comparisons) between contrasted conditions were located in the MNI‐brain http://www.unizh.ch/keyinst/NewLORETA/sLORETA/sLORETA.htm. The sLORETA images (colored brain regions) show the results of the source localization analysis and hence present critical t‐values. This means that only significant (P < 0.05) activation differences are shown in the sLORETA maps.
Statistical Analyses
Behavioral and electrophysiological data were analyzed using mixed‐effects ANOVAs using the within‐subject factors “task” (automatic vs. control), “condition” (baseline vs. predictive), and electrode (wherever applicable). Greenhouse‐Geisser corrections were applied when necessary. Post‐hoc tests were bonferroni‐corrected whenever necessary. In the results section, the reported mean values are followed by the standard error of the mean (SEM).
RESULTS
Behavioral Results
The analysis of the number of hits yielded a significant main effect for task (F(1,41) = 62.652; P < 0.001; η 2 = 0.599) with a higher number of hits in the automatic task (94.43 ± 0.20) than in the control task (90.72 ± 0.54). The main effect for condition was not significant (F(1,41) = 0.021; P = 0.887; η 2 < 0.001), but there was a significant interaction of task * condition (F(1,41) = 7.189; P = 0.010; η 2 = 0.146). Post‐hoc t‐tests revealed that the conditions only significantly differed in the automatic task (t = −2.150; P = 0.037; baseline = 94.12 ± 0.30; predictive = 94.74 ± 0.18), but not in the controlled task (t = 1.768; P = 0.084; baseline = 91.07 ± 0.52; predictive = 90.37 ± 0.62). Of note, the baseline condition yielded a lower number of hits than the predictive condition in the automatic task, but showed the reverse pattern in the control task.
The analyses of hit RTs yielded a significant main effect for task (F(1,41) = 482.308; P < 0.001; η 2 = 0.920) with a faster RTs in the automatic task (457.17 ms ± 9.21) than in the control task (677.90 ms ± 15.74). The main effect for condition was not significant (F(1,41) = 0.982; P = 0.327; η 2 = 0.023), and there was only a trend toward the interaction of task * condition (F(1,41) = 3.943; P = 0.054; η 2 = 0.086).
In summary, the behavioral data match the results by Bocanegra and Hommel [2014] who stated that participants should only benefit from the implicit information of the predictive condition when cognitive control is low (i.e., in the automatic task): only in the automatic task, the predictive condition yielded more hits than the baseline condition.
Neurophysiological Results: Early Attentional Stimulus Processing
The P1 and N1 ERPs reflecting early attentional stimulus processing are shown in Figure 2.
Figure 2.
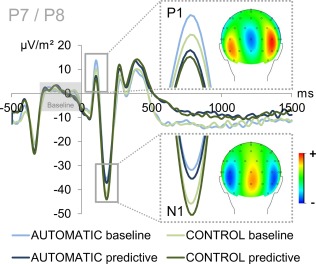
Illustration of the P1 and N1 ERPs averaged over electrodes P7 and P8 (ERP baseline from −300 to 0 ms). Time point zero denotes the time point of stimulus delivery. The baseline condition of the automatic task is denoted in light blue while the predictive condition of the automatic task is denoted in dark blue. The baseline and predictive conditions of the control task are denoted in light and dark green, respectively. The P1 showed differences for both task (automatic > control) and condition (baseline > predictive). As can be seen from the topographic map, the P1 amplitude was larger at P8 than P7. The N1 amplitude only differed with respect to condition (predictive > baseline). [Color figure can be viewed at http://wileyonlinelibrary.com]
The analyses of P1 amplitudes at electrodes P7 and P8 yielded significant main effects for all within‐subject factors. There was a main effect of task (F(1,41) = 16.146; P < 0.001; η 2 = 0.283) with larger P1 amplitudes in the automatic task (11.36 µV/m2 ± 2.05) than in the control task (6.46 µV/m2 ± 2.24). There was a main effect of condition (F(1,41) = 10.811; P = 0.002; η 2 = 0.209) with larger P1 amplitudes in the baseline condition (10.09 µV/m2 ± 2.07) than in the predictive condition (7.73 µV/m2 ± 2.11). There was also a main effect of electrode (F(1,41) = 6.640; P = 0.014; η 2 = 0.139) with larger P1 amplitudes at electrode P8 (12.15 µV/m2 ± 2.82) than at P7 (5.673 µV/m2 ± 1.92). However, all of the interactions were non‐significant for P1 amplitudes (all F ≤ 3.640; P ≥ 0.063).
The analyses of N1 amplitudes at electrodes P7 and P8 yielded a main effect of condition (F(1,41) = 56.756; P < 0.001; η 2 = 0.581) with larger N1 amplitudes in the predictive condition (−42.66 µV/m2 ± 3.86) than in the baseline condition (−36.08 µV/m2 ± 3.53). All other main effects and interactions were non‐significant for N1 amplitudes (all F ≤ 2.590; P ≥ 0.115).
Put briefly, both task and condition affected early attentional ERPs (P1: enhanced initial stimulus processing in case of the automatic task and baseline stimuli; N1: enhanced stimulus processing in the predictive condition) but lacked the interaction of task and condition observed in the behavioral data.
Neurophysiological Results: N2 and N450 as Cognitive Control Measures
The N2 and N450 ERPs reflecting cognitive control processes are shown in Figure 3. Of note, the N2 did not show any main effect or interaction of task and condition (all F ≤ 1.090; P ≥ 0.303). The later N450, however, showed a main effect of task (F(1,41) = 17.854; P < 0.001; η 2 = 0.303) with a larger amplitude in the control task (−8.823 µV/m2 ± 1.76) than in the automatic task (−2.081 µV/m2 ± 2.244). sLORETA analyses (sLORETA maps were corrected for multiple comparisons using randomization test based on statistical nonparametric mapping, SnPM) revealed that this difference was due to the right medial frontal gyrus (BA9). There were no other significant main effects of interactions (all F ≤ 0.044; P ≥ 0.835). Yet, this effect vanished when quantifying the N450 in a peak‐to‐peak fashion by subtracting the N450 peak from the preceding P3 peak quantified at electrode Cz in the time window from 315 to 335 ms (all F ≤ 1.324; P ≥ 0.257).
Neurophysiological Results: P3 as a Measure of S–R Mapping and Response Selection
The stimulus‐locked P3 ERP is shown in Figure 4. The analyses of stimulus‐locked P3 amplitudes at electrodes PO1, PO2, and Pz yielded a significant interaction of task * electrode (F(1,41) = 4.110; P = 0.022; η 2 = 0.091). This was due to the fact that electrode Pz had a higher P3 amplitude in the automatic task (26.71 µV/m2 ± 2.78) than in the control task (23.65 µV/m2 ± 2.28) (t = 2.574; P = 0.014) while this was not the case for electrode PO1 (t = −0.123; P = 0.903; automatic = 27.37 µV/m2 ± 2.94; control = 27.53 µV/m2 ± 3.03) or electrode PO2 (t = 0.23; P = 0.982; automatic = 23.28 µV/m2 ± 2.82; control = 23.26 µV/m2 ± 2.58). sLORETA analyses (sLORETA maps were corrected for multiple comparisons using randomization test based on statistical nonparametric mapping, SnPM) of task effect revealed that this difference was due to activation differences within the cuneus (BA 19, see Fig. 4).
There was furthermore an interaction of condition * electrode (F(1,41) = 3.262; P = 0.044; η 2 = 0.074). This effect did however not survive post‐hoc testing (all t ≤ |−1.586|; P ≥ 0.108). All other main effects and interactions were non‐significant (all F ≤ 2.987; P ≥ 0.091).
As the post‐P3 negativity showed amplitude differences for the time window in which participants responded (457 ms for the automatic task and 678 ms for the control task, compare Fig. 4) in the stimulus‐locked data, we furthermore quantified the P3 in a response‐locked fashion. The response‐locked P3 ERP is shown in Figure 5.
The analyses of response‐locked P3 amplitudes at electrodes PO1, PO2, and Pz yielded significant main effects for all within‐subject factors. There was a main effect of task (F(1,41) = 18.516; P < 0.001; η 2 = 0.311) with larger response‐locked P3 amplitudes in the automatic task (20.84 µV/m2 ± 2.33) than in the control task (12.78 µV/m2 ± 1.42). sLORETA analyses (sLORETA maps were corrected for multiple comparisons using randomization test based on statistical nonparametric mapping, SnPM) revealed that this difference was due to activation differences within the cuneus (BA 18, see Fig. 5). There was a main effect of condition (F(1,41) = 4.132; P = 0.049; η 2 = 0.092) with slightly larger P3 amplitudes in the predictive condition (17.46 µV/m2 ± 1.73) than in the baseline condition (16.16 µV/m2 ± 1.72). There was also a main effect of electrode (F(1,41) = 6.518; P = 0.004; η 2 = 0.137) with the largest P3 amplitudes at electrode PO1 (19.63 µV/m2 ± 2.03), intermediate amplitudes at Pz (16.88 µV/m2 ± 1.80) and the smallest amplitudes at PO2 (13.93 µV/m2 ± 1.93). Yet, only electrode PO1 and PO2 significantly differed from each other (t = 4.093; P < 0.001; all other t ≤ 1.863 and all other P ≥ 0.070). There was furthermore an interaction of condition * electrode (F(1,41) = 6.803; P = 0.002; η 2 = 0.142). This was due to the fact that electrode PO2 had a higher P3 amplitude in the predictive condition (15.22 µV/m2 ± 1.92) than in the baseline condition (12.64 µV/m2 ± 2.01) (t = −3.227; P = 0.002) while this was not the case for electrode PO1 (t = −1.101; P = 0.278; predictive = 20.07 µV/m2 ± 2.07; baseline = 19.18 µV/m2 ± 2.07) or electrode Pz (t = −0.802; P = 0.427; predictive = 17.10 µV/m2 ± 1.87; baseline = 16.65 µV/m2 ± 1.78). More importantly, however, there was a significant interaction of task * condition (F(1,41) = 7.014; P = 0.011; η 2 = 0.146). This effect was due to the fact that there was a significant condition difference in the automatic task (t = −3.271; P = 0.002; baseline = 19.14 µV/m2 ± 2.34; control = 21.74 µV/m2 ± 2.36). The sLORETA analyses (corrected for multiple comparisons using randomization test based on statistical nonparametric mapping, SnPM) showed that this condition difference was due to increased activity within the right inferior frontal gyrus (BA47). Of note, the control task did not show a similar effect (t = 0.065; P = 0.949; baseline = 12.81 µV/m2 ± 1.44; control = 12.75 µV/m2 ± 1.52).
In summary, both the stimulus‐locked P3 and the response‐locked P3 showed a main effect of task, but only the response‐locked P3 also showed an interaction of task and condition reflecting the behavioral results. In line with the assumption that the predictive feature will be processed better in the automatic than in the control task, the response‐locked P3 amplitude was larger in the predictive condition than in the baseline condition only of the automatic task, but not the control task.
DISCUSSION
In this study, we investigated the neurophysiological basis of detrimental effects of high levels of cognitive control using a recently developed paradigm by Bocanegra and Hommel [2014] which varies the beneficial exploitation of an implicit predictive feature by means of different cognitive control demands.
Confirming the basic behavioral findings by Bocanegra and Hommel [2014], we found that participants responded both faster and more accurately in the automatic task, which required less cognitive control than the control task. This confirms that the manipulation of (effortful) cognitive control demands was effective and resulted in two different tasks despite the fact that both tasks used exactly the same stimuli and that the task rules were (theoretically) arbitrary. As a result, any differences between the automatic and control task can be attributed to differences in cognitive control task demands. Most importantly, however, the predictive feature only conveyed an advantage (i.e., improved accuracy) in case of low control demands, but not in case of high control demands. This confirms the assumption that automatic S–R translations of the implicit feature only gain access to response selection when low control demands allow for easy and consistent mapping [Bocanegra and Hommel, 2014]. There are two possible explanations for this effect. Limited response selection resources or working memory capacities could supposedly be “used up” by the task demands in case of high cognitive control, so that the beneficial information of the predictive feature is blocked from the response selection stage and thus can no longer impinge on behavior [e.g., Cui et al., 2015; Joyce, 2016]. In case of low control demands, there would however still be capacities left for the exploration of additional available implicit information. Partly opposing this limited capacities account, one could however also argue that high control demands restrict processing to a more exploitatory response mode where task goals are more strictly shielded to be maintained [Barack and Gold, 2016; Koechlin, 2015]. As a consequence, switching to the exploratory mode required to acquire the implicit predictive S–R contingency and to turn it into a beneficial task set could have been prevented by high levels of cognitive control. Even though the behavioral data do not allow to falsify either explanation, it can nevertheless be stated that high levels of cognitive control impair the implicit learning of S–R contingencies underlying potentially beneficial automatisms guiding our responses.
Regarding the neurophysiological data, we found a main effect of the predictive feature for both the P1 and N1 irrespective of control demands. Yet, the P1 showed larger amplitudes in the baseline condition while the N1 showed larger amplitudes in the predictive condition. The main reason for this might be that the predictive condition consisted of a stimulus shift: The initial bottom‐up processing as reflected by the P1 might work better when the target it is presented centrally within the visual field (i.e., baseline condition), than when it is somewhat off the center (i.e., predictive condition). While the N1 also reflects initial attentional processing [Luck et al., 2000], it furthermore comprises early aspects of voluntary stimulus discrimination processes [Hopf et al., 2002; Vogel and Luck, 2000; Wascher and Beste, 2010], which might have contributed to the discrimination between predictive and baseline condition stimuli, thus delivering essential initial information about difference between those two conditions. The fact that we found a main effect, but no interaction, nicely confirms our hypothesis that the behavioral effects would not be found at the level of early attentional stimulus processing as S–R contingencies should always be registered, but do not necessarily enter response selection stages [Bocanegra and Hommel, 2014; Hommel, 1998].
Next, we analyzed the mid‐central cognitive control ERPs N2 and N450. Both components reflect conflict detection, monitoring and adaptation but the functional distinction between them is somewhat unclear [Larson et al., 2014]. While the N2 component was not modulated by control demands, the later N450 showed larger amplitudes in case of higher cognitive control demands. This effect vanished when quantifying the N450 in a peak‐to peak fashion by subtracting it from the preceding P3 amplitudes. One might argue that the N450 effects are therefore nothing more than a result of the preceding P3 peak. Yet, the fact that the task differences in the P3 and N450 peaks could be attributed to clearly distinct anatomical sites (cuneus for P3 and medial frontal gyrus for the N450) leads us to believe that it is nevertheless useful to take a closer look at the observed N450 differences. As mentioned in the introduction, most cognitive control paradigms pair their target with some sort of distractor so that an erroneous response tendency arises in addition to the correct one [Botvinick et al., 2004; Cavanagh and Frank, 2014; Diamond, 2013]. In those experimental settings, the need for control hence often arises from the conflict between several response tendencies, like in flanker or stroop tasks [Larson et al., 2014] where incorrect response tendencies have to be suppressed/inhibited. However, our paradigm differs from this as it does not evoke several incompatible response tendencies. Instead, the demand for cognitive control is created by varying the complexity of the task rule. We found the associated differences in N450 amplitudes to be based on a lower activity of the right medial frontal gyrus (BA9). Together with the finding that the medial frontal gyrus is thought to enable the exploration of more beneficial task sets (i.e., behaviorally more effective/beneficial S–R associations) [Koechlin, 2015], it seems that the high top‐down control exerted in the control task kept the participants from exploring the potential benefits of the predictive feature the switch the exploration. Following the model proposed by Koechlin [2015], it seems that the observed right medial frontal gyrus activation differences reflect a top‐down shielding of the exploitation of explicitly implemented task goal at the expense of the exploration of potentially better task sets. The fact that right medial frontal gyrus activation was more pronounced in the automatic task may be the reason for the diminished exploitation of the implicit feature in the control task. Yet, this effect could only be observed for the P3 component.
The P3 component is known to reflect the process of mapping appropriate responses onto perceived task‐relevant stimuli [Verleger et al., 2005, 2015]. Both the stimulus‐locked and the response‐locked P3 yielded larger amplitudes at electrode Pz in case of low cognitive control demands. Such a P3 decrease with task difficulty has already been reported in other studies [e.g. Cutmore et al., 2015; Gajewski and Falkenstein, 2013] and it has been suggested that the P3 amplitude depends on the attentional resources left over by the primary task [Polich, 2007; Schubö et al., 2001]. Supporting this assumption, we found that this difference was due to a higher activation of the cuneus (BA 19 in the stimulus‐locked P3 and BA18 in the response‐locked P3) in the automatic task as compared with the control task.
Hence, one could argue that “free” processing capacities were signaled by enhanced BA18/19 activation. While the main effect of cognitive control requirements could be seen as support for the limited capacity approach put forward by Bocanegra and Hommel [2014] or Cui et al. [2015], the interaction found for the response‐locked P3 does not match this account: Mirroring the interaction observed at the behavioral level, the predictive feature further increased response‐locked P3 amplitudes in case of low control requirements (as compared with the non‐predictive baseline condition), but did not make a difference when cognitive control requirements were high (compare Fig. 5). Although it is not entirely clear why only the response‐locked P3 mirrored the behavioral data, the fact that this effect was caused by differences in locking points suggests that response‐related aspects of the processes contributing to the P3 amplitude probably play an important role in the generation of the observed effect. Given the above assumption that the increased P3 we found in the simpler (automatic) task indicates free capacities which could be used for the exploitation of the implicit predictive feature, it needs to be explained why the predictive feature further increases P3 amplitudes in the automatic task (instead of decreasing them). A first explanation for this seemingly contradictory finding was provided by Schubö et al. [2001] who reported that the P3 is increased by unattended stimulus complexity, but only when the source of complexity is previously experienced as task‐relevant or when the primary task was rather simple to perform. This is furthermore underpinned by the finding that the predictive feature difference in the automatic task was due to higher rIFG (BA47) activity in the predictive as compared with the baseline condition. The rIFG plays a key role in implementing response strategies [Dippel and Beste, 2015], in the detection of relevant task cues [Hampshire et al., 2010] and in the automatic (bottom‐up) reprogramming of action plans [Lenartowicz et al., 2011]. Given that the IFG has been furthermore been demonstrated to mediate the exploitation of alternative task sets (in our case, implementing and benefitting from the implicit S–R contingencies of the predictive feature) [Koechlin, 2013] it can rather safely be assumed that the observed increase in rIFG activity reflects the beneficial bottom‐up automatic exploitation of the implicit S‐R contingency.
In this context, it should however be kept in mind that the rIFG does not act on its own but is an integral part of several large‐scale networks. One of those networks consists of the IFG, the PPC, and the preSMA and “rapidly tunes to represent those inputs and responses that form the currently intended task schema. Thus, the response within this network is particularly strong when cues are detected that trigger effortful and task relevant behaviors” [Hampshire et al., 2010]. This is however not the only network in which the rIFG plays an integral role as Koechlin [2013] identified a frontal network concerned with adaptive behavior. It comprises the basal ganglia as well as several frontal and prefrontal structures including the medial frontal gyrus and IFG. Based on Koechlin's model, it may be concluded that switching to the exploratory mode, which is needed to acquire the implicit predictive S–R contingency and to turn it into a beneficial task set, has been prevented by high levels of cognitive control. Still, more causal studies (lesions, TMS, tDCS, etc.) are needed to further underpin our interpretation of the role of the rIFG in this task setting. Also, further research is needed to clarify the reason for the observed lateralization pattern. As briefly mentioned in the introduction, the IFG is subject to language lateralization. While the left IFG is heavily involved in the decoding of grammatical structures/rules, syntactic context, semantic processing, grammar learning, and the processing of implicit information [e.g., Dominey and Inui, 2009; Frühholz et al., 2012; Hinaut and Dominey, 2013], the right IFG is more strongly activated by pictures [Krieger‐Redwood et al., 2015]. It is hence possible that the non‐verbal pictorial stimuli used in our study were predominantly processed in the right hemisphere. Yet, recent findings suggest that this explanation could be an over‐simplification that does not sufficiently account for the special role of the rIFG in cognitive control [Hampshire et al., 2010; Hampshire, 2015].
CONCLUSION
In summary, we investigated the potential detrimental effects of cognitive control on automatic processes by analyzing the automatic exploitation of a beneficial implicit predictive feature under conditions of high versus low cognitive control demands. We found that bottom‐up perceptual and attentional selection processes (P1 and N1 ERPs) are not modulated by this. The automatic exploitation of beneficial predictive information in case of low cognitive control demands was associated with larger response‐locked P3 amplitudes and a higher activation of the rIFG. This suggests that the rIFG plays a key role in the detection of relevant task cues and the automatic (bottom‐up) implementation and reprogramming of action plans. Moreover, the N450 amplitude was larger in case of high cognitive control demands, which was associated with activity differences in the right medial frontal gyrus. This most likely reflects a stronger exploitation of explicit task sets which hinders the exploration of the implicit beneficial information in case of high cognitive control demands. Together, the results show that dissociable sub‐processes related to distinct functional neuroanatomical correlates are involved in detrimental/non‐adaptive effects of cognitive control.
REFERENCES
- Aron AR, Robbins TW, Poldrack RA (2004): Inhibition and the right inferior frontal cortex. Trends Cogn Sci 8:170–177. [DOI] [PubMed] [Google Scholar]
- Aron AR, Robbins TW, Poldrack RA (2014): Inhibition and the right inferior frontal cortex: One decade on. Trends Cogn Sci 18:177–185. [DOI] [PubMed] [Google Scholar]
- Barack DL, Gold JI (2016): Temporal trade‐offs in psychophysics. Curr Opin Neurobiol 37:121–125. [DOI] [PMC free article] [PubMed] [Google Scholar]
- Barceló F, Periáñez JA, Nyhus E (2007): An information theoretical approach to task‐switching: Evidence from cognitive brain potentials in humans. Front Hum Neurosci 1:13. [DOI] [PMC free article] [PubMed] [Google Scholar]
- Beck AT, Ward CH, Mendelson M, Mock J, Erbaugh J (1961): An inventory for measuring depression. Arch Gen Psychiatry 4:561–571. [DOI] [PubMed] [Google Scholar]
- Beste C, Baune BT, Falkenstein M, Konrad C (2010): Variations in the TNF‐α gene (TNF‐α −308G→A) affect attention and action selection mechanisms in a dissociated fashion. J Neurophysiol 104:2523–2531. [DOI] [PubMed] [Google Scholar]
- Beste C, Ness V, Lukas C, Hoffmann R, Stüwe S, Falkenstein M, Saft C (2012): Mechanisms mediating parallel action monitoring in fronto‐striatal circuits. NeuroImage 62:137–146. [DOI] [PubMed] [Google Scholar]
- Bocanegra BR, Hommel B (2014): When cognitive control is not adaptive. Psychol Sci 25:1249–1255. [DOI] [PubMed] [Google Scholar]
- Botvinick MM, Braver TS, Barch DM, Carter CS, Cohen JD (2001): Conflict monitoring and cognitive control. Psychol Rev 108:624–652. [DOI] [PubMed] [Google Scholar]
- Botvinick MM, Cohen JD, Carter CS (2004): Conflict monitoring and anterior cingulate cortex: An update. Trends Cogn Sci 8:539–546. [DOI] [PubMed] [Google Scholar]
- Cavanagh JF, Frank MJ (2014): Frontal theta as a mechanism for cognitive control. Trends Cogn Sci 18:414–421. [DOI] [PMC free article] [PubMed] [Google Scholar]
- Chmielewski WX, Mückschel M, Dippel G, Beste C (2016): Concurrent information affects response inhibition processes via the modulation of theta oscillations in cognitive control networks. Brain Struct Funct 221:3949–3961. [DOI] [PubMed] [Google Scholar]
- Cui J‐F, Wang Y, Shi H‐S, Liu L‐L, Chen X‐J, Chen Y‐H (2015): Effects of working memory load on uncertain decision‐making: Evidence from the Iowa Gambling Task. Front Psychol 6:162. [DOI] [PMC free article] [PubMed] [Google Scholar]
- Cutmore TRH, Halford GS, Wang Y, Ramm BJ, Spokes T, Shum DHK (2015): Neural correlates of deductive reasoning: An ERP study with the Wason Selection Task. Int J Psychophysiol Off J Int Organ Psychophysiol 98:381–388. [DOI] [PubMed] [Google Scholar]
- Diamond A (2013): Executive functions. Annu Rev Psychol 64:135–168. [DOI] [PMC free article] [PubMed] [Google Scholar]
- Dippel G, Beste C (2015): A causal role of the right inferior frontal cortex in implementing strategies for multi‐component behaviour. Nat Commun 6:6587. [DOI] [PubMed] [Google Scholar]
- Dominey PF, Inui T (2009): Cortico‐striatal function in sentence comprehension: Insights from neurophysiology and modeling. Cortex J Devoted Study Nerv Syst Behav 45:1012–1018. [DOI] [PubMed] [Google Scholar]
- Folstein JR, Van Petten C (2008): Influence of cognitive control and mismatch on the N2 component of the ERP: A review. Psychophysiology 45:152–170. [DOI] [PMC free article] [PubMed] [Google Scholar]
- Frühholz S, Ceravolo L, Grandjean D (2012): Specific brain networks during explicit and implicit decoding of emotional prosody. Cereb Cortex N Y N 1991 22:1107–1117. [DOI] [PubMed] [Google Scholar]
- Fuchs M, Kastner J, Wagner M, Hawes S, Ebersole JS (2002): A standardized boundary element method volume conductor model. Clin Neurophysiol Off J Int Fed Clin Neurophysiol 113:702–712. [DOI] [PubMed] [Google Scholar]
- Gajewski PD, Falkenstein M (2013): Effects of task complexity on ERP components in Go/Nogo tasks. Int J Psychophysiol Off J Int Organ Psychophysiol 87:273–278. [DOI] [PubMed] [Google Scholar]
- Gajewski PD, Stoerig P, Falkenstein M (2008): ERP–correlates of response selection in a response conflict paradigm. Brain Res 1189:127–134. [DOI] [PubMed] [Google Scholar]
- Gajewski PD, Hengstler JG, Golka K, Falkenstein M, Beste C (2013): The functional tumor necrosis factor‐α (308A/G) polymorphism modulates attentional selection in elderly individuals. Neurobiol Aging 34:2694.e1–2694.e12. [DOI] [PubMed] [Google Scholar]
- O Gruber, T Goschke (2004): Executive control emerging from dynamic interactions between brain systems mediating language, working memory and attentional processes. Acta Psychol (Amst) 115:105–121. [DOI] [PubMed] [Google Scholar]
- Hampshire A (2015): Putting the brakes on inhibitory models of frontal lobe function. NeuroImage 113:340–355. [DOI] [PMC free article] [PubMed] [Google Scholar]
- Hampshire A, Chamberlain SR, Monti MM, Duncan J, Owen AM (2010): The role of the right inferior frontal gyrus: Inhibition and attentional control. NeuroImage 50:1313–1319. [DOI] [PMC free article] [PubMed] [Google Scholar]
- Hanna‐Pladdy B (2007): Dysexecutive syndromes in neurologic disease. J Neurol Phys Ther JNPT 31:119–127. [DOI] [PubMed] [Google Scholar]
- Hinaut X, Dominey PF (2013): Real‐time parallel processing of grammatical structure in the fronto‐striatal system: A recurrent network simulation study using reservoir computing. PloS One 8:e52946. [DOI] [PMC free article] [PubMed] [Google Scholar]
- Hommel B (1998): Automatic stimulus‐response translation in dual‐task performance. J Exp Psychol Hum Percept Perform 24:1368–1384. [DOI] [PubMed] [Google Scholar]
- Hopf J‐M, Vogel E, Woodman G, Heinze H‐J, Luck SJ (2002): Localizing visual discrimination processes in time and space. J Neurophysiol 88:2088–2095. [DOI] [PubMed] [Google Scholar]
- Janssen TWP, Heslenfeld DJ, van Mourik R, Geladé K, Maras A, Oosterlaan J (2015): Alterations in the ventral attention network during the stop‐signal task in children with ADHD: An event‐related potential source imaging study. J Atten Disord. DOI: 10.1177/1087054715580847. [DOI] [PubMed] [Google Scholar]
- Joyce AW (2016): Implicit working memory: Implications for assessment and treatment. Appl Neuropsychol Child 5:223–234. [DOI] [PubMed] [Google Scholar]
- Kahn LE, Peake SJ, Dishion TJ, Stormshak EA, Pfeifer JH (2015): Learning to play it safe (or not): stable and evolving neural responses during adolescent risky decision‐making. J Cogn Neurosci 27:13–25. [DOI] [PMC free article] [PubMed] [Google Scholar]
- Keil A, Debener S, Gratton G, Junghöfer M, Kappenman ES, Luck SJ, Luu P, Miller GA, Yee CM (2014): Committee report: Publication guidelines and recommendations for studies using electroencephalography and magnetoencephalography. Psychophysiology 51:1–21. [DOI] [PubMed] [Google Scholar]
- Koechlin E (2013): Motivation, control, and human prefrontal executive function In: Stuss DT, Knight RT, editors. Principles of Frontal Lobe Function, 2nd ed New York: Oxford University Press; pp 279–291. [Google Scholar]
- Koechlin E (2015): Prefrontal executive function and adaptive behavior in complex environments. Curr Opin Neurobiol 37:1–6. [DOI] [PubMed] [Google Scholar]
- Krieger‐Redwood K, Teige C, Davey J, Hymers M, Jefferies E (2015): Conceptual control across modalities: Graded specialisation for pictures and words in inferior frontal and posterior temporal cortex. Neuropsychologia 76:92–107. [DOI] [PMC free article] [PubMed] [Google Scholar]
- Larson MJ, Clayson PE, Clawson A (2014): Making sense of all the conflict: A theoretical review and critique of conflict‐related ERPs. Int J Psychophysiol Off J Int Organ Psychophysiol 93:283–297. [DOI] [PubMed] [Google Scholar]
- Lenartowicz A, Verbruggen F, Logan GD, Poldrack RA (2011): Inhibition‐related activation in the right inferior frontal gyrus in the absence of inhibitory cues. J Cogn Neurosci 23:3388–3399. [DOI] [PubMed] [Google Scholar]
- Luck SJ, Woodman GF, Vogel EK (2000): Event‐related potential studies of attention. Trends Cogn Sci 4:432–440. [DOI] [PubMed] [Google Scholar]
- FA Mansouri, K Tanaka, MJ Buckley (2009): Conflict‐induced behavioural adjustment: a clue to the executive functions of the prefrontal cortex. Nat Rev Neurosci 10:141–152. [DOI] [PubMed] [Google Scholar]
- Marco‐Pallarés J, Grau C, Ruffini G (2005): Combined ICA‐LORETA analysis of mismatch negativity. NeuroImage 25:471–477. [DOI] [PubMed] [Google Scholar]
- Mazziotta J, Toga A, Evans A, Fox P, Lancaster J, Zilles K, Woods R, Paus T, Simpson G, Pike B, Holmes C, Collins L, Thompson P, MacDonald D, Iacoboni M, Schormann T, Amunts K, Palomero‐Gallagher N, Geyer S, Parsons L, Narr K, Kabani N, Le Goualher G, Boomsma D, Cannon T, Kawashima R, Mazoyer B (2001): A probabilistic atlas and reference system for the human brain: International Consortium for Brain Mapping (ICBM). Philos Trans R Soc Lond B Biol Sci 356:1293–1322. [DOI] [PMC free article] [PubMed] [Google Scholar]
- Miller EK, Cohen JD (2001): An integrative theory of prefrontal cortex function. Annu Rev Neurosci 24:167–202. [DOI] [PubMed] [Google Scholar]
- Mückschel M, Stock A‐K, Beste C (2014): Psychophysiological mechanisms of interindividual differences in goal activation modes during action cascading. Cereb Cortex N Y N 24:2120–2129. 1991 [DOI] [PubMed] [Google Scholar]
- Naylor LJ, Stanley EM, Wicha NYY (2012): Cognitive and electrophysiological correlates of the bilingual stroop effect. Front Psychol 3:81. [DOI] [PMC free article] [PubMed] [Google Scholar]
- Nunez PL, Pilgreen KL (1991): The spline‐Laplacian in clinical neurophysiology: A method to improve EEG spatial resolution. J Clin Neurophysiol Off Publ Am Electroencephalogr Soc 8:397–413. [PubMed] [Google Scholar]
- Pascual‐Marqui RD (2002): Standardized low‐resolution brain electromagnetic tomography (sLORETA): technical details. Methods Find Exp Clin Pharmacol 24 Suppl D:5–12. [PubMed] [Google Scholar]
- Perrin F, Pernier J, Bertrand O, Echallier JF (1989): Spherical splines for scalp potential and current density mapping. Electroencephalogr Clin Neurophysiol 72:184–187. [DOI] [PubMed] [Google Scholar]
- Polich J (2007): Updating P300: an integrative theory of P3a and P3b. Clin Neurophysiol Off J Int Fed Clin Neurophysiol 118:2128–2148. [DOI] [PMC free article] [PubMed] [Google Scholar]
- Schneider D, Beste C, Wascher E (2012): On the time course of bottom‐up and top‐down processes in selective visual attention: An EEG study. Psychophysiology 49:1492–1503. [DOI] [PubMed] [Google Scholar]
- Schubö A, Meinecke C, Schröger E (2001): Automaticity and attention: Investigating automatic processing in texture segmentation with event‐related brain potentials. Brain Res Cogn Brain Res 11:341–361. [DOI] [PubMed] [Google Scholar]
- Sekihara K, Sahani M, Nagarajan SS (2005): Localization bias and spatial resolution of adaptive and non‐adaptive spatial filters for MEG source reconstruction. NeuroImage 25:1056–1067. [DOI] [PMC free article] [PubMed] [Google Scholar]
- Sherman JW, Gawronski B, Gonsalkorale K, Hugenberg K, Allen TJ, Groom CJ (2008): The self‐regulation of automatic associations and behavioral impulses. Psychol Rev 115:314–335. [DOI] [PubMed] [Google Scholar]
- Stock A‐K, Popescu F, Neuhaus AH, Beste C (2015): Single‐subject prediction of response inhibition behavior by event‐related potentials. J Neurophysiol jn.00969. 2015. [DOI] [PMC free article] [PubMed] [Google Scholar]
- Stuss DT, Knight RT, editors (2013): Principles of Frontal Lobe Function, 2nd ed New York: Oxford University Press. [Google Scholar]
- Szűcs D, Soltész F (2012): Functional definition of the N450 event‐related brain potential marker of conflict processing: A numerical stroop study. BMC Neurosci 13:35. [DOI] [PMC free article] [PubMed] [Google Scholar]
- Tenke CE, Kayser J (2012): Generator localization by current source density (CSD): implications of volume conduction and field closure at intracranial and scalp resolutions. Clin Neurophysiol Off J Int Fed Clin Neurophysiol 123:2328–2345. [DOI] [PMC free article] [PubMed] [Google Scholar]
- Twomey DM, Murphy PR, Kelly SP, O'Connell RG (2015): The classic P300 encodes a build‐to‐threshold decision variable. Eur J Neurosci 42:1636–1643. [DOI] [PubMed] [Google Scholar]
- Ulrich R, Schröter H, Leuthold H, Birngruber T (2015): Automatic and controlled stimulus processing in conflict tasks: Superimposed diffusion processes and delta functions. Cognit Psychol 78:148–174. [DOI] [PubMed] [Google Scholar]
- Vanderhasselt M‐A, De Raedt R, Dillon DG, Dutra SJ, Brooks N, Pizzagalli DA (2012): Decreased cognitive control in response to negative information in patients with remitted depression: An event‐related potential study. J Psychiatry Neurosci JPN 37:250–258. [DOI] [PMC free article] [PubMed] [Google Scholar]
- Verleger R, Jaśkowski P, Wascher E (2005): Evidence for an integrative role of P3b in linking reaction to perception. J Psychophysiol 19:165–181. [Google Scholar]
- Verleger R, Hamann LM, Asanowicz D, Śmigasiewicz K (2015): Testing the S‐R link hypothesis of P3b: The oddball effect on S1‐evoked P3 gets reduced by increased task relevance of S2. Biol Psychol 108:25–35. [DOI] [PubMed] [Google Scholar]
- Vogel EK, Luck SJ (2000): The visual N1 component as an index of a discrimination process. Psychophysiology 37:190–203. [PubMed] [Google Scholar]
- Volle E, Lewy R, Burgess PW (2013): A new era for lesion‐behavior mapping of prefrontal functions In: Stuss DT, Knight RT, editors. Principles of Frontal Lobe Function, 2nd ed New: Oxford University Press; pp 500–523. [Google Scholar]
- Wascher E, Beste C (2010): Tuning perceptual competition. J Neurophysiol 103:1057–1065. [DOI] [PubMed] [Google Scholar]
- Zhang R, Stock A‐K, Fischer R, Beste C (2016): The system neurophysiological basis of backward inhibition. Brain Struct Funct. DOI: 10.1007/s00429-016-1186-0 [DOI] [PubMed] [Google Scholar]