Abstract
We present a novel method for fiber‐based comparison of diffusion tensor imaging (DTI) scans of groups of subjects. The method entails initial preprocessing and fiber reconstruction by tractography of each brain in its native coordinate system. Several diffusion parameters are sampled along each fiber and used in subsequent comparisons. A spatial correspondence between subjects is established based on geometric similarity between fibers in a template set (several choices for template are explored), and fibers in all other subjects. Diffusion parameters between groups are compared statistically for each template fiber. Results are presented at single fiber resolution. As an initial exploratory step in neurological population studies this method points to the locations affected by the pathology of interest, without requiring a hypothesis. It does not make any grouping assumptions on the fibers and no manual intervention is needed. The framework was applied here to 18 healthy subjects and 23 amyotrophic lateral sclerosis (ALS) patients. The results are compatible with previous findings and with the tract based spatial statistics (TBSS) method. Hum Brain Mapp 37:477–490, 2016. © 2015 Wiley Periodicals, Inc.
Keywords: DTI, ALS, whole brain tractography, tractogram, white matter fibers, mean diffusivity, fractional anisotropy, radial diffusivity, axial diffusivity
INTRODUCTION
Diffusion weighted imaging (DWI) characterizes the diffusion of water in the tissues and is sensitive to the microstructural density and orientation of tissue membranes [Alexander et al., 2011]. Diffusion tensor imaging (DTI) derives neural tract directional information from DWI scans. This makes it a powerful tool for noninvasive characterization of brain tissues. It is widely used for studying white matter (WM) organization and the microstructural changes that occur with neuropathology and following treatment [Alexander et al., 2007]. In the last 20 years DTI has been utilized to study WM architecture and integrity in both normal and diseased brains. This contribution addresses its application when studying neurological diseases in vivo. This type of research usually aims to identify potential brain targets for therapeutic interventions, as well as to develop diagnostic criteria, and outcome measures for clinical trials.
In DTI analysis, a diffusion tensor is computed for each voxel based on a set of diffusion weighted images (DWI). The principal directions of the tensor were shown to generally coincide with the local orientation of WM axon bundles [Mori and van Zijl, 2002]: Tractography algorithms are capable of generating anatomically plausible estimates of WM trajectories (“WM fibers”) by tracing these principal directions which thus creates a “virtual dissection” of major WM tracts for each individual. Diffusion tensors are also used to derive various diffusivity parameters, such as fractional anisotropy (FA) and mean diffusion (MD). It is important to note that DTI‐generated fibers may have poor integrity in areas of fibers crossings, which is why a plethora of High Angular Resolution Diffusion Imaging (HARDI) models have been introduced in the past 10 years [Prčkovska et al., 2012]. One of its drawbacks is that HARDI requires large b‐values and at least 60 diffusion orientations, which may not be feasible in clinical applications. Here, we used DTI, which requires much shorter scan durations that preserve the patient's comfort [Prčkovska et al., 2012].
In DTI‐based research, methods for comparison between groups of subjects can be roughly divided into two categories: comparison of specific predefined brain regions or whole brain comparison. The advantage of the latter approach is that no prior knowledge of the disease is assumed, and no tedious segmentation of the volumes of interest (VOIs) or fiber tracts is required.
The two most well‐known approaches to whole‐brain comparison are voxel‐based morphometry‐style analysis [VBM—Ashburner and Friston, 2000] and tract‐based spatial statistics [TBSS—Smith et al., 2006]. In VBM‐style analysis of WM, FA maps (or maps of other diffusivity indices) are usually used for voxel‐wise comparisons between groups of subjects. In TBSS the FA maps of all the individual subjects are projected into a common space and a mean FA skeleton is created. Then, each subject's (aligned) FA map is projected onto the skeleton. Next, voxel‐wise statistics of the diffusion parameters are calculated across subjects in this skeleton space [Smith et al., 2006]. Both these methods are strongly dependent on the registration of all the brains to a single template since the analysis is performed voxel‐wise.
In recent years, there has been growing interest in applying tractography to population studies. A combination of tractographic‐ and voxel‐based analysis known as tract‐wise fractional anisotropy statistics (TFAS) was proposed by Mueller et al. [2007, 2009]. It is designed to analyze specific WM tracts. Bundles of fibers tracked on averaged and coregistered brain data are used as a skeleton, which becomes the basis for voxel‐based statistical analysis of the underlying FA maps. TFAS based on different skeletons has been used to quantify interconnectivity and to map differences between patients with atrophy of the corpus callosum (CC) where the CC has thinned as a result of hereditary spastic paraparesis (cHSP), and age‐matched healthy controls. The FA values from the voxels marked by the skeleton were used for t test comparisons between the healthy and the thinned CC groups. Another fiber based analysis scheme was described by Goodlett et al. [2009]. First, a tensor atlas is constructed from multiple coregistered subjects. Major fiber tracts are reconstructed within this atlas using manually defined seed regions. After creation of the template fiber tracts, diffusion statistics from the individual cases are mapped to the atlas tracts. This creates a fiber bundle for each subject that uses the geometry of the template atlas tract but replaces the diffusion properties with those mapped from the subject. The set of individual tracts with the corresponding geometry and varying diffusion properties is then compared. Yeatman et al. proposed an automated fiber‐tract quantification framework that measures tract profiles of MRI parameters for multiple pre‐defined WM tracts [Yeatman et al., 2012]. The “tract core” is identified as the representative average fiber for each tract. All tract fibers are clipped to include the central part of the tract at equal lengths and resampled at an equal number of points. Diffusion properties are calculated along the resampled clipped fibers and are summarized at each node by taking a weighted average of the diffusion properties at that node. The resulting profiles are used for inter‐ and intra‐ subject comparisons. This approach preserves the along‐tract information but averages the measures across the different fibers. A similar approach was described by Colby et al. [2012], where the mean profiles of FA and other metrics are created along a centroid fiber of a predefined tract.
In the current work, we propose a novel method for whole brain fiber‐based comparison between groups of subjects. The preprocessing and tractography of each brain is carried out on the brain's native coordinate system (without prior registration to another brain). The diffusion parameters sampled along the fibers are then used in subsequent comparisons. The spatial correspondence between the subjects is based on geometric similarities between fibers in a template set and the fibers of the other brains. The results are presented for each template fiber. This framework has several advantages over the methods reviewed above: it makes no fiber groupings and does not require a manual definition of volumes or tracts of interest. In addition, the results are presented at single fiber resolution, which allows for maximum flexibility of interpretation. Another advantage is that non‐linear registration to a common space is not required. Unlike most fiber‐based works, our method performs the tractography of each individual brain in its original coordinate space, ensuring an optimal match to the subjects’ individual anatomy.
We conducted an initial validation of this method using a dataset of patients with Amyotrophic Lateral Sclerosis (ALS) and age‐matched controls. The results were compared to previously published findings [Agosta et al., 2010; Ben Bashat et al., 2011; Sato et al., 2010] and to TBSS results.
ALS is a fatal neurodegenerative disease that affects upper motor neurons in the brain and spinal cord, lower motor neurons, and at times the fronto‐temporal cortical brain areas. It has a markedly heterogeneous clinical presentation and course [Kiernan et al., 2011]. Currently, there is no imaging‐based diagnostic test for ALS, and confident diagnosis is mainly based on clinical assessments of upper and/or lower motor neuron signs together with a history of the progression of symptoms. In many patients with ALS, diagnostic certainty currently entails a delay of about one to one‐and‐a‐half years from the onset of symptoms to diagnosis; this delay prevents potentially early treatment with disease‐modifying drugs, leads to unnecessary medical interventions and affects the patients’ quality of life [Paganoni et al., 2014]. The greatest contribution of MRI to ALS research so far has been its use in reliably excluding other diagnoses. For these reasons, an extensive search for biomarkers in ALS is now under way that draws on advances in molecular biology and noninvasive imaging. It was shown [Ben Bashat et al., 2011] that DTI can detect WM impairment in patients with ALS in several brain regions. Whole‐ brain fiber based analysis approaches may thus be able to reveal useful biomarkers to help define diagnostic criteria.
In the following, we describe the proposed framework for whole brain fiber based comparison. The methodology is described in Material and Methods section, the results are presented in Results section, and the discussion and conclusion are found in Discussion and Conclusion section.
MATERIAL AND METHODS
The first step consists of performing streamline tractography for each brain in its native space. The diffusion related parameters, fractional anisotropy (FA), mean diffusivity (MD), radial diffusivity (Dr) and axial diffusivity (Da) are calculated for each brain and sampled along each of its fibers. Next, the correspondences between the individual fibers in all the brains are found. To do so, a template set of whole brain fibers (BT) is selected. For each fiber in the BT, the closest fiber from each of the other brains is determined. This yields parameter values from the corresponding fibers in each group for each fiber in the template brain. Typically the groups consist of a healthy and a patient group. In step three, statistical comparisons are run between the sets of values derived from the corresponding fibers in the two groups. Each of these steps and the input data are described in detail below.
Data
Subjects
The dataset consisted of two groups of subjects: a control group of 18 healthy subjects and an ALS group of 23 patients. Only patients under 60 years of age with no more than two cardiovascular risk factors were included. The healthy control group included only individuals with no history of neurological disease and no abnormalities as detected on conventional MR images (T1 and T2 weighted images). These are the same patients that were used by Ben Bashat et al. [2011].
MRI protocol
MRI scans were performed on a 3.0T MRI scan ner (GE Signa‐EXCITE, Milwaukee, WI). The imaging parameters were: field of view = 220 mm; acquired matrix 128 × 128 (in plane pixel size 1.7188 × 1.7188 mm2); Time to repeat/echo time (TR/TE) = 11,000/91 ms; slice thickness = 3 mm. Most DTI scans were acquired along 15 gradient directions (b = 0, 1000 s mm−2), with the exception of three healthy subjects who were scanned along 19 directions. It was qualitatively verified that these three scans were very similar to the rest; i.e., they contained similar numbers of fibers and the easily recognized tracts were similar in form, which was expected since the difference in the number of directions was not overly large.
Tractography and Parameter Sampling
The brains were preprocessed using FMRIB Software Library software for eddy current correction and head motion correction using FSL software (http://fsl.fmrib.ox.ac.uk/fsl/fslwiki) [Smith et al., 2004]. For each brain the DTI‐derived parameters—FA, MD, Dr, and Da—were calculated per voxel. , where λ1, λ2, λ3 are the eigenvalues of the diffusion tensors. FA measures the fraction of the tensor that can be assigned to anisotropic diffusion. provides complementary information to FA. and are the apparent diffusivities in the directions perpendicular and parallel to the WM tracts [Alexander et al., 2011].
In each brain the WM fibers were reconstructed with a deterministic tractography algorithm (Fiber Assignment by Continuous Tracking, FACT, DTIStudio (https://www.mristudio.org/), [Mori et al., 1999]). All WM voxels with FA > 0.25 were considered seed points. The stopping criterion for tractography was FA < 0.25, θ>70˚, where θ is the direction change between two subsequent points. All fibers shorter than 50 mm millimeter were discarded.
Next, all the parameter values were sampled along each fiber. Mean values for each fiber were calculated and recorded (“fiber‐mean FA,” “fiber‐mean MD,” etc.). The voxels in which the FA value fell below 0.25 were masked and were not included in the calculation of the mean values.
Fiber Representation
Each fiber, f, is a discrete curve in 3D. The tractography software (DTIstudio) represents the reconstructed fibers as sequences of coordinates of varying lengths. We chose to resample each fiber at N points equidistantly. Thus each fiber was represented by a fixed length coordinate sequence of 3 x N points located equidistantly along its trajectory: . Here, N is chosen to be 20. Previous research [Zvitia et al., 2010] has shown this to be a good compromise between dimensionality and fidelity to the original representation. Another representation issue to be addressed was the direction of the fiber sequence. We implicitly assumed that corresponding points in similar fibers from different brains have the same ordinal index. In fact, the direction of fiber tracking and thus the order of points are not always the same in different scans, and two similar fibers can have very similar sampling coordinates but in reverse order. A simple direction standardization step was thus performed to ensure consistent numbering of sample points along fibers. We calculated the distance between the first and the last point along a fiber in each axis (x, y, z). For fiber f we calculated df (the distance between the beginning and the end) as .The dominant direction of the fiber was considered to be the one in which the absolute difference was the largest. If the difference in that direction was negative, the points order was flipped. This procedure ensured the consistency in points ordering of similar fibers.
Finding Fiber Correspondences
Defining spatial correspondence between the analyzed brains is a major challenge in all works that involve cross‐subject comparisons. In voxel‐based analysis schemes this usually entails mapping all brain volumes onto a common coordinate system usually defined by an atlas or an averaged brain template. In our fiber based framework we need to determine the fiber‐to‐fiber correspondence for all brains, so that each fiber “knows” to which fibers from the other brains it is to be compared.
The tractography of each brain yields a different set of fibers. There are marked variations in the number of fibers per brain as well as shape differences due to misalignment, diverse anatomy and tractography artifacts. Instead of warping all the brains onto a common target we suggest treating them in their native coordinate systems. A fiber‐based correspondence between the brains is created using a standard set of fibers—a template. The goal is to have a set of whole‐ brain typical fibers that can be used to find corresponding fibers across the different brains based on their geometric shape and location. The template also serves as a reference structure on which the results of the comparison are recorded and presented. A template brain can be an arbitrarily chosen typical brain, or a representative set of fibers created specifically for this purpose. For each fiber in the template set we find the corresponding fiber in each of the other brains. In what follows we use the following terminology: let B m be the m'th brain in a dataset and BT a template brain. The brains' corresponding fibers will be labeled for fibers in BT (I is the number of fibers in the template) and will be the fibers of the m'th brain in the dataset (J is the number of fibers in Bm). The superscript denotes the brain index and the subscript denotes the number of fiber in that brain's fiber set.
Each brain undergoes a two‐step process:
Step 1: The template brain (BT) is affinely registered to the current study brain (Bm, m=1:M, where m is the index of a brain and M is the number of brains participating in the study). This is done by using the iterative closest fiber algorithm, ICF [Mayer et al., 2011]. Briefly, ICF relies on the direct registration between two sets of fibers, without requiring any intensity‐based registration as preprocessing. Here the template brain served as the model and the current brain B m served as the target for registration.
- For each model fiber BTi the matching target fiber is found such that:
(1) The actual matching of the closest fiber is done by finding an approximate nearest‐neighbor using the Locality Sensitive Hashing (LSH) framework [Darrell et al., 2006]. An affine transform is fitted on the set of matched fibers using the RANSAC scheme [Fischler and Bolles, 1981]. The recovered transform is subsequently applied to warp the model fibers towards the matched target fibers. The ICF loop described above is repeated until convergence of the mean square error between the matched model and target fibers.
Step 2: For each template fiber, the closest fiber from B m is identified and its index is recorded (again m is a serial number of a brain in the study, 1 < m < M where M is the total number of brains analyzed). This is done by warping the template fiber set as close as possible to the coordinates of the current study brain using the affine transformation obtained in the previous step. The distance between each warped template fiber and each target brain fiber is measured in the L2 sense and the closest fiber is found using the LSH approach for approximate nearest neighbors. LSH is based on the simple idea that if two points are close together, after a “projection” operation these two points will remain close together. The target data are embedded in the bins of several hash tables in a preprocessing step. The LSH hash functions have the property of assigning neighboring feature points to the same bins with an elevated probability [Darrell et al., 2006]. The use of LSH helps alleviate the computational burden of finding the nearest neighbors for each template fiber from each study brain. In our case of a 60‐dimensional feature vector per fiber, the resulting speed‐up was at least two orders of magnitude compared to a naïve nearest neighbors (NN) computation.
At the conclusion of this two‐step process, for each template fiber we now have the index of its closest fiber in each study brain. Any fibers whose distance from the corresponding reference fiber is larger than a selected threshold Td are discarded. The mean parameter values from the closest fibers are recorded for the statistical comparison in the next step. Figure 1 illustrates these two steps.
Figure 1.
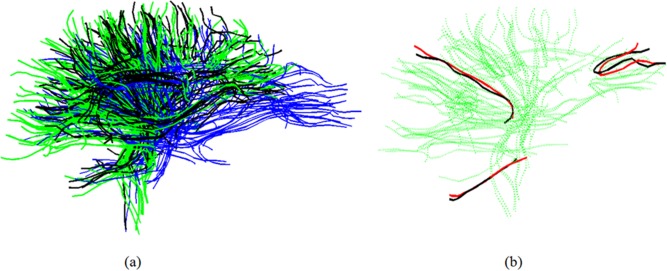
(a) Warping the template to B m. blue—template; green—B m; black—the warped template; (b) Finding closest fibers. Green—B m; black—several fibers from warped template. Red—the closest neighbors from B m to each of the black fibers. [Color figure can be viewed in the online issue, which is available at http://wileyonlinelibrary.com.]
The validity of fiber matching is assessed by examining a group of fibers in the template and the corresponding matching fibers in each of the brains in the set. Figure 2a–c presents three subgroups of fibers from a template brain. The subgroups are the corpus callosum, the midbody of the corpus callosum and the right cortico‐spinal tracts that were manually marked on the template brain using the DTIstudio software. The fibers are overlaid on slices of FA to provide a context for the fibers' location and shape. Each subsequent row of the figure shows the matched fibers for one of the brains in the data set. The second and the third rows are brains from a healthy group while the fourth and the fifth row are brains from the patient group. The figure shows that the fibers from a given anatomical tract are indeed correctly matched to the same anatomical tract in each of the brains, even though they differ in shape and size. Figure 3 depicts the percentage of template fibers that were successfully matched for each brain. Note that a template fiber is defined as successfully matched when its distance from the detected nearest neighbor is smaller than threshold T d. The behavior pattern remains similar for the two groups, with more than 50% percent of matched fibers for all subjects, and most around 70–90%.
Figure 2.
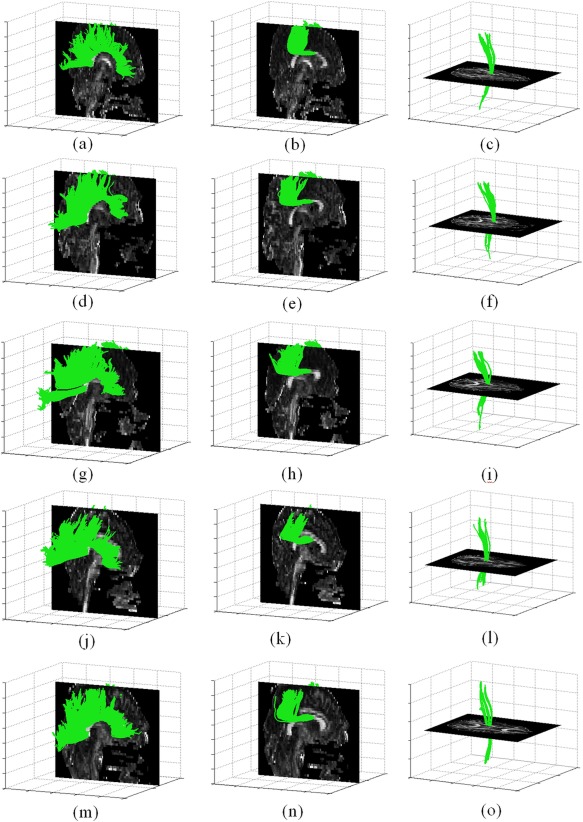
(a–c) Several sub groups of fibers manually marked on a model brain; (d– i) Matched fibers to each sub group in two arbitrary chosen brains from the healthy control group; (j– o) Matched fibers to each sub group in two arbitrary chosen brains from the ALS patient group. [Color figure can be viewed in the online issue, which is available at http://wileyonlinelibrary.com.]
Figure 3.
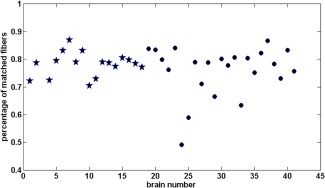
The percentage of template fibers that were successfully matched in each brain: Healthy brains (stars) and ALS patient brains (circles). [Color figure can be viewed in the online issue, which is available at http://wileyonlinelibrary.com.]
The combination of noisy data and the limitations of tractography algorithms (poor treatment of crossing fibers) may result in a certain number of incomplete fibers. The matching between full length and incomplete fibers is increasingly penalized by L2 distance with more difference in length. In practice, we assume that the presence of many almost identical and thus spatially redundant fibers will usually ensure the availability of the full length fibers required for good matches.
The choice of T d may affect the quality of the matches. If T d is set too high, dissimilar fibers may be considered a match. If T d is too low, matches can be missed, which would reduce the number of fibers included in the comparisons. We empirically found that performance remains stable for a range of T d values from 30 to 45 mm. The parameter was thus set to 40 for all experiments. Several examples of fiber matches with different distances are shown in Figure 4. The black fiber is a template fiber warped to a test brain coordinates. The red fiber is the closest found match while a blue is a further fiber that is too distant to be accepted as a match.
Figure 4.
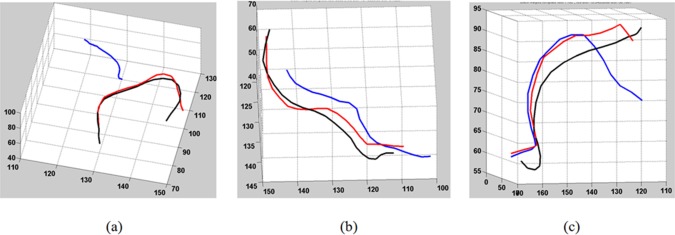
Examples of fibers with their closest neighbors and their distances: (a)—red fiber distance is 18 mm, blue—109 mm; (b) red—15 mm, blue—52 mm; (c) red—18 mm, blue—50 mm. [Color figure can be viewed in the online issue, which is available at http://wileyonlinelibrary.com.]
Fiber‐wise Comparisons
At this point, each fiber in a template brain is related to a collection of M or fewer closest fibers. The number of compared values for some template fibers may be less than M if the nearest fibers from some of the brains were discarded due to their large distance from the warped template fiber. To clarify, assume that we want to compare the fiber‐mean FA values of brains from group 1 and group 2, and that the two groups contain M1 and M2 number of brains. A statistical comparison is made for each template fiber between the M1 (or less) FA values from the group1 brains (e.g., healthy subjects) and the M2 (or less) FA values from the group 2 brains (e.g., ALS patients). Some of the template's fibers may be atypical (incomplete or incorrectly connected to another fiber), mostly due to tractography artifacts. Such template fibers will not be matched in most of the other brains, and will have a very small number of values for comparison. In this work we require the number of compared values in each group to be larger than M min. Otherwise no comparison is carried out for that template fiber and it is marked as non‐significant. If M min is large (close to the number of subjects in each group), there will be more template fibers for which no comparison is made. On the other hand setting M min too low may create comparisons with only one or two values per group. The value M min = 4 was chosen empirically as a compromise and was kept constant for all experiments.
Unpaired one‐tailed t tests were used to determine whether for each particular fiber there was a significant difference between the fiber‐mean FA values originating from group 1 and from group 2. The fibers with significantly different values of FA (or MD, Dr, Da) are marked on the template fiber set, providing a clear visual representation of the location and spread of affected fibers.
Several methods of statistical significance testing were considered for this analysis. The issue of multiple comparisons was the main concern since a simultaneous comparison was made over thousands of fibers. This is the same hurdle that has to be overcome in the field of voxel‐wise comparison as well as in microarray analysis and many others. The standard Bonferroni correction controls the Family Wise Error (FEW); that is, it guarantees that there is only a 5% chance (for example) of any false positives appearing in the data [Bland and Altman, 1995]. This is much too conservative for our task since it entails dividing the chosen significance level by the number of fibers. The more recent false discovery rate (FDR) correction was thus chosen for this work [Benjamini and Hochberg, 1995]. Instead of looking at FEW, FDR controls the number of false‐positive discoveries in the data. For example, setting the FDR control level to 0.1 guarantees that no more than 10% of the active voxels are false positives. FDR adapts the significance threshold to the data and is less stringent than FEW corrections when the signal is very small.
The processing steps required for each template fiber are illustrated in Figure 5. The template brain is shown in (a), with the currently analyzed fiber marked in black. Example brains from the healthy (b) and the ALS groups (c) are shown as well. The currently analyzed fiber from the template is overlaid in black on each of these brains, warped to its coordinates. The closest fibers found in each of the brains are displayed in red. The data structure used to store the parameters values (e.g., fiber‐mean FA) is shown in (d). Each row of this table corresponds to a particular template fiber. Each column corresponds to the mean value from the closest fibers found in a particular brain. Statistical testing is carried out independently for each row in the table on the values found from the healthy brains vs. values originating from the ALS brains. The template fibers for which one group has a significantly different parameter values from the other group, are marked in color (blue: ALS> healthy, red: ALS< healthy), as shown in Figure 6.
Figure 5.
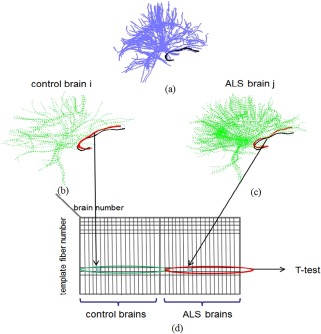
Illustration of steps performed for each template fiber: (a) template fibers set. One of the fibers marked in black; (b) One of the healthy brains. Shown is the warped template fiber (black) and its closest fiber (red); (c) Same as (b), for one of the ALS patient brains; (d) FA table. Each row corresponds to a template fiber. The fiber‐mean FA values from the matching fibers of this particular template fiber are stored in the columns of the corresponding brains. [Color figure can be viewed in the online issue, which is available at http://wileyonlinelibrary.com.]
Figure 6.

Results of whole brain comparison: Fibers in which ALS > control shown in blue; Fibers in which ALS < control shown in red. FA analysis (column a), MD analysis (b), Dr analysis (c); Whole brain analysis (1); CC fibers (2); Mid‐body of CC (3); Right CST (4); Left CST (5). [Color figure can be viewed in the online issue, which is available at http://wileyonlinelibrary.com.]
RESULTS
The results obtained using the new methodology is described next. First the method was applied using one of the typical brains as the template (Single Subject Template section). Next, we used the CONNECT/Archi fiber atlas as the template, where the fibers are presegmented into multiple fiber tracts (Using a Fiber Atlas as a Template section). Finally analysis with TBSS was performed on the same set of brains for comparison (Comparison to TBSS section).
Single Subject Template
The whole brain fiber‐based comparison method was applied to the dataset described in Data section made up of a group of 23 patients with ALS and a healthy control group composed of 18 subjects. In this section the template brain was chosen to be one of the typical healthy brains.
The results on the whole brain set of fibers are presented in Figure 6, row 1. These results were produced using the following set of parameters: T d = 40, M min = 4. The issue of multiple comparisons was addressed by using FDR with a significance level of 0.1. The first column contains the results of FA analysis, the second column focuses on the MD parameter, and the third shows Dr. Fibers for which the values in the ALS group are smaller than in the control group are shown in red. The blue fibers denote the inverse relation. As expected, we see mostly red fibers in the FA result, meaning there was a significant reduction in FA in the ALS group. The red fibers are concentrated in a few specific regions in the brain. The MD and the Dr results indicated elevated MD and Dr in ALS patients which was also consistent with predictions. The results for Da are omitted since only a very small number of significant fibers was found (close to zero), which also conforms to previous findings.
We compare the performance of the proposed method to previous work on DTI analysis in ALS [Ben Bashat et al., 2011]. The findings presented in Ben Bashat et al. included reduced WM integrity, as indicated by reduced FA, increased MD, and increased Dr, mainly in the midbody of the corpus callosum (CC) and the cortico spinal tract (CST) in patients with ALS compared to controls. On the basis of these results, we examined several sub groups of fibers that were manually identified in the template (Fig. 6): CC—row 2, CC midbody (Witelson segment 2, 3 [Witelson, 1989])—row 3, right and left CST—rows 4, 5, respectively. The figure shows that the detected fibers are concentrated in the central part of the CC tract. These fibers have a lower FA and higher MD and Dr in the ALS group. A similar relationship can clearly be seen in the CST, which is known to be the main affected fiber tract.
To further quantify the results presented in Figure 6, the percentage of significant fibers are summarized in Table 1. An elevated Dr was detected in 6.1% of the brain fibers. A high percentage of fibers with elevated Dr are present in the CC, and an even higher percentage in the CC midbody (13%) and the CST tracts (39%, 71%), with no reduced Dr fibers present. Table 1 does not include a column for Da since no detections were made for that parameter.
Table 1.
FA, MD, Dr, and Da analysis: percentages of significant fibers in the whole brain and different subsets (relative to the size of each subset)
| FA; ALS< cont | MD; ALS >cont | Dr; ALS >cont | |
|---|---|---|---|
| Whole brain | 1% | 2.3% | 6.1% |
| CC | 1.2% | 1.1% | 6.3% |
| CC Midbody | 1.5% | 1% | 13% |
| CST‐r | 13% | 17.4% | 39.6% |
| CST‐l | 21.8% | 9.1% | 71% |
The template for the analysis conducted here was one of the healthy brains. However we also tested several different templates, as shown in Figure 7. Each row corresponds to a particular template. Even though the shapes of the individual template fibers varied across the templates, the same effects depicted in Figure 6 were present in each case. In the case of FA there was reduced FA in ALS, whereas the inverse relationship was found for Md, Dr which were concentrated mainly in the midbody of CC and in the CST.
Figure 7.
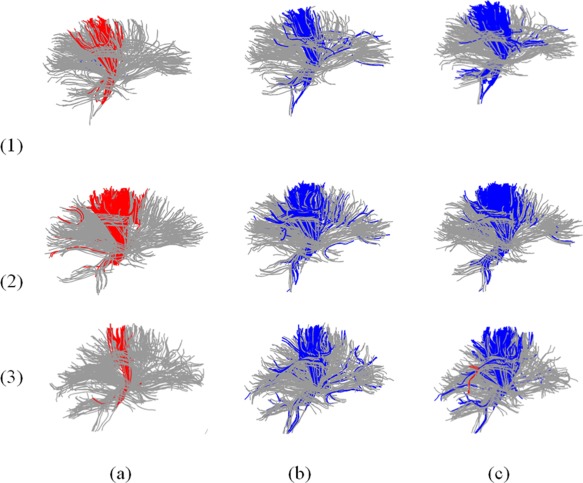
FA, MD, Dr analysis using different templates, blue: ALS > control; red: ALS < control; row (1) template 1, row (2) template 2, row (3) template 3; column (a) FA, column (b) MD, column (c) Dr. [Color figure can be viewed in the online issue, which is available at http://wileyonlinelibrary.com.]
Using a Fiber Atlas as a Template
The use of a population based atlas as a template is shown next. The template was the CONNECT/Archi WM bundle atlas that was developed as part of the FP7 CONNECT project (http://brainconnect.eu). The atlas is based on 12 subjects in the NMR public database [Guevara et al., 2012] acquired on a GE Healthcare Signa 1.5 Tesla Excite II scanner. The diffusion data present a high angular resolution (HARDI) based on 200 directions and a b‐value of 3000 s mm−2 (voxel size of 1.875 × 1.875 × 2 mm3). This atlas is a model of the organization of the white matter and is made up of a set of generic fiber bundles that can be detected in most of the population. Each of the streamlines comprising the atlas represents a centroid of a fiber bundle (fascicle). The centroids were obtained in a two‐step clustering process. First, individual tractograms were clustered into small fascicles yielding one centroid per fascicle (the centroid is in fact the fiber with the smallest distance to the others within the fascicle). The second clustering step considered all the individual centroids together and created fascicles of centroids which actually correspond to the fibers in the CONNECT/Archi atlas used here [Guevara et al., 2012].
The atlas contains 38 known deep white matter bundles: 12 left hemispheric long WM bundles, 5 left thalamic radiations, 12 right hemispheric long WM bundles, 5 right thalamic radiations, and 4 inter‐hemispheric subparts of the CC. It also contains 47 superficial white matter bundles in each hemisphere. Only the deep white matter bundle portion of the atlas was used, as these are the fibers most likely to be reliably reconstructed from our non‐HARDI data.
The atlas is presented in Figure 8 where each color indicates a different fiber tract. Results using this atlas are shown in Figure 9. The bar plots show the percentage of the fibers detected per tract. Top row depicts results for FA analysis with the bar plot showing the percentage of fibers with reduced FA in patients. The second and the third row show results for MD and Dr, respectively. The results for Da analysis are not shown since the number of detected fibers there was negligible (<1% per tract). The most prominent bars are those corresponding to tracts number 1 (midbody of CC), 11 and 12 (left CST), 28 and 29 (right CST). In MD and Dr there are two additional bars at tracts number 16 and 33, which correspond to right and left uncinate fasciculus. The same T d and M min were used here as in the previous section.
Figure 8.
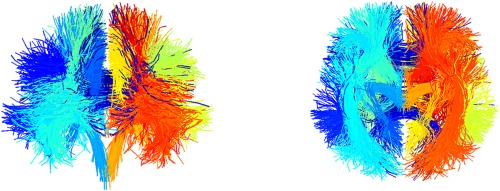
CONNECT fiber atlas, two views. The different colors correspond to the different 38 fiber tracts the atlas contains. For instance the darkest blue in the middle is the body of corpus callosum. The brightest yellow on the right side is inferior right thalamic radiations. [Color figure can be viewed in the online issue, which is available at http://wileyonlinelibrary.com.]
Figure 9.
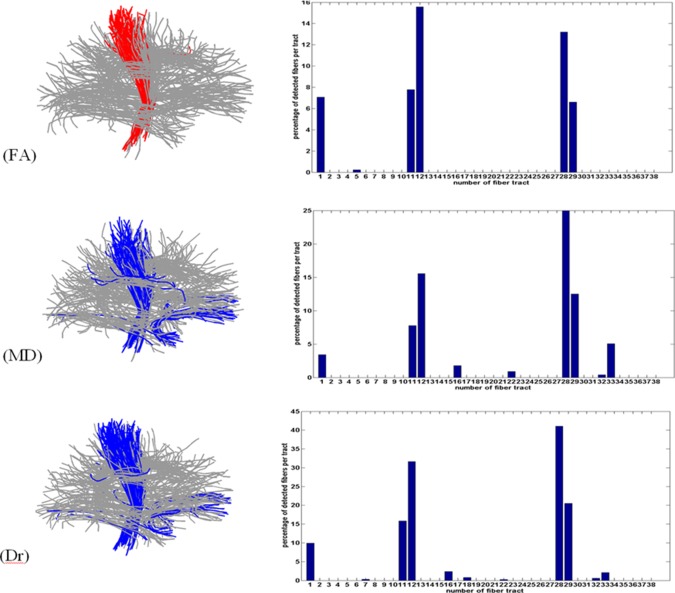
FA, MD, Dr analysis using the CONNECT atlas. Left column: Atlas fibers with the marked detections (blue: ALS > control; red: ALS < control); Right column: percentage of significant fibers for each tract of the atlas. Relevant tract numbers: 1—corpus callosum body, 11—left cortico spinal tract, 12—left long cortico spinal tract, 16—left uncinate, 28—right cortico spinal tract, 29—right long cortico spinal tract, 33—right uncinate. [Color figure can be viewed in the online issue, which is available at http://wileyonlinelibrary.com.]
Comparison to TBSS
The results of our method were also compared to results using the popular TBSS [Smith et al., 2006]. TBSS, as implemented in the FSL software (http://fsl.fmrib.ox.ac.uk/fsl/fslwiki), was applied to our set of brains. The pre‐processing steps were the same as used with our method.
For this test, FA, MD, Dr and Da maps were computed using the FSL FDT tool and were aligned into a 1 × 1 × 1 mm3 FMRIB58_FA standard space [Smith et al., 2006]. A mean FA skeleton (n = 41) was created with a threshold of FA = 0.2. Diffusivity maps were compared using the FSL randomized tool (patients > controls and controls > patients). The resulting maps was corrected at the cluster level [threshold‐free cluster enhancement (TFCE)] at a level of P ≤ 0.05, fully corrected for multiple comparisons across space (TFCE corrected). The maps with the most detections (FA, Dr) are presented in Figure 10 in coronal, sagittal, and axial views, with the detected regions marked. Red‐yellow indicates regions where the control group FA was higher than the patients’ FA. The detected regions reside in the CST and in the middle section (the body) of CC, and are therefore in line with the results obtained using our method. The Uncinate tract remained undetected, and almost no detection in MD was seen.
Figure 10.
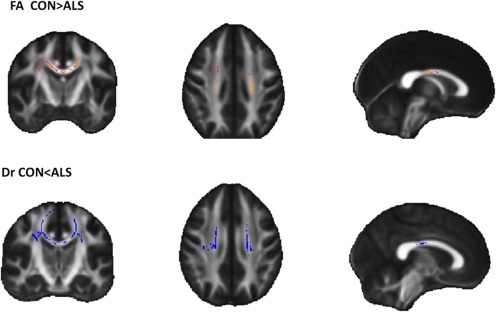
Results of TBSS analysis on FA (top row), Dr (bottom row), where the most prominent detections were made for this data. The colors correspond to the convention of this article: Control < Patients (blue), Control > Patients (red). [Color figure can be viewed in the online issue, which is available at http://wileyonlinelibrary.com.]
DISCUSSION AND CONCLUSION
We presented a novel method for whole brain fiber‐based comparison between groups of subjects. The analysis does not require marking VOIs or defining manual seed regions for tractography. This makes our method especially suitable as an exploratory step in population studies where there is no hypothesis regarding the location of the affected areas. The results are presented at the single fiber resolution level and can be interpreted by examining the entire template fiber set. Once the locations of significant differences are identified, the user may choose to further focus on interesting subsets of fibers. Any subset can be examined, since no prior grouping of fibers is employed throughout the analysis.
One of the key features of this method is that the processing is primarily performed in each brain's native space, so that the sampled parameter values as well as the shape of the fibers are not affected by warping the data to a different coordinate system. Correspondences between fibers are established using affine transformations and nearest neighbor search, based only on coordinate information. This novel way to establish spatial correspondence provides the flexibility of mixing fibers that come from different protocols, as shown by incorporating the HARDI based CONNECT atlas. The fibers reconstructed from HARDI are more reliable than the ones from DTI, especially in areas of fiber crossings. But the same characteristic fiber shapes and locations are still present, as can be seen in Figure 8.
In Single Subject Template and Using a Fiber Atlas as a Template sections we reported results using two possible templates. We started with a typical brain template, and then used the CONNECT atlas. The results were qualitatively similar in the two cases. One distinction between the two templates is that in the first scenario we found more matches between the template and the other brains, whereas for the CONNECT atlas less template fibers were matched. The higher quality of the fibers in the CONNECT atlas enabled additional detections, such as the detection of significant fibers in the uncinate fasciculus. The role of the uncinate fasciculus in ALS has been noted in several works [Agosta et al., 2010; Christidi et al., 2014; Sato et al., 2010], which conclude that the subtle involvement of the uncinate fasciculus may precede the appearance of behavioral symptoms in patients with ALS.
It is important to note that an underlying assumption of the method presented here is that fiber trajectories can be traced in all subjects of both groups. This means that the method is most suitable when the hypothesis is that the DTI measures may differ between the groups, but the fibers fiber‐tracking performance remains mostly unaffected. If, for example, the condition lowers FA in a way that most fibers are not reconstructed in full, the method would become inapplicable, since very few correspondences would be found between the partial fibers and the template fibers. This situation can be easily identified by looking at the portion of successful matches for each of the brains, as shown in Figure 3. Apparently, in the case of ALS, the pathological cases maintain the basic anatomical structure of WM so that the matching works equally well with patients as it does with healthy subjects. This is a prerequisite for the applicability of our method which needs to be verified before it is applied to other pathologies.
We are currently continuing the development and investigation of the framework in several directions. These include the transition to simultaneous multi‐parametric analysis, incorporating in a single comparison parameters derived from both DTI and structural MRI; parameter profiles along fibers will be compared and additional statistical techniques will be incorporated. Future work will also involve the development of techniques for coping with significantly larger datasets, such as those produced by HARDI. These techniques consist of smart down‐ sampling schemes that reduce the number of fibers with minimal loss of anatomic information. Further exploration of ALS will be conducted as well as the generalization of the framework to additional pathologies.
ACKNOWLEDGMENTS
The CONNECT/Archi Database is the property of the CEA I2BM NeuroSpin centre and was designed under the supervision of Dr Cyril Poupon and Dr Jean‐François Mangin, and was funded by the Federative Research Institute 49, by the HIPPIP grant and the European CONNECT project (http://www.brain-connect.eu). Acquisitions were performed by the scientists involved in the Multi‐scale Brain Architecture research program of NeuroSpin and by the staff of the UNIACT Laboratory of NeuroSpin (headed by Dr Lucie Hertz‐Pannier), under the ethical approval CPP100002/CPP100022 (principal investigator Dr Denis Le Bihan. Access to the database can be asked to cyril.poupon@cea.fr).
Special thanks to Professor Yoav Benjamini and Dr. Ruth Heller from the Department of Statistics and Operations Research, the Sackler Faculty of Exact Sciences, Tel Aviv University, Israel, for discussion on the issue of multiple comparisons. I would like to thank The Eshkol Foundation, Israeli Ministry of Science, for partially funding this research.
REFERENCES
- Agosta F, Pagani E, Petrolini M, Caputo D, Perini M, Prelle A, Salvi F, Filippi M (2010): Assessment of white matter tract damage in patients with amyotrophic lateral sclerosis: A diffusion tensor MR imaging tractography study. Am J Neuroradiol 31:1457–1461. [DOI] [PMC free article] [PubMed] [Google Scholar]
- Alexander AL, Lee JE, Lazar M, Field AS (2007): Diffusion tensor imaging of the brain. Neurotherapeutics 4:316–329. [DOI] [PMC free article] [PubMed] [Google Scholar]
- Alexander AL, Hurley SA, Samsonov AA, Adluru N, Hosseinbor AP, Mossahebi P, Tromp DPM, Zakszewski E, Field AS (2011): Characterization of cerebral white matter properties using quantitative magnetic resonance imaging stains. Brain Connect 1:423–446. [DOI] [PMC free article] [PubMed] [Google Scholar]
- Ashburner J, Friston K (2000): Voxel‐based morphometry—The Methods. NeuroImage 11:805–821. [DOI] [PubMed] [Google Scholar]
- Ben Bashat D, Artzi M, Tarrasch R, Nefussy B, Drory VE, Aizenstein O (2011): A potential tool for the diagnosis of ALS based on diffusion tensor imaging. Amyotroph Lateral Sclerosis 12:398–405. [DOI] [PubMed] [Google Scholar]
- Benjamini Y, Hochberg Y (1995): Controlling the false discovery rate: A practical and powerful approach to multiple testing. J R Stat Soc Ser B (Methodological) 57:289–300. [Google Scholar]
- Bland JM, Altman DG (1995): Multiple significance tests: The Bonferroni method. BMJ 310:170. [DOI] [PMC free article] [PubMed] [Google Scholar]
- Christidi F, Zalonis I, Kyriazi S, Rentzos M, Karavasilis E, Wilde EA, Evdokimidis I (2014): Uncinate fasciculus microstructure and verbal episodic memory in amyotrophic lateral sclerosis: Diffusion tensor imaging and neuropsychological study. Brain Imaging Behav 8:497–505. [DOI] [PubMed] [Google Scholar]
- Colby JB, Soderberg L, Lebel C, Dinov ID, Thompson PM, Sowell ER (2012): Along‐tract statistics allow for enhanced tractography analysis. Neuroimage 59:3227–3242. [DOI] [PMC free article] [PubMed] [Google Scholar]
- Darrell T, Indyk P, Shakhnarovich G (2006): Nearest Neighbor Methods in Learning and Vision Theory and Practice. Cambridge, MA: MIT Press. [Google Scholar]
- Fischler MA, Bolles RC (1981): Random sample consensus: A paradigm for model fitting with applications to image analysis and automated cartography. Commun ACM 24:381–395. [Google Scholar]
- Goodlett CB, Fletcher PT, Gilmore JH, Gerig G (2009): Group analysis of DTI fiber tract statistics with application to neurodevelopment. NeuroImage 45:S133–S142. [DOI] [PMC free article] [PubMed] [Google Scholar]
- Guevara P, Duclap D, Poupon C, Marrakchi‐Kacem L, Fillard P, Le Bihan D, Leboyer M, Houenou J, Mangin JF (2012): Automatic fiber bundle segmentation in massive tractography datasets using a multi‐subject bundle atlas. Neuroimage 61:1083–1099. [DOI] [PubMed] [Google Scholar]
- Kiernan MC, Vucic S, Benjamin C, Cheah MR, Turner AE, Hardiman O, Burrell JR, Zoing MC (2011): Amyotrophic lateral sclerosis. Lancet 377:942–955. [DOI] [PubMed] [Google Scholar]
- Mayer A, Zimmerman‐Moreno G, Shadmi R, Batikoff A, Greenspan H (2011): A supervised framework for the registration and segmentation of white matter fiber tracts. IEEE Trans Med Imaging 30:131–145. [DOI] [PubMed] [Google Scholar]
- Mori S, Crain BJ, Chacko VP, van Zijl PCM (1999): Three dimensional tracking of axonal projections in the brain by magnetic resonance imaging. Ann Neurol 45:265–269. [DOI] [PubMed] [Google Scholar]
- Mori S, van Zijl PCM (2002): Fiber tracking: Principles and strategies—A technical review. NMR Biomed 15:468–480. [DOI] [PubMed] [Google Scholar]
- Mueller HP, Unrath A, Sperfeld AD, Ludolph AC, Riecker A, Kassubek J (2007): Diffusion tensor imaging and tractwise fractional anisotropy statistics: Quantitative analysis in white matter pathology. Biomed Eng Online 6:42. [DOI] [PMC free article] [PubMed] [Google Scholar]
- Mueller HP, Unrath A, Riecker A, Pinkhardt EH, Ludolph AC, Kassubek J (2009): Intersubject variability in the analysis of diffusion tensor images at the group level: Fractional anisotropy mapping and fiber tracking techniques. Magn Reson Imaging 27:324–334. [DOI] [PubMed] [Google Scholar]
- Paganoni S, Macklin EA, Lee A, Murphy A, Chang J, Zipf A, Cudkowicz M, Atassi N (2014): Diagnostic timelines and delays in diagnosing amyotrophic lateral sclerosis (ALS). Amyotroph Lateral Scler Frontotemporal Degener 15:453–456. [DOI] [PMC free article] [PubMed] [Google Scholar]
- Prčkovska V, Descoteaux M, Poupon C, ter Haar Romeny BM, Vilanova A. (2012): Classification Study of DTI and HARDI Anisotropy Measures for HARDI Data Simplification: New Developments in the Visualization and Processing of Tensor Fields. Berlin, Heidelberg: Springer; pp 229–251. [Google Scholar]
- Sato K, Aoki S, Iwata NK, Masutani Y, Watadani T, Nakata Y, Yoshida M, Terao Y, Abe O, Ohtomo K, Tsuji S (2010): Diffusion tensor tract‐specific analysis of the uncinate fasciculus in patients with amyotrophic lateral sclerosis. Neuroradiology 52:729–733. [DOI] [PubMed] [Google Scholar]
- Smith SM, Jenkinson M, Woolrich MW, Beckmann CF, Behrens TE, Johansen‐Berg H, Matthews PM (2004): Advances in functional and structural MR image analysis and implementation as FSL. Neuroimage 23:S208–S219. [DOI] [PubMed] [Google Scholar]
- Smith SM, Jenkinson M, Johansen‐Berg H, Rueckert D, Nichols TE, Mackay CE, Watkins KE, Ciccarell O, Cader MZ, Matthews PM, Behrens TE (2006): Tract‐based spatial statistics: Voxelwise analysis of multi‐subject diffusion data. NeuroImage 31:1487–1505. [DOI] [PubMed] [Google Scholar]
- Witelson SF (1989): Hand and sex differences in the isthmus and genu of the human corpus callosum. A postmortem morphological study. Brain 112:799–835. [DOI] [PubMed] [Google Scholar]
- Yeatman JD, Dougherty RF, Myall NJ, Wandell BA, Feldman HM (2012): Tract profiles of white matter properties: Automating fiber‐tract quantification. PloS One 7:e49790. [DOI] [PMC free article] [PubMed] [Google Scholar]
- Zvitia O, Mayer A, Shadmi R, Miron S, Greenspan H (2010): Co‐registration of white matter tractographies by adaptive‐mean‐shift and Gaussian mixture modeling. IEEE Trans Med Imaging 29:132–145. [DOI] [PubMed] [Google Scholar]


