

Abstract
Developmental dyslexia has been hypothesized to result from multiple causes and exhibit multiple manifestations, implying a distributed multidimensional effect on human brain. The disruption of specific white‐matter (WM) tracts/regions has been observed in dyslexic children. However, it remains unknown if developmental dyslexia affects the human brain WM in a multidimensional manner. Being a natural tool for evaluating this hypothesis, the multivariate machine learning approach was applied in this study to compare 28 school‐aged dyslexic children with 33 age‐matched controls. Structural magnetic resonance imaging (MRI) and diffusion tensor imaging were acquired to extract five multitype WM features at a regional level: white matter volume, fractional anisotropy, mean diffusivity, axial diffusivity, and radial diffusivity. A linear support vector machine (LSVM) classifier achieved an accuracy of 83.61% using these MRI features to distinguish dyslexic children from controls. Notably, the most discriminative features that contributed to the classification were primarily associated with WM regions within the putative reading network/system (e.g., the superior longitudinal fasciculus, inferior fronto‐occipital fasciculus, thalamocortical projections, and corpus callosum), the limbic system (e.g., the cingulum and fornix), and the motor system (e.g., the cerebellar peduncle, corona radiata, and corticospinal tract). These results were well replicated using a logistic regression classifier. These findings provided direct evidence supporting a multidimensional effect of developmental dyslexia on WM connectivity of human brain, and highlighted the involvement of WM tracts/regions beyond the well‐recognized reading system in dyslexia. Finally, the discriminating results demonstrated a potential of WM neuroimaging features as imaging markers for identifying dyslexic individuals. Hum Brain Mapp 37:1443‐1458, 2016. © 2016 Wiley Periodicals, Inc.
Keywords: developmental dyslexia, machine learning, white‐matter connectivity, magnetic resonance imaging, classification
INTRODUCTION
Developmental dyslexia is a common neurodevelopmental disorder that is characterized by unexpected difficulty in reading acquisition despite normal intelligence, adequate educational opportunities, and intact sensory abilities [Peterson and Pennington, 2012]. This disorder occurs in approximately 7% of school‐aged children across cultures [Shaywitz et al., 1990; Zhang et al., 1998]. Dyslexia usually persists into adulthood and severely affects academic performance, career development and quality of life [Maughan et al., 2009]. Accurate identification of dyslexic individuals and ascertaining the neural substrates of dyslexia remain challenging [Gabrieli, 2009].
Reading is a complex task that relies on the recruitment of and communication between multiple regions [Wandell and Yeatman, 2013]. The disconnection hypothesis was proposed for the etiology of dyslexia, and it highlighted the disruption of inter‐regional connectivity/communication (i.e., disconnection) as the main cause for dyslexia, rather than the structural/functional anomalies in focal regions [Klingberg et al., 2000; Paulesu et al., 1996]. This hypothesis has been supported by functional imaging studies that showed reduced functional connectivity during reading‐related tasks or resting states in multiple regions, such as the inferior parietal region, angular gyrus, fusiform gyrus, and inferior frontal cortex [Farris et al., 2011; Finn et al., 2014; Horwitz et al., 1998; Koyama et al., 2013; Paulesu et al., 1996; Pugh et al., 2000; Schurz et al., 2015; Shaywitz et al., 2003; van der Mark et al., 2011]. Diffusion magnetic resonance imaging (MRI) studies further revealed abnormalities in multiple white‐matter (WM) tracts (i.e., structural connectivity) in dyslexic populations, including the superior longitudinal fasciculus/arcuate fasciculus, inferior longitudinal fasciculus, corona radiata, internal capsule, and corpus callosum [Beaulieu et al., 2005; Boets et al., 2013; Deutsch et al., 2005; Klingberg et al., 2000; Rimrodt et al., 2010; Steinbrink et al., 2008; Vandermosten et al., 2012a). Notably, these dyslexic WM studies mainly performed univariate analyses, in which multiple WM voxels or tracts were compared/analyzed independently.
On the other hand, there has been a multidimensional deficit theory for the etiology of dyslexia, hypothesizing how the dyslexia is caused by cognitive/neural deficits [Pennington, 2006]. In contrast to the single deficit theory (i.e., phonological deficit theory), the multidimensional deficit theory argues that the reading difficulty results from deficits of multiple cognitive and neural domains, and these cognitive and neural systems are jointly affected in a multidimensional manner by dyslexia. This flexible theory is able to better deal with the diverse manifestations of dyslexia as well as the individual differences among dyslexic subjects [McGrath et al., 2011; Pennington et al., 2012; Willcutt et al., 2010]. Given that distinct cognitive processes are related to different WM connections, it is likely that a multidimensional pattern of WM anomalies is associated with dyslexia, according to this multidimensional deficit theory. However, to date, it remains untested whether developmental dyslexia affects the human brain WM in such a multidimensional manner. In addition, it also remains unknown whether WM connectivity can be used to discriminate dyslexic children from normal controls at the individual level, which is an important clinical question for identifying dyslexic individuals.
These issues can be well addressed by multivariate machine learning approaches. Specifically, the machine learning approaches can yield a classifier to determine the category of an unknown individual by taking multitype and multiregional brain features into account jointly. These techniques, therefore, serve as a nature tool to evaluate the multidimensional hypothesis [Ecker et al., 2010; Li et al., 2014]. In addition, they allow for inferences of pattern differences between groups [Davatzikos, 2004; Haynes and Rees, 2006]. The MRI‐based machine learning approach has been increasingly applied in studies of various neuropsychiatric disorders, such as Alzheimer's disease [Liu et al., 2014], autism [Anderson et al., 2011], and depression [Zeng et al., 2012]. However, brain WM differences between dyslexic and normal individuals have never been investigated using these approaches.
In this study, we applied a machine learning approach to investigate the WM anomalies in dyslexic children. Structural MRI and diffusion tensor imaging (DTI) data was acquired to extract multitype WM features at macrostructural (i.e., WM tissue volume) and microstructural levels (i.e., WM diffusion parameters). A linear support vector machine (LSVM) method was applied to classify dyslexic and control children using these WM imaging features. By discriminating dyslexics from controls using multitype and multiregional WM features jointly, if successful, this study will demonstrate that (1) the WM features can be used to distinguish dyslexics and controls, therefore, supporting the disconnection hypothesis; (2) the WM features across multiple types and regions are jointly altered in dyslexia, therefore, supporting the multidimensional deficit theory. Furthermore, the discriminative WM features derived from the machine learning classifier may shed light on the effect of WM connectivity in dyslexia.
MATERIALS AND METHODS
Participants
Thirty‐three dyslexic children and 34 typically developing controls were included in this study. Dyslexia was determined using two standardized reading tests, which were conducted during the primary school period, as described below. Five dyslexic children and 1 control child were excluded because of severe head motion during MRI scanning (visually checking the motion‐artifacts on the T1‐weighted images). Therefore, the final image analysis included 61 children (28 dyslexics and 33 controls; Table 1). All participants were right‐handed [Oldfield, 1971] native Mandarin speakers who attended school regularly. Normal or corrected‐to‐normal vision and hearing were confirmed in each subject. The participants' parents reported no evidence of current or past major neurological or psychiatric disorders (e.g., attention deficit hyperactivity disorder) for any individual. All children had normal IQs, with scores above 85 on the Chinese version of the Wechsler Intelligence Scale for Children (C‐WISC) [Gong and Cai, 1993] or above the 10th percentile on the Raven's Standard Progressive Matrices [Raven, 1998]. The dyslexic and control groups were matched for age (dyslexic: 10.0–14.7 years; control: 10.1–14.7 years; P = 0.47), gender (dyslexic: 16 males; control: 16 males; P = 0.50), and nonverbal IQ, which is based on Picture Completion in C‐WISC (P = 0.86). Written informed consent was obtained from the children and their parents after the details of the study were comprehensively explained. The Institutional Review Board of Beijing Normal University Imaging Center for Brain Research approved the protocol.
Table 1.
Demographics and behavioral profiles of the participants
|
Dyslexic group (N = 28) |
Control group (N = 33) |
Group comparison (P value) |
|
|---|---|---|---|
| Age (years) | 11.6 (1.55) | 11.8 (1.33) | 0.473 |
| Gender (M:F) | 16:12 | 16:17 | 0.500 |
| Nonverbal IQa, b | 10.4 (2.5) | 10.4 (1.9) | 0.859 |
| CR (correct response) | 95.2 (18.2) | 131.2 (10.6) | < 0.001 |
| WLR (words/min) | 73.4 (22.7) | 107.9 (19.3) | < 0.001 |
| RF (characters/min) | 211.2 (114.2) | 397.5 (133.5) | < 0.001 |
| PD (correct response) | 14.8 (6.3) | 21.9 (3.3) | < 0.001 |
| RAN (seconds) | 19.6 (5.2) | 14.2 (3.1) | < 0.001 |
| MP (correct response) | 19.4 (4.5) | 25.6 (2.7) | < 0.001 |
| DR (correct response) | 16.0 (2.8) | 18.8 (1.8) | < 0.001 |
CR: character recognition; WLR: word‐list reading; RF: reading fluency; PD: phoneme deletion; RAN: rapid automatized naming; MP: morphological production; DR: digit recall.
The nonverbal IQ was based on performance of the Picture Completion in C‐WISC.
28 dyslexic and 30 control children were included; 3 other control children did not finish the C‐WISC.
Dyslexia Criteria and Behavioral Tests
Previously established criteria in Mainland China were used to identify dyslexic children [Lei et al., 2011; Shu et al., 2003; Xue et al., 2013; Zhang et al., 2012]. Specifically, the standardized character recognition (CR) and word‐list reading (WLR) tests were administered during a primary school period. A child was categorized as dyslexic if the CR z‐score was below −1.5 standard deviations (SD) of the norm or the WLR z‐score was below −1.5 SD of the norm and the CR z‐score was below −1.0 SD of the norm. CR and WLR z‐scores were above −0.5 SD of the norm in control children.
For the participants who were in the primary school when applying the MRI scan (22 dyslexics and 25 controls in total), the standardized CR and WLR tests were performed concurrently with the MRI scanning. The other participants, who were in the middle school when applying the MRI scan (6 dyslexics and 8 controls in total), were determined by their earlier standardized scores in the period of primary school, since there was no available norm for the CR and WLR scores of the middle school. Given the well‐observed persistence of the dyslexic status, this strategy is likely acceptable and has been widely used in a series of previous studies (Boets et al., 2013; Shaywitz and Shaywitz, 2005; Shaywitz et al., 1999; Vandermosten et al., 2010].
In addition, a battery of cognitive tests was administered within one week of MRI scanning to evaluate the persistence of poor reading performance. This battery included 5 reading‐related tests: (1) reading fluency (RF) to measure the efficiency of reading comprehension of sentences [Xue et al., 2013]; (2) phoneme deletion (PD) to measure phonological awareness [Li et al., 2012a); (3) rapid automatized naming (RAN) to measure the efficiency of phonological representation retrieval [Lei et al., 2011]; (4) morphological production (MP) to measure morphological awareness [Shu et al., 2006]; and (5) digit recall (DR) to measure phonological working memory.
MRI Acquisition
All scans were performed using a 3T Siemens Tim Trio MRI scanner in the Imaging Center for Brain Research, Beijing Normal University. Three‐dimensional T1‐weighted images with high resolution were obtained using a 3D magnetization prepared rapid gradient echo (MPRAGE) sequence with the following parameters: slice thickness, 1.33 mm; no gap; 144 sagittal slices; repetition time (TR), 2530 ms; echo time (TE), 3.39 ms; flip angle, 7°; acquisition matrix, 256 × 192; field of view (FOV), 256 × 192 mm2; and resolution, 1 × 1 × 1.33 mm3. DTI was acquired using a single‐shot echo‐planar imaging‐based sequence with the following parameters: slice thickness, 2.2 mm; no gap; 62 axial slices; TR, 8,000 ms; TE, 89 ms; flip angle, 90°; 2 repetitive acquisitions; acquisition matrix, 128 × 128; FOV, 282 × 282 mm2; resolution, 2.2 × 2.2 × 2.2 mm3; 30 nonlinear diffusion weighting directions with b = 1,000 s/mm2 and one image without diffusion weighting (i.e., b = 0 s/mm2). An experienced radiologist reviewed all MR images to assess image quality and ensure the absence of visible neurological anomalies (e.g., white matter hypointensity).
Image Processing
WM volume
A WM volume (WMV) map in the Montreal Neurological Institute (MNI) space was generated for each individual using the VBM8 toolbox (http://dbm.neuro.uni-jena.de/vbm/) [Kurth et al., 2010] in SPM8 (http://www.fil.ion.ucl.ac.uk/spm/). This processing procedure on the structural MR images included: (1) correcting for bias‐field inhomogeneity; (2) spatially normalizing (affine‐only transformation); (3) segmenting into gray matter (GM), WM and cerebrospinal fluid (CSF) density maps by using the new‐segment approach [Ashburner and Friston, 2005]; (4) warping the resultant WM density images to a Diffeomorphic Anatomical Registrations Through Exponentiated Lie Algebra (DARTEL) template using the high‐dimensional DARTEL algorithm; (5) applying the modulation by multiplying the WM density map with the linear and nonlinear components of Jacobian determinant, which resulted in the WMV maps representing the absolute WM volume of the native space. This WMV metric has been widely applied in previous neuroimaging literatures [Li et al., 2012b; Radua et al., 2011], some of which were directly relevant to dyslexia [Krafnick et al., 2014; Silani et al., 2005].
WM diffusion metrics
Processing of the diffusion MRI dataset was implemented using PANDA (http://www.nitrc.org/projects/panda/), which is a pipeline toolbox for diffusion MRI analysis [Cui et al., 2013]. The procedure included skull‐stripping, simple‐motion and eddy‐current correction, diffusion tensor/parameter calculation, and spatial normalization. Fractional anisotropy (FA), mean diffusivity (MD), axial diffusivity (AD), and radial diffusivity (RD) maps in the MNI space were generated for each individual. FA, MD, AD, and RD are the most commonly used diffusion parameters and represent the fraction of total diffusion that can be attributed to anisotropic diffusion, the overall degree of diffusivity, the diffusivity along the direction of WM tracts, and the diffusivity perpendicular to the direction of WM tracts, respectively [Beaulieu, 2002].
The WM volume and diffusion metrics (i.e., FA, MD, AD, and RD) characterize macrostructural (e.g., atrophy or lesions) and microstructural (e.g., degree of myelination or axonal organization) WM properties, respectively [Beaulieu, 2002; Hugenschmidt et al., 2008]. The regional values for these metrics were extracted using the White Matter Parcellation Map (WMPM), which is a prior WM atlas defined in the MNI space [Mori et al., 2008]. The mean of WMV, FA, MD, AD, and RD were calculated for each WMPM region. Here, a total of 50 WMPM regions were selected (Supporting Information Figure S1), and these areas were defined as the “core white matter” [Mori et al., 2008]. The remaining peripheral WM regions near the cortex were excluded because they are highly variable across individuals.
The LSVM‐Based Classification
An LSVM method was applied to classify dyslexic individuals from controls using the combined features from the WMV and diffusion metrics. The leave‐one‐out cross‐validation (LOOCV) was adopted to evaluate the classification performance, which provides a good estimation for the generalizability of the classifiers, particularly when the sample size is small [Pereira et al., 2009]. The schematic overview for the LSVM‐based classification framework is shown in Figure 1 and Supporting Information Figure 2.
Figure 1.
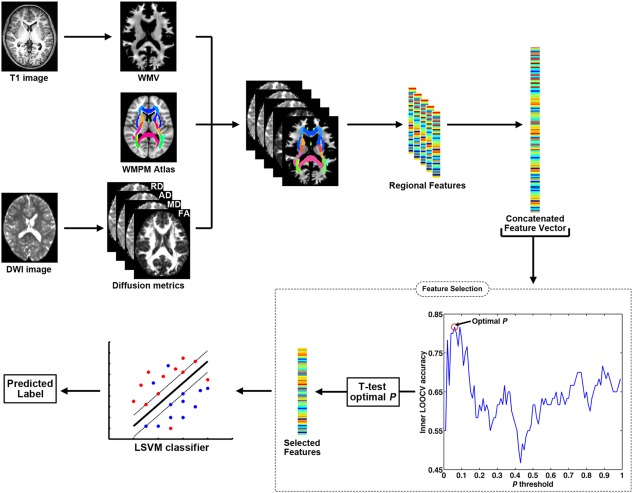
The classification schematic flow using the combined WM features. A nested LOOCV was applied for feature selection and classifier training. For details, please see Supporting Information Figure 1.
Feature fusion
The five WM metric values (i.e., WMV, FA, MD, AD, and RD) for the 50 WMPM regions were concatenated to yield a single raw feature vector for each subject [Wee et al., 2011]. A combination of multitype features likely improves discrimination performance because distinct features putatively capture different aspects of WM tissue, which are potentially complementary for discrimination [Dai et al., 2012; Ross and Jain, 2003; Wee et al., 2011].
Feature selection
The selection of the discriminative features and elimination of the noninformative features were widely employed to boost classification performance [Dai et al., 2012; Dosenbach et al., 2010]. This study applied a nested‐LOOCV using the outer loop to estimate classification accuracy and the inner loop to determine the optimal feature selection [Hahn et al., 2015; Whelan et al., 2014]. Feature selection using inner LOOCVs avoids overfitting for the final classifier training.
Supporting Information Figure 2 illustrates the selection of N − 1 subjects as the training set for each outer LOOCV fold, and the remaining subject was used as the test sample, where N is the number of all subjects. Inner LOOCVs were further applied in each of the outer LOOCV folds. A two‐sample t‐test was performed on each of the features in the training set for each of the inner LOOCVs (N − 2 subjects), which yielded a P value for each feature. A P threshold was applied, and the features below the P threshold were retained. The features with higher P values were discarded. A P threshold from 0 to 1 with a 0.01 interval was applied for each inner LOOCV, resulting in 99 inner LOOCVs in total, and 99 classification accuracies were obtained for each inner LOOCV. In theory, the neighboring P thresholds should lead to very similar classification accuracies for the corresponding inner LOOCVs. We averaged the classification accuracy values across the first‐order neighborhood for each P threshold as the final classification accuracy, which is essentially similar to smoothing step in image processing, to control for outlier or noise effects. Specifically, the first‐order neighborhood contained the two neighboring thresholds that were directly adjacent to the target P threshold (e.g., for the P threshold of 0.50, its first‐order neighborhood was composed of 0.49, 0.50, and 0.51 thresholds). The P threshold with the highest classification accuracy for the inner LOOCV was defined as the optimal threshold based on the refined classification accuracy values, and this threshold value was applied to the training set (N − 1 subjects) of the outer LOOCV fold for the final classifier training.
LSVM implementation
The LSVM is one of the most widely used supervised machine‐learning methods, which aims to obtain a classifier with high prediction power through minimizing the empirical classification error on training data while taking into account the complexity of the model [Burges, 1998; Vapnik, 1995]. We applied the LIBSVM toolbox for Matlab to implement the LSVM classification (http://www.csie.ntu.edu.tw/~cjlin/libsvm/) [Chang and Lin, 2011]. The C parameter, which controls the tradeoff between empirical classification error and generalization of the model, was set at the default value (C=1). Specifically, each subject here was represented as a point in a multidimensional space, with each dimension corresponding to a feature. The LSVM algorithm uses a subset of data (i.e., training set) as input to identify a hyperplane in this multidimensional space, which best separates the input data into two categories matching with the known class labels. The hyperplane is represented as a decision function y=f(x), in which y is the classification score and x is the multidimensional feature vector. Once the decision function is learned from the training data, it will be applied to predict the class of new testing samples. In this study, any testing child with a positive classification score was classified as healthy control and a negative score as dyslexic. A true healthy control who obtained a negative LSVM classification score, therefore, would be misclassified as dyslexic and a true dyslexic child with a positive score would be misclassified as control.
Finally, the resultant discriminative weight for each feature was used to represent the feature contribution/importance to the classification [Dai et al., 2012; Ecker et al., 2010; Mourao‐Miranda et al., 2005].
Evaluation of Classification Performance
Accuracy, sensitivity, specificity, positive predictive value (PPV), and negative predictive value (NPV) were computed to quantify our classification performance. Specifically, accuracy is the proportion of subjects who were correctly classified into the dyslexic or control group. Sensitivity and specificity are the proportion of dyslexics and controls classified correctly. PPV and NPV are the proportion of correct dyslexic predictions and control predictions, respectively.
Furthermore, we used receiver operating characteristic (ROC) analysis to evaluate the performance of the classifiers. The area under the ROC curve (AUC) represents the classification power of a classifier, and a larger AUC indicates a better classification power [Fawcett, 2006]. The ROC curve was generated using sequentially thresholding at the classification score of each subject.
The permutation test was applied to determine whether the accuracy and AUC obtained above were significantly higher than values expected by chance. Specifically, we permuted the class labels (dyslexic or control) across the entire sample 1,000 times without replacement, and the entire classification procedure was reapplied each time. The P value for the accuracy or AUC was calculated by dividing the number of permutations that showed a higher value than the actual value for the real sample by the total number of permutations (i.e., 1,000).
We computed the differences in the accuracy or AUC between the classifiers with multitype and single‐type features during each of the permutations above to determine whether the classifier using the combined multitype features (i.e., WMV, FA, MD, AD, and RD) performed significantly better than the classifiers using each single‐type feature. Similarly, the P value for the difference in the accuracy or AUC was calculated by dividing the number of permutations that had a higher value than the actual difference from the real sample by the total number of permutations (i.e., 1,000).
Discriminative Features and Their Contributing Weights
Feature selection in each fold of the outer LOOCV was implemented using a slightly different sample subset, which led to a different set of selected features across folds. The “consensus” features that were selected on all folds of the outer LOOCV were defined as the discriminative features as described previously [Dai et al., 2012; Dosenbach et al., 2010; Zeng et al., 2012]. The discriminative weight for each feature was defined as the average of their absolute weights across all folds. A higher absolute value of the discriminative weight indicates a greater contribution of the corresponding feature to the classification [Dai et al., 2012; Ecker et al., 2010; Mourao‐Miranda et al., 2005].
Validation
We reapplied logistic regression [Whelan et al., 2014], another widely used classification model, to validate the robustness of our results for discriminating dyslexic and control children. Similar to the LSVM, the logistic regression also aims to obtain a linear classifier with a decision function y=f(x), in which y is the classification score and x is the multidimensional feature vector. The training and predicting framework is the same as the LSVM. In contrast, the logistic regression predicts the probability that a sample belongs to one class, rather than a hard label. The probability was defined as P = ey/(1 + ey), and the predicted label will be 1 (i.e., controls) if the probability is bigger than 0.5, and otherwise −1 (i.e., dyslexics). In terms of algorithm implementation, the logistic regression applies the maximum likelihood estimation to achieve the optimal classifier, rather than maximizing the margin as the LSVM.
Specifically, the logistic regression used the same combined WM features, with the nested‐LOOCV and feature selection procedure remaining the same. It was implemented using the open‐source Waikato Environment for Knowledge Analysis (WEKA) software (http://www.cs.waikato.ac.nz/ml/weka/), with all parameters being set as default values (e.g., it performed iterations until convergence; the ridge in the log‐likelihood was 1.0 E − 8). The matlab codes for classification frameworks (i.e., LSVM and logistic regression) proposed in this study have been made publicly available: https://github.com/ZaixuCui/HBM_Dyslexia_Classification.
RESULTS
Cognitive Performance
Demographics and behavioral results are summarized in Table 1. The dyslexic children scored significantly lower than the controls in the two diagnostic tests, as expected (i.e., CR and WLR tests; both P < 0.001). Dyslexic children also performed significantly worse on the RF, PD, RAN, MP, and DR tests (all P < 0.001), indicating the persistence of poor reading ability at the time of MRI scanning.
Classification
The LSVM classifier accurately discriminated dyslexic children from controls using the combined WMV, FA, MD, AD and RD features. Specifically, the accuracy, sensitivity, specificity, PPV and NPV were 83.61%, 75.00%, 90.91%, 87.50%, and 81.08%, respectively. The permutation tests revealed P < 0.001 for accuracy (Figure 2B), which suggests that the prediction accuracy was significantly higher than chance.
Figure 2.
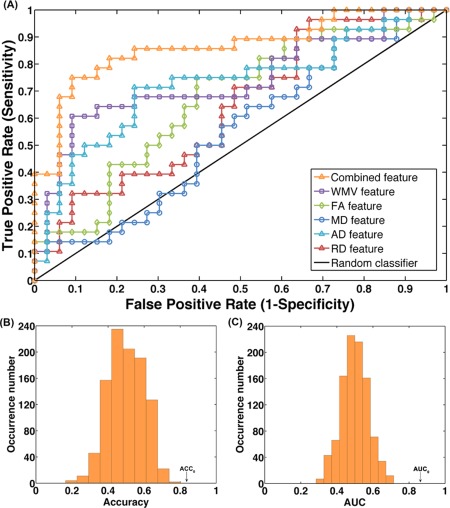
Classification results. (A) The ROC curves for the classifiers with distinct features. The AUC for the combined features and WMV, FA, MD, AD and RD features were 0.86, 0.74, 0.67, 0.55, 0.73 and 0.64, respectively. The two histograms are the permutation distribution of the accuracy (B) and AUC (C) for the combined features‐based classifier. The values obtained using the real labels are indicated by the arrows.
The classification results are shown as an ROC curve using each subject's classification score as a threshold in Figure 2A. The AUC was 0.86, which was significantly higher than chance (P < 0.001), indicating excellent discriminative power (Figure 2C).
The classification became worse using the single‐type metric (WMV, FA, MD, AD, or RD) (Table 2 and Figure 2A). The permutation test revealed significantly higher accuracy and AUC for the combined features (COMB) compared with the FA, MD or RD feature (COMB vs. FA: P accuracy = 0.052, P AUC = 0.010; COMB vs. MD: P accuracy = 0.016, P AUC < 0.001; COMB vs. RD: P accuracy = 0.013, P AUC < 0.001). A trend was also observed for the WMV and AD features (COMB vs. WMV: P accuracy = 0.204, P AUC = 0.088; COMB vs. AD: P accuracy = 0.148, P AUC = 0.038).
Table 2.
Classification results of the LSVM classifier using combined WM features or a single WM feature
| Feature | Accuracy (%) | Sensitivity (%) | Specificity (%) | PPV (%) | NPV (%) |
|---|---|---|---|---|---|
| Combined | 83.61 | 75.00 | 90.91 | 87.50 | 81.08 |
| WMV | 70.49 | 64.29 | 75.76 | 69.23 | 71.43 |
| FA | 62.30 | 57.14 | 66.67 | 59.26 | 64.71 |
| MD | 54.10 | 57.14 | 51.52 | 50.00 | 58.62 |
| AD | 72.13 | 71.43 | 72.73 | 68.97 | 75.00 |
| RD | 55.74 | 39.29 | 69.70 | 52.38 | 57.50 |
PPV: positive predictive value; NPV: negative predictive value.
In addition, we used the 10‐fold cross‐validation to re‐estimate the classification performance (See Supporting Information Table 1 and Figure 3). The resultant LSVM accuracy and AUC were lower than the LOOCV cross‐validation, but still significantly higher than by chance.
Correlation Between Classification Score and Cognitive Performance
Figure 3A and 3B display the classification scores for all subjects. Individuals with negative scores were classified as dyslexic, and individuals with positive scores were classified as controls. Seven dyslexic children were misclassified as controls, and 3 controls were misclassified as dyslexics. The classification scores (i.e., the distance to the classification hyperplane) were significantly correlated with CR (r = 0.54, P < 0.001) and WLR performance (r = 0.53, P < 0.001) across all subjects, which further supports the validity of the classifier. After regressing out the group factor, there was no significant correlation between the classification scores and CR (r = −0.01, P = 0.95) or WLR performance (r = 0.13, P = 0.34), suggesting that the classification scores cannot account for within‐group variance of the reading skills.
Figure 3.
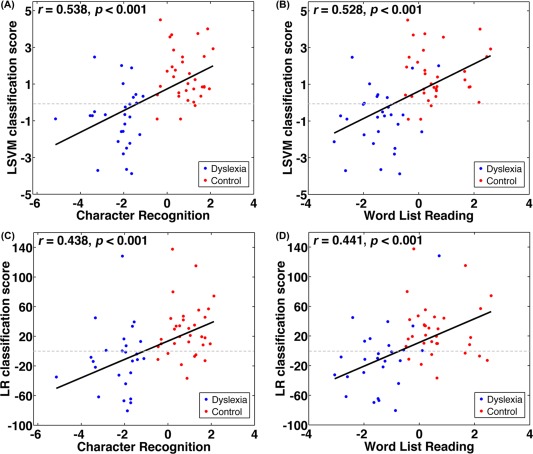
Correlations between the classification and reading performance. A significant correlation between the classification scores (distance from hyperplane) from the LSVM classifier with combined WM features and character recognition (CR) performance (A) or word list reading (WLR) performance (B) was observed across all individuals. Similarly, a significant correlation between the classification scores from the logistic regression classifier and CR performance (C) or WLR performance (D) was observed across all individuals. Here, individuals with positive scores were classified as healthy, and participants with negative scores were classified as dyslexic.
Discriminative WM Features
There were 43 discriminative WM features for the LSVM classifier, which included 31 WMVs, 1 FA, 4 MDs, 4 ADs, and 3 RDs (Table 3). Specifically, the 31 WMV features were derived from 12 bilateral WM regions: the corticospinal tract, medial lemniscus, inferior cerebellar peduncle, superior cerebellar peduncle, cerebral peduncle, anterior limb of the internal capsule, posterior limb of the internal capsule, retrolenticular part of the internal capsule, sagittal stratum, external capsule, cingulate part of the cingulum, and crus of fornix; 2 left WM regions, the superior corona radiata, and superior fronto‐occipital fasciculus; 2 right WM regions, the posterior thalamic radiation and inferior fronto‐occipital fasciculus; and 3 middle WM regions, the middle cerebellar peduncle, pontine crossing tract, and splenium of corpus callosum. The only WM region for the FA feature was the body of fornix. The 4 regions for the MD feature included the body of fornix, left external capsule and inferior fronto‐occipital fasciculus, and right inferior cerebellar peduncle. The 4 regions for the AD feature were the left superior corona radiata, external capsule, superior longitudinal fasciculus, and right anterior corona radiata. The 3 WM regions for the RD feature were the body of fornix, right inferior cerebellar peduncle, and retrolenticular part of the internal capsule.
Table 3.
The discriminative features of LSVM classifier
| WMPM regions | Metric | Discriminative weight |
|---|---|---|
| Body of fornix | FA | 0.356 |
| Cingulum (cingulate part) (L) | WMV | 0.203 |
| Superior fronto‐occipital fasciculus (L) | WMV | 0.187 |
| Superior cerebellar peduncle (L) | WMV | 0.186 |
| Posterior limb of internal capsule (R) | WMV | 0.184 |
| Anterior limb of internal capsule (R) | WMV | 0.180 |
| External capsule (L) | MD | 0.172 |
| Middle cerebellar peduncle | WMV | 0.164 |
| Body of fornix | RD | 0.149 |
| Cingulum (cingulate part) (R) | WMV | 0.146 |
| Superior longitudinal fasciculus (L) | AD | 0.142 |
| Cerebral peduncle (R) | WMV | 0.130 |
| Inferior cerebellar peduncle (R) | WMV | 0.125 |
| Superior corona radiata (L) | WMV | 0.123 |
| Crus of fornix (L) | WMV | 0.111 |
| Posterior limb of internal capsule (L) | WMV | 0.105 |
| Sagittal stratum (L) | WMV | 0.104 |
| External capsule (L) | AD | 0.102 |
| Inferior cerebellar peduncle (R) | MD | 0.090 |
| Splenium of corpus callosum | WMV | 0.087 |
| Retrolenticular part of internal capsule (R) | WMV | 0.084 |
| Anterior corona radiata (R) | AD | 0.082 |
| Retrolenticular part of internal capsule (L) | WMV | 0.080 |
| Superior corona radiata (L) | AD | 0.072 |
| Body of fornix | MD | 0.069 |
| Corticospinal tract (L) | WMV | 0.067 |
| Superior cerebellar peduncle (R) | WMV | 0.066 |
| Inferior fronto‐occipital fasciculus (R) | WMV | 0.065 |
| Pontine crossing tract | WMV | 0.063 |
| Inferior fronto‐occipital fasciculus (L) | MD | 0.060 |
| Sagittal stratum (R) | WMV | 0.055 |
| External capsule (R) | WMV | 0.051 |
| Retrolenticular part of internal capsule (R) | RD | 0.049 |
| External capsule (L) | WMV | 0.044 |
| Crus of fornix (R) | WMV | 0.039 |
| Corticospinal tract (R) | WMV | 0.039 |
| Medial lemniscus (L) | WMV | 0.038 |
| Posterior thalamic radiation (R) | WMV | 0.037 |
| Medial lemniscus (R) | WMV | 0.032 |
| Inferior cerebellar peduncle (L) | WMV | 0.030 |
| Inferior cerebellar peduncle (R) | RD | 0.028 |
| Anterior limb of internal capsule (L) | WMV | 0.025 |
| Cerebral peduncle (L) | WMV | 0.023 |
L: left; R: right.
Validation
The logistic regression classifier discriminated dyslexic children from controls with an accuracy of 73.77%, sensitivity of 67.86%, specificity of 78.79%, PPV of 73.08%, and NPV of 74.29%. The AUC was 0.80. The permutation test also indicated that the accuracy and AUC were significantly higher than chance (P accuracy = 0.012; P AUC < 0.001).
Individual classification scores of the logistic regression classifier were also correlated with the CR (r = 0.44, P < 0.001) and WLR scores (r = 0.44, P < 0.001) across all subjects, as shown in Figure 3C and 3D. After regressing out the group factor, there was no significant correlation between the classification scores and CR (r = 0.04, P = 0.73) or WLR performance (r = 0.14, P = 0.28). Forty discriminative WM features were observed, including 29 WMVs, 1 FA, 4 MDs, 3 ADs, and 3 RDs. Notably, all 40 features were recognized as the discriminative features for the LSVM classifier (43 in total, excluding the following three features: the WMV of the left superior cerebellar peduncle and splenium of corpus callosum and the AD of the left superior longitudinal fasciculus). Notably, the AD of the left superior longitudinal fasciculus was selected on the 59 folds of the outer LOOCV (out of the 61 folds in total), and was quite close to be a discriminative feature for the logistic regression classifier, as well.
Notably, the discriminative weights for these identified features were significantly correlated between the two classifiers (r = 0.73, P < 0.001) (Figure 4).
Figure 4.
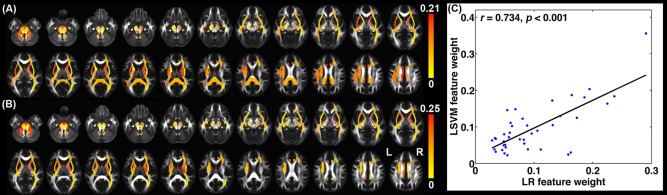
Discriminative WM regions. (A) Discriminative WMPM regions for the LSVM classifier. (B) Discriminative WMPM regions for the logistic regression classifier. (C) Correlation of discriminative weights for the overlapped features between the LSVM and logistic regression classifiers.
DISCUSSION
This study demonstrated that dyslexic children could be distinguished from healthy controls by jointly using multitype and multiregional WM features, indicating a multidimensional effect on WM connectivity and, therefore, supporting the multidimensional deficit theory for developmental dyslexia. Notably, a set of discriminative features were consistently recognized using two distinct classification models (i.e., LSVM and logistic regression), which were primarily associated with WM regions within the putative reading network/system (e.g., the superior longitudinal fasciculus, inferior fronto‐occipital fasciculus, and thalamocortical projections), the limbic system (e.g., the cingulum and fornix), and the motor system (e.g., the cerebellar peduncle, corona radiata, and corticospinal tract). These WM results provide direct support for the disconnection hypothesis of dyslexia and shed light on the neural mechanisms underlying human reading and dyslexia. Finally, the proposed WM imaging‐feature‐based classification for dyslexia implied an alternative way for identifying dyslexic individuals, which offered valuable implication in clinical setting.
The Most Discriminative WM Connections/Regions: The Putative Reading System
Human reading includes a series of complex cognitive components that involve visual, phonological, and semantic processes. Therefore, effective communication between specific brain areas is likely required. Dysfunction in WM connections between reading‐related gray matter regions have been previously hypothesized for dyslexia, that is, the disconnection hypothesis [Klingberg et al., 2000].
In line with this hypothesis, a number of DTI studies using between‐group comparisons have shown disrupted WM integrity in the temporo‐parietal and frontal areas of dyslexic subjects [Deutsch et al., 2005; Rimrodt et al., 2010; Vandermosten et al., 2012a). For example, disruption of the superior longitudinal fasciculus/arcuate fasciculus was observed repeatedly in dyslexia, which likely underlies the phonological processing deficits [Vandermosten et al., 2012a). Compatibly, the left superior longitudinal fasciculus/arcuate fasciculus was found to be highly associated with reading development in normal children: the longitudinal morphometric change of this particular tract was predictive to reading abilities at the end time point [Myers et al., 2014], and vice versa, its structural coherence at the initial time point showed the potential to predict the longitudinal change of reading abilities [Gullick and Booth, 2015]. In contrast, Hoeft and colleagues revealed that the right superior longitudinal fasciculus, rather than the left one, is able to marginally predict the long‐term reading gains in children with dyslexia, although its prediction performance is worse than the functional activation features [Hoeft et al., 2011].
Less consistently, other investigations also reported dyslexia‐related abnormalities in other WM tracts, such as the inferior longitudinal fasciculus, inferior fronto‐occipital fasciculus, external capsule, internal capsule, and corpus callosum [Frye et al., 2008; Frye et al., 2011; Niogi and McCandliss, 2006; Rollins et al., 2009; Yeatman et al., 2012]. These WM tracts together with the superior longitudinal fasciculus are likely responsible for communication within a putative reading system that involves the frontal, temporo‐parietal, occipito‐temporal, and thalamocortical regions in the two hemispheres [Ben‐Shachar et al., 2007].
These previously reported WM tracts/regions (e.g., the superior longitudinal fasciculus, inferior longitudinal fasciculus, superior corona radiata, external capsule, internal capsule, and corpus callosum) were largely found to be discriminative in the current study. For example, the left superior longitudinal fasciculus was found to be significantly discriminative in the LSVM, and almost in the logistic regression analysis. In addition, the bilateral sagittal stratum and inferior fronto‐occipital fasciculus were significantly discriminative in both LSVM and logistic regression analyses. These two WM regions both contain a substantial part of the inferior longitudinal fasciculus [Mori et al., 2008], and therefore, it is likely that the inferior longitudinal fasciculus significantly contributes to the successful classification. The currently observed discriminability for the two prominently studied WM tracts in previous reading literatures, that is, the superior longitudinal fasciculus and inferior longitudinal fasciculus, further highlights their essential role in human reading.
The Most Discriminative WM Connections/Regions: The Limbic System
The present machine learning study also revealed novel findings in dyslexia‐related WM regions/connections. First, a nontrivial role of major tracts within the limbic system in dyslexia was observed: specific segments of the fornix and cingulum were very discriminative. However, these tracts were rarely mentioned in previous dyslexic studies. This discrepancy may be due to the method difference (univariate vs. multivariate comparison). The machine learning approach used in this study was likely to provide a more sensitive way to capture the anomalies of these tracts in dyslexia. Anatomically, the fornix and cingulum constitute efferent and afferent major fibers of the hippocampus, a critical structure for memory formation [Paz‐Alonso et al., 2013; Ullman, 2004] and working memory [Winston et al., 2013]. Numerous animal fornix‐transection and human neuroimaging studies have demonstrated a very strong linkage of the fornix with both working memory [Douet and Chang, 2015; Murray et al., 1989] and long‐term memory [Douet and Chang, 2015]. Taken together, the observation for these memory‐related tracts support a possible contribution of particular memory deficit in dyslexia, likely serving as one of the affected cognitive domains in terms of the multidimensional deficit theory.
In fact, previous behavioral studies have repeatedly found impaired scores of working memory in dyslexic individuals [Landerl et al., 2013; Shu et al., 2006; Wagner and Torgesen, 1987]. In addition, specific deficits in long‐term memory have also been reported in dyslexic children [Ho et al., 2006; Hulme et al., 2007; Li et al., 2009]. At the neural level, abnormal functional activation around hippocampus has been observed during working memory performance in adolescents and young adults with dyslexia [Wolf et al., 2010]. Also, hippocampal morphometry was found abnormal in dyslexic adults [Casanova et al., 2005]. These findings consistently implied a role of memory component in dyslexia, being supportive of our current findings for these limbic WM tracts.
In addition to those directly related findings in dyslexia, there are other indirect evidence in normal reading studies. For example, hippocampal volume was found to contribute significantly when predicting form‐sound association, an important component of reading [He et al., 2013]. In addition, a few candidate genes of dyslexia have been found to express mainly in hippocampus and surrounding areas [Poelmans et al., 2011], which also influence the volume of cingulum [Scerri et al., 2012]. These indirect findings further implied the involvement of hippocampal and limbic tracts in reading, and therefore, likely in reading disabilities.
The Most Discriminative WM Connections/Regions: The Motor System
Finally, multiple discriminative WM regions have been associated with the motor system (e.g., corticospinal tract, corona radiata, cerebral peduncle, cerebellar peduncle, and medial lemniscus). This result is compatible with a recent study that showed the involvement of cerebellar white matter pathways in reading skills [Travis et al., 2015]. These findings favor the automatization/cerebellar theory of dyslexia, in which impairments in cerebellar and related structures are hypothesized to play a central role in dyslexia by affecting procedural learning, the acquisition of automatic processes, and fluent processing [Nicolson and Fawcett, 2007; Nicolson et al., 2001; Stoodley and Stein, 2011]. Consistent with this concept, cerebellar activation was repeatedly observed during reading‐related tasks [Jobard et al., 2003; Turkeltaub et al., 2002]. Moreover, structural anomalies of the cerebellum, such as reduced volume or atypical asymmetry, were also observed in dyslexia [Eckert et al., 2003; Fernandez et al., 2013; Kibby et al., 2008]. Particularly, reduced functional connectivity between the cerebellum and inferior frontal gyrus/angular gyrus was observed in dyslexic subjects during reading and phonological processing [Horwitz et al., 1998; Stanberry et al., 2006]. Our results provide further evidence of an involvement of cortico‐cerebellar WM tracts in dyslexia, which may serve as structural substrates for the disrupted cortico‐cerebellar functional connectivity.
Intriguingly, our currently observed involvement of the limbic/memory and motor system may be associated with reading development in Chinese children. Behaviorally, the Chinese language is quite different with other languages, by uniquely possessing a very complex visual structure of characters and lacking grapheme‐phoneme conversions [Chen and Kao, 2002; Shu et al., 2003]. Consequently, specific cognitive resources are expected to be more involved in Chinese reading, compared with other languages. For example, there is very strong involvement of memory (e.g., approximately 3,500 characters and complex visual‐to‐phoneme mapping rules) and motor process (e.g., repeatedly handwriting newly learned characters) during learning to read Chinese [Liu et al., 2013; Tan et al., 2005]. Given these facts, it is possible that our currently observed limbic‐tracts and motor‐tracts are specific to Chinese dyslexia, but the putative reading‐related tracts are generalizable to other languages. Compatibly, a couple of brain imaging studies have revealed specific functional neuroanatomical manifestations of dyslexia in Chinese. For instance, Chinese dyslexic children exhibited functional under‐activations of the left middle frontal gyrus as well as reduced gray matter volume of this region, which has been rarely found in English dyslexia [Siok et al., 2008; Siok et al., 2004]. This unique finding was also attributed to the high demand of motor process for Chinese during reading acquisition stage [Siok et al., 2008].
Notably, the above speculations for the language specificity of our findings require much caution. First, the WM manifestation in dyslexia has never been investigated in the cross‐linguistic context. In fact, the WM investigation even solely in Chinese dyslexia remains scarce. Therefore, it is difficult to obtain direct clues/evidences supporting the language specificity of our current findings. Second, even from the functional perspective, it remains a challenge to conclude general differences in the neurobiological manifestation of reading and developmental dyslexia between Chinese and other languages. For example, the above mentioned difference of functional manifestation of developmental dyslexia between the Chinese and English might not be that massive, according to a direct cross‐linguistic comparison that showed a common pattern of under‐activation of dyslexic readers in Chinese and English, relative to nonimpaired readers [Hu et al., 2010]. Much more investigations are, therefore, warranted to this field [Richlan, 2014]. To evaluate above culture‐related speculation, empirically analyzing another non‐Chinese or non‐Asian dyslexic cohort would be required. This however cannot be achieved at this point, and warrants future investigations.
The roles of these recognized discriminative WM regions/tracts should also be interpreted in the context of the entire multivariate pattern, because the relationships among features may substantially contribute to the classification [Ecker et al., 2010]. For example, the atypical WM patterns in dyslexia may be related to relationships between specific subsystems (e.g., the putative reading system, limbic system, and motor systems), given the fact that dyslexic individuals tend to recruit other systems during the reading process to compensate for deficits in the original reading system [Richlan et al., 2011; Shaywitz et al., 2003]. It would be very helpful for interpretations if specific pattern differences of the WM discriminative features can be explicitly presented for the dyslexic and control groups, respectively. This however can only be possible when the number of features is quite small (e.g., < 3) in the machine learning framework. Given our large number of WM features, it is almost infeasible to analytically quantify or present the pattern differences, because of the high‐dimensional complexity of the possible relationships among the features. Much effort is required in the future to address this general limitation for multivariate machine learning studies.
Multitype Discriminative WM Features
Our results showed that the classifier using multitype WM features (i.e., regional WMV, FA, MD, AD, and RD) performed largely better than single WM feature‐based classifiers, suggesting that all these features were jointly affected by the dyslexia. It should be noted that the discrimination performance using combined multitype WM features showed only a slight improvement or even a trend compared with the WM feature of volume or AD alone (Table 1). This may relate to the limited sample size of this study, which requires future validation. The tissue volume and diffusion measures have been suggested to be complementary in understanding brain functions [Abe et al., 2008]. Biologically, the WMV tends to mainly reflect the number of axons, and diffusion metrics were more specific to microstructural properties such as the degree of myelination or axonal coherences [Beaulieu, 2002; Hugenschmidt et al., 2008]. Both volumetric and diffusion abnormalities of WM have been observed in previous dyslexic studies [Krafnick et al., 2014; Vandermosten et al., 2012b).
Intriguingly, the majority of the observed discriminative features in the current study are based on the WMV metric, which implies a greater sensitivity of WMV for dyslexia. Biologically, dyslexia has been associated with disturbed neural migration early in life [Galaburda et al., 1985; Humphreys et al., 1990]. Intuitively, early developmental anomalies during neural migration likely results in overall changes of dyslexic brain in later life, such as the number of neurons/axons. The volume of WM is likely to be a sensitive marker for this phenomenon. Taken together, the observed discriminative features, majority of which are comprised of WMV metrics, supported a leading contribution of early developmental abnormality to the pathology of dyslexia. The childhood WM developmental abnormalities such as abnormal myelination (e.g., diffusion abnormalities) may contribute to some degree, as well. It is also possible that childhood WM developmental abnormalities are simply secondary to the disturbance of neural migration in early life, resulting in subtle changes in dyslexic children and smaller number of diffusion metrics as the discriminative features.
Identification of Dyslexic Children Using WM Neuroimaging Features
Currently, the diagnosis of developmental dyslexia mainly relies on behavioral assessment, which is typically time‐consuming and highly depends on both examinee's compliance and examiner's skills. In contrast, automated neuroimaging‐based identification can effectively avoid these manual involvement and potential bias. More importantly, the neuroimaging‐based identification framework can provide valuable information for the neural basis of dyslexia, that is, “biomarkers”, which are still lacking but highly desired [Gabrieli, 2009; Wandell and Yeatman, 2013]. These relevant information can be very useful to distinguish dyslexia from other disorders (e.g., special language impairment) that share similar behavioral phenotype with dyslexia [Pennington and Bishop, 2009]. In addition, these “biomarkers” information can be very important to develop particular treatment for dyslexia [Hoeft et al., 2007].
For the automated diagnosis of dyslexia with neuroimaging measures (e.g., electrical activities, gray matter morphology, functional activities), there have been a few promising results [Duffy et al., 1980; El‐Baz et al., 2008; Pernet et al., 2009; Tanaka et al., 2011]. Compared with these previous studies, our present study had a relatively larger sample size, and effectively avoided algorithm's overfitting by adopting a nested‐LOOCV in the classification framework. Most importantly, we applied the WM connectivity features to classify dyslexic individuals from control children, and ended up with relatively high classification accuracy. The ability to discriminate dyslexic and control patients using multiple WM neuroimaging features indicates the diagnostic potential of WM connectivity in other neuropsychiatric disorders with disconnection syndrome [Jin et al., 2015], which deserves more attention in future classification studies.
Limitations and Future Directions
A few methodological issues need to be addressed. First, our classification was achieved in a small cohort, and the generalization of our current results warrants further validation using an independent large cohort as well as other cross‐validation methods. Moreover, it would be ideal to determine the subjects' dyslexic/normal status by using standardized behavioral scores concurrent with the MRI scanning. Second, the morphometry of peripheral WM is highly variable across individuals, and these regions were excluded here to avoid potential errors due to spatial misalignment between subjects. However, the peripheral WMs may contain valuable discriminative features that improve classification. Therefore, these regions should be considered in the future. Next, many factors such as brain atrophy, hypo‐ or hyper‐intensity, and between‐subject misalignment due to registration errors may distort the values of WM volume and diffusion metrics. To avoid this, more advanced imaging techniques and sophisticated algorithms are desired. Finally, this study focused on distinguishing school‐aged dyslexic children from age‐matched healthy controls. Whether the current results are applicable to adults or preschool children is not known. Therefore, caution should be exercised when extrapolating our findings across the lifespan.
Supporting information
Supporting Information
ACKNOWLEDGMENTS
The authors thank sincerely the young people and their families for participating in this study. Also, the authors would like to thank Dr. Maaike Vandermosten for her valuable comments during the revision.
Conflicts of interest: The authors have no conflicts of interest to declare.
REFERENCES
- Abe O, Yamasue H, Aoki S, Suga M, Yamada H, Kasai K, Masutani Y, Kato N, Kato N, Ohtomo K (2008): Aging in the CNS: Comparison of gray/white matter volume and diffusion tensor data. Neurobiol Aging 29:102–116. [DOI] [PubMed] [Google Scholar]
- Anderson JS, Nielsen JA, Froehlich AL, DuBray MB, Druzgal TJ, Cariello AN, Cooperrider JR, Zielinski BA, Ravichandran C, Fletcher PT, Alexander AL Bigler ED Lange N Lainhart JE (2011): Functional connectivity magnetic resonance imaging classification of autism. Brain 134:3742–3754. [DOI] [PMC free article] [PubMed] [Google Scholar]
- Ashburner J, Friston KJ (2005): Unified segmentation. Neuroimage 26:839–851. [DOI] [PubMed] [Google Scholar]
- Beaulieu C (2002): The basis of anisotropic water diffusion in the nervous system—a technical review. NMR Biomed 15:435–455. [DOI] [PubMed] [Google Scholar]
- Beaulieu C, Plewes C, Paulson LA, Roy D, Snook L, Concha L, Phillips L (2005): Imaging brain connectivity in children with diverse reading ability. Neuroimage 25:1266–1271. [DOI] [PubMed] [Google Scholar]
- Ben‐Shachar M, Dougherty RF, Wandell BA (2007): White matter pathways in reading. Curr Opin Neurobiol 17:258–270. [DOI] [PubMed] [Google Scholar]
- Boets B, Op de Beeck HP, Vandermosten M, Scott SK, Gillebert CR, Mantini D, Bulthe J, Sunaert S, Wouters J, Ghesquiere P (2013): Intact but less accessible phonetic representations in adults with dyslexia. Science 342:1251–1254. [DOI] [PMC free article] [PubMed] [Google Scholar]
- Burges CJC (1998): A tutorial on Support Vector Machines for pattern recognition. Data Mining Knowledge Discov 2:121–167. [Google Scholar]
- Casanova MF, Christensen JD, Giedd J, Rumsey JM, Garver DL, Postel GC (2005): Magnetic resonance imaging study of brain asymmetries in dyslexic patients. J Child Neurol 20:842–847. [DOI] [PubMed] [Google Scholar]
- Chang CC, Lin CJ (2011): LIBSVM: A library for support vector machines. Acm Trans Intell Syst Technol 2:27 [Google Scholar]
- Chen XF, Kao HSR (2002): Visual‐Spatial Properties and Orthographic Processing of Chinese Characters. Cognitive Neuroscience Studies of the Chinese Language, Aberdeen, Hong Kong: Hong Kong University Press, pp. 175–194.
- Cui Z, Zhong S, Xu P, He Y, Gong G (2013): PANDA: A pipeline toolbox for analyzing brain diffusion images. Front Hum Neurosci 7:42. [DOI] [PMC free article] [PubMed] [Google Scholar]
- Dai ZJ, Yan CG, Wang ZQ, Wang JH, Xia MR, Li KC, He Y (2012): Discriminative analysis of early Alzheimer's disease using multi‐modal imaging and multi‐level characterization with multi‐classifier (M3). NeuroImage 59:2187–2195. [DOI] [PubMed] [Google Scholar]
- Davatzikos C (2004): Why voxel‐based morphometric analysis should be used with great caution when characterizing group differences. Neuroimage 23:17–20. [DOI] [PubMed] [Google Scholar]
- Deutsch GK, Dougherty RF, Bammer R, Siok WT, Gabrieli JDE, Wandell B (2005): Children's reading performance is correlated with white matter structure measured by diffusion tensor imaging. Cortex 41:354–363. [DOI] [PubMed] [Google Scholar]
- Dosenbach NUF, Nardos B, Cohen AL, Fair DA, Power JD, Church JA, Nelson SM, Wig GS, Vogel AC, Lessov‐Schlaggar CN (2010): Prediction of individual brain maturity using fMRI. Science 329:1358–1361. [DOI] [PMC free article] [PubMed] [Google Scholar]
- Douet V, Chang L (2015): Fornix as an imaging marker for episodic memory deficits in healthy aging and in various neurological disorders. Front Aging Neurosci 6:343 [DOI] [PMC free article] [PubMed] [Google Scholar]
- Duffy FH, Denckla MB, Bartels PH, Sandini G, Kiessling LS (1980): Dyslexia: Automated diagnosis by computerized classification of brain electrical activity. Ann Neurol 7:421–428. [DOI] [PubMed] [Google Scholar]
- Ecker C, Marquand A, Mourao‐Miranda J, Johnston P, Daly EM, Brammer MJ, Maltezos S, Murphy CM, Robertson D, Williams SC, Murphy DGM (2010): Describing the brain in autism in five dimensions–magnetic resonance imaging‐assisted diagnosis of autism spectrum disorder using a multiparameter classification approach. J Neurosci 30:10612–10623. [DOI] [PMC free article] [PubMed] [Google Scholar]
- Eckert MA, Leonard CM, Richards TL, Aylward EH, Thomson J, Berninger VW (2003): Anatomical correlates of dyslexia: Frontal and cerebellar findings. Brain 126:482–494. [DOI] [PubMed] [Google Scholar]
- El‐Baz A, Casanova M, Gimel'farb G, Mott M, Switala A (2008): An MRI‐based diagnostic framework for early diagnosis of dyslexia. Int J Comput Assist Radiol Surg 3:181–189. [Google Scholar]
- Farris EA, Odegard TN, Miller HL, Ring J, Allen G, Black J (2011): Functional connectivity between the left and right inferior frontal lobes in a small sample of children with and without reading difficulties. Neurocase 17:425–439. [DOI] [PubMed] [Google Scholar]
- Fawcett T (2006): An introduction to ROC analysis. Pattern Recogn Lett 27:861–874. [Google Scholar]
- Fernandez VG, Stuebing K, Juranek J, Fletcher JM (2013): Volumetric analysis of regional variability in the cerebellum of children with dyslexia. Cerebellum 12:906–915. [DOI] [PMC free article] [PubMed] [Google Scholar]
- Finn ES, Shen X, Holahan JM, Scheinost D, Lacadie C, Papademetris X, Shaywitz SE, Shaywitz BA, Constable RT (2014): Disruption of functional networks in dyslexia: A whole‐brain, data‐driven analysis of connectivity. Biol Psychiatry 76:397–404. [DOI] [PMC free article] [PubMed] [Google Scholar]
- Frye RE, Hasan K, Xue L, Strickland D, Malmberg B, Liederman J, Papanicolaou A (2008): Splenium microstructure is related to two dimensions of reading skill. Neuroreport 19:1627–1631. [DOI] [PMC free article] [PubMed] [Google Scholar]
- Frye RE, Liederman J, Hasan KM, Lincoln A, Malmberg B, McLean J, 3rd , Papanicolaou A (2011): Diffusion tensor quantification of the relations between microstructural and macrostructural indices of white matter and reading. Hum Brain Mapp 32:1220–1235. [DOI] [PMC free article] [PubMed] [Google Scholar]
- Gabrieli JD (2009): Dyslexia: A new synergy between education and cognitive neuroscience. Science 325:280–283. [DOI] [PubMed] [Google Scholar]
- Galaburda AM, Sherman GF, Rosen GD, Aboitiz F, Geschwind N (1985): Developmental dyslexia: Four consecutive patients with cortical anomalies. Ann Neurol 18:222–233. [DOI] [PubMed] [Google Scholar]
- Gong YX, Cai T (1993): Wechsler Intelligence Scale For Children, Chinese Revision (C‐WISC). China: Map Press Hunan. [Google Scholar]
- Gullick MM, Booth JR (2015): The direct segment of the arcuate fasciculus is predictive of longitudinal reading change. Dev Cogn Neurosci 13:68–74. [DOI] [PMC free article] [PubMed] [Google Scholar]
- Hahn T, Kircher T, Straube B, Wittchen H‐U, Konrad C, Ströhle A, Wittmann A, Pfleiderer B, Reif A, Arolt V, Lueken U (2015): Predicting treatment response to cognitive behavioral therapy in panic disorder with agoraphobia by integrating local neural information. JAMA Psychiatry 72:68–74. [DOI] [PubMed] [Google Scholar]
- Haynes JD, Rees G (2006): Decoding mental states from brain activity in humans. Nat Rev Neurosci 7:523–534. [DOI] [PubMed] [Google Scholar]
- He Q, Xue G, Chen C, Chen C, Lu ZL, Dong Q (2013): Decoding the neuroanatomical basis of reading ability: A multivoxel morphometric study. J Neurosci 33:12835–12843. [DOI] [PMC free article] [PubMed] [Google Scholar]
- Ho CSH, Chan DW, Tsang SM, Lee SH, Chung KKH (2006): Word learning deficit among Chinese dyslexic children. Journal of Child Language 33:145–161. [DOI] [PubMed] [Google Scholar]
- Hoeft F, McCandliss BD, Black JM, Gantman A, Zakerani N, Hulme C, Lyytinen H, Whitfield‐Gabrieli S, Glover GH, Reiss AL, Gabrieli JDE (2011): Neural systems predicting long‐term outcome in dyslexia. Proc Natl Acad Sci USA 108:361–366. [DOI] [PMC free article] [PubMed] [Google Scholar]
- Hoeft F, Ueno T, Reiss AL, Meyler A, Whitfield‐Gabrieli S, Glover GH, Keller TA, Kobayashi N, Mazaika P, Jo B, Just MA Gabrieli JDE (2007): Prediction of children's reading skills using behavioral, functional, and structural neuroimaging measures. Behav Neurosci 121:602–613. [DOI] [PubMed] [Google Scholar]
- Horwitz B, Rumsey JM, Donohue BC (1998): Functional connectivity of the angular gyrus in normal reading and dyslexia. Proc Natl Acad Sci USA 95:8939–8944. [DOI] [PMC free article] [PubMed] [Google Scholar]
- Hu W, Lee HL, Zhang Q, Liu T, Geng LB, Seghier ML, Shakeshaft C, Twomey T, Green DW, Yang YM, Price CJ (2010): Developmental dyslexia in Chinese and English populations: Dissociating the effect of dyslexia from language differences. Brain 133:1694–1706. [DOI] [PMC free article] [PubMed] [Google Scholar]
- Hugenschmidt CE, Peiffer AM, Kraft RA, Casanova R, Deibler AR, Burdette JH, Maldjian JA, Laurienti PJ (2008): Relating imaging indices of white matter integrity and volume in healthy older adults. Cereb Cortex 18:433–442. [DOI] [PubMed] [Google Scholar]
- Hulme C, Goetz K, Gooch D, Adams J, Snowling MJ (2007): Paired‐associate learning, phoneme awareness, and learning to read. J Exp Child Psychol 96:150–166. [DOI] [PubMed] [Google Scholar]
- Humphreys P, Kaufmann WE, Galaburda AM (1990): Developmental dyslexia in women: Neuropathological findings in three patients. Ann Neurol 28:727–738. [DOI] [PubMed] [Google Scholar]
- Jin Y Wee CY Shi F Thung KH Ni D Yap PT Shen D (2015): Identification of infants at high‐risk for autism spectrum disorder using multiparameter multiscale white matter connectivity networks. Hum Brain Mapp In press. [DOI] [PMC free article] [PubMed] [Google Scholar]
- Jobard G, Crivello F, Tzourio‐Mazoyer N (2003): Evaluation of the dual route theory of reading: A metanalysis of 35 neuroimaging studies. Neuroimage 20:693–712. [DOI] [PubMed] [Google Scholar]
- Kibby MY, Fancher JB, Markanen R, Hynd GW (2008): A quantitative magnetic resonance imaging analysis of the cerebellar deficit hypothesis of dyslexia. J Child Neurol 23:368–380. [DOI] [PMC free article] [PubMed] [Google Scholar]
- Klingberg T, Hedehus M, Temple E, Salz T, Gabrieli JDE, Moseley ME, Poldrack RA (2000): Microstructure of temporo‐parietal white matter as a basis for reading ability: Evidence from diffusion tensor magnetic resonance imaging. Neuron 25:493–500. [DOI] [PubMed] [Google Scholar]
- Koyama MS, Di Martino A, Kelly C, Jutagir DR, Sunshine J, Schwartz SJ, Castellanos FX, Milham MP (2013): Cortical signatures of dyslexia and remediation: An intrinsic functional connectivity approach. PLoS One 8:e55454. [DOI] [PMC free article] [PubMed] [Google Scholar]
- Krafnick AJ, Flowers DL, Luetje MM, Napoliello EM, Eden GF (2014): An Investigation into the Origin of Anatomical Differences in Dyslexia. J Neurosci 34:901–908. [DOI] [PMC free article] [PubMed] [Google Scholar]
- Kurth F, Luders E, Gaser C (2010): VBM8 Toolbox Manual. (available at http://dbm.neuro.uni-jena.de/vbm8/VBM8-Manual.pdf).
- Landerl K, Ramus F, Moll K, Lyytinen H, Leppanen PH, Lohvansuu K, O'Donovan M, Williams J, Bartling J, Bruder J, Kunze S Neuhoff N Toth D Honbolygo F Csepe V Bogliotti C Lannuzzi S Chaix Y Demonet JF Longeras E Valdois S Chabernaud C Delteil‐Pinton F Billard C George F Ziegler JC Comte‐Gervais I Soares‐Boucaud I Gerard CL Blomert L Vaessen A Gerretsen P Ekkebus M Brandeis D Maurer U Schulz E van der Mark S Muller‐Myhsok B Schulte‐Korne G (2013): Predictors of developmental dyslexia in European orthographies with varying complexity. J Child Psychol Psychiatry 54:686–694. [DOI] [PubMed] [Google Scholar]
- Lei L, Pan J, Liu H, McBride‐Chang C, Li H, Zhang Y, Chen L, Tardif T, Liang W, Zhang Z, Shu H (2011): Developmental trajectories of reading development and impairment from ages 3 to 8 years in Chinese children. J Child Psychol Psychiatry 52:212–220. [DOI] [PubMed] [Google Scholar]
- Li H, Shu H, McBride‐Chang C, Liu HY, Xue J (2009): Paired associate learning in Chinese children with dyslexia. J Exp Child Psychol 103:135–151. [DOI] [PubMed] [Google Scholar]
- Li H, Shu H, McBride‐Chang C, Liu HY, Peng H (2012a): Chinese children's character recognition: Visuo‐orthographic, phonological processing and morphological skills. J Res Read 35:287–307. [Google Scholar]
- Li J, Pan P, Huang R, Shang H (2012b): A meta‐analysis of voxel‐based morphometry studies of white matter volume alterations in Alzheimer's disease. Neurosci Biobehav Rev 36:757–763. [DOI] [PubMed] [Google Scholar]
- Li F, Huang X, Tang W, Yang Y, Li B, Kemp GJ, Mechelli A, Gong Q (2014): Multivariate pattern analysis of DTI reveals differential white matter in individuals with obsessive‐compulsive disorder. Hum Brain Mapp 35:2643–2651. [DOI] [PMC free article] [PubMed] [Google Scholar]
- Liu F, Wee CY, Chen H, Shen D (2014): Inter‐modality relationship constrained multi‐modality multi‐task feature selection for Alzheimer's Disease and mild cognitive impairment identification. Neuroimage 84:466–475. [DOI] [PMC free article] [PubMed] [Google Scholar]
- Liu L, You W, Wang W, Guo X, Peng D, Booth J (2013): Altered brain structure in Chinese dyslexic children. Neuropsychologia 51:1169–1176. [DOI] [PubMed] [Google Scholar]
- Maughan B, Messer J, Collishaw S, Pickles A, Snowling M, Yule W, Rutter M (2009): Persistence of literacy problems: Spelling in adolescence and at mid‐life. J Child Psychol Psychiatry 50:893–901. [DOI] [PubMed] [Google Scholar]
- McGrath LM, Pennington BF, Shanahan MA, Santerre‐Lemmon LE, Barnard HD, Willcutt EG, Defries JC, Olson RK (2011): A multiple deficit model of reading disability and attention‐deficit/hyperactivity disorder: Searching for shared cognitive deficits. J Child Psychol Psychiatry 52:547–557. [DOI] [PMC free article] [PubMed] [Google Scholar]
- Mori S, Oishi K, Jiang H, Jiang L, Li X, Akhter K, Hua K, Faria AV, Mahmood A, Woods R (2008): Stereotaxic white matter atlas based on diffusion tensor imaging in an ICBM template. NeuroImage 40:570–582. [DOI] [PMC free article] [PubMed] [Google Scholar]
- Mourao‐Miranda J, Bokde AL, Born C, Hampel H, Stetter M (2005): Classifying brain states and determining the discriminating activation patterns: Support vector machine on functional MRI data. Neuroimage 28:980–995. [DOI] [PubMed] [Google Scholar]
- Murray EA, Davidson M, Gaffan D, Olton DS, Suomi S (1989): Effects of fornix transection and cingulate cortical ablation on spatial memory in rhesus monkeys. Exp Brain Res 74:173–186. [DOI] [PubMed] [Google Scholar]
- Myers CA, Vandermosten M, Farris EA, Hancock R, Gimenez P, Black JM, Casto B, Drahos M, Tumber M, Hendren RL, Hulme C Hoeft F (2014): White matter morphometric changes uniquely predict children's reading acquisition. Psychol Sci 25:1870–1883. [DOI] [PMC free article] [PubMed] [Google Scholar]
- Nicolson RI, Fawcett AJ (2007): Procedural learning difficulties: Reuniting the developmental disorders? Trends Neurosci 30:135–141. [DOI] [PubMed] [Google Scholar]
- Nicolson RI, Fawcett AJ, Dean P (2001): Developmental dyslexia: The cerebellar deficit hypothesis. Trends Neurosci 24:508–511. [DOI] [PubMed] [Google Scholar]
- Niogi SN, McCandliss BD (2006): Left lateralized white matter microstructure accounts for individual differences in reading ability and disability. Neuropsychologia 44:2178–2188. [DOI] [PubMed] [Google Scholar]
- Oldfield RC (1971): The assessment and analysis of handedness: The Edinburgh inventory. Neuropsychologia 9:97–113. [DOI] [PubMed] [Google Scholar]
- Paulesu E, Frith U, Snowling M, Gallagher A, Morton J, Frackowiak RS, Frith CD (1996): Is developmental dyslexia a disconnection syndrome? Evidence from PET scanning. Brain 119:143–157. [DOI] [PubMed] [Google Scholar]
- Paz‐Alonso PM, Bunge SA, Anderson MC, Ghetti S (2013): Strength of Coupling within a mnemonic control network differentiates those who can and cannot suppress memory retrieval. J Neurosci 33:5017–5026. [DOI] [PMC free article] [PubMed] [Google Scholar]
- Pennington BF (2006): From single to multiple deficit models of developmental disorders. Cognition 101:385–413. [DOI] [PubMed] [Google Scholar]
- Pennington BF, Bishop DVM (2009): Relations among speech, language, and reading disorders. Ann Rev Psychol 60:283–306. [DOI] [PubMed] [Google Scholar]
- Pennington BF, Santerre‐Lemmon L, Rosenberg J, MacDonald B, Boada R, Friend A, Leopold DR, Samuelsson S, Byrne B, Willcutt EG, Olson RK (2012): Individual prediction of dyslexia by single versus multiple deficit models. J Abnorm Psychol 121:212–224. [DOI] [PMC free article] [PubMed] [Google Scholar]
- Pereira F, Mitchell T, Botvinick M (2009): Machine learning classifiers and fMRI: A tutorial overview. Neuroimage 45:S199–S209. [DOI] [PMC free article] [PubMed] [Google Scholar]
- Pernet CR, Poline JB, Demonet JF, Rousselet GA (2009): Brain classification reveals the right cerebellum as the best biomarker of dyslexia. BMC Neurosci 10(1:67): [DOI] [PMC free article] [PubMed] [Google Scholar]
- Peterson RL, Pennington BF (2012): Developmental dyslexia. Lancet 379:1997–2007. [DOI] [PMC free article] [PubMed] [Google Scholar]
- Poelmans G, Buitelaar JK, Pauls DL, Franke B (2011): A theoretical molecular network for dyslexia: Integrating available genetic findings. Mol Psychiatry 16:365–382. [DOI] [PubMed] [Google Scholar]
- Pugh KR, Mencl WE, Jenner AR, Katz L, Frost SJ, Lee JR, Shaywitz SE, Shaywitz BA (2000): Functional neuroimaging studies of reading and reading disability (developmental dyslexia). Ment Retard Dev Disabil Res Rev 6:207–213. [DOI] [PubMed] [Google Scholar]
- Radua J, Via E, Catani M, Mataix‐Cols D (2011): Voxel‐based meta‐analysis of regional white‐matter volume differences in autism spectrum disorder versus healthy controls. Psychol Med 41:1539–1550. [DOI] [PubMed] [Google Scholar]
- Raven J (1998): Court JH. Manual for Raven's Progressive Matrices and Vocabulary Scales, vol. 12,. Oxford: Oxford Psychologists. [Google Scholar]
- Richlan F (2014): Functional neuroanatomy of developmental dyslexia: The role of orthographic depth. Front Hum Neurosci 8:347. [DOI] [PMC free article] [PubMed] [Google Scholar]
- Richlan F, Kronbichler M, Wimmer H (2011): Meta‐analyzing brain dysfunctions in dyslexic children and adults. Neuroimage 56:1735–1742. [DOI] [PubMed] [Google Scholar]
- Rimrodt SL, Peterson DJ, Denckla MB, Kaufmann WE, Cutting LE (2010): White matter microstructural differences linked to left perisylvian language network in children with dyslexia. Cortex 46:739–749. [DOI] [PMC free article] [PubMed] [Google Scholar]
- Rollins NK, Vachha B, Srinivasan P, Chia J, Pickering J, Hughes CW, Gimi B (2009): Simple Developmental Dyslexia in Children: Alterations in Diffusion‐Tensor Metrics of White Matter Tracts at 3 T. Radiology 251:882–891. [DOI] [PubMed] [Google Scholar]
- Ross A, Jain A (2003): Information fusion in biometrics. Pattern Recogn Lett 24:2115–2125. [Google Scholar]
- Scerri TS, Darki F, Newbury DF, Whitehouse AJ, Peyrard‐Janvid M, Matsson H, Ang QW, Pennell CE, Ring S, Stein J, Morris AP Monaco AP Kere J Talcott JB Klingberg T Paracchini S (2012): The dyslexia candidate locus on 2p12 is associated with general cognitive ability and white matter structure. PLoS One 7:e50321 [DOI] [PMC free article] [PubMed] [Google Scholar]
- Schurz M, Wimmer H, Richlan F, Ludersdorfer P, Klackl J, Kronbichler M (2015): Resting‐state and task‐based functional brain connectivity in developmental dyslexia. Cereb Cortex 25:3502–3514. [DOI] [PMC free article] [PubMed] [Google Scholar]
- Shaywitz SE, Fletcher JM, Holahan JM, Shneider AE, Marchione KE, Stuebing KK, Francis DJ, Pugh KR, Shaywitz BA (1999): Persistence of dyslexia: The Connecticut longitudinal study at adolescence. Pediatrics 104:1351–1359. [DOI] [PubMed] [Google Scholar]
- Shaywitz SE, Shaywitz BA (2005): Dyslexia (specific reading disability). Biol Psychiatry 57:1301–1309. [DOI] [PubMed] [Google Scholar]
- Shaywitz SE, Shaywitz BA, Fletcher JM, Escobar MD (1990): Prevalence of reading disability in boys and girls. Results of the Connecticut longitudinal study. JAMA 264:998–1002. [PubMed] [Google Scholar]
- Shaywitz SE, Shaywitz BA, Fulbright RK, Skudlarski P, Mencl WE, Constable RT, Pugh KR, Holahan JM, Marchione KE, Fletcher JM, Lyon GR Gore JC (2003): Neural systems for compensation and persistence: Young adult outcome of childhood reading disability. Biol Psychiatry 54:25–33. [DOI] [PubMed] [Google Scholar]
- Shu H, Chen X, Anderson RC, Wu N, Xuan Y (2003): Properties of school Chinese: Implications for learning to read. Child Dev 74:27–47. [DOI] [PubMed] [Google Scholar]
- Shu H, McBride‐Chang C, Wu S, Liu HY (2006): Understanding Chinese developmental dyslexia: Morphological awareness as a core cognitive construct. J Educ Psychol 98:122–133. [Google Scholar]
- Silani G, Frith U, Demonet JF, Fazio F, Perani D, Price C, Frith CD, Paulesu E (2005): Brain abnormalities underlying altered activation in dyslexia: A voxel based morphometry study. Brain 128:2453–2461. [DOI] [PubMed] [Google Scholar]
- Siok WT, Niu Z, Jin Z, Perfetti CA, Tan LH (2008): A structural‐functional basis for dyslexia in the cortex of Chinese readers. Proc Natl Acad Sci USA 105:5561–5566. [DOI] [PMC free article] [PubMed] [Google Scholar]
- Siok WT, Perfetti CA, Jin Z, Tan LH (2004): Biological abnormality of impaired reading is constrained by culture. Nature 431:71–76. [DOI] [PubMed] [Google Scholar]
- Stanberry LI, Richards TL, Berninger VW, Nandy RR, Aylward EH, Maravilla KR, Stock PS, Cordes D (2006): Low‐frequency signal changes reflect differences in functional connectivity between good readers and dyslexics during continuous phoneme mapping. Magn Reson Imaging 24:217–229. [DOI] [PubMed] [Google Scholar]
- Steinbrink C, Vogt K, Kastrup A, Muller HP, Juengling FD, Kassubeek J, Riecker A (2008): The contribution of white and gray matter differences to developmental dyslexia: Insights from DTI and VBM at 3.0 T. Neuropsychologia 46:3170–3178. [DOI] [PubMed] [Google Scholar]
- Stoodley CJ, Stein JF (2011): The cerebellum and dyslexia. Cortex 47:101–116. [DOI] [PubMed] [Google Scholar]
- Tan LH, Laird AR, Li K, Fox PT (2005): Neuroanatomical correlates of phonological processing of Chinese characters and alphabetic words: A meta‐analysis. Hum Brain Mapp 25:83–91. [DOI] [PMC free article] [PubMed] [Google Scholar]
- Tanaka H, Black JM, Hulme C, Stanley LM, Kesler SR, Whitfield‐Gabrieli S, Reiss AL, Gabrieli JDE, Hoeft F (2011): The brain basis of the phonological deficit in dyslexia is independent of IQ. Psychol Sci 22:1442–1451. [DOI] [PMC free article] [PubMed] [Google Scholar]
- Travis KE, Leitner Y, Feldman HM, Ben‐Shachar M (2015): Cerebellar white matter pathways are associated with reading skills in children and adolescents. Hum Brain Mapp 36:1536–1553. [DOI] [PMC free article] [PubMed] [Google Scholar]
- Turkeltaub PE, Eden GF, Jones KM, Zeffiro TA (2002): Meta‐analysis of the functional neuroanatomy of single‐word reading: Method and validation. Neuroimage 16:765–780. [DOI] [PubMed] [Google Scholar]
- Ullman MT (2004): Contributions of memory circuits to language: The declarative/procedural model. Cognition 92:231–270. [DOI] [PubMed] [Google Scholar]
- van der Mark S, Klaver P, Bucher K, Maurer U, Schulz E, Brem S, Martin E, Brandeis D (2011): The left occipitotemporal system in reading: Disruption of focal fMRI connectivity to left inferior frontal and inferior parietal language areas in children with dyslexia. NeuroImage 54:2426–2436. [DOI] [PubMed] [Google Scholar]
- Vandermosten M, Boets B, Luts H, Poelmans H, Golestani N, Wouters J, Ghesquiere P (2010): Adults with dyslexia are impaired in categorizing speech and nonspeech sounds on the basis of temporal cues. Proc Natl Acad Sci USA 107:10389–10394. [DOI] [PMC free article] [PubMed] [Google Scholar]
- Vandermosten M, Boets B, Poelmans H, Sunaert S, Wouters J, Ghesquiere P (2012a): A tractography study in dyslexia: Neuroanatomic correlates of orthographic, phonological and speech processing. Brain 135:935–948. [DOI] [PubMed] [Google Scholar]
- Vandermosten M, Boets B, Wouters J, Ghesquiere P (2012b): A qualitative and quantitative review of diffusion tensor imaging studies in reading and dyslexia. Neurosci Biobehav Rev 36:1532–1552. [DOI] [PubMed] [Google Scholar]
- Vapnik VN (1995): The Nature of Statistical Learning Theory. Springer‐Verlag, New York. [Google Scholar]
- Wagner RK, Torgesen JK (1987): The nature of phonological processing and its causal role in the acquisition of reading‐skills. Psychol Bull 101:192–212. [Google Scholar]
- Wandell BA, Yeatman JD (2013): Biological development of reading circuits. Curr Opin Neurobiol 23:261–268. [DOI] [PMC free article] [PubMed] [Google Scholar]
- Wee CY, Yap PT, Li W, Denny K, Browndyke JN, Potter GG, Welsh‐Bohmer KA, Wang L, Shen D (2011): Enriched white matter connectivity networks for accurate identification of MCI patients. Neuroimage 54:1812–1822. [DOI] [PMC free article] [PubMed] [Google Scholar]
- Whelan R, Watts R, Orr CA, Althoff RR, Artiges E, Banaschewski T, Barker GJ, Bokde AL, Buchel C, Carvalho FM, Conrod PJ Flor H Fauth‐Buhler M Frouin V Gallinat J Gan G Gowland P Heinz A Ittermann B Lawrence C Mann K Martinot JL Nees F Ortiz N Paillere‐Martinot ML Paus T Pausova Z Rietschel M Robbins TW Smolka MN Strohle A Schumann G Garavan H Consortium I (2014): Neuropsychosocial profiles of current and future adolescent alcohol misusers. Nature 512:185–189. [DOI] [PMC free article] [PubMed] [Google Scholar]
- Willcutt EG, Betjemann RS, McGrath LM, Chhabildas NA, Olson RK, DeFries JC, Pennington BF (2010): Etiology and neuropsychology of comorbidity between RD and ADHD: The case for multiple‐deficit models. Cortex 46:1345–1361. [DOI] [PMC free article] [PubMed] [Google Scholar]
- Winston GP, Stretton J, Sidhu MK, Symms MR, Thompson PJ, Duncan JS (2013): Structural correlates of impaired working memory in hippocampal sclerosis. Epilepsia 54:1143–1153. [DOI] [PMC free article] [PubMed] [Google Scholar]
- Wolf RC, Sambataro F, Lohr C, Steinbrink C, Martin C, Vasic N (2010): Functional brain network abnormalities during verbal working memory performance in adolescents and young adults with dyslexia. Neuropsychologia 48:309–318. [DOI] [PubMed] [Google Scholar]
- Xue J, Shu H, Li H, Li W, Tian X (2013): The stability of literacy‐related cognitive contributions to Chinese character naming and reading fluency. J Psycholinguist Res 42:433–450. [DOI] [PubMed] [Google Scholar]
- Yeatman JD, Dougherty RF, Ben‐Shachar M, Wandell BA (2012): Development of white matter and reading skills. Proc Natl Acad Sci USA 109:E3045–E3053. [DOI] [PMC free article] [PubMed] [Google Scholar]
- Zeng LL, Shen H, Liu L, Wang L, Li B, Fang P, Zhou Z, Li Y, Hu D (2012): Identifying major depression using whole‐brain functional connectivity: A multivariate pattern analysis. Brain 135:1498–1507. [DOI] [PubMed] [Google Scholar]
- Zhang C, Zhang J, Zhou J (1998): A study of cognitive profiles of Chinese learners' reading disability. Acta Psychol Sinica 30:50–56. [Google Scholar]
- Zhang Y, Zhang L, Shu H, Xi J, Wu H, Zhang Y, Li P (2012): Universality of categorical perception deficit in developmental dyslexia: An investigation of Mandarin Chinese tones. J Child Psychol Psychiatry 53:874–882. [DOI] [PubMed] [Google Scholar]
Associated Data
This section collects any data citations, data availability statements, or supplementary materials included in this article.
Supplementary Materials
Supporting Information