

Abstract
Posttraumatic stress disorder (PTSD) is characterized by unwanted intrusive thoughts and hyperarousal at rest. As these core symptoms reflect disturbance in resting‐state mechanisms, we investigated the functional and anatomical involvement of the default mode network (DMN) in this disorder. The relation between symptomatology and trauma characteristics was considered. Twenty PTSD patients and 20 matched trauma‐exposed controls that were exposed to a similar traumatic event were recruited for this study. In each group, 10 patients were exposed to military trauma, and 10 to civilian trauma. PTSD, anxiety, and depression symptom severity were assessed. DMN maps were identified in resting‐state scans using independent component analysis. Regions of interest (medial prefrontal, precuneus, and bilateral inferior parietal) were defined and average z‐scores were extracted for use in the statistical analysis. The medial prefrontal and the precuneus regions were used for cingulum tractography whose integrity was measured and compared between groups. Similar functional and anatomical connectivity patterns were identified in the DMN of PTSD patients and trauma‐exposed controls. In the PTSD group, functional and anatomical connectivity parameters were strongly correlated with clinical measures, and there was evidence of coupling between the anatomical and functional properties. Type of trauma and time from trauma were found to modulate connectivity patterns. To conclude, anatomical and functional connectivity patterns are related to PTSD symptoms and trauma characteristics influence connectivity beyond clinical symptoms. Hum Brain Mapp 37:589–599, 2016. © 2015 Wiley Periodicals, Inc.
Keywords: cingulum, diffusion tensor imaging (DTI), post‐trauma, resting‐state fMRI
INTRODUCTION
Post‐traumatic stress disorder (PTSD) develops following extreme stress or a traumatic event. Though initially PTSD was thought to be associated only with combat‐related trauma, it has subsequently been recognized that PTSD can occur in association with noncombat events [Naifeh et al., 2008]. According to the Diagnostic and Statistical Manual of Mental Disorders, Fifth Edition (DSM‐V) (American Psychiatric Association, 2013) two of the criteria for PTSD are intrusive, involuntary, “out‐of‐the‐blue” memories and continuous autonomic hyperarousal, which are indicative of deficiency in regulatory resting mechanisms. PTSD is frequently characterized by coexisting depression and anxiety [Yehuda, 2002].
Brain connectivity, linking distinct units within a defined nervous system, is crucial for elucidating how neural networks process information. Anatomical connectivity refers to the structural connections between distinct regions by means of the white matter fibers of the brain—the axons. This is evaluated using Diffusion Tensor Imaging (DTI) and fiber tractography. In contrast, functional connectivity is a statistical concept, capturing temporal correlations between distributed and often spatially remote neuronal units [Fox et al., 2005]. Unlike anatomical connectivity, functional connectivity may change over short periods of time as diverse brain units are recruited for performance of a specific task; even resting‐state connectivity is highly dependent on context [Chen et al., 2009; Gonzalez‐Castillo et al., 2014; and see for example: Liang et al., 2009]. It should be noted that functional connectivity does not imply an underlying structural model or directionality of the connections. Combining both anatomical and functional modalities can enrich our understanding of brain networks [Greicius et al., 2009].
The default mode network (DMN) is a network of brain regions that preferentially activates when the brain is not engaged in a specific attention‐demanding or stimulus‐dependent task. This stimulus‐independent mode has been suggested to be involved in mental explorations based on personal introspection, autobiographical memories, and thoughts of the future. The four core regions comprising the DMN are the medial prefrontal cortex (mPFC), the precuneus (often referred to as the posterior cingulate gyrus—PCC), and the left and right inferior parietal lobules (IPLs) [Buckner et al., 2008; Fox et al., 2005; Raichle et al., 2001]. Resting‐state functional MRI (fMRI) is commonly used to study these synchronous, non‐stimuli‐driven spontaneous fluctuations in brain activity [Biswal et al., 1995]. Several neuropsychiatric disorders are associated with abnormal function of the DMN [Broyd et al., 2009; Whitfield‐Gabrieli and Ford, 2012], most frequently in relation to the involvement of the DMN in personal introspection.
As the core symptoms of PTSD reflect disturbance in resting‐state mechanisms, one could reasonably hypothesize that the DMN plays a pivotal role in PTSD pathophysiology. To date, few PTSD resting‐state studies have focused on brain structures that are associated with the DMN, with reports of conflicting results of decreased and increased connectivity within different regions of the network [Peterson et al., 2014]. No robust conclusions could be drawn from DTI studies examining DMN integrity in this patient population [Daniels et al., 2013]. Imaging results were also related to clinical symptoms [Herringa et al., 2012; Sanjuan et al., 2013; Tursich et al., 2015].
Patients with PTSD exhibit severe emotional and physiological responses to benign internal or external stimuli that remind them of their traumatic experience. This suggests an alteration in internal resting‐state network function, rendering it less efficient in modulating these distractors [Menon, 2011]. Hypervigilance and intrusive thoughts, typical of PTSD, may be perceived as a failure of the DMN to maintain the “resting” state. We therefore hypothesize that patients with PTSD will exhibit reduced functional connectivity within the DMN (as reported by Sripada et al. [2012]) and reduced microstructural integrity of the main fasciculus connecting the DMN regions, the cingulum (as reported by Sanjuan et al. [2013]). We also expect to find an association between functional connectivity and anatomical structure of the fiber tracts comprising the DMN. We expect to demonstrate a relationship between functional and structural connectivity measures and patients' symptomatology, and to identify whether specific demographic characteristics are related to function and structure of specific brain regions within the DMN.
METHODS
Study Participants
Twenty patients (age range, 24–62 years; 3 women) with PTSD, defined according to the DSM‐IV‐TR criteria, were recruited from the psychiatric outpatient clinic of Hadassah Hebrew University Hospital. Twenty control subjects (age range, 25–68 years) who were exposed to a similar traumatic event but did not develop PTSD, were matched to patients for age, gender, and type of trauma (military or civilian), on a subject‐by‐subject basis. Exclusion criteria for both groups included symptoms or signs of psychosis or suicidality; drug/alcohol abuse in the previous 6 months; past history of brain injury, loss of consciousness or other neurological disease; and a contraindication to undergoing MRI. This study was in compliance with the Helsinki Declaration and the Hadassah Hebrew University Medical Center Ethics Committee approved the experimental procedure. Written informed consent was obtained from all subjects.
Trauma and symptom assessment
All participants underwent assessment using the Structured Clinical Interview for DSM‐IV (SCID‐CV) (First et al, 1996), as the recruitment for our study was completed before publication of DSM‐V. The severity of PTSD, depression, and anxiety symptoms were assessed using the Clinician‐Administered PTSD Scale (CAPS) [Blake et al., 1995], Hamilton Depression Rating Scale (HAM‐D) [Hamilton, 1960], and Hamilton Anxiety Scale (HAM‐A) [Maier et al., 1988], respectively.
Data acquisition
MRI data were acquired on a 3‐T scanner (Trio; Siemens, Erlangen, Germany) using a 32‐channel standard head‐coil. Anatomical MRI sequences included high‐resolution T1‐weighted images (minimum echo time [TE], flip angle 9°, repetition time [TR] = 2,300 ms, voxel size of 1 × 1 × 1 mm). Resting‐state blood oxygenation level dependent (BOLD) fMRI measurements were obtained with a gradient‐echo echo‐planar imaging sequence using TR = 2 s, TE = 30 ms, flip angle = 90°, imaging matrix = 64 × 64, FOV = 192 × 192 mm, 37 slices, 3 mm each with 0.8 mm gap and 240 repetitions. Subjects were instructed to lie with their eyes closed and to remain awake.
DTI data were acquired using a diffusion‐weighted imaging sequence (single‐shot, spin‐echo, TE = 94 ms, TR = 7,127–8,224 ms, FOV = 260 × 260 mm, matrix = 128 × 128, 52–60 axial slices, 2‐mm‐thick slices, b = 0 and b = 1000 s/mm2). The high b‐value was obtained by applying gradients along 64 different diffusion directions, including 2 averages.
Data analysis
fMRI data analysis was performed using BrainVoyager Qx (Brain Innovation, Maastricht, The Netherlands, 2000). Head motion correction and high‐pass temporal filtering in the frequency domain (3 cycles/total scan time) were applied in order to remove drifts and to improve the signal‐to‐noise ratio. As motion did not differ between groups (mean for patients: 1.7 mm, for controls: 1.2 mm; paired t‐test: p = 0.238) motion parameters were not included in analysis. Functional images were registered and incorporated into the three‐dimensional data sets through trilinear interpolation. The complete data set was transformed into Talairach space (Talairach and Tournoux, 1988). Talairach coordinates and atlas were used for anatomical labeling.
Data were analyzed using Independent Component Analysis (ICA) [Hyvarinen and Oja, 2000], a robust data‐driven method for extracting resting‐state networks (RSNs) [van de Ven et al., 2004]. Thirty spatially independent components were identified for each subject using BrainVoyager Qx's default parameters (30 components, tan h nonlinearity function, and 1,000 iterations). The component results were scaled to z‐scores, which reflect the degree to which the voxel's time course correlates with the time course corresponding to the specific ICA component. Maps were threshold at z = 2, assigned to every voxel in the brain.
For each subject, a trained observer identified the component most similar to the DMN as defined in Weissman‐Fogel et al. [2010]. This selection was then validated using self‐organizing group ICA [Esposito et al., 2005; Goebel et al., 2006], performed using the BrainVoyager QX sog‐ICA plugin (Brain Innovation, Maastricht, Netherlands). Briefly, the sog‐ICA plugin identifies spatial patterns that are common across subjects and clusters the components in a subject space while addressing the intersubject variability as much as possible.
Group maps were created for patients and control subjects separately, and the most similar DMN map was selected for each group by a second trained observer. There was a strong correlation between the maps selected by the first observer and the individual maps contributing to the DMN group maps. In the few cases of mismatch, the second observer compared the two options, and, in all cases chose the map selected by the first observer.
For each subject, from the individual DMN maps, regions significantly connected to the network (z > 2) in the mPFC, the precuneus and bilateral IPLs were defined as regions of interest (ROIs). Average z‐scores were extracted from these 4 ROIs and used for statistical analysis. The average time course was extracted from each ROI for each subject individually and was used to calculate the correlation between the resting activities in the regions.
Z‐scores maps were also used for the full brain between‐group t‐test (p < 0.05). In order to correct for multiple comparisons, cluster‐size threshold (1,188 voxels), based on Monte‐Carlo simulation (p < 0.05) was used.
DTI image processing and analysis was performed using the mrVista package http://vistalab.stanford.edu/software. Preprocessing included removing Eddy current distortions and subject motion. Data was registered and aligned to the T1 image using mutual information algorithm. As the cingulate is the major fiber bundle involved in emotional processing, we chose to focus on the part of this bundle that connects the DMN regions. Fiber tractography was used to delineate the cingulate in each patient. Fiber tracking was performed using the Contrack algorithm [Sherbondy et al., 2008], a probabilistic algorithm designed to identify the most likely pathway between two ROIs. The mPFC and the precuneus regions, as defined by the functional resting‐state analysis (above), were used as seed regions.
Contrack was set to generate a set of 50,000 candidate pathways, and the top 20% (10,000) were selected. A few clearly misidentified fibers were eliminated by visual inspection.
Diffusivity measurements: The tensors were fitted using a least‐squares algorithm. The eigenvalue decomposition of the diffusion tensor was computed. Measures of the mean diffusivity (MD), fractional anisotropy (FA), and diffusion parallel to (λ‖, AD) and perpendicular to (λ⊥, RD) the principal fiber direction was derived.
Diffusivity measurements along the tract and the core fiber analysis: In order to avoid partial voluming with nonwhite matter, diffusion measurements were taken near the dense core of the fibers. Diffusion at the core was estimated by combining data in a weighted fashion, assigning greater weight to voxels that are close to the core of the estimated tract [Yeatman et al., 2012]. Diffusion measures along the tract were resampled at 50 positions, calculating MD, FA, AD, and RD at each of these nodes. In this way, measures throughout the length of the fiber could be combined across different subjects. Additionally 5 points were removed from the beginning and end of the fiber.
Statistical analysis
Various statistical tools were used. T‐test, analysis of variance (ANOVA), and multivariate analysis of variance (MANOVA) were used to compare patients to controls and evaluate the effect of trauma. General linear model (GLM) regression was used to evaluate the correlation between connectivity measures and demographic characteristics and clinical scores. The exact test is stated in the relevant result section. Bonferroni correction was used in analyses that employed multiple regressions (comparing different ROIs or diffusion properties).
RESULTS
Patients' Characteristics
Patients were heterogeneous in terms of both background and clinical characteristics (Table 1). In each group (PTSD and controls) 10 patients were exposed to the traumatic event in the military while the other 10 had a civilian trauma. One patient from the PTSD‐civilian trauma subgroup was excluded due to intensive motion during the MRI session. Thus, analyses included 19 patients and 20 control subjects.
Table 1.
Patients' characteristics
| Age | Years from trauma | Military | CAPS | HAM‐A | HAM‐D | |
|---|---|---|---|---|---|---|
| Patients | 41.11 | 13.53 | 10/20 | 111.95 | 19.84 | 23.32 |
| Sd. | 11.74 | 11.8 | 32.92 | 11.07 | 10.07 | |
| Controls | 42.2 | 13.9 | 10/20 | 2.35 | 0.8 | 0.55 |
| Sd. | 13.79 | 13.33 | 6.77 | 1.4 | 1.77 |
CAPS, Clinician Administered PTSD Scale; HAM‐A, Hamilton Anxiety Scale; HAM‐D, Hamilton Depression Rating Scale.
Sd., standard deviation.
Grades for all subjects were within normal range.
Participants (from both groups) that suffered military trauma served in the Israel Defense Force (IDF) for at least 3 years. They reported one severe trauma which served as the index trauma. However, within this group, we could not rule out additional stressful events that occurred during military service. Most participants (from both groups) suffering from civilian trauma were survivors of motor vehicle accidents; one patient in each group (PTSD and controls) was exposed to a terrorist attack. In order to reduce heterogeneity in our cohort, we did not recruit patients with childhood trauma and sexual abuse.
The time from trauma varied from recent (2–3 years, 7 patients) to prolonged duration (up to 40 years post‐trauma), with an average of 13.5 years postexposure (standard deviation [sd] 11.8). CAPS scores were in the full PTSD range (54–171, average 111.95, sd 32.92) and reflect the more severe end of the PTSD spectrum. The majority of our patients group (14/19) had comorbid diagnosis at the time of the study, mainly major depression (n = 12). Six patients had panic disorder and 2 suffered from generalized anxiety disorder. Two patients had past substance abuse problems (at least 2 years prior to their participation in the study). Comorbidity measures can be found in HAM‐A and HAM‐D results (Table I).
Sixteen out of 19 PTSD patients (84%) were taking psychotropic medications at the time of MRI. About 80% were receiving antidepressants for either depression or anxiety symptoms and 35% were receiving antipsychotics as major tranquilizers or for antidepressant augmentation. One patient (5%) was receiving mood stabilizer for impulse control and hypervigilence symptoms. Thirty seven percent were taking benzodiazepines for sleep disturbance and anxiety symptoms.
None of the control participants met criteria for any psychiatric disorder.
Comparing the demographic characteristics of PTSD patients with civilian and military trauma showed a significant difference in age (younger for the civilian p < 0.05) and time from trauma (shorter for the civilian, p < 0.0005). In MANOVA with CAPS, HAM‐A and HAM‐D as dependent measures and type of trauma as a between‐group factor, there was a significant effect for trauma type (F (3, 15) = 6.04, p < 0.01). All clinical measures were elevated in PTSD patients who were military trauma survivors; although in post‐hoc analysis, none of the clinical measures were significant. Moreover, regression analysis showed that time from trauma could be predicted by clinical symptoms (F (3, 15) = 4.7, p < 0.02) and the factors significantly contributing to the model were CAPS (p < 0.02, t = 2.64) and the HAM‐D (p < 0.005, t = −3.41).
Functional Connectivity: Between‐Group Differences
For all patients and controls, we identified a map that was similar to the expected DMN. Group ICA maps of patients and controls were similar, and between‐group t‐test of the ICA maps did not show any between‐group differences in DMN regions (Fig. 1A and Table 2). ROI analysis comparing the z‐scores (measuring the similarity of the time‐course in each voxel to the component of the network) in the four predefined DMN ROIs failed to detect between‐group differences in any of the regions (paired t‐test: mPFC, precuneus, left IPL p > 0.1, right IPL p = 0.096). Similarly no between‐group differences were found when comparing the correlation between the time courses of pairs of DMN ROIs (p > 0.1 for all pairs; uncorrected).
Figure 1.
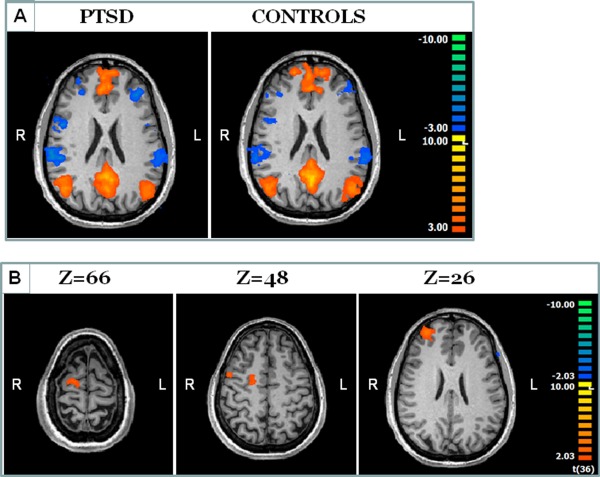
Functional connectivity results. The average DMN as defined using group‐ICA for Controls and PTSD patients is presented in A on an axial slice. Maps are highly similar and no significant between‐groups differences were found within the DMN regions. Between‐groups differences were found in regions beyond the DMN (B). In these regions, connectivity to the DMN regions was significantly decreased in PTSD patients.
Table 2.
Region of interest details
| Region | Talairach coordinates | # voxels | Average z‐score | ||
|---|---|---|---|---|---|
| X | Y | Z | |||
| Controls | |||||
| Left IPL | −44.56 | −69.15 | 27.15 | 7025 | 3.8 |
| Right IPL | 44.23 | −65.53 | 25.25 | 6137 | 3.94 |
| Precuneus | −2.73 | −53.61 | 19.81 | 24572 | 4.55 |
| mPFC | −2.09 | 45.62 | 23.34 | 38518 | 3.89 |
| Patients | |||||
| Left IPL | −43.63 | −68.92 | 29.43 | 5890 | 3.73 |
| Right IPL | 43.9 | −63.12 | 28.87 | 7605 | 3.79 |
| Precuneus | −2.13 | −56.05 | 24.34 | 26956 | 4.39 |
| mPFC | −7.04 | 42.63 | 23.96 | 27347 | 3.85 |
IPL, inferior parietal lobe; .mPFC, medial prefrontal cortex.
Though ROI analysis did not detect significant difference within the DMN regions that were selected, analysis of the DMN components at the whole map level identified between‐groups differences in others regions, i.e., regions showing differences in their connectivity to the DMN but are not considered part of it (Fig. 1B). Differences were located in the premotor cortex, lateral prefrontal cortex, and posterior frontal medial regions, all in the right hemisphere (p < 0.05 cluster size corrected). Analysis of the z‐scores shows that the effect is driven by negative correlations between these regions and the activity pattern in the DMN.
Functional Connectivity: Correlation with Demographic Factors
Demographic factors including subjects' age, sex, time from trauma, and type of trauma together with a dummy variable of the existence of PTSD significantly predicted the connectivity z‐scores in the right parietal region (F (5,33) = 3.32, p < 0.02, uncorrected; p = 0.062, corrected); factors that contributed significantly were type of trauma (p < 0.025) and time from trauma (p < 0.04) (Fig. 2A). The existence of PTSD variable was not significant (p = 0.1). No significant effect was found in the other regions of the DMN.
Figure 2.
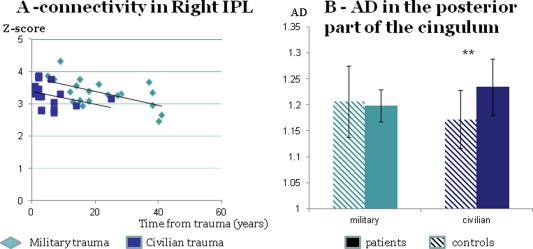
The influence of type of trauma on functional and anatomical measures. Functional connectivity in right IPL can be predicted by type of trauma and time from trauma (A); anatomical connectivity shows an interaction effect of trauma and clinical condition; AD values in the posterior part of the DMN cingulate fibers differ between patients and controls who are survivors of civilian trauma but not for survivors of military trauma (B). [Color figure can be viewed in the online issue, which is available at http://wileyonlinelibrary.com.]
Functional Connectivity: Correlation with Clinical Data
Regression analysis showed that z‐scores in the predefined DMN ROIs together with age predict clinical symptoms. The CAPS scores were significantly predicted (F (5, 13) = 5.185, p < 0.03 corrected); factors that contributed significantly were age (p < 0.0035, t = 3.57) and the right IPL region (p < 0.0011, t = 4.185). The HAM‐A scores were significantly predicted (F (5, 13) = 7.154, p < 0.01 corrected); factors that contributed significantly to the model were age (p < 0.001, t = 4.267), the precuneus (p < 0.04, t = −2.284), the mPFC (p < 0.0073, t = 3.179), and the right IPL (p < 0.0039, t = 3.514). The HAM‐D scores were significantly predicted (F (5, 13) = 3.967, p = 0.063 corrected); factors that contributed significantly to the model were age (p < 0.028, t = 2.485), the precuneus (p < 0.02, t = −2.69), and the right IPL (p < 0.0021, t = 3.837). While age and z‐scores in the right IPL and mPFC positively contributed to the prediction of HAM‐D, the z‐score in the precuneus was negatively related. A similar pattern was found when analyzing the correlations between the time courses in the different regions.
Anatomical Connectivity: Between‐Group Differences
The fibers connecting the mPFC and the precuneus were reconstructed for all patients and control subjects (Fig. 3A). Fibers were identified in the left hemisphere for all subjects and in the right hemisphere for all but two subjects (one patient and one control). Two‐way ANOVA (with repetitions) was used to evaluate the influence of group and hemisphere on diffusion properties. An effect of hemisphere was found only for the MD property (F (17, 1) = 2; p < 0.04 uncorrected) and no effect of group or interaction was identified. As there was no interaction between hemisphere and group, all further analyses were performed on the average of the fibers from both hemispheres.
Figure 3.
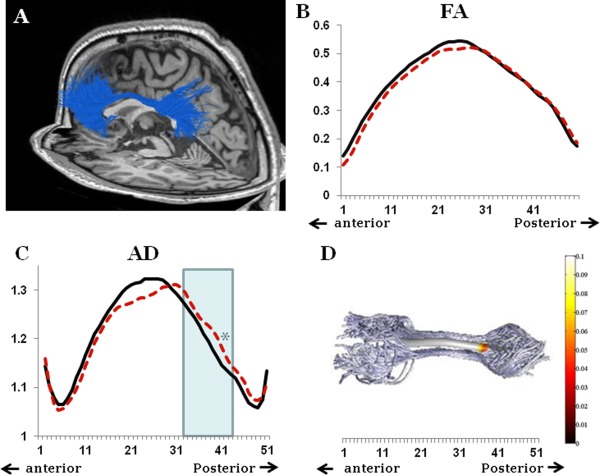
Anatomical connectivity results. The fibers connecting the PFC and the precuneus from one patient are presented on a sagittal and axial background (A). Analysis of the FA along the tract did not show any between‐group differences (B); PTSD patients in dashed red, controls in solid black. Between‐group differences in AD properties were found in a small part of the fiber, that was no longer significant after correction for multiple comparisons (C); PTSD patients in dashed red, controls in solid black. Panel D presents the significance of the between‐group difference along the fiber; values from the posterior third of the fiber are included in the analysis (marked in light blue in C).
Evaluation of the differences between the groups along the pathway failed to identify any differences between the groups (for example, the FA, Fig. 3B). However, a small difference in AD values was evident toward the posterior part of the fiber, but this did not persist after correction for multiple comparisons (p = 0.048 at point 39) (Fig. 3C). Therefore, for further fiber microstructural analysis, we included the average of the diffusion along the whole fiber, in addition to the average of the diffusion properties in the posterior third of the fiber (points 32–43) (Fig. 3D).
No significant difference between patients and control subjects was found in the average of any of the diffusion measures evaluated; the absence of a significant difference was seen in evaluation of the full fiber and when focusing on the posterior third of the fiber.
When performing analysis separately for military and civilian trauma survivors, we identified a significant between‐group difference in AD values in the posterior third of the fiber (Fig. 2B). Although fiber properties were similar for military survivors, irrespective of clinical symptoms (p = 0.76), AD values were significantly higher in survivors of civilian trauma who developed PTSD compared with trauma‐matched controls (t (8) = −5.85, p < 0.002 corrected). A two‐way between‐group ANOVA with repeated measures showed that while no main effect of group (PTSD or controls) or type of trauma was found, there was a significant interaction between factors (F (1,32) = 4.52, p < 0.042). No other significant effect of type of trauma was found.
Anatomical Connectivity: Correlation with Clinical Data
Both FA and RD of the posterior third of the fiber were correlated with CAPS in PTSD patients, with negative and positive correlations identified, respectively (FA: R2 = 0.27, t = −2.51, p < 0.023 uncorrected; RD: R2 = 0.24, t = 2.29, p < 0.035 uncorrected). No other significant correlations were found.
Correlation Between Anatomical and Functional Connectivity
Z‐scores in mPFC were positively correlated with the averaged AD value for the full fiber (R2 = 0.11, t = 2.1, p < 0.044 uncorrected). Further analysis revealed that this effect was driven by patient group (R2 = 0.43, t = 3.6, p < 0.048 corrected), with no significant correlation observed in the control group (R2 < 0.01) (Fig. 4). A similar pattern was seen for the FA (patients: R2 = 0.23, t = 2.24, p < 0.039, uncorrected; controls: R2 < 0.01).
Figure 4.
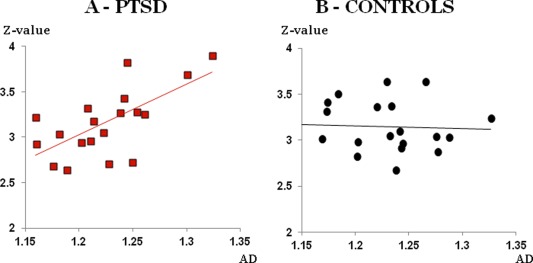
The correlation between functional and anatomical connectivity. Correlation between the z‐scores in the PFC and the AD values in the cingulum were found in PTSD patients (A in red squares) and not in control subjects (B in black circles). [Color figure can be viewed in the online issue, which is available at http://wileyonlinelibrary.com.]
DISCUSSION
Our results demonstrate similar functional and anatomical connectivity patterns in the DMN of PTSD patients and trauma‐exposed control subjects. Both functional and anatomical connectivity parameters were highly correlated with clinical measures. Coupling between the anatomical and functional properties was evident only in the PTSD patient cohort. Type of trauma and time from trauma modified functional connectivity in patients as well as controls, and the effect of PTSD on anatomical connectivity was differently modulated by the type of trauma.
Functional and Anatomical Connectivity Patterns Do Not Differ Between PTSD Patients and Controls
Unlike our hypothesis, we found similar functional connectivity patterns in PTSD and trauma‐exposed controls within the default mode. These findings concur with those of a Chinese earthquake survivors' study, which reported that the impact of trauma on brain activity was independent of PTSD symptom development [Lui et al., 2009]. In contrast, altered connectivity patterns have been described in military veterans with PTSD [Sripada et al., 2012] and in women suffering from early continuous assault [Bluhm et al., 2009; Cisler et al., 2013]. We suggest that these differences may be explained by trauma characteristics; our study included both survivors of military and civilian trauma, while patients exposed to child abuse or sexual assault were not included in this study and the age of exposure, gender, and intensity of the events (single event vs early repeated trauma, etc.) were different from those of women suffering from early continuous sexual assault.
Similar anatomical connectivity measures, as expressed by the cingulum properties, were found for patients and controls. However, when limiting analysis to civilian trauma survivors, a difference between patients and controls was observed for the AD measure in the posterior third of the cingulum. Several other studies reported between‐group differences albeit with contradicting results [Abe et al., 2006; Fani et al., 2012; Kim et al., 2006]. As our results suggest the influence of type of trauma on anatomical connectivity, diversity in results may be partly explained by the differences in types of trauma survivors included in the studies. Moreover the difference between previously reported results and our results may be explained by differences in fiber definitions; while other studies used anatomical measures to define the cingulum bundle and relate to the fibers as a whole, we used individually defined functional regions to specifically reconstruct the fibers connecting the DMN regions, thereby focusing on a subset of the cingulate bundle that is part of the default mode network.
Connectivity Patterns are Related to Clinical Symptoms
While connectivity measures did not differ between patients and controls, coupling between connectivity measures and clinical symptoms was evident, in accordance with our hypothesis. The correlation between PTSD symptom severity and functional connectivity patterns has previously been reported by other groups [Cisler et al., 2013; Lanius et al., 2010a; Qin et al., 2012]. Our results support this correlation and also demonstrate the contribution of anxiety and depression symptoms, a frequent aspect of PTSD phenomenology.
Within the regions of the DMN, only the z‐scores in the right IPL were related to PTSD symptoms. Furthermore, positive correlations with both anxiety and depression scores were evident for the right IPL. The involvement of the right IPL in PTSD was previously demonstrated using several other methods including fMRI during script reading provocation [Lanius et al., 2004], EEG [Metzger et al., 2004], and MEG [Engdahl et al., 2010]; perfusion in this region was found to be correlated with severity of depression symptoms in major depressive disorder patients [Orosz et al., 2012].
The connectivity level of the mPFC was positively related to anxiety. Dysfunction in the mPFC in response to stress and traumatic reminders as part of the pathophysiology of PTSD was suggested in several recent fMRI studies [Bremner et al., 2008; Damsa et al., 2009], in association with fear regulation [Maroun, 2013], control, and suppression of emotional responses in general [Herringa et al., 2013] and contextualization [Liberzon and Sripada, 2008].
The connectivity level of the precuneus, which is considered to be involved in self‐referential activity, was negatively correlated to anxiety and depression symptomatology. The involvement of the precuneus in PTSD was previously demonstrated [Lanius et al., 2004; Shu et al., 2014; Xiong et al., 2013].
The precuneus is considered the central hub of the DMN [Utevsky et al., 2014]. Connectivity between the precuneus and other regions of the DMN may be involved in initiating and maintaining a “resting state” by preventing penetration of intrusive stimuli into consciousness, thus downregulating emotional responses. Therefore, we would expect to find a negative correlation between the connectivity level of this region and behavioral measures.
Our anatomical connectivity results show that the severity of PTSD symptoms is related to increase FA along the cingulum. As increased FA reflects fiber integrity our results show that quality of anatomical connectivity is positively correlated with the strength of PTSD symptoms. This is in contrast with our expectation of finding reduced microstructural integrity reflecting malfunctioning of the DMN in modulating external distractors. This discrepancy may be resolved by an alternative interpretation of the core symptoms of PTSD. We suggest that hypervigilance and intrusive thoughts should be addressed as “resting‐state” constituents, exemplifying introspection and self‐referential thoughts, rather than external, stimulus‐driven distractors.
Coupling Between the Anatomical and Functional Properties is Evident Only in PTSD Patients
A direct correlation between anatomical and functional measures was found only in PTSD patients. A similar result was reported showing a linkage between regional cerebral blood flow (rCBF) in DMN regions and DTI in male veterans with PTSD that was not seen in controls [Schuff et al., 2011]. One possible explanation is that PTSD creates a common manipulating factor that dominates both functional and anatomical connectivity patterns in a diseased brain. In control patients, no such factor exists and therefore there is greater diversity between the different measures.
Trauma Type and Time from Trauma were Found to Modulate Connectivity Patterns
Given that trauma characteristics influence not only clinical symptoms but also brain connectivity, even in healthy controls, our results stress the importance of controlling for trauma type in studying PTSD. Differences in the clinical course between civilian and military trauma were previously suggested to stem from gender bias, state of arousal, anticipation of the occurrence of trauma, the contextual meaning, and differences in community support availability [Jovanovic et al., 2012; Yehuda et al., 2010]. These factors may explain the existing diversity in the PTSD literature regarding brain connectivity patterns.
LIMITATIONS
It should be noted that the resting state of PTSD patients may differ from controls since PTSD is characterized by intrusive thoughts that do not allow “true” rest. Thereby it is unclear whether functional results reflect differences in brain connectivity or differences in performance. However, as similar results were found using anatomical connectivity, we believe that our results reflect inherent altered DMN connectivity patterns.
The relatively high CAPS score of our patient cohort indicates that patients were severely ill. However, as our results show a correlation between brain connectivity and symptom severity, they may be extended to patients with PTSD of milder severity. Our PTSD group included mainly males, but gender was taken into account in the regression analysis.
Finally, in accordance with what has previous been reported in the literature [Lanius et al., 2010b], our cohort mainly included patients who were under medical treatment, thus it was not feasible to ascertain the relative contribution of medication to the results.
CONCLUSIONS
Our study did not detect unique DMN functional and anatomical connectivity patterns characteristic for PTSD patients; nevertheless, strong relationship between clinical symptoms of PTSD and both functional and anatomical connectivity was found. Moreover, distinctive link between anatomical and functional measures was shown in the PTSD patients.
We believe that using both modalities for data acquisition in PTSD is critical to enhance our understanding of the malfunctioning brain networks in this challenging disorder. Our preliminary results regarding the influence of trauma type demonstrate the significant effect of the specific circumstances of the trauma on brain function and contribute to understanding the interactions between different brain components involved in PTSD.
Among mental disorders, PTSD has a unique advantage for studying the interaction between environment and biology. Our findings suggest that further research is needed, studying larger and more homogenous sample groups, in terms of demographics, trauma type, and time from trauma. This will highlight the importance of the environment, i.e., trauma type, on pathophysiology, i.e., connectivity strength in the DMN which allows for self‐reflection and the internal regulation of emotion.
REFERENCES
- Abe O, Yamasue H, Kasai K, Yamada H, Aoki S, Iwanami A, Ohtani T, Masutani Y, Kato N, Ohtomo K (2006): Voxel‐based diffusion tensor analysis reveals aberrant anterior cingulum integrity in posttraumatic stress disorder due to errorism. Psychiatry Res 146:231–242. [DOI] [PubMed] [Google Scholar]
- American Psychiatric Association APADSMTF . 2013. Diagnostic and statistical manual of mental disorders: DSM‐5.
- Biswal B, Yetkin FZ, Haughton VM, Hyde JS (1995): Functional connectivity in the motor cortex of resting human brain using echo‐planar MRI. Magn Reson Med 34:537–541. [DOI] [PubMed] [Google Scholar]
- Blake DD, Weathers FW, Nagy LM, Kaloupek DG, Gusman FD, Charney DS, Keane TM (1995): The development of a clinician‐administered PTSD scale. J Trauma Stress 8:75–90. [DOI] [PubMed] [Google Scholar]
- Bluhm RL, Williamson PC, Osuch EA, Frewen PA, Stevens TK, Boksman K, Neufeld RW, Theberge J, Lanius RA (2009): Alterations in default network connectivity in posttraumatic stress disorder related to early‐life trauma. J Psychiatry Neurosci 34:187–194. [PMC free article] [PubMed] [Google Scholar]
- Bremner JD, Elzinga B, Schmahl C, Vermetten E (2008): Structural and functional plasticity of the human brain in posttraumatic stress disorder. Prog Brain Res 167:171–186. [DOI] [PMC free article] [PubMed] [Google Scholar]
- Broyd SJ, Demanuele C, Debener S, Helps SK, James CJ, Sonuga‐Barke EJ (2009): Default‐mode brain dysfunction in mental disorders: A systematic review. Neurosci Biobehav Rev 33:279–296. [DOI] [PubMed] [Google Scholar]
- Buckner RL, Andrews‐Hanna JR, Schacter DL (2008): The brain's default network: Anatomy, function, and relevance to disease. Ann N Y Acad Sci 1124:1–38. [DOI] [PubMed] [Google Scholar]
- Chen H, Yang Q, Liao W, Gong Q, Shen S (2009): Evaluation of the effective connectivity of supplementary motor areas during motor imagery using Granger causality mapping. Neuroimage 47:1844–1853. [DOI] [PubMed] [Google Scholar]
- Cisler JM, Scott Steele J, Smitherman S, Lenow JK, Kilts CD (2013): Neural processing correlates of assaultive violence exposure and PTSD symptoms during implicit threat processing: A network‐level analysis among adolescent girls. Psychiatry Res 214:238–246. [DOI] [PMC free article] [PubMed] [Google Scholar]
- Damsa C, Kosel M, Moussally J (2009): Current status of brain imaging in anxiety disorders. Curr Opin Psychiatry 22:96–110. [DOI] [PubMed] [Google Scholar]
- Daniels JK, Lamke JP, Gaebler M, Walter H, Scheel M (2013): White matter integrity and its relationship to PTSD and childhood trauma—A systematic review and meta‐analysis. Depress Anxiety 30:207–216. [DOI] [PubMed] [Google Scholar]
- Engdahl B, Leuthold AC, Tan HR, Lewis SM, Winskowski AM, Dikel TN, Georgopoulos AP (2010): Post‐traumatic stress disorder: A right temporal lobe syndrome? J Neural Eng 7:066005. [DOI] [PubMed] [Google Scholar]
- Esposito F, Scarabino T, Hyvarinen A, Himberg J, Formisano E, Comani S, Tedeschi G, Goebel R, Seifritz E, Di Salle F (2005): Independent component analysis of fMRI group studies by self‐organizing clustering. Neuroimage 25:193–205. [DOI] [PubMed] [Google Scholar]
- Fani N, King TZ, Jovanovic T, Glover EM, Bradley B, Choi K, Ely T, Gutman DA, Ressler KJ (2012): White matter integrity in highly traumatized adults with and without post‐traumatic stress disorder. Neuropsychopharmacology 37:2740–2746. [DOI] [PMC free article] [PubMed] [Google Scholar]
- First MB, Spitzer, Robert L, Miriam Gibbon, and Williams, Janet B.W 1996. Structured Clinical Interview for DSM‐IV Axis I Disorders, Clinician Version (SCID‐CV). Washington, D.C: American Psychiatric Press, Inc. [Google Scholar]
- Fox MD, Snyder AZ, Vincent JL, Corbetta M, Van Essen DC, Raichle ME (2005): The human brain is intrinsically organized into dynamic, anticorrelated functional networks. Proc Natl Acad Sci USA 102:9673–9678. [DOI] [PMC free article] [PubMed] [Google Scholar]
- Goebel R, Esposito F, Formisano E (2006): Analysis of functional image analysis contest (FIAC) data with brainvoyager QX: From single‐subject to cortically aligned group general linear model analysis and self‐organizing group independent component analysis. Hum Brain Mapp 27:392–401. [DOI] [PMC free article] [PubMed] [Google Scholar]
- Gonzalez‐Castillo J, Handwerker DA, Robinson ME, Hoy CW, Buchanan LC, Saad ZS, Bandettini PA (2014): The spatial structure of resting state connectivity stability on the scale of minutes. Front Neurosci 8:138 [DOI] [PMC free article] [PubMed] [Google Scholar]
- Greicius MD, Supekar K, Menon V, Dougherty RF (2009): Resting‐state functional connectivity reflects structural connectivity in the default mode network. Cereb Cortex 19:72–78. [DOI] [PMC free article] [PubMed] [Google Scholar]
- Hamilton M (1960): A rating scale for depression. J Neurol Neurosurg Psychiatry 23:56–62. [DOI] [PMC free article] [PubMed] [Google Scholar]
- Herringa R, Phillips M, Almeida J, Insana S, Germain A (2012): Post‐traumatic stress symptoms correlate with smaller subgenual cingulate, caudate, and insula volumes in unmedicated combat veterans. Psychiatry Res 203:139–145. [DOI] [PMC free article] [PubMed] [Google Scholar]
- Herringa RJ, Phillips ML, Fournier JC, Kronhaus DM, Germain A (2013): Childhood and adult trauma both correlate with dorsal anterior cingulate activation to threat in combat veterans. Psychol Med 43:1533–1542. [DOI] [PMC free article] [PubMed] [Google Scholar]
- Hyvarinen A, Oja E (2000): Independent component analysis: Algorithms and applications. Neural Networks 13:411–430. [DOI] [PubMed] [Google Scholar]
- Jovanovic T, Kazama A, Bachevalier J, Davis M (2012): Impaired safety signal learning may be a biomarker of PTSD. Neuropharmacology 62:695–704. [DOI] [PMC free article] [PubMed] [Google Scholar]
- Kim SJ, Jeong DU, Sim ME, Bae SC, Chung A, Kim MJ, Chang KH, Ryu J, Renshaw PF, Lyoo IK (2006): Asymmetrically altered integrity of cingulum bundle in posttraumatic stress disorder. Neuropsychobiology 54:120–125. [DOI] [PubMed] [Google Scholar]
- Lanius RA, Bluhm RL, Coupland NJ, Hegadoren KM, Rowe B, Theberge J, Neufeld RW, Williamson PC, Brimson M (2010a): Default mode network connectivity as a predictor of post‐traumatic stress disorder symptom severity in acutely traumatized subjects. Acta Psychiatr Scand 121:33–40. [DOI] [PubMed] [Google Scholar]
- Lanius RA, Brewin CR, Bremner JD, Daniels JK, Friedman MJ, Liberzon I, McFarlane A, Schnurr PP, Shin L, Stein M, and others. (2010b): Does neuroimaging research examining the pathophysiology of posttraumatic stress disorder require medication‐free patients? J Psychiatry Neurosci 35:80–89. [DOI] [PMC free article] [PubMed] [Google Scholar]
- Lanius RA, Williamson PC, Densmore M, Boksman K, Neufeld RW, Gati JS, Menon RS (2004): The nature of traumatic memories: A 4‐T FMRI functional connectivity analysis. Am J Psychiatry 161:36–44. [DOI] [PubMed] [Google Scholar]
- Liang X, Zebrowitz LA, Aharon I (2009): Effective connectivity between amygdala and orbitofrontal cortex differentiates the perception of facial expressions. Soc Neurosci 4:185–196. [DOI] [PMC free article] [PubMed] [Google Scholar]
- Liberzon I, Sripada CS (2008): The functional neuroanatomy of PTSD: A critical review. Prog Brain Res 167:151–169. [DOI] [PubMed] [Google Scholar]
- Lui S, Huang X, Chen L, Tang H, Zhang T, Li X, Li D, Kuang W, Chan RC, Mechelli A, and others. (2009): High‐field MRI reveals an acute impact on brain function in survivors of the magnitude 8.0 earthquake in China. Proc Natl Acad Sci USA 106:15412–15417. [DOI] [PMC free article] [PubMed] [Google Scholar]
- Maier W, Buller R, Philipp M, Heuser I (1988): The Hamilton Anxiety Scale: Reliability, validity and sensitivity to change in anxiety and depressive disorders. J Affect Disord 14:61–68. [DOI] [PubMed] [Google Scholar]
- Maroun M (2013): Medial prefrontal cortex: Multiple roles in fear and extinction. Neuroscientist 19:370–383. [DOI] [PubMed] [Google Scholar]
- Menon V (2011): Large‐scale brain networks and psychopathology: A unifying triple network model. Trends Cogn Sci 15:483–506. [DOI] [PubMed] [Google Scholar]
- Metzger LJ, Paige SR, Carson MA, Lasko NB, Paulus LA, Pitman RK, Orr SP (2004): PTSD arousal and depression symptoms associated with increased right‐sided parietal EEG asymmetry. J Abnorm Psychol 113:324–329. [DOI] [PubMed] [Google Scholar]
- Naifeh JA, North TC, Davis JL, Reyes G, Logan CA, Elhai JD (2008): Clinical profile differences between PTSD‐diagnosed military veterans and crime victims. J Trauma Dissociation 9:321–334. [DOI] [PubMed] [Google Scholar]
- Orosz A, Jann K, Federspiel A, Horn H, Hofle O, Dierks T, Wiest R, Strik W, Muller T, Walther S (2012): Reduced cerebral blood flow within the default‐mode network and within total gray matter in major depression. Brain Connect 2:303–310. [DOI] [PubMed] [Google Scholar]
- Peterson A, Thome J, Frewen P, Lanius RA (2014): Resting‐state neuroimaging studies: A new way of identifying differences and similarities among the anxiety disorders? Can J Psychiatry 59:294–300. [DOI] [PMC free article] [PubMed] [Google Scholar]
- Qin LD, Wang Z, Sun YW, Wan JQ, Su SS, Zhou Y, Xu JR (2012): A preliminary study of alterations in default network connectivity in post‐traumatic stress disorder patients following recent trauma. Brain Res 1484:50–56. [DOI] [PubMed] [Google Scholar]
- Raichle ME, MacLeod AM, Snyder AZ, Powers WJ, Gusnard DA, Shulman GL (2001): A default mode of brain function. Proc Natl Acad Sci USA 98:676–682. [DOI] [PMC free article] [PubMed] [Google Scholar]
- Sanjuan PM, Thoma R, Claus ED, Mays N, Caprihan A (2013): Reduced white matter integrity in the cingulum and anterior corona radiata in posttraumatic stress disorder in male combat veterans: A diffusion tensor imaging study. Psychiatry Res 214:260–268. [DOI] [PMC free article] [PubMed] [Google Scholar]
- Schuff N, Zhang Y, Zhan W, Lenoci M, Ching C, Boreta L, Mueller SG, Wang Z, Marmar CR, Weiner MW, and others. (2011): Patterns of altered cortical perfusion and diminished subcortical integrity in posttraumatic stress disorder: An MRI study. Neuroimage 54: S62–S68. [DOI] [PMC free article] [PubMed] [Google Scholar]
- Sherbondy AJ, Dougherty RF, Ben‐Shachar M, Napel S, Wandell BA (2008): ConTrack: Finding the most likely pathways between brain regions using diffusion tractography. J Vis 8:15 1–16. [DOI] [PMC free article] [PubMed] [Google Scholar]
- Shu IW, Onton JA, Prabhakar N, O'Connell RM, Simmons AN, Matthews SC (2014): Combat veterans with PTSD after mild TBI exhibit greater ERPs from posterior‐medial cortical areas while appraising facial features. J Affect Disord 155:234–240. [DOI] [PubMed] [Google Scholar]
- Sripada RK, King AP, Welsh RC, Garfinkel SN, Wang X, Sripada CS, Liberzon I (2012): Neural dysregulation in posttraumatic stress disorder: Evidence for disrupted equilibrium between salience and default mode brain networks. Psychosom Med 74:904–911. [DOI] [PMC free article] [PubMed] [Google Scholar]
- Talairach J, Tournoux P. 1988. Co‐planar Stereotaxic Atlas of the Human Brain. New York: Thieme. [Google Scholar]
- Tursich M, Ros T, Frewen PA, Kluetsch RC, Calhoun VD, Lanius RA (2015): Distinct intrinsic network connectivity patterns of post‐traumatic stress disorder symptom clusters. Acta Psychiatr Scand 132:29–38. [DOI] [PubMed] [Google Scholar]
- Utevsky AV, Smith DV, Huettel SA (2014): Precuneus is a functional core of the default‐mode network. J Neurosci 34:932–940. [DOI] [PMC free article] [PubMed] [Google Scholar]
- van de Ven VG, Formisano E, Prvulovic D, Roeder CH, Linden DE (2004): Functional connectivity as revealed by spatial independent component analysis of fMRI measurements during rest. Hum Brain Mapp 22:165–178. [DOI] [PMC free article] [PubMed] [Google Scholar]
- Weissman‐Fogel I, Moayedi M, Taylor KS, Pope G, Davis KD (2010): Cognitive and default‐mode resting state networks: Do male and female brains “rest” differently? Hum Brain Mapp 31:1713–1726. [DOI] [PMC free article] [PubMed] [Google Scholar]
- Whitfield‐Gabrieli S, Ford JM (2012): Default mode network activity and connectivity in psychopathology. Annu Rev Clin Psychol 8:49–76. [DOI] [PubMed] [Google Scholar]
- Xiong K, Zhang Y, Qiu M, Zhang J, Sang L, Wang L, Xie B, Wang J, Li M (2013): Negative emotion regulation in patients with posttraumatic stress disorder. PLoS One 8:e81957. [DOI] [PMC free article] [PubMed] [Google Scholar]
- Yeatman JD, Dougherty RF, Myall NJ, Wandell BA, Feldman HM (2012): Tract profiles of white matter properties: Automating fiber‐tract quantification. PLoS One 7:e49790 [DOI] [PMC free article] [PubMed] [Google Scholar]
- Yehuda R (2002): Post‐traumatic stress disorder. N Engl J Med 346:108–114. [DOI] [PubMed] [Google Scholar]
- Yehuda R, Bierer LM, Pratchett LC, Pelcovitz M (2010): Using biological markers to inform a clinically meaningful treatment response. Ann N Y Acad Sci 1208:158–163. [DOI] [PubMed] [Google Scholar]