

Abstract
Cognitive impairment in patients with Alzheimer's disease (AD) is associated with reduction in hippocampal volume in magnetic resonance imaging (MRI). However, it is unknown whether hippocampal texture changes in persons with mild cognitive impairment (MCI) that does not have a change in hippocampal volume. We tested the hypothesis that hippocampal texture has association to early cognitive loss beyond that of volumetric changes. The texture marker was trained and evaluated using T1‐weighted MRI scans from the Alzheimer's Disease Neuroimaging Initiative (ADNI) database, and subsequently applied to score independent data sets from the Australian Imaging, Biomarker & Lifestyle Flagship Study of Ageing (AIBL) and the Metropolit 1953 Danish Male Birth Cohort (Metropolit). Hippocampal texture was superior to volume reduction as predictor of MCI‐to‐AD conversion in ADNI (area under the receiver operating characteristic curve [AUC] 0.74 vs 0.67; DeLong test, p = 0.005), and provided even better prognostic results in AIBL (AUC 0.83). Hippocampal texture, but not volume, correlated with Addenbrooke's cognitive examination score (Pearson correlation, r = −0.25, p < 0.001) in the Metropolit cohort. The hippocampal texture marker correlated with hippocampal glucose metabolism as indicated by fluorodeoxyglucose‐positron emission tomography (Pearson correlation, r = −0.57, p < 0.001). Texture statistics remained significant after adjustment for volume in all cases, and the combination of texture and volume did not improve diagnostic or prognostic AUCs significantly. Our study highlights the presence of hippocampal texture abnormalities in MCI, and the possibility that texture may serve as a prognostic neuroimaging biomarker of early cognitive impairment. Hum Brain Mapp 37:1148–1161, 2016. © 2015 Wiley Periodicals, Inc.
Keywords: biomarker, classification, early diagnosis, hippocampus, image analysis, machine learning, magnetic resonance imaging, mild cognitive impairment
INTRODUCTION
The major hallmarks of Alzheimer's disease (AD) include early stage, small‐scale alterations in the brain in terms of neurofibrillary tangles (NFTs), and amyloid‐β (Aβ) plaque deposition [Braak and Braak, 1997], as well as later stage, large‐scale alterations of the brain in terms of localized atrophies in structures such as the hippocampus [Bobinski et al., 1995] and eventually whole brain atrophy. NFTs and Aβ plaques are not directly detectable at the current resolution of clinical magnetic resonance imaging (MRI). However, localized areas of atrophy are detectable in MRI images [Bobinski et al., 2000; Tanabe et al., 1997], and considerable effort has been applied to developing and validating MRI‐based AD biomarkers using this information [Ramani et al., 2006]. The hippocampus is often considered the primary region of interest (ROI) because it is affected early in the AD pathological process and is also generally severely affected [Braak and Braak, 1997; West et al., 1994]. MRI‐based biomarkers of AD that target hippocampal atrophy include static hippocampal volume, change of hippocampal volume over a given time frame (often termed atrophy rate), and shape of the hippocampus. All these marker types have demonstrated both diagnostic [Convit et al., 1997; Fox and Freeborough, 1997; Gerardin et al., 2009] and prognostic capabilities in AD [Achterberg et al., 2014; Costafreda et al., 2011; Devanand et al., 2007; Henneman et al., 2009; Jack et al., 1999, 2005].
Although individual NFTs and Aβ plaques cannot be detected at the resolution of current clinical MRI, it is our working hypothesis that the accumulated effect of these phenomena on the MRI image is detectable prior to atrophy as changes in the statistical properties of the image intensities. These changes may form certain textural patterns in the MRI images [Castellano et al., 2004], and texture analysis [Tuceryan and Jain, 1998] may therefore be suitable for capturing this information. Texture analysis has previously been successfully applied to produce imaging biomarkers of AD [Chincarini et al., 2011; Freeborough and Fox, 1998; Zhang et al., 2011] as well as other diseases, including osteoarthritis [Marques et al., 2012] and multiple sclerosis [Zhang et al., 2008] in MRI, chronic obstructive pulmonary disease in computed tomography (CT) [Sørensen et al., 2012], breast cancer in mammography [Nielsen et al., 2011], and tuberculosis and interstitial diseases in chest radiography [van Ginneken et al., 2002]. The ability to detect dementia‐specific textural patterns in the brain tissue and to discriminate these from the texture of normal healthy brain tissue may provide a valuable and complementary MRI‐based biomarker of the disease. Moreover, it is likely that an MRI marker based on texture will be able to detect earlier stages of AD than markers that target larger scale changes in the brain, such as atrophy.
In this study, we specifically investigated hippocampal texture as an MRI‐based biomarker of AD and focused on early detection. This is different from previous texture studies that all focused on diagnosis or used more global, nonanatomically restricted information. Our goals were to determine if MRI hippocampal texture predicts conversion from mild cognitive impairment (MCI) to AD, if texture can detect early cognitive decline in a clinically healthy population, and if texture reflects changes in hippocampal glucose metabolism in fluorodeoxyglucose‐positron emission tomography (FDG‐PET). In addition, we wanted to test if these properties persisted after adjustment for hippocampal volume, i.e., whether texture carried additional information.
MATERIALS AND METHODS
Data
Data used in the preparation of this article was obtained from three different cohorts: ADNI, AIBL, and Metropolit.
ADNI data
This dataset was obtained from the ADNI database (adni.loni.usc.edu). The ADNI was launched in 2003 by the National Institute on Aging, the National Institute of Biomedical Imaging and Bioengineering, the Food and Drug Administration, private pharmaceutical companies, and nonprofit organizations, as a $60 million, 5‐year, public–private partnership. The primary goal of ADNI has been to test whether serial MRI, positron emission tomography (PET), biological markers, and clinical and neuropsychological assessments can be combined to measure the progression of MCI and early AD. Determination of sensitive and specific markers of very early AD progression is intended to aid researchers and clinicians to develop new treatments and monitor their effectiveness, as well as to lessen the time and cost of clinical trials. ADNI is the result of efforts of many coinvestigators from a broad range of academic institutions and private corporations, and subjects have been recruited from over 50 sites across the U.S. and Canada. For up‐to‐date information, see http://www.adni-info.org/. Raw unprocessed MRI images were downloaded from the ADNI website between February 1 and November 11, 2012.
We used the “complete annual year 2 visits” 1.5T dataset from the collection of standardized datasets released by ADNI [Wyman et al., 2013]. The dataset definition was downloaded from the ADNI website (http://www.adni.loni.usc.edu/methods/mri-analysis/adni-standardized-data/) on September 28, 2012. The dataset comprises 504 subjects with one associated 1.5T T1‐weighted MRI image out of the two possible from the back‐to‐back scanning protocol in ADNI [Jack et al., 2008] at baseline, 12‐month follow‐up, and 24‐month follow‐up. Three datasets were defined from the standardized ADNI dataset as illustrated in Supporting Information, Figure 1: one for evaluating diagnostic capabilities, and two datasets for evaluating prognostic capabilities considering a 12‐month and a 24‐month time frame, respectively. The diagnosis dataset was defined based on the clinical baseline diagnosis from ADNI and comprised 169 normal control (CTRL) subjects, 233 MCI subjects, and 101 AD patients. Prognosis was defined as discriminating between subjects that converted from MCI at baseline to AD within a given time frame versus baseline MCI subjects that did not convert within the same time frame. Subjects reverting to CTRL from MCI within the same time frame were kept in the dataset. Baseline demographics and clinical parameters for the diagnosis dataset and the prognosis datasets are shown in Table 1.
Table 1.
Demographics and clinical parameters for the three cohorts: ADNI, AIBL, and Metropolit
| N | Age, mean ± SD | Sex, % male | MMSE, mean ± SD | ACE, mean ± SD | |
|---|---|---|---|---|---|
| ADNI | |||||
| Diagnosis dataset | |||||
| CTRL | 169 | 76.0 ± 5.1 | 50.9d | 29.2 ± 1.0d,e | |
| AD | 101 | 75.3 ± 7.4 | 50.5e | 23.2 ± 1.9d,f | |
| MCI | 233a | 74.8 ± 7.0 | 66.5e,f | 27.1 ± 1.7e,f | |
| Prognosis datasetsa | |||||
| MCI‐NC12 | 192 | 74.9 ± 7.1 | 66.7 | 27.2 ± 1.7f | |
| MCI‐C12 | 41 | 74.3 ± 6.8 | 65.9 | 26.5 ± 1.8f | |
| MCI‐NC24 | 140 | 74.8 ± 6.9 | 67.1 | 27.5 ± 1.7f | |
| MCI‐C24 | 93 | 74.9 ± 7.3 | 65.6 | 26.6 ± 1.7f | |
| FDG‐PET subset | |||||
| CTRL | 62 | 75.9 ± 5.0 | 59.7 | 29.1 ± 1.0d,e | |
| AD | 52 | 75.7 ± 6.5 | 53.9 | 23.3 ± 2.1d,f | |
| MCI | 101 | 75.5 ± 6.9 | 69.3 | 27.1 ± 1.6e,f | |
| Diagnosis CSF subset | |||||
| CTRL | 90 | 75.5 ± 5.1 | 50.0d | 29.1 ± 1.0d,e | |
| AD | 60 | 74.9 ± 7.7 | 55.0 | 23.3 ± 1.9d,f | |
| MCI | 127 | 74.5 ± 7.4 | 69.3d | 26.9 ± 1.8e,f | |
| Prognosis CSF subset | |||||
| MCI‐NC12 | 102 | 74.8 ± 7.4 | 69.6 | 27.1 ± 1.7 | |
| MCI‐C12 | 25 | 73.4 ± 7.2 | 68.0 | 26.4 ± 2.0 | |
| MCI‐NC24 | 78 | 74.1 ± 7.2 | 67.9 | 27.2 ± 1.7f | |
| MCI‐C24 | 49 | 75.1 ± 7.7 | 71.4 | 26.5 ± 1.9f | |
| AIBL b | |||||
| Diagnosis dataset | |||||
| CTRL | 88 | 75.2 ± 7.2 | 47.7 | 28.9 ± 1.3d,e | |
| AD | 28 | 73.6 ± 8.1e | 35.7 | 21.2 ± 5.6d,f | |
| MCI | 25 | 78.3 ± 7.0e | 56.0 | 27.0 ± 2.0e,f | |
| Prognosis datasets | |||||
| MCI‐NC18 | 17 | 77.1 ± 6.7 | 52.9 | 27.6 ± 1.6f | |
| MCI‐C18 | 8 | 80.7 ± 7.6 | 62.5 | 25.6 ± 2.0 | |
| Metropolit | |||||
| CTRL | 95 | 58.4 ± 0.6 | 100.0 | 29.5 ± 0.8g | 96.0 ± 3.2g |
| CL | 96c | 58.6 ± 0.7 | 100.0 | 29.2 ± 1.0g | 92.1 ± 5.0g |
Key: ACE, Addenbrooke's cognitive examination; AD, Alzheimer's disease; ADNI, The Alzheimer's Disease Neuroimaging Initiative; AIBL, The Australian Imaging, Biomarker & Lifestyle Flagship Study of Ageing; CL; cognitive loss; CSF, cerebrospinal fluid; CTRL, normal control; MCI, mild cognitive impairment; MCI‐Cn, month n MCI‐to‐AD converter; MCI‐NCn, month n MCI nonconverter; MMSE, mini‐mental state examination.
Baseline data is reported for ADNI and AIBL, whereas follow‐up data is reported for Metropolit. Differences were tested at a p < 0.05 significance threshold using Student's t‐test except when comparing sex, where a χ 2 test was used.
One MCI excluded; missing month 24 diagnosis.
Four MCIs excluded; missing month 18 diagnosis.
One observation from the CL group excluded; missing ACE measurement.
CTRL differ from AD patients.
CTRL differ from subjects with MCI.
Subjects with MCI differ from AD patients.
Nonconverters differ from converters.
CTRL differ from subjects with CL.
ADNI CSF subset
An additional cerebrospinal fluid (CSF) amyloid subset was defined by selecting the 281 subjects in the “complete annual year 2 visits” 1.5T standardized ADNI dataset that had an associated baseline CSF measurement of Aβ 1–42 peptide (Aβ1–42) and of total tau (t‐tau) available from the Center for Neurodegenerative Disease Research, University of Pennsylvania School of Medicine, Philadelphia [Shaw et al., 2009] (Table 1). We used log(t‐tau/Aβ1–42) as a CSF biomarker [Vemuri et al., 2009] alongside the MRI biomarkers. The CSF measurements were downloaded directly from the ADNI website on July 18, 2014.
ADNI FDG‐PET subset
An additional FDG‐PET ADNI subset was defined by selecting the subjects in the “complete annual year 2 visits” 1.5T standardized ADNI dataset that had an associated baseline FDG‐PET measurement of hippocampus metabolic rate of glucose available from the Center for Brain Health, NYU School of Medicine, New York [Li et al., 2008; Mosconi et al., 2005]. We further required a maximum of 60 days between MRI and FDG‐PET scans, which resulted in a total of 215 subjects (Table 1). The associated left and right pons‐normalized hippocampal metabolic rates of glucose (μmol/100 g/min) were downloaded directly from the ADNI website on January 27, 2015 and subsequently averaged to obtain a single hippocampal FDG‐PET score.
AIBL data
This dataset was obtained from the AIBL imaging arm available via the ADNI website. The data was collected by the AIBL study group. AIBL study methodology has been reported previously [Ellis et al., 2009]. A total of 141 3T T1‐weighted baseline structural MRI images from 141 different subjects were downloaded between September 27 and September 30, 2013. Version 3.1.3 of the associated clinical data was used. AIBL adopted the MRI protocol of ADNI, and neuropsychological tests were designed to permit comparison and pooling with ADNI [Ellis et al., 2010]. A diagnosis dataset and a prognosis dataset were defined similarly to the way the corresponding ADNI datasets were defined; however, the prognosis dataset considered an 18‐month time frame because AIBL performed follow‐up every 18 months in contrast to the 12‐month intervals in the standardized ADNI dataset. Baseline demographics and clinical parameters for the two datasets are shown in Table 1.
Metropolit data
Metropolit [Osler et al., 2013, 2006] includes all boys born in 1953 in the Copenhagen metropolitan area. The subjects underwent cognitive assessment at the conscript board examination at approximately 20 years of age, and again in 2009–2010 as a part of the Copenhagen Aging and Midlife Biobank (CAMB) at approximately 56 years of age. A subset was selected comprising subjects that, according to a regression analysis, exhibited either an increased or a decreased cognitive performance from year 20 to year 56 relative to the entire population of 1985 subjects that participated in both tests. The subjects with increased cognitive performance acted as the control group. Detailed selection criteria are described in Hansen et al. [2014]. The included subjects were neuropsychologically tested at approximately 58 years of age and a 3T T1‐weighted structural MRI scan was acquired (MP‐RAGE; TI, 700 ms; TR, 6.9 ms; flip angle, 9°; 137 sagittal slices; 1.1 × 1.1 × 1.1 mm3 voxels). The demographics and clinical parameters for the dataset are shown in Table 1.
MRI Analysis
Preprocessing and hippocampus segmentation
The MRI scans were preprocessed and the hippocampi segmented with the freely available FreeSurfer software package (version 5.1.0) [Fischl et al., 2002] using the cross‐sectional pipeline with default parameters. The original MRI image resolution of [0.94, 1.35] × [0.94, 1.35] × 1.2 mm3 in ADNI, 1 × 1 × 1.2 mm3 in AIBL, and 1.1 × 1.1 × 1.1 mm3 in Metropolit was conformed to a 1.0 × 1.0 × 1.0 mm3 resolution, and all MRIs were bias field corrected. The bias field correction in FreeSurfer utilizes the nonparametric nonuniform intensity normalization algorithm [Sled et al., 1998], often referred to as N3.
Hippocampal volume
The hippocampal volume was computed from the raw FreeSurfer hippocampus segmentations as the bilateral hippocampal volume divided by the intracranial volume (ICV) [Sanfilipo et al., 2004]. The ICV was estimated as a part of the static FreeSurfer pipeline using a method described in Buckner et al. [2004].
Hippocampal texture
A bilateral hippocampal texture score was computed by combining a texture descriptor that has previously been successfully applied in lung CT [Sørensen et al., 2012] and a support vector machine (SVM) [Cortes and Vapnik, 1995].
Texture descriptor
The texture within the hippocampi was represented by a number of filter response histograms of a three‐dimensional, rotation‐invariant, multiscale, Gaussian derivative‐based filter bank [Lindeberg, 2009]. The histograms were computed using filter responses from both hippocampi collectively. These histograms could capture different microstructural properties within the hippocampal tissue, such as the amount of steep intensity transitions and “blob”‐like structures. The descriptor was adapted to our problem and therefore deviated from Sørensen et al. [2012] in four ways.
The following scales were used: 0.6, 0.85, 1.2, and 1.7 mm. The upper end of the scale range was determined by visual inspection of Gaussian smoothed images. The structures in the hippocampus visually vanished at scales exceeding 1.7 mm.
Derivatives at the different scales were computed by convolution with the corresponding derivative filter instead of convolution with a Gaussian followed by finite differencing for improved numerical accuracy.
Based on the size of the smallest morphologically cleaned bilateral hippocampal segmentation in the ADNI dataset, we quantized the filter responses into nine histogram bins.
The Gaussian filter was excluded in order to be invariant to the lack of a standard image intensity scale in MRI [Nyúl and Udupa, 1999]. This exclusion left the following seven base filters measuring different aspects of the local image structure: the absolute largest eigenvalue of the Hessian matrix λ1(x;σ), where x=[x,y,z]T is a voxel (i.e., a position within the MRI image) and σ is the scale; the absolute second largest eigenvalue of the Hessian matrix λ2(x;σ); the absolute smallest eigenvalue of the Hessian matrix λ3(x;σ); gradient magnitude where Ix,σ denotes the partial first‐order derivative of MRI image I w.r.t. x at scale σ; the Laplacian of the Gaussian ; Gaussian curvature ; and the Frobenius norm of the Hessian .
All these filters are based on intensity derivatives, and the method is therefore invariant to locally constant intensity offsets (e.g., caused by smooth intensity bias fields or imperfections in bias field correction). For each filter at each scale (e.g., ), a filter response histogram was computed (e.g., ). The final hippocampal texture descriptor was obtained by normalizing each filter response histogram to sum to one and concatenating the normalized filter response histograms ( ). The descriptor was applied to the conformed MRI scans, and since the FreeSurfer conformation and the filtering are both linear processes, their combination is mathematically equivalent to one linear process. The reader is referred to the Supporting Information text for additional details about the descriptor.
A segmentation of the hippocampi was needed to define the ROI in which texture was characterized. In principle, any proper segmentation algorithm or manual delineation could be used for this purpose. In this study, the hippocampi were automatically segmented using FreeSurfer as described previously. The FreeSurfer segmentation was postprocessed by removing the surface using morphological erosion with a spherical structuring element of radius 1 mm (corresponding to 1 voxel because of the isotropic 1 mm3 representation of the data). This was done to remove noise from the segmentation boundary and to ensure that texture was measured in the interior of the hippocampus only. The average uncleaned bilateral hippocampal volume in the ADNI diagnosis dataset was 6464.8 mm3, and the average morphologically peeled counterpart was 3118.6 mm3.
Texture classifier
The bilateral hippocampi were classified based on their textural representation (i.e., the concatenated filter response histograms) using a soft‐margin SVM with a radial Gaussian kernel. The real‐valued SVM decision function was interpreted as a single texture score. Its sign indicates whether the SVM classifies an input as patient (+) or control (−), and its amount is proportional to the distance from the decision boundary that separates the two classes (in the kernel‐induced feature space). The hyperparameters of the SVM were determined using grid search considering the area under the receiver operating characteristic curve (AUC) for separating CTRL and AD as performance criterion, where the AUC was estimated by 20‐fold cross‐validation on the current training data. The reader is referred to the Supporting Information text for additional details about the classifier. We employed the open‐source C++ machine learning library Shark [Igel et al., 2008] for learning and classification.
Texture scoring of the data
In the diagnostic ADNI experiment, the CTRL and AD subjects in the ADNI diagnosis dataset were texture scored using an outer 10‐fold cross‐validation. The ADNI diagnosis dataset was split into 10 disjoint subsets stratified by groups (CTRL and AD). In each fold, an SVM was built to separate between CTRL and AD in the training set using the procedure described above (i.e., we repeated the 20‐fold cross‐validation for model selection ten times), and it was subsequently applied to score all cases in the held out test set. This provided a texture score for each subject in the diagnosis dataset (the folds and scores are available as Supporting Information Dataset 1).
In the prognostic ADNI experiment, the MCI texture scores (available as Supporting Information Dataset 2) were obtained using a single SVM built to separate all CTRL and AD subjects in the ADNI diagnosis dataset. The hyperparameters of the SVM were determined using 20‐fold cross‐validation on the training data as described previously. The same SVM was also used to score the complete AIBL dataset (available as Supporting Information Dataset 3) and the complete Metropolit dataset.
Statistical Analysis
Texture and volume were inspected for Gaussianity, and a log transformation was considered but refused. Log volume had a linear relationship with texture (Supporting Information, Fig. 2) and was used when texture was adjusted for volume and in the combination of texture and volume.
The MRI biomarkers (texture and volume) were adjusted simultaneously for age and sex in all reported results unless otherwise stated, and the adjustment was performed using decorrelation as described in the Supporting Information text. When texture was adjusted for log volume or MMSE, we adjusted for age and sex in addition.
Because texture is computed within an ROI, the ROI volume is automatically available as well. We therefore also combined texture and log volume using logistic regression in order to inspect the potential combined value of the two MRI biomarkers. The combination model included raw MRI biomarker scores as well as age and gender as covariates, and the model parameters were estimated using the ADNI diagnosis dataset. The reader is referred to the Supporting Information text for further details.
The diagnostic and prognostic capabilities of hippocampal texture were evaluated using receiver operating characteristic (ROC) curves with the corresponding area under the ROC curve (AUC) as performance measure. Significance of an AUC was determined using a DeLong, DeLong, and Clarke–Pearson's test [DeLong et al., 1988], comparing the ROC curve to the curve obtained using random guessing (a straight line). Texture and volume ROC curves were also compared using the same test.
RESULTS
Combination of Texture and Volume
As can be seen in Supporting Information, Table I, texture, volume, and age all contributed in the logistic regression model fitted using the ADNI diagnosis dataset, whereas sex was insignificant. The negative coefficient for age may be attributed to the relative older CTRL group compared to the AD group in the ADNI diagnosis dataset.
Diagnosis of AD
We first inspected the diagnostic capabilities of hippocampal texture on ADNI data. The obtained texture scores are summarized in Figure 1A, and examples of hippocampi of varying sizes with a negative texture score (indicating CTRL) and a positive texture score (indicating AD) are illustrated in Figure 2. Texture achieved an AUC of 0.912 (p < 0.001) in discriminating CTRL from AD and an AUC of 0.764 (p < 0.001) in discriminating CTRL from MCI. The corresponding ROC curves are shown in Figure 1C. In comparison, volume achieved AUCs of 0.909 (p < 0.001) and 0.784 (p < 0.001), respectively, which did not differ significantly from the texture AUCs according to a DeLong, DeLong, and Clarke–Pearson's test comparing the two ROC curves. Texture maintained significant CTRL vs AD and CTRL vs MCI discriminations (p < 0.001 and p = 0.010) after volume was removed from the texture signal using decorrelation. Finally, combining texture and volume using logistic regression produced AUCs of 0.915 (p < 0.001) and 0.806 (p < 0.001). The combined texture and volume AUC for CTRL vs MCI was significantly different from the texture AUC according to a DeLong, DeLong, and Clarke–Pearson's test (p < 0.001). We also inspected the combined diagnostic performance of MRI (texture and volume) and CSF (log(t‐tau/Aβ1–42)) using the ADNI CSF subset. The combination of texture and volume using logistic regression resulted in slightly larger AUCs compared to the ones previously estimated using the full standardized ADNI dataset, 0.919 (p < 0.001) for CTRL vs AD and 0.827 (p < 0.001) for CTRL vs MCI. Adding CSF to the logistic regression model resulted in an insignificant increase of both AUCs to 0.932 (p < 0.001) and 0.841 (p < 0.001), respectively.
Figure 1.
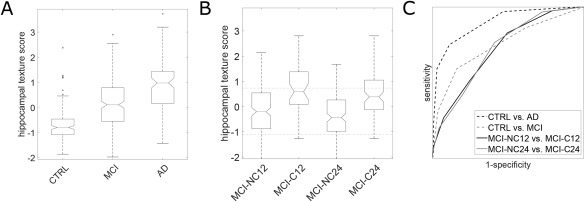
Diagnostic and prognostic ADNI results. (A) Box plots of the hippocampal texture scores for the diagnostic groups. The central line marks the median; the lower and upper edges of the box mark the 25th percentile (q1) and the 75th percentile (q3), respectively; the notch marks the 95% confidence interval of the median as ±1.57 (q3 − q1)/n ½, where n is the number of observations; the whiskers mark the most extreme inlier data points; and the circles mark outliers defined as >q3 + 1.5 (q3 − q1) or <q1 − 1.5 (q3 − q1). (B) Box plots of the hippocampal texture scores for the prognostic groups. The upper and lower dashed horizontal lines mark the median hippocampal texture score of the AD and CTRL group, respectively. (C) ROC curves for AD diagnosis and AD prognosis. The AUCs are (p‐values according to a DeLong, DeLong, and Clarke–Pearson's test in parentheses): CTRL vs AD 0.912 (p < 0.001), CTRL vs MCI 0.764 (p < 0.001), MCI‐NC12 vs MCI‐C12 0.740 (p < 0.001), MCI‐NC24 vs MCI‐C24 0.742 (p < 0.001).
Figure 2.
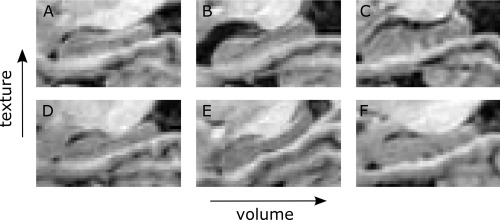
Illustration of hippocampi with a negative texture score (indicating CTRL) versus hippocampi with a positive texture score (indicating AD) for different absolute hippocampus volumes. (A) AD with small volume and positive texture score. (B) AD with medium volume and positive texture score. (C) AD with large volume and positive texture score. (D) CTRL with small volume and negative texture score. (E) CTRL with medium volume and negative texture score. (F) CTRL with large volume and negative texture score.
Prognosis of AD
A central part of our study was to test whether hippocampal texture could predict conversion from MCI to AD and whether it was capable of this independent of volume. The obtained texture scores for the ADNI MCI subjects are summarized in Figure 1B; subjects were grouped according to AD conversion within 12 and 24 months, respectively. The prognostic capabilities (discrimination between nonconverters and converters) of the texture‐based marker were evaluated using ROC curves (Fig. 1C), and the corresponding AUCs are shown in Table 2. Both the texture and the combination AUC differed significantly from the volume AUC for conversion within 24 months (p = 0.005 and p = 0.002), but not for conversion within 12 months. Texture maintained significant prognostic performance after adjustment for volume using decorrelation (p = 0.003 and p < 0.001). In addition, texture was adjusted for baseline mini‐mental state examination (MMSE) score because this quantity differed significantly among the prognostic groups (Table 1), and we found that the prognostic AUCs remained significant (p < 0.001). Note that in the prognosis experiment, conversion to AD was defined based on follow‐up clinical diagnosis, which is partly based on follow‐up MMSE score, for which we did not adjust. Combining CSF and MRI biomarkers using logistic regression resulted in an insignificant decrease of month 12 conversion AUC and an insignificant increase of month 24 conversion AUC (Table 2).
Table 2.
Prognostic (MCI‐to‐AD conversion) AUCs in the ADNI and AIBL cohort
| MRI biomarker | ADNI | ADNI CSF amyloid subset | AIBL | ||
|---|---|---|---|---|---|
| 12 months | 24 months | 12 months | 24 months | 18 months | |
| Texture | 0.740*** | 0.742*** | 0.735*** | 0.730*** | 0.831** |
| Volume | 0.705*** | 0.672*** | 0.667* | 0.645** | 0.662NS |
| Texture + volume | 0.739*** | 0.720*** | 0.731*** | 0.719*** | 0.809* |
| Texture + volume + CSFa | 0.717*** | 0.752*** | |||
Key: AD, Alzheimer's disease; ADNI, The Alzheimer's Disease Neuroimaging Initiative; AIBL, The Australian Imaging, Biomarker & Lifestyle Flagship Study of Ageing; AUC, area under the receiver operating characteristic curve; CSF, cerebrospinal fluid; MCI, mild cognitive impairment; MRI, magnetic resonance imaging.
NS, not significant; *p < 0.05; **p < 0.01; ***p < 0.001.
CSF is log(total tau/Aβ 1–42 peptide).
Correlation with General Cognition
The age‐ and sex‐adjusted texture and volume were plotted against MMSE in the ADNI cohort (Fig. 3), and the corresponding Pearson correlation coefficients are shown in Table 3. Texture maintained significant correlation with MMSE when adjusted for volume using decorrelation (p < 0.001).
Figure 3.
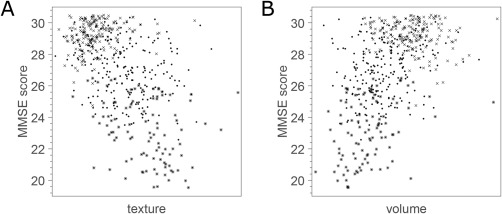
Scatter plots of MRI biomarkers vs MMSE score in the ADNI cohort. Crosses correspond to CTRL, dots correspond to MCI, and asterisks correspond to AD. (A) Hippocampal texture. (B) Hippocampal volume. Note that uniform random noise in the range of −0.5 to 0.5 was added to each MMSE score for better visualization.
Table 3.
Pearson correlation with general cognition in the ADNI, AIBL, and Metropolit cohort
| MRI biomarker | ADNI | AIBL | Metropolit | |
|---|---|---|---|---|
| MMSE | MMSE | MMSE | ACE | |
| Texture | −0.54*** | −0.56*** | −0.21** | −0.25*** |
| Volume | 0.51*** | 0.56*** | 0.17* | 0.02NS |
| Texture + volume | −0.56*** | −0.62*** | −0.26*** | −0.14NS |
Key: ACE, Addenbrooke's cognitive examination; AD, Alzheimer's disease; ADNI, The Alzheimer's Disease Neuroimaging Initiative; AIBL, The Australian Imaging Biomarkers and Lifestyle flagship study of ageing; CTRL, normal control; MCI, mild cognitive impairment; MMSE, mini‐mental state examination; MRI, magnetic resonance imaging.
NS, not significant; *p < 0.05; **p < 0.01; ***p < 0.001.
Generalization to an Independent Cohort
The texture marker trained on all CTRL and AD subjects in the ADNI dataset (i.e., the same marker as was used to score the MCI subjects in the prognostic ADNI experiment) was applied to score the imaging arm of AIBL in order to inspect generalizability to an independent cohort. The ADNI diagnostic results were reproduced with AUCs of 0.951 and 0.742 for CTRL vs AD and CTRL vs MCI, respectively. The diagnostic results were also reproduced with an increased AUC compared with the ones obtained using ADNI data (Table 2). Diagnostic and prognostic texture results remained significant after decorrelating volume (p < 0.001 for CTRL vs AD, p = 0.016 for CTRL vs MCI, p = 0.004 for conversion within 18 months), and the combination of texture and volume resulted in AUCs that were not significantly different from the texture AUCs. The prognostic texture AUC was significant after adjustment for baseline MMSE score (p = 0.018). Pearson correlations with baseline MMSE score were also reproduced (Table 3), and they increased compared with the ones obtained using ADNI data. The texture vs MMSE correlation remained significant when adjusted for volume (p = 0.028).
Relation to Subclinical Cognitive Decline
A central part of our study was to determine if MRI hippocampal texture was able to detect early cognitive decline in a clinically healthy population. The texture marker trained on ADNI and confirmed on AIBL was applied to score the Metropolit dataset, and the texture scores were Pearson correlated to two measures of global cognitive function, MMSE and Addenbrooke's cognitive examination (ACE). Note that the MRI biomarkers were not adjusted for age and sex because the Metropolit population contains only middle‐aged males. The correlation coefficients and p‐values are shown in Table 3, and the scatter plots for texture and volume vs ACE are shown in Figure 4. Texture maintained significant correlations when adjusted for volume (p = 0.017 and p < 0.001 for MMSE and ACE, respectively). The correlations with ACE persisted after removing the three potential outliers visible in Figure 4.
Figure 4.
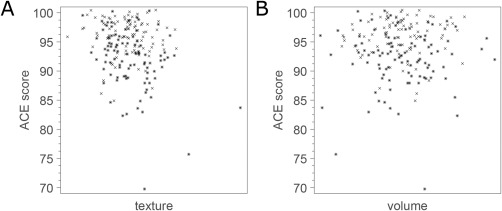
Scatter plots of MRI biomarkers vs ACE score in the Metropolit cohort. Crosses correspond to CTRL and asterisks correspond to CL. (A) Hippocampal texture. (B) Hippocampal volume. Note that uniform random noise in the range −0.5 to 0.5 was added to each ACE score for better visualization.
Relation to Hippocampal Metabolic Rate of Glucose
The final goal of this study was to investigate potential relation to the metabolic rate of glucose in the hippocampus using the ADNI FDG‐PET subset. The relation was visualized using scatter plots (Fig. 5), and the Pearson's correlation coefficients between age‐ and gender‐decorrelated MRI biomarkers and FDG‐PET uptake in the hippocampus were −0.57 (p < 0.001) and 0.54 (p < 0.001) for texture and volume, respectively. The combination of texture and volume achieved a correlation coefficient of −0.56 (p < 0.001). Texture maintained significant correlations when decorrelated with volume (p = 0.003).
Figure 5.
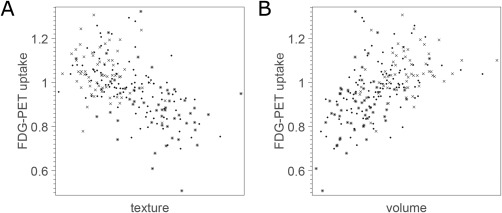
Scatter plots of MRI biomarkers vs metabolic rate of glucose in the hippocampus in FDG‐PET. Crosses correspond to CTRL, dots correspond to MCI, and asterisks correspond to AD. (A) Hippocampal texture. (B) Hippocampal volume.
DISCUSSION
In this study, we have proposed and extensively evaluated hippocampal texture as a new biomarker of AD with the goal of achieving early structural MRI‐based detection. The texture marker was evaluated using data from three different cohorts: ADNI, AIBL, and Metropolit.
The ADNI results demonstrated that hippocampal texture predicts MCI‐to‐AD conversion. We also saw that hippocampal texture achieved a higher but not significantly different AUC compared to hippocampal volume for prognosis of conversion from MCI to AD within 12 months. However, when extending the conversion time span to 24 months, the texture AUC was significantly higher. This is an interesting finding that supports our working hypothesis that texture may be sensitive to earlier stages of the disease process as illustrated in Figure 6 and in Supporting Information, Figure 3. When adjusting texture for volume using decorrelation, the AUC remained significant for the diagnostic and the prognostic tasks. These results support that texture to some degree captures different information than volume, and, thus, that texture‐ and atrophy‐based markers may complement each other. The complementarity was confirmed by the logistic regression model fitted to CTRL and AD in the ADNI cohort; both volume and texture contributed significantly in the model (Supporting Information, Table I). Although the combination of volume and texture using this model had a tendency of increasing the correlation with MMSE (Table 3), it did not in general result in improved diagnostic or prognostic AUCs. If this complementarity in information has its origin in our working hypothesis, as sketched in Supporting Information, Figure 3, needs further investigations to be established.
Figure 6.
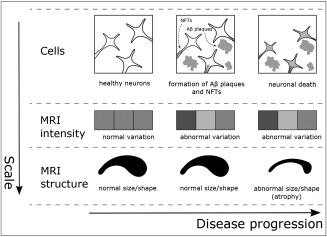
Schematic view of the proposed texture working hypothesis in AD. Top row: NFTs inside the neurons and Aβ plaques between neurons spread throughout the brain, causing neuronal death. Middle row: changes in the statistical properties of the image intensities due to the accumulated effect of NFTs and/or Aβ plaques may be reflected as certain textural patterns prior to atrophy. Bottom row: atrophy manifests as the shrinkage and possible morphological change of brain structures.
The clinical utility of biomarkers relate to their capability of also differentiating hitherto unseen data. We investigated generalizability by scoring the AIBL dataset using the proposed texture‐based biomarker trained solely on ADNI data and found that both the diagnostic and the prognostic capabilities were preserved. The increased AUCs for AIBL data compared with ADNI data might be explained by more homogeneous data in the AIBL imaging arm, which is effectively single site (all except one baseline MRI scan are from the same site), or by demographic differences. The ADNI‐trained marker was also applied to score the Metropolit dataset, a homogeneous population of healthy 58‐year‐old males, one‐half of which had established loss of cognitive performance. The marker correlated significantly with both MMSE and ACE in the cohort. In contrast, volume correlated with MMSE only, and the combination of volume and texture using the diagnostic logistic regression model resulted in loss of correlation with ACE. Because ACE is an extension of MMSE developed to be more sensitive to early stages of dementia, including AD [Mathuranath et al., 2000], these results emphasize texture's potential in early AD detection. We do not expect field strength differences among the cohorts to have affected these results. In a separate dataset that consisted of 61 pairs of 1.5T/3T ADNI MRI scans from 61 different subjects with each scan in a pair acquired at the same visit, we found a high association between texture computed in 1.5T and texture computed in 3T (Pearson correlation, r = 0.86, p < 0.001).
We found a significant negative correlation between hippocampal texture and FDG‐PET uptake in the hippocampus indicating that the structural changes measured as texture relate to a reduction of glucose metabolism and the function of the hippocampus. The correlation remained significant when decorrelating texture for volume. This confirms that some of the volume‐independent information texture captures in MRI is related to the underlying disease process. To gain further insight into the pathology underlying texture, the relation between hippocampal texture and other AD biomarkers remains to be investigated. For example, the relation with the following that together with FDG‐PET are the most widely studied non‐MRI biomarkers of AD pathology [Jack et al., 2010]: CSF Aβ1‐42 and PET Aβ imaging, which are biomarkers of Aβ plaque load; and CSF tau, which is an indicator of neurodegeneration. In addition, the analysis should be extended beyond the hippocampus since the AD disease process affects other parts of the brain as well, some of which are known to be affected earlier than the hippocampus.
Previous MRI texture studies in AD reported diagnostic (CTRL vs AD) classification accuracies (CAs) in the range 91.0–96.4% using relatively small, single‐site, single‐scanner datasets (14–40 subjects) [Freeborough and Fox, 1998; Liu et al., 2004; Zhang et al., 2011]. On the standardized ADNI dataset, which is much larger and from multiple sites, our method achieved a CTRL vs AD CA of 85.6% when using the operating point on the ROC curve closest to the ideal classifier. The highest previously reported CA of 96.4% [Zhang et al., 2011] was on a dataset with severely affected AD patients (MMSE 5.53 ± 4.47 compared to 23.2 ± 1.9 for the ADNI data we used). It should further be noted that our marker was optimized for AUC (i.e., the objective function in the SVM hyperparameter grid search was the CTRL vs AD AUC), not CA, which is the case for most methods. Results from machine learning have shown that optimizing for CA does not necessarily lead to a good AUC [Cortes and Mohri, 2004], and we expect the opposite to be the case as well.
The study most comparable to ours in terms of the data used (larger ADNI subset), the evaluation criterion (AUC), and the considered clinical problem (prognosis) is the one by Chincarini et al. [2011]. A CTRL vs AD diagnostic AUC performance of 0.93 and 0.92 were reported using age‐ and sex‐matched subjects from the ADNI database for ROIs covering the right and left hippocampus and surroundings, respectively. In comparison, our method achieved an age‐ and sex‐adjusted diagnostic AUC of 0.91. For the same two ROIs, Chincarini et al. [2011] reported MCI‐to‐AD conversion AUC performances after 24 months of 0.68 and 0.67. In comparison, our method achieved an age‐ and sex‐adjusted prognostic AUC of 0.74 (0.72 when using unadjusted texture) within the same time span. We also observe that Chincarini et al. [2011] report a Pearson correlation of 0.31 between their texture marker (when computed based on several ROIs covering several brain areas) and MMSE in the MCI subjects. In comparison, our age‐ and sex‐adjusted texture scores had a correlation of −0.30 (−0.32 when using unadjusted texture). Note that the sign difference is due to how labels are encoded in the respective classifiers. There are, however, still several important differences between our study and the work by Chincarini et al. The considered datasets are different subsets of the ADNI database, the methodology is different, and the considered ROI is different. Chincarini et al. [2011] use a data‐driven voxel subset from a box covering the hippocampus as well as part of the surrounding brain structures and ventricles as ROI, whereas we restricted the analysis to a segmentation of the hippocampus.
In our study, potential confounding factors were handled by subsequent statistical adjustment instead of, for example, conducting a matched design. It was observed that adjusting for age and sex using decorrelation did not deteriorate the texture‐based marker results. On the contrary, results improved in most cases.
This study is limited by the use of FreeSurfer hippocampus segmentations. To reduce this effect, we morphologically eroded the segmentations to obtain statistics only from the interior of the hippocampus and reduce effects from voxels close to a noisy segmentation boundary. However, the effect of using different segmentations, both from other automated methods and manual segmentations, should be investigated in future work.
In the FDG‐PET experiment, we used FDG‐PET scores from the Center for Brain Health, NYU School of Medicine, New York [Li et al., 2008; Mosconi et al., 2005] downloaded directly from the ADNI website. Consequently, the hippocampal segmentations we used to compute MRI texture did not correspond to the segmentations used in FDG‐PET. This could influence the obtained correlations. However, we do not expect a one‐to‐one correspondence in segmentations to change correlations dramatically from what we found because of the low resolution of the FDG‐PET scans relative to the resolution of the MRI scans in ADNI.
Imaging biomarkers have potential for use in clinical diagnosis and in clinical trials. Efforts are already in place to standardize MRI hippocampal volumetry [Frisoni and Jack, 2011; Jack et al., 2011a]. Despite the encouraging results presented here, the use of texture is much less widespread, and standardization lies far ahead. The most immediate potential application for texture is in clinical trials (e.g., for subject selection). Combining hippocampal volume with other biomarkers, such as CSF‐derived measurements, has shown increased diagnostic performance [Walhovd et al., 2010], and a conjunction of texture and other biomarkers is probably needed to achieve a combination marker that is sufficiently good to be considered for clinical use. In our experiments, we only observed insignificant AUC increases when MRI (texture and volume) and solely CSF were combined.
CONCLUSION
In conclusion, we found that hippocampal texture had a significantly higher differentiation between stable MCIs and MCI‐to‐AD converters within 24 months than hippocampal volumetry (AUC 0.74 vs 0.67; p = 0.005), the most widely studied structural MRI biomarker of AD [Jack et al., 2011a]. The prognostic texture results were confirmed by applying the biomarker to data from a different cohort, which revealed excellent generalization performance. Both texture and volume correlated with MMSE in a cohort of clinically healthy, middle‐aged males, one‐half of which had established loss of cognitive performance. In contrast, only texture correlated with ACE, a cognitive test designed to be sensitive to early stages of AD compared to MMSE. In addition, we found a significant correlation between texture and hippocampal FDG‐PET uptake. The texture statistics remained significant after decorrelating volume in all experiments, and the combination of texture and volume did not significantly improve diagnostic or prognostic AUCs compared to texture alone. These findings support the hypothesis that texture extracts different information than volume, and that it is more sensitive to early cognitive decline. Atrophy rate as measured by structural MRI is already accepted and used in AD clinical trials [Cummings and Zhong, 2014; Frisoni et al., 2010], and the role of MRI biomarkers in AD has become increasingly important with atrophy from structural MRI entering criteria for AD diagnosis [Dubois et al., 2010; Jack et al., 2011b]. It is evident that there are other sources of information to extract from structural MRI in addition to volume or atrophy, such as the hippocampal texture studied in this work, which may produce complementary imaging biomarkers of AD. This was exemplified by the variety of markers applied in a recent grand challenge in medical image analysis on differential diagnosis of CTRL, MCI, and AD using structural MRI [Bron et al., 2015].
Supporting information
Supporting Information Dataset 1
Supporting Information Dataset 2
Supporting Information Dataset 3
Supporting Information Figure 1
Supporting Information Figure 2
Supporting Information Figure 3
Supporting Information Table I
Supporting Information Text
ACKNOWLEDGMENTS
Lauge Sørensen is an employee at Biomediq A/S. Mads Nielsen is an employee at Biomediq A/S and a shareholder in Biomediq A/S. The remaining authors declare no conflicts of interest.
The Metropolit study has been funded by the Danish Heart Association, the Lundbeck Foundation, the Danish Pharmaceutical Fund, Else and Mogens Wedell‐Wedellsborgs Fund, and the Danish Health Insurance Funds. CAMB has been supported by a generous grant from the VELUX FOUNDATION. The funding bodies have not influenced the analysis of data or its interpretation. We thank all those who initiated and/or continued the Metropolit study: K Svalastoga, E Høgh, P Wolf, T Rishøj, G Strande‐Sørensen, E Manniche, B Holten, IA Weibull, and A Ortman. The authors also thank the staff at the Department of Public Health and the National Research Center for the Working Environment who undertook the data collection for the Copenhagen Aging and Midlife Biobank (CAMB). Further thanks to Helle Bruunsgaard, Nils‐Erik Fiehn, Åse Marie Hansen, Poul Holm‐Pedersen, and Rikke Lund who initiated and established the Copenhagen Aging and Midlife Biobank from 2009 to 2011 together with Kirsten Avlund, Erik Lykke Mortensen, and Merete Osler.
ADNI is funded by the National Institute on Aging, the National Institute of Biomedical Imaging and Bioengineering, and through generous contributions from the following: Alzheimer's Association; Alzheimer's Drug Discovery Foundation; BioClinica, Inc.; Biogen Idec, Inc.; Bristol‐Myers Squibb Company; Eisai Inc.; Elan Pharmaceuticals, Inc.; Eli Lilly and Company; F. Hoffmann‐La Roche Ltd and its affiliated company Genentech, Inc.; GE Healthcare; Innogenetics, N.V.; IXICO Ltd.; Janssen Alzheimer Immunotherapy Research & Development, LLC.; Johnson & Johnson Pharmaceutical Research & Development LLC.; Medpace, Inc.; Merck & Co., Inc.; Meso Scale Diagnostics, LLC.; NeuroRx Research; Novartis Pharmaceuticals Corporation; Pfizer Inc.; Piramal Imaging; Servier; Synarc Inc.; and Takeda Pharmaceutical Company. The Canadian Institutes of Health Research is providing funds to support ADNI clinical sites in Canada. Private sector contributions are facilitated by the Foundation for the National Institutes of Health. The grantee organization is the Northern California Institute for Research and Education, and the study is coordinated by the Alzheimer's Disease Cooperative Study at the University of California, San Diego. ADNI data are disseminated by the Laboratory for Neuro Imaging at the University of Southern California.
REFERENCES
- Achterberg HC, van der Lijn F, den Heijer T, Vernooij MW, Ikram MA, Niessen WJ, de Bruijne M (2014): Hippocampal shape is predictive for the development of dementia in a normal, elderly population. Hum Brain Mapp 35:2359–2371. [DOI] [PMC free article] [PubMed] [Google Scholar]
- Bobinski M, de Leon MJ, Wegiel J, Desanti S, Convit A, Saint Louis LA, Rusinek H, Wisniewski HM (2000): The histological validation of post mortem magnetic resonance imaging‐determined hippocampal volume in Alzheimer's disease. Neuroscience 95:721–725. [DOI] [PubMed] [Google Scholar]
- Bobinski M, Wegiel J, Wisniewski HM, Tarnawski M, Reisberg B, Mlodzik B, de Leon MJ, Miller DC (1995): Atrophy of hippocampal formation subdivisions correlates with stage and duration of Alzheimer disease. Dementia 6:205–210. [DOI] [PubMed] [Google Scholar]
- EE Bron, M Smits, WM van der Flier, H Vrenken, F Barkhof, P Scheltens, JM Papma, RM Steketee, C Mendez Orellana, R Meijboom, M Pinto, JR Meireles, C Garrett, AJ Bastos‐Leite, A Abdulkadir, O Ronneberger, N Amoroso, R Bellotti, D Cárdenas‐Peña, AM Álvarez‐Meza, CV Dolph, KM Iftekharuddin, SF Eskildsen, P Coupé, VS Fonov, K Franke, C Gaser, C Ledig, R Guerrero, T Tong, KR Gray, E Moradi, J Tohka, A Routier, S Durrleman, A Sarica, G Di Fatta, F Sensi, A Chincarini, GM Smith, ZV Stoyanov, L Sørensen, M Nielsen, S Tangaro, P Inglese, C Wachinger, M Reuter, JC van Swieten, WJ Niessen, S Klein, for The Alzheimer's Disease Neuroimaging Initiative (2015): Standardized evaluation of algorithms for computer‐aided diagnosis of dementia based on structural MRI: the CADDementia challenge. Neuroimage 111:562–579. [DOI] [PMC free article] [PubMed] [Google Scholar]
- Braak H, Braak E (1997): Frequency of stages of Alzheimer‐related lesions in different age categories. Neurobiol Aging 18:351–357. [DOI] [PubMed] [Google Scholar]
- Buckner RL, Head D, Parker J, Fotenos AF, Marcus D, Morris JC, Snyder AZ (2004): A unified approach for morphometric and functional data analysis in young, old, and demented adults using automated atlas‐based head size normalization: reliability and validation against manual measurement of total intracranial volume. Neuroimage 23:724–738. [DOI] [PubMed] [Google Scholar]
- Castellano G, Bonilha L, Li LM, Cendes F (2004): Texture analysis of medical images. Clin Radiol 59:1061–1069. [DOI] [PubMed] [Google Scholar]
- Chincarini A, Bosco P, Calvini P, Gemme G, Esposito M, Olivieri C, Rei L, Squarcia S, Rodriguez G, Bellotti R, and others. (2011): Local MRI analysis approach in the diagnosis of early and prodromal Alzheimer's disease. Neuroimage 58:469–480. [DOI] [PubMed] [Google Scholar]
- Convit A, De Leon MJ, Tarshish C, De Santi S, Tsui W, Rusinek H, George A (1997): Specific hippocampal volume reductions in individuals at risk for Alzheimer's disease. Neurobiol Aging 18:131–138. [DOI] [PubMed] [Google Scholar]
- Cortes C, Mohri M (2004): AUC optimization vs. error rate minimization. Nips 313–320. [Google Scholar]
- Cortes C, Vapnik V (1995): Support‐vector networks. Mach Learn 20:273–297. [Google Scholar]
- Costafreda SG, Dinov ID, Tu Z, Shi Y, Liu C‐Y, Kloszewska I, Mecocci P, Soininen H, Tsolaki M, Vellas B, et al. (2011): Automated hippocampal shape analysis predicts the onset of dementia in mild cognitive impairment. Neuroimage 56:212–219. [DOI] [PMC free article] [PubMed] [Google Scholar]
- Cummings J, Zhong K (2014): Biomarker‐driven therapeutic management of Alzheimer's disease: establishing the foundations. Clin Pharmacol Ther 95:67–77. [DOI] [PubMed] [Google Scholar]
- DeLong ER, DeLong DM, Clarke‐Pearson DL (1988): Comparing the areas under two or more correlated receiver operating characteristic curves: a nonparametric approach. Biometrics 44:837–845. [PubMed] [Google Scholar]
- Devanand DP, Pradhaban G, Liu X, Khandji A, De Santi S, Segal S, Rusinek H, Pelton GH, Honig LS, Mayeux R, et al. (2007): Hippocampal and entorhinal atrophy in mild cognitive impairment: prediction of Alzheimer disease. Neurology 68:828–836. [DOI] [PubMed] [Google Scholar]
- Dubois B, Feldman HH, Jacova C, Cummings JL, Dekosky ST, Barberger‐Gateau P, Delacourte A, Frisoni G, Fox NC, Galasko D, et al. (2010): Revising the definition of Alzheimer's disease: a new lexicon. Lancet Neurol 9:1118–1127. [DOI] [PubMed] [Google Scholar]
- Ellis KA, Bush AI, Darby D, De Fazio D, Foster J, Hudson P, Lautenschlager NT, Lenzo N, Martins RN, Maruff P, et al. (2009): The Australian Imaging, Biomarkers and Lifestyle (AIBL) study of aging: methodology and baseline characteristics of 1112 individuals recruited for a longitudinal study of Alzheimer's disease. Int Psychogeriatr 21:672–687. [DOI] [PubMed] [Google Scholar]
- Ellis KA, Rowe CC, Villemagne VL, Martins RN, Masters CL, Salvado O, Szoeke C, Ames D, Group A (2010): Addressing population aging and Alzheimer's disease through the Australian imaging biomarkers and lifestyle study: collaboration with the Alzheimer's Disease Neuroimaging Initiative. Alzheimers Dement 6:291–296. [DOI] [PubMed] [Google Scholar]
- Fischl B, Salat DH, Busa E, Albert M, Dieterich M, Haselgrove C, van der Kouwe A, Killiany R, Kennedy D, Klaveness S, et al. (2002): Whole brain segmentation: automated labeling of neuroanatomical structures in the human brain. Neuron 33:341–355. [DOI] [PubMed] [Google Scholar]
- Fox NC, Freeborough PA (1997): Brain atrophy progression measured from registered serial MRI: validation and application to Alzheimer's disease. J Magn Reson Imaging 7:1069–1075. [DOI] [PubMed] [Google Scholar]
- Freeborough PA, Fox NC (1998): MR image texture analysis applied to the diagnosis and tracking of Alzheimer's disease. IEEE Trans Med Imaging 17:475–479. [DOI] [PubMed] [Google Scholar]
- Frisoni GB, Fox NC, Jack J, Clifford R, Scheltens P, Thompson PM (2010): The clinical use of structural MRI in Alzheimer disease. Nat Rev Neurol 6:67–77. [DOI] [PMC free article] [PubMed] [Google Scholar]
- Frisoni GB, Jack CR (2011): Harmonization of magnetic resonance‐based manual hippocampal segmentation: a mandatory step for wide clinical use. Alzheimers Dement 7:171–174. [DOI] [PubMed] [Google Scholar]
- Gerardin E, Chételat G, Chupin M, Cuingnet R, Desgranges B, Kim H‐S, Niethammer M, Dubois B, Lehéricy S, Garnero L, et al. (2009): Multidimensional classification of hippocampal shape features discriminates Alzheimer's disease and mild cognitive impairment from normal aging. Neuroimage 47:1476–1486. [DOI] [PMC free article] [PubMed] [Google Scholar]
- Hansen NL, Lauritzen M, Mortensen EL, Osler M, Avlund K, Fagerlund B, Rostrup E (2014): Subclinical cognitive decline in middle‐age is associated with reduced task‐induced deactivation of the brain's default mode network. Hum Brain Mapp 35:4488–4498. [DOI] [PMC free article] [PubMed] [Google Scholar]
- Henneman WJP, Sluimer JD, Barnes J, van der Flier WM, Sluimer IC, Fox NC, Scheltens P, Vrenken H, Barkhof F (2009): Hippocampal atrophy rates in Alzheimer disease: added value over whole brain volume measures. Neurology 72:999–1007. [DOI] [PMC free article] [PubMed] [Google Scholar]
- Igel C, Heidrich‐Meisner V, Glasmachers T (2008): Shark. J Mach Learn Res 9:993–996. [Google Scholar]
- Jack CRJ, Barkhof F, Bernstein MA, Cantillon M, Cole PE, Decarli C, Dubois B, Duchesne S, Fox NC, Frisoni GB, et al. (2011a): Steps to standardization and validation of hippocampal volumetry as a biomarker in clinical trials and diagnostic criterion for Alzheimer's disease. Alzheimers Dement 7:474–485 e4. [DOI] [PMC free article] [PubMed] [Google Scholar]
- Jack J, Clifford R, Albert MS, Knopman DS, McKhann GM, Sperling RA, Carrillo MC, Thies B, Phelps CH (2011b): Introduction to the recommendations from the National Institute on Aging‐Alzheimer's Association workgroups on diagnostic guidelines for Alzheimer's disease. Alzheimers Dement 7:257–262. [DOI] [PMC free article] [PubMed] [Google Scholar]
- Jack J, Clifford R, Bernstein MA, Fox NC, Thompson P, Alexander G, Harvey D, Borowski B, Britson PJL, Whitwell J, Ward C, et al. (2008): The Alzheimer's Disease Neuroimaging Initiative (ADNI): MRI methods. J Magn Reson Imaging 27:685–691. [DOI] [PMC free article] [PubMed] [Google Scholar]
- Jack J, Clifford R, Knopman DS, Jagust WJ, Shaw LM, Aisen PS, Weiner MW, Petersen RC, Trojanowski JQ (2010): Hypothetical model of dynamic biomarkers of the Alzheimer's pathological cascade. Lancet Neurol 9:119–128. [DOI] [PMC free article] [PubMed] [Google Scholar]
- Jack J, Clifford R, Petersen RC, Xu YC, O'Brien PC, Smith GE, Ivnik RJ, Boeve BF, Waring SC, Tangalos EG, Kokmen E (1999): Prediction of AD with MRI‐based hippocampal volume in mild cognitive impairment. Neurology 52:1397–1403. [DOI] [PMC free article] [PubMed] [Google Scholar]
- Jack J, Clifford R, Shiung MM, Weigand SD, O'Brien PC, Gunter JL, Boeve BF, Knopman DS, Smith GE, Ivnik RJ, Tangalos EG, et al. (2005): Brain atrophy rates predict subsequent clinical conversion in normal elderly and amnestic MCI. Neurology 65:1227–1231. [DOI] [PMC free article] [PubMed] [Google Scholar]
- Li Y, Rinne JO, Mosconi L, Pirraglia E, Rusinek H, DeSanti S, Kemppainen N, Nagren K, Kim BC, Tsui W, and others. (2008): Regional analysis of FDG and PIB‐PET images in normal aging, mild cognitive impairment, and Alzheimer's disease. Eur J Nucl Med Mol Imaging 35:2169–2181. [DOI] [PMC free article] [PubMed] [Google Scholar]
- Lindeberg T. 2009. Scale Space. Encyclopedia of Computer Science and Engineering. John Wiley and Sons; p 2495–2504. [Google Scholar]
- Liu Y, Teverovskiy L, Carmichael OT, Kikinis R, Shenton ME, Carter CS, Stenger VA, Davis SW, Aizenstein H, Becker JT, and others. (2004): Discriminative MR image feature analysis for automatic Schizophrenia and Alzheimer's disease classification. Miccai 3216:393–401. [Google Scholar]
- Marques J, Genant HK, Lillholm M, Dam EB (2012): Diagnosis of osteoarthritis and prognosis of tibial cartilage loss by quantification of tibia trabecular bone from MRI. Magn Reson Med 42:735–742. [DOI] [PubMed] [Google Scholar]
- Mathuranath PS, Nestor PJ, Berrios GE, Rakowicz W, Hodges JR (2000): A brief cognitive test battery to differentiate Alzheimer's disease and frontotemporal dementia. Neurology 55:1613–1620. [DOI] [PubMed] [Google Scholar]
- Mosconi L, Tsui WH, De Santi S, Li J, Rusinek H, Convit A, Li Y, Boppana M, de Leon MJ (2005): Reduced hippocampal metabolism in MCI and AD: automated FDG‐PET image analysis. Neurology 64:1860–1867. [DOI] [PubMed] [Google Scholar]
- Nielsen M, Karemore G, Loog M, Raundahl J, Karssemeijer N, Otten JDM, Karsdal MA, Vachon CM, Christiansen C (2011): A novel and automatic mammographic texture resemblance marker is an independent risk factor for breast cancer. Cancer Epidemiol 35:381–387. [DOI] [PubMed] [Google Scholar]
- Nyúl LG, Udupa JK (1999): On standardizing the MR image intensity scale. Magn Reson Med 42:1072–1081. [DOI] [PubMed] [Google Scholar]
- Osler M, Avlund K, Mortensen EL (2013): Socio‐economic position early in life, cognitive development and cognitive change from young adulthood to middle age. Eur J Public Health 23:974–980. [DOI] [PubMed] [Google Scholar]
- Osler M, Lund R, Kriegbaum M, Christensen U, Andersen AM (2006): Cohort profile: the Metropolit 1953 Danish male birth cohort. Int J Epidemiol 35:541–545. [DOI] [PubMed] [Google Scholar]
- Ramani A, Jensen JH, Helpern JA (2006): Quantitative MR imaging in Alzheimer disease. Radiology 241:26–44. [DOI] [PubMed] [Google Scholar]
- Sanfilipo MP, Benedict RHB, Zivadinov R, Bakshi R (2004): Correction for intracranial volume in analysis of whole brain atrophy in multiple sclerosis: the proportion vs. residual method. Neuroimage 22:1732–1743. [DOI] [PubMed] [Google Scholar]
- Shaw LM, Vanderstichele H, Knapik‐Czajka M, Clark CM, Aisen PS, Petersen RC, Blennow K, Soares H, Simon A, Lewczuk P, et al. (2009): Cerebrospinal fluid biomarker signature in Alzheimer's disease neuroimaging initiative subjects. Ann Neurol 65:403–413. [DOI] [PMC free article] [PubMed] [Google Scholar]
- Sled JG, Zijdenbos AP, Evans AC (1998): A nonparametric method for automatic correction of intensity nonuniformity in MRI data. IEEE Trans Med Imaging 17:87–97. [DOI] [PubMed] [Google Scholar]
- Sørensen L, Nielsen M, Lo P, Ashraf H, Pedersen JH, de Bruijne M (2012): Texture‐based analysis of COPD: A data‐driven approach. IEEE Trans Med Imaging 31:70–78. [DOI] [PubMed] [Google Scholar]
- Tanabe JL, Amend D, Schuff N, DiSclafani V, Ezekiel F, Norman D, Fein G, Weiner MW (1997): Tissue segmentation of the brain in Alzheimer disease. AJNR Am J Neuroradiol 18:115–123. [PMC free article] [PubMed] [Google Scholar]
- Tuceryan M, Jain AK. 1998. Texture analysis In: Chen CH, Pau LF, Wang PSP, editors. The Handbook of Pattern Recognition and Computer Vision (2nd Edition): World Scientific Publishing; p 207–248. [Google Scholar]
- van Ginneken B, Katsuragawa S, ter Haar Romeny BM, Doi K, Viergever MA (2002): Automatic detection of abnormalities in chest radiographs using local texture analysis. IEEE Trans Med Imaging 21:139–149. [DOI] [PubMed] [Google Scholar]
- Vemuri P, Wiste HJ, Weigand SD, Shaw LM, Trojanowski JQ, Weiner MW, Knopman DS, Petersen RC, Jack CR, Alzheimer's Disease Neuroimaging I (2009): MRI and CSF biomarkers in normal, MCI, and AD subjects: diagnostic discrimination and cognitive correlations. Neurology 73:287–293. [DOI] [PMC free article] [PubMed] [Google Scholar]
- Walhovd KB, Fjell AM, Brewer J, McEvoy LK, Fennema‐Notestine C, Hagler DJ,J, Jennings RG, Karow D, Dale A, Alzheimer's Disease Neuroimaging I (2010): Combining MR imaging, positron‐emission tomography, and CSF biomarkers in the diagnosis and prognosis of Alzheimer disease. AJNR Am J Neuroradiol 31:347–354. [DOI] [PMC free article] [PubMed] [Google Scholar]
- West MJ, Coleman PD, Flood DG, Troncoso JC (1994): Differences in the pattern of hippocampal neuronal loss in normal ageing and Alzheimer's disease. Lancet 344:769–772. [DOI] [PubMed] [Google Scholar]
- Wyman BT, Harvey DJ, Crawford K, Bernstein MA, Carmichael O, Cole PE, Crane PK, Decarli C, Fox NC, Gunter JL, et al. (2013): Standardization of analysis sets for reporting results from ADNI MRI data. Alzheimers Dement 9:332–337. [DOI] [PMC free article] [PubMed] [Google Scholar]
- Zhang J, Tong L, Wang L, Li N (2008): Texture analysis of multiple sclerosis: a comparative study. Magn Reson Imaging 26:1160–1166. [DOI] [PubMed] [Google Scholar]
- Zhang J, Yu C, Jiang G, Liu W, Tong L (2011): 3D texture analysis on MRI images of Alzheimer's disease. Brain Imaging Behav 6:61–69. [DOI] [PubMed] [Google Scholar]
Associated Data
This section collects any data citations, data availability statements, or supplementary materials included in this article.
Supplementary Materials
Supporting Information Dataset 1
Supporting Information Dataset 2
Supporting Information Dataset 3
Supporting Information Figure 1
Supporting Information Figure 2
Supporting Information Figure 3
Supporting Information Table I
Supporting Information Text